australia: health system review
TRANSCRIPT

Vol. 8 No. 5 2006
on Health Systems and Policies
European
Judith Healy • Evelyn Sharman Buddhima Lokuge
Editor: Judith Healy
Health Systems in Transition
AustraliaHealth system review

The European Observatory on Health Systems and Policies is a partnership between the World Health Organization Regional Office for Europe, the Governments of Belgium, Finland, Greece, Norway, Slovenia, Spain and Sweden, the Veneto Region of Italy, the European Investment Bank, the Open Society Institute, the World Bank, CRP-Santé Luxembourg, the London School of Economics and Political Science, and the London School of Hygiene & Tropical Medicine.
2006
Health Systems in Transition
Written byJudith Healy, Australian National University
Evelyn Sharman, Australian Government Department of Health and Ageing
Buddhima Lokuge, Australian National University
Edited byJudith Healy, Australian National University
Australia:Health System Review

© World Health Organization 2006, on behalf of the European Observatory on Health Systems and PoliciesAll rights reserved. The European Observatory on Health Systems and Policies welcomes requests for permission to reproduce or translate its publications, in part or in full.
Please address requests about this to:
Publications WHO Regional Office for Europe Scherfigsvej 8 DK-2100 Copenhagen Ø, Denmark
Alternatively, complete an online request form for documentation, health information, or for permission to quote or translate, on the WHO/Europe web site at http://www.euro.who.int/PubRequest
The views expressed by authors or editors do not necessarily represent the decisions or the stated policies of the European Observatory on Health Systems and Policies or any of its partners.
The designations employed and the presentation of the material in this publication do not imply the expression of any opinion whatsoever on the part of the European Observatory on Health Systems and Policies or any of its partners concerning the legal status of any country, territory, city or area or of its authorities, or concerning the delimitation of its frontiers or boundaries. Where the designation “country or area” appears in the headings of tables, it covers countries, territories, cities, or areas. Dotted lines on maps represent approximate border lines for which there may not yet be full agreement.
The mention of specific companies or of certain manufacturers’ products does not imply that they are endorsed or recommended by the European Observatory on Health Systems and Policies in preference to others of a similar nature that are not mentioned. Errors and omissions excepted, the names of proprietary products are distinguished by initial capital letters.
The European Observatory on Health Systems and Policies does not warrant that the information contained in this publication is complete and correct and shall not be liable for any damages incurred as a result of its use.
Keywords:DELIVERY OF HEALTH CARE
EVALUATION STUDIES
FINANCING, HEALTH
HEALTH CARE REFORM
HEALTH SYSTEM PLANS – organization and administration
AUSTRALIA
ISSN 1817-6127 Vol. 8 No. 5
Suggested citation:Healy J, Sharman E, Lokuge B. Australia: Health system review. Health Systems in Transition 2006; 8(5): 1–158.
Printed and bound in the United Kingdom by TJ International, Padstow, Cornwall.

iii
AustraliaHealth systems in transition
Contents
Preface ........................................................................................................ vAcknowledgements ......................................................................................viiList of abbreviations...................................................................................... ixList of tables and figures ...............................................................................xiAbstract .....................................................................................................xiiiExecutive summary ...................................................................................... xv1 Introduction .............................................................................................. 1 1.1 Overview of the health system ........................................................ 1 1.2 Geography and sociodemography .................................................. 1 1.3 Economic context ........................................................................... 6 1.4 Political context .............................................................................. 8 1.5 Health status ................................................................................. 14 1.6 Aboriginal and Torres Strait Islander health status ....................... 212 Organizational structure ......................................................................... 23 2.1 Historical background ................................................................... 23 2.2 Organizational overview ............................................................... 25 2.3 Decentralization and centralization .............................................. 36 2.4 Population coverage ...................................................................... 37 2.5 Entitlements, benefits and patient empowerment ......................... 373 Planning and regulation .......................................................................... 43 3.1 Regulation ..................................................................................... 43 3.2 Planning and health information management ............................. 514 Financing ................................................................................................ 57 4.1 Revenue mobilization ................................................................... 57 4.2 Allocation of funds ....................................................................... 60 4.3 Purchaser and provider relations .................................................. 63 4.4 Payment mechanisms .................................................................... 63 4.5 Health care expenditure ................................................................ 66
iv
Health systems in transition Australia
5 Physical and human resources ................................................................ 73 5.1 Physical resources ......................................................................... 73 5.2 Human resources .......................................................................... 806 Provision of services ............................................................................... 89 6.1 Public health ................................................................................. 89 6.2 Patient pathways ........................................................................... 94 6.3 Primary/ambulatory care .............................................................. 95 6.4 Secondary/inpatient care ............................................................... 99 6.5 Pharmaceutical care .................................................................... 100 6.6 Rehabilitation/intermediate care ................................................. 105 6.7 Long-term care ........................................................................... 105 6.8 Services for informal carers ........................................................ 108 6.9 Palliative care .............................................................................. 109 6.10 Mental health care ...................................................................... 109 6.11 Dental health care ....................................................................... 110 6.12 Alternative/complementary medicine ......................................... 111 6.13 Health care for specific populations ........................................... 1127 Principal health care reforms ................................................................ 115 7.1 Analysis of recent reforms .......................................................... 116 7.2 Future developments ................................................................... 121 8 Assessment of the health system .......................................................... 127 8.1 The stated objectives of the health system .................................. 127 8.2 Distribution of the health system’s costs and benefits across the population .................................................................. 128 8.3 Efficiency of the Australian health system ................................. 129 8.4 Accountability of payers and providers ...................................... 131 8.5 Contribution of the health system to health improvement .......... 1329 Conclusions .......................................................................................... 13510 Appendices ........................................................................................... 139 10.1 References .................................................................................. 139 10.2 Useful web sites .......................................................................... 152 10.3 HiT methodology......................................................................... 153

v
AustraliaHealth systems in transition
Preface
The Health Systems in Transition profiles are country-based reports that provide a detailed description of a health system and of reform and policy initiatives in progress or under development in a specific country. Each
profile is produced by country experts in collaboration with the Observatory’s research directors and staff. In order to facilitate comparisons between countries, the profiles are based on a template, which is revised periodically. The template provides detailed guidelines and specific questions, definitions and examples needed to compile a profile.
Health Systems in Transition profiles seek to provide relevant information to support policy-makers and analysts in the development of health systems in Europe. They are building blocks that can be used:
to learn in detail about different approaches to the organization, financing and delivery of health services and the role of the main actors in health systems;
to describe the institutional framework, the process, content and implementation of health care reform programmes;
to highlight challenges and areas that require more in-depth analysis;
to provide a tool for the dissemination of information on health systems and the exchange of experiences of reform strategies between policy-makers and analysts in different countries.
Compiling the profiles poses a number of methodological problems. In many countries, there is relatively little information available on the health system and the impact of reforms. Due to the lack of a uniform data source, quantitative data on health services are based on a number of different sources, including the WHO European Health for All database, national statistical offices, Eurostat, the Organisation for Economic Co-operation and Development (OECD) Health
•
•
•
•

vi
Health systems in transition Australia
Data, the International Monetary Fund (IMF), the World Bank, and any other relevant sources considered useful by the authors. Data collection methods and definitions sometimes vary, but typically are consistent within each separate series.
A standardized profile has certain disadvantages because the financing and delivery of health care differs across countries. However, it also offers advantages, because it raises similar issues and questions. The Health Systems in Transition profiles can be used to inform policy-makers about experiences in other countries that may be relevant to their own national situation. They can also be used to inform comparative analysis of health systems. This series is an ongoing initiative and material is updated at regular intervals. Comments and suggestions for the further development and improvement of the Health Systems in Transition series are most welcome and can be sent to [email protected].
Health Systems in Transition profiles and Health Systems in Transition summaries are available on the Observatory’s web site at www.euro.who.int/observatory. A glossary of terms used in the profiles can be found at the following web site: www.euro.who.int/observatory/Glossary/Toppage.
vii
AustraliaHealth systems in transition
Acknowledgements
The Health Systems in Transition (HiT) profile on Australia was written by Judith Healy (Regulatory Institutions Network, Australian National University), Evelyn Sharman (Australian Government Department of
Health and Ageing), and Buddhima Lokuge (Regulatory Institutions Network, Australian National University). We are grateful for the assistance of several staff in the Australian Government Department of Health and Ageing, namely, Bob Eckhardt, Lyle Dunne, Nicola Fookes, Rebecca de Boer, Wayne Pash, and Phil Shannon.
This report is an updated and largely rewritten version of the 2001 report by Melissa Hilless and Judith Healy.
We also wish to thank the following reviewers of the report for their factual corrections and constructive comments: Professor Stephanie Short, Griffith University; Mr Philip Davies, Deputy Secretary, Australian Government Department of Health and Ageing; Mr John Goss, Australian Institute of Health and Welfare, and Dr Paul Dugdale, Chief Health Officer of the Australian Capital Territory.
The current series of Health Systems in Transition profiles has been prepared by the research directors and staff of the European Observatory on Health Systems and Policies. The Observatory represents a partnership between the WHO Regional Office for Europe, the governments of Belgium, Finland, Greece, Norway, Slovenia, Spain and Sweden, the Veneto Region of Italy, the European Investment Bank, the Open Society Institute, the World Bank, CRP-Santé Luxembourg, the London School of Economics and Political Science and the London School of Hygiene & Tropical Medicine.

viii
Health systems in transition Australia
The Observatory team working on the Health Systems in Transition profiles is led by Josep Figueras, Director, and Elias Mossialos, Co-Director, and by Reinhard Busse, Martin McKee and Richard Saltman, Heads of the Research Hubs. Technical coordination is led by Susanne Grosse-Tebbe.
Giovanna Ceroni managed the production and copy-editing, with help from Nicole Satterley and with the support of Shirley and Johannes Frederiksen (layout). Administrative support for preparing the Health Systems in Transition profile on Australia was undertaken by Pieter Herroelen.
Special thanks are extended to the European Health for All database, from which data on health services were extracted; to the OECD for the data on health services in western Europe; and to the World Bank for the data on health expenditure in central and eastern European countries. Thanks are also due to national statistical offices that have provided data.
The HiT reflects data and information available in the summer of 2006.

ix
AustraliaHealth systems in transition
List of abbreviations
ABS Australian Bureau of Statistics
ACSAA Aged Care Standards and Accreditation Agency Limited
ACT Australian Capital Territory
AGPT Australian General Practice Training
AHMAC Australian Health Ministers’ Advisory Council
AHMC Australian Health Ministers’ Conference
AIHW Australian Institute of Health and Welfare
AIMS Advanced Incident Management System
ALOS Average length of stay
ALP Australian Labor Party
AMA Australian Medical Association
AMWAC Australian Medical Workforce Advisory Committee
ANF Australian Nursing Federation
APEC Asia–Pacific Economic Cooperation
ARC Australian Research Council
AR-DRGs Australian refined diagnosis-related groups
AusAID Australian Agency for International Development
BEACH Bettering the Evaluation and Care of Health surveys
BSE Bovine spongiform encephalopathy
COAG Council of Australian Governments
DALYs Disability-adjusted life years
DMFT Decayed, missing or filled teeth
EPC Enhanced primary care scheme
FaCSIA Department of Families, Community Services and Indigenous Affairs
GATS General Agreement on Trade in Services
GDP Gross domestic product
GP General practitioner
GPTE General Practice Education and Training Limited
GST Goods and services tax

x
Health systems in transition Australia
HACC Home and Community Care Program
HALE Health-adjusted life expectancy
HiB Haemophilus influenzae type b
HIV/AIDS Human immunodeficiency virus/acquired immune deficiency syndrome
HTA Health technology assessment
IPV Inactivated polio vaccine
ISO International Standards Organisation
MBS Medicare Benefits Schedule
MRI Magnetic resonance imaging
MSAC Medical Services Advisory Committee
NATA National Association of Testing Authorities
NEHTA National E Health Transition Authority
NHMRC National Health and Medical Research Council
NT Northern Territory
NZ New Zealand
OECD Organisation for Economic Co-operation and Development
PBAC Pharmaceutical Benefits Advisory Committee
PBPA Pharmaceutical Benefits Pricing Authority
PBS Pharmaceutical Benefits Scheme
PET Positron emission tomography
PHIAC Private Health Insurance Administration Council
PIP Practice Incentives Program
PPP Purchasing power parityRPBS Repatriation Pharmaceuticals Benefits Scheme
SA South Australia
SARS Severe acute respiratory syndrome
TB Tuberculosis
TGA Therapeutic Goods Administration
TRIPS Trade-related aspects of intellectual property rights
UK United Kingdom
WA Western Australia
WHO World Health Organization
WTO World Trade Organization
YLL Years of life lost
xi
AustraliaHealth systems in transition
List of tables and figures
Tables
Table 1.1 Demographic indicators, 1960–2003 2
Table 1.2 Economic indicators, 1980–2004 8
Table 1.3 Mortality and health indicators, 1970–2004 15
Table 1.4 Main causes of death (ICD 10 Classification), 2003 16
Table 1.5 Health-adjusted life expectancy (HALE), 2002 17
Table 1.6 Attributable burden of risk factors 18
Table 4.1 Main sources of health funding as a proportion of total health expenditure, current prices, 1995–2004
58
Table 4.2 Trends in health care expenditure, 1970–2002 67
Table 4.3 Government and non-government expenditure as a proportion of total health services expenditure, 1995–2003 (%)
69
Table 4.4 Health care expenditure by category (as percentage of total expenditure on health care), 1980–2002
71
Table 5.1 Mix of beds in acute care hospitals, psychiatric hospitals and long-term institutions, 1980–2002 (per 1000 population)
76
Table 5.2 Available beds per 1000 population, States and Territories, 2001–2002 76
Table 5.3 Health care personnel (headcount) per 1000 inhabitants, 1980–2003 82
Table 5.4 Australian citizens/residents completing health-related higher education courses, 1996 and 2001
86
Table 6.1 Inpatient utilization and performance in acute hospitals in Australia and western Europe, 2004 or latest available year
101

xii
Health systems in transition Australia
Figures
Fig. 1.1 Map of Australia 3
Fig. 2.1 Organizational chart of the health system 26
Fig. 4.1 Financing flowchart 61
Fig. 4.2 Health care expenditure as a share of GDP (%) in Australia and selected OECD countries
68
Fig. 4.3 Trends in health care expenditure as a share of GDP (%) in Australia and selected other countries, 1990–2004
69
Fig. 4.4 Health care expenditure in US$ PPP per capita in Australia and selected OECD countries, latest available year
70
Fig. 5.1 Beds in acute hospitals per 1000 population in Australia and selected other countries, 1990–2004
75
Fig. 5.2 Active doctors per 1000 inhabitants in Australia and selected OECD countries, 1990–2004
82
Fig. 5.3 Number of doctors and nurses per 1000 inhabitants in Australia and western Europe, 2004 or latest available year
83
Fig. 6.1 Levels of immunization for measles in Australia and western Europe, 2004
91
xiii
AustraliaHealth systems in transition
The Health Systems in Transition (HiT) profiles are country-based reports that provide a detailed description of a health system and of policy initiatives in progress or under development. HiTs examine different
approaches to the organization, financing and delivery of health services and the role of the main actors in health systems; describe the institutional framework, process, content and implementation of health and health care policies; and highlight challenges and areas that require more in-depth analysis.
Australia is a prosperous country with GDP per capita near the OECD average and with a culturally diverse population of 20 million. The population generally enjoys good health and increasing life expectancy, currently at 80 years. Most Australians have access to comprehensive health care of a high standard, financed mainly through general taxation. Fiscal and functional responsibilities for health care are divided between the Australian Government and six States and two Territories, and between public and private providers, so that the ability of any one actor to plan or regulate is limited. Equity is maintained in that health care is funded primarily by progressive taxation, but several disparities have arisen, including increased out-of-pocket payments, differential access to dental care, and concerns that increased private health insurance will encourage a two-tier health system. Efficiency can be improved given duplicated governance and despite gains in microeconomic reforms. Quality is receiving more attention, despite limited monitoring of clinical outcomes. Some endemic problems have eluded solutions: whether rising health expenditure is sustainable, tensions between levels of government, long waiting lists for elective surgery, disparities in urban and rural service access, and the continuing poor health status of Indigenous Australians. Major reforms will depend upon the ideological preferences of governments and their political will to achieve change in a complex health system.
Abstract


xv
AustraliaHealth systems in transition
Executive summary
Australians have among the highest life expectancy in the world, and most have ready access to comprehensive health care of a high standard. The primarily tax-funded health system achieves reasonably cost-effective
health care and good health outcomes and generally enjoys public support. Despite these considerable achievements, some endemic problems so far have eluded solutions: whether rising health expenditures are sustainable, tensions between levels of government, long waiting lists for elective surgery, disparities in urban and rural service access, and the continuing very poor health status of Indigenous Australians.
Australia has a federal form of government with fiscal and functional responsibilities divided between the Australian Government and the six States and two Territories (hereafter referred to as “States”). Australia is a generally prosperous country with gross domestic product (GDP) per capita close to the Organisation for Economic Co-operation and Development (OECD) average. The population reached 20 million in 2004, is highly urbanized, with 66% living in cities and large towns, and is culturally diverse, since migration has been a key factor in population growth with almost one quarter of the population born overseas. The Australian population is also ageing with 12.8% now aged 65 years and over. Life expectancy is 78 years for men and 83 years for women, and the population in general enjoys good health with increasing life expectancy and a low incidence of life-threatening disease. The burden of disease (premature mortality in terms of years of life lost) is mostly attributed to chronic conditions, such as cardiovascular disease and cancers. Indigenous Australians (about 2.4% of the population), however, have much poorer health than other Australians, with a higher burden of both infectious and non-infectious disease, including high rates of diabetes.

xvi
Health systems in transition Australia
Australia has a mainly publicly funded health system financed through general taxation and a small compulsory tax-based health insurance levy. Medicare, the tax-funded national health insurance scheme, offers patients subsidized access to their doctor of choice for out-of-hospital care, free public hospital care and subsidized pharmaceuticals. About 68% of total health expenditure comes from public sources, with the Australian Government financing 46% and the States 22%; the remaining 32% comes from private sources. In the late 1990s, the Australian Government introduced several measures to halt falling membership in voluntary private health insurance schemes, and as a consequence coverage has risen from one third to 43% of the population. Out-of-pocket payments by patients have risen, however, to 20% of total health expenditure. The main consumer payments are for pharmaceuticals not covered by government subsidies and for pharmaceutical co-payments, dental treatment, the gap between the Medicare benefit and fees charged by doctors, and payments to other health professionals. Health care remains largely free to the user, however, and its use is largely unlimited, with little public debate so far over health care funding priorities.
Australia spends 9.7% of GDP on health, and expenditure per capita in terms of purchasing power parity (PPP) was US$ 3652, which puts Australia slightly above the OECD average. Expenditure is expected to rise further with growing demand by the public, who have high expectations of health care goods and services, with increasing costs of high-technology medicine, and with the increasing need for health care for a rapidly ageing population.
Australia has a complex health system, with both public and private funders and providers. Given the division of powers within the federal form of government and the many stakeholders, the ability of any one actor to plan or regulate is limited. Governments have considerable leverage, however, in that they provide the largest share of funds. The Australian Government has a national role in health policy-making and possesses the “power of the purse”, but funds, rather than provides, health services. It funds and administers the Medicare scheme that subsidizes ambulatory medical services, and the Pharmaceutical Benefits Scheme that subsidizes essential drugs, and through the Australian Health Care Agreements contributes funds to the States to run public hospitals. The Department of Health and Ageing engages in national health policy-making, funds health care and is concerned with population health, and with research and monitoring on population health and health system activities.
The States are essentially autonomous in administering health services, subject to intergovernmental agreements, and thus vary somewhat in policies, administrative structures, per-capita expenditure, resource distribution and service utilization rates. State health departments administer public hospitals

xvii
AustraliaHealth systems in transition
and other services, such as mental health services, school dental services, family health services, health promotion and rehabilitation services. Local governments (over 850 municipal or shire councils) are responsible for some environmental health services and public health programmes but play no role in clinical services. The large private sector includes the majority of doctors (e.g. general practitioners and specialists), numerous private hospitals and day hospitals, a large diagnostic services industry and several private health insurance funds.
The health care workforce (about 570 000 persons) comprises nearly 6% of the total workforce. With shortages of some key health professionals, including doctors and nurses, the current policy is to increase the number of university and training places. General practitioners (GPs) (about 60% of active medical practitioners) provide the bulk of medical care and are mostly self-employed, although their fee-for-service income through Medicare has shifted from the private to the public purse. GPs are the first point of medical contact and act as gatekeepers to the rest of the health system, since patients must have a GP referral to consult a specialist. GPs can bill a patient (who then applies to Medicare for reimbursement), or can directly “bulk-bill” Medicare, as most do, provided that they are prepared to accept the Medicare schedule fee as full payment. Medical specialists provide ambulatory secondary care, either in private consulting rooms or in outpatient departments of public hospitals. Medicare reimburses 85% of the schedule fees for specialist consultations.
There are a total of 1303 hospitals, including 1029 acute care hospitals, with public hospitals providing 70% of the bed stock. The configuration of the hospital system has changed with the closure of many small hospitals, mergers between hospitals and the growth of free-standing day hospitals (253 in 2005) for same-day procedures. With 2.6 acute beds per 1000 population, Australia is below the European Union average, reflecting shorter stays and quicker throughput of patients, more same-day procedures (about half of admissions) and more health care provided in the community. As well as changes in how patients are managed, the last two decades have seen changes in how hospitals are funded, with most now funded largely through case-mix or diagnosis-related groups (DRGs).
Health care reform in Australia has proceeded through incremental steps, since the Australian Government and the States must agree on any major changes, while the private sector also is a powerful stakeholder. The main changes over the last decade include the following: public support for private health insurance (for example, tax rebates for those taking out private health insurance cost the Australian Government AU$ 2 billion in 2001–2002); a rise from 85% to 100% of the Medicare schedule fee for GPs to counteract a drop in bulk-billing; efforts to formulate and implement national policies through
xviii
Health systems in transition Australia
intergovernmental forums, such as the Australian Health Ministers Conference and the Council of Australian Governments; national government funding for coordinated care programmes; increased attention to workforce planning following a report by the Productivity Commission on shortages of health care professionals and inflexible work practices; more e-health initiatives; and greater attention to the quality and safety of patient care.
Three of the basic goals of the Australian health system are equity (fair payments and fair access to and use of services), efficiency (value for money) and quality (high standards and good health outcomes). Equity has been partly protected in that the health system is funded primarily by progressive taxation, but disparities have arisen in several areas, including increased out-of-pocket payments, and differential access to dental care by privately and publicly insured Australians. There are also concerns that increased funds flowing to private health insurance will give rise to a two-tier health system and encourage more health professionals to move from public to private employment. Efficiency can be improved, given duplicated governance between the Australian Government and the States, although gains have been made in microeconomic reforms. Quality is receiving more attention, despite limited monitoring of clinical outcomes. These concerns will continue to be addressed during the coming decades in the context of changing population health needs, better informed health consumers and advances in health technology. Major reforms will depend upon the ideological preferences of governments and their political will to achieve change in a complex health system.

�
AustraliaHealth systems in transition
1 Introduction
1.1 Overviewofthehealthsystem
Australia has a mainly tax-funded health care system, with medical services subsidized through a universal national health insurance scheme. Health services are administered through a federal system
of government and are delivered by many public and private providers. The Australian Government (also referred to as the “Federal Government”, or “the Commonwealth”) funds rather than provides health services and also subsidizes pharmaceuticals and residential care for the elderly (nursing homes). The six State and the two Territory governments (mainly referred to hereafter as the States) fund, with Commonwealth financial assistance, and administer public hospitals, mental health services and community health services. Private medical practitioners provide most community-based medical and dental treatment, and there is a large private sector, including insurance funds, hospitals and the diagnostics industry. The health care system involves ongoing negotiation between Commonwealth and State governments in a field with many public and private stakeholders. A key principle underlying much of Australia’s health system is universal access to good quality health care regardless of ability to pay.
1.2 Geographyandsociodemography
Australia is the smallest continent but the sixth largest country in the world, being, for example, about the size of western Europe or the continental United States (excluding Alaska). The land area is 7 692 000 km2. Nearly 40% of

2
Health systems in transition Australia
Australia’s land mass lies within the Tropics, with Cape York the northernmost point, situated �0 degrees south of the Equator (Fig. �.�). The climate thus ranges from tropical in the north, temperate in the south and east, and hot and arid in the interior. Population density is low at 2.5 persons per square kilometre, with most of the continent uninhabited or sparsely settled, and the population concentrated along the eastern, south-eastern and south-western coasts (Australian Bureau of Statistics 2003a). The six States and two Territories in the federal system of government are, in order of population size (and giving their capitals): New South Wales (Sydney), Victoria (Melbourne), Queensland (Brisbane), Western Australia (Perth), South Australia (Adelaide), Tasmania (Hobart), the Australian Capital Territory (Canberra) and the Northern Territory (Darwin). The national capital is Canberra and the two largest cities are Sydney and Melbourne. Australia also is responsible for administering seven external Territories, including the Australian Antarctic Territory and a number of islands in the Pacific, Indian and Southern Oceans.
Australia’s geography and demography present challenges for its health care system. Key demographic indicators are outlined in Table �.�. Four factors are highlighted here: population growth, population ageing, cultural diversity and urbanization.
Table1.1 Demographicindicators,1960–2003
1960 1970 1980 1990 2000 2003Total population (millions) 10.3 12.5 14.7 17.0 19.2 19.9
Population density (people per km2) 1.0 2.0 2.0 2.0 2.0 2.5
% over 65 years 8.5 8.4 9.6 11.1 12.0 12.8
% aged under 15 years 30.1 28.8 25.3 21.9 21.0 20.0
Total fertility rate 3.5 2.9 1.9 1.9 1.8 1.7
Dependency ratio 0.9 0.9 0.8 0.7 0.5 0.5
Life expectancy at birth (females) 73.9 74.2 78.1 80.1 82.7 83.1
Life expectancy at birth (males) 67.9 67.4 71.0 73.9 76.9 77.3
Crude birth rate (per 1000 population) 22.4 20.6 15.3 15.2 13.1 12.6
Crude death rate (per 1000 population) 10.9 11.2 8.9 7.2 7.1 7.3
Infant mortality rate (deaths per 1000 live births) 20.2 17.9 10.7 8.2 5.0 4.8
Sources: OECD 2000, Australian Institute of Health and Welfare 2000, Australian Institute of Health and Welfare 2004a, Australian Bureau of Statistics 2003a, Australian Bureau of Statistics 2004a, United Nations Population Division 2004.

3
AustraliaHealth systems in transition
1.2.1 Populationgrowth
Australia’s population has increased from about 4 million in �900 to more than 20 million in 2004 (Australian Bureau of Statistics 2003b, Australian Bureau of Statistics 2004a). Population growth was high in the �950s and �960s, about 2.7% growth per year, but slowed to around �.2% per year in the late �990s (Australian Bureau of Statistics �999, Australian Bureau of Statistics 2004b). The population is expected to increase (medium variant projections) by 33%
Fig.1.1 MapofAustralia
IndonesiaPapuaNew Guinea
IndianOcean
TimorSea Coral
Sea
Great Barrier Reef
GreatAustralian
Bight
Indian OceanTasman
Sea
Darwin
Alice Springs
Perth Adelaide
Melbourne
Sydney
HobartTasmania
Canberra
Brisbane
Macqarie Island not shown0 500 km0 500 miles
Western Australia
NorthernTerritory
Queensland
South AustraliaNew South Wales
AustalianCapitol
TerritoryVictoria
Source: World Factbook

4
Health systems in transition Australia
between 2000 and 2050 (United Nations Population Division 2004). Natural increase contributed more to population growth than overseas migration during the �990s, but this is likely to change over the next few decades. It is estimated that deaths will outnumber births annually over the period 2030–2070, leaving overseas migration as the main source of population growth. By 2040, deaths will overtake migration, resulting in negative population growth (Australian Bureau of Statistics 2003c).
1.2.2 Populationageing
As is the case for other industrialized countries, Australia’s population is growing older. The median age of the Australian population was 36.� years in 2003, an increase of 5.9 years over the previous 20 years (Australian Bureau of Statistics 2003b). This is similar to the median age of the United States of America, New Zealand and Canada, but is lower than western European countries. The proportion of people aged 65 years and over tripled in Australia between �90� (4%) and 200� (�2%), was �2.8% in 2003, and is projected to increase to about 30% by 2�0� (Australian Bureau of Statistics 2003d). A significant aspect of population ageing is within the elderly population itself, with people aged 80 and over the fastest growing age group (Australian Bureau of Statistics 2003c). Conversely, the proportion of people aged under �5 years is projected to decrease from 20% in 2002 to between �2% and �5% by 2�0�. Australia’s population aged �5–64 years, which encompasses much of the working-age population, is also projected to decline as a proportion of the total population. In 2003, the so-called dependency ratio was 0.5 people aged 0–�4 years and 65+ for every person of working age.
Population ageing is due to sustained low levels of fertility and increasing life expectancy at birth. The total fertility rate (the average number of children borne by a woman during her lifetime) has declined from a peak of 3.6 in �96� to a record low of �.7 in 2003, while the crude birth rate has declined from 22.4 per �000 population in �960 to �2.6 in 2003 (Australian Bureau of Statistics 2003a). The factors underlying the declining fertility rates are delayed child-bearing, an increase in the number of childless women, and a decline in the number of women with three or more children (Ford et al. 2003). While many demographers consider that Australia’s total fertility rate will fall further, despite a recent small rise in delayed births among older women, there is no consensus or certainty whether fertility will stabilize at some point. There is considerable debate over the desirable population size for Australia, the desirable age composition for the population, and which, if any, strategies might persuade more women to have more children.

5
AustraliaHealth systems in transition
1.2.3 Culturaldiversity
Australia is a diverse multicultural nation built by people from many different backgrounds. The Aboriginal inhabitants first arrived in Australia at least 40 000 years ago and probably as far back as 60 000 years ago. European settlement began in �788 with the establishment of the first British penal colonies. As a consequence, much of the Indigenous population was displaced and many died, often as a result of introduced diseases. People of Aboriginal and Torres Strait Island descent represent only about 2.4% of the Australian population, although they have increased numerically in the last few decades (Australian Bureau of Statistics 2003e). They experience much poorer health across a range of health indicators than the rest of the population (see Section �.6 Aboriginal and Torres Strait Islander health status).
Since �945, over 6 million people from 200 countries have come to Australia as new settlers in successive waves of immigration (Australian Bureau of Statistics 2004c). The 200� census showed that people born overseas comprise almost one-quarter (23%) of the total population, and that 26% of persons born in Australia have at least one parent born overseas (Australian Bureau of Statistics 2004d). Immigration has strongly influenced the size of the population and currently contributes about 50% of annual population growth (Australian Bureau of Statistics 2004c). Until the late �940s, most migration was from the United Kingdom and Ireland. Immediately following the Second World War until the �960s, there were large flows of migrants from various European countries. Since the �970s, migrants have arrived from all regions of the world, but are increasingly likely to have been born in countries of the Asia–Pacific region, such as New Zealand, Viet Nam and China (Australian Bureau of Statistics 2004c).
Immigrants generally enjoy better health than Australian-born persons, and this is largely explained by the “healthy migrant effect”, resulting from stringent eligibility criteria that ensure that only those in good health migrate to Australia. Overall, immigrants enjoy advantage for some conditions, but disadvantage for others, and their health status can vary according to factors such as birthplace, age, socioeconomic status, fluency in English, dietary and genetic factors, living conditions and satisfaction with life in Australia (Australian Institute of Health & Welfare 2002).
1.2.4 Urbanization
The population is highly urbanized, or rather suburbanized given the spread of Australian cities, with the majority (66%) living in major cities, mainly along the fertile coastal areas of the country, while the remainder 34% live outside
6
Health systems in transition Australia
cities with populations greater than 250 000 (3�% live in regional, and 3% in remote areas) (Australian Institute of Health and Welfare 2004a). Over half of Australia’s Indigenous peoples live in major cities or inner regional areas, but a much greater proportion than in the general population live in remote parts of Australia (Australian Bureau of Statistics 2004e).
There are considerable differences between rural and urban populations in both health status and health service access and use. People in rural and remote areas generally have poorer health than their metropolitan counterparts, as indicated by higher mortality rates from all causes, lower life expectancy, higher hospitalization rates for some causes of ill health, and lower survival rates for cardiovascular disease and cancer (Australian Institute of Health and Welfare �998a). While this largely reflects the larger Indigenous component of the remote population, it is also related to lifestyle and behaviour factors, lower access to medical and other health services, riskier occupations, country driving conditions and generally lower socioeconomic status (Mathers �994, Glover et al. �999, Dixon and Eckersley 200�, Australian Institute of Health & Welfare 2003a). Providing quality health services and health professionals to populations in rural, regional and remote areas is a priority of the Australian Government, and a range of initiatives now are targeted at improving health outcomes in rural and remote areas (see Section 6.�3.� Rural health care).
1.3 Economiccontext
Australia is a prosperous country with a well-established capitalist mixed economy. With its abundant natural resources, Australia is a major exporter of agricultural products, minerals, metals and fossil fuels. Government economic policy for the last few decades has aimed to diversify the economy, reduce the traditional reliance upon the export of primary products, and increase the export of manufactured products and/or services. Australia’s economic interests are based predominantly in the Asia–Pacific region, and Australia is a strong supporter of the Asia–Pacific Economic Cooperation (APEC) forum. In 2003, 68% of Australia’s exports of goods and services went to member economies of APEC (Australian Bureau of Statistics 2004f).
Australia’s economic well-being and growth depend on a competitive domestic economy and access to foreign markets and investment. Although distance from international markets and the size and dispersal of domestic markets remain issues, trade policy, industry policy and microeconomic reform all work to provide Australian businesses with the competitive foundations and
7
AustraliaHealth systems in transition
opportunities to thrive in an increasingly globalized marketplace (Australian Bureau of Statistics 2004f). In particular, reforms since the �980s have opened Australia to international competition. These have included financial deregulation, floating the exchange rate, lowering tariff barriers, major changes to the tax system, freeing up labour and product markets – a process which is still ongoing – and implementing credible medium-term monetary and fiscal policy (Commonwealth of Australia 2004a).
Australia, like other Organisation for Economic Co-operation and Development (OECD) countries, experienced low economic growth and high unemployment in the early �990s, but the economy expanded in the late �990s. Table �.2 lists some economic indicators. The rate of gross domestic product (GDP) growth has been above 5% over the last decade, and in 2003–2004 it was 7.3%, while real GDP grew by 4.7% (Australian Bureau of Statistics 2004f). The share of GDP contributed by agriculture has continued to fall, while that of the services sector has continued to rise.
Although Australia’s GDP per capita had grown more slowly than the OECD average for most of the second half of last century, it has grown more rapidly than the OECD average since �990 (Commonwealth of Australia 2005). Australia’s GDP per capita (US$ 20 800) in 2002 was close to the OECD average (US$ 2� 700). By 2004, Australian GDP per capita had risen to AU$ 40 436 – equivalent to US$ 29 09� in purchasing-power parity (PPP) terms.
A new goods and services tax (GST) was introduced in July 2000, bringing Australia into line with most OECD countries. This was associated with a one-off inflation “spike” with the Consumer Price Index increasing by 6% but subsequently annual increases returned to pre-GST levels of 2.5–3% (Australian Bureau of Statistics 2005a). Although the budget deficit was not high compared to other developed countries, the Australian Government from the mid-�990s embarked on a programme of containing growth in government spending and general fiscal consolidation, which yielded surpluses of around �% of GDP for most of the last five budgets.
The labour force has grown steadily since �980, while unemployment has fallen from a minor peak of 6.7% in 200� to a historic low of 5.5% in 2004 (Australian Bureau of Statistics 2004g). Income inequality (as measured by the Gini coefficient of equivalized disposable household income) has remained steady over the last five years, at levels representing slightly increased equality over the mid-�990s. There is some evidence of a trend toward increasing real interest rates in line with international patterns, although at below 3% in 2004 these remain relatively low in historical terms (see Table �.2).

8
Health systems in transition Australia
1.4 Politicalcontext
Australia has a federal system of government with three political and administrative tiers: Commonwealth, States and Territories, and local government. A defining feature of the Australian federal system is the dynamic tension that is inherent in its intergovernmental relations and the degree of cooperation required between levels of government. The Australian Government collects most taxes but the States and Territories have a greater role in administering services: that is, fiscal and functional responsibilities are divided and thus intergovernmental relations involve ongoing negotiations over funding and respective responsibilities.
1.4.1 FederationandtheCommonwealthGovernment
Six colonies were established around the continent after British settlement in �788. These functioned under a limited form of self-government under the British Crown until �90�, when the six colonies became States within the Commonwealth of Australia (with two self-governing Territories established later). Under Australia’s federal system, powers are distributed between the Commonwealth and the States, with the Constitution (a written document) defining their respective law-making powers.
Table1.2 Economicindicators,1980–2004
1980 1990 2000 2001 2002 2003 2004GDP per capita (AU$) 8 774 22 554 32 551 34 432 36 313 38 150 40 436
GDP per capita (US$ PPP) 8 686 16 225 24 660 25 695 26 701 27 846 29 091
GDP annual (% change AU$)a – – 5.7 7.2 6.7 6.3 7.3
Short-term debt outstanding (current US$ bn)b – 93 164 158 161 172 195
Labour force (total, 1000) 5 269 6 209 6 592 6 531 6 555 6 648 6 859
Unemployment (% labour force)c 6.1 6.2 6.0 6.7 6.3 6.0 5.5
Real interest rated 2.86 7.35 3.60 –1.00 1.85 1.65 2.85
Household income inequality (Gini coefficient)e – – 0.310 0.311 – 0.309 –
Notes: GDP estimates are in current prices (nominal); a Source: Australian Bureau of Statistics 2004h, 25; b Government + Non-government short-term (<1 yr) debt securities outstanding; c As at June in the relevant year; d Derived from official interest rates outstanding and ABS All Groups Consumer Price Index annual % change. Source: Australian Bureau of Statistics 2005a, Table 2; e Equivalized Disposable Household Income. Source: Australian Bureau of Statistics 2005b, Table 1.

9
AustraliaHealth systems in transition
While Australia is an independent nation, it is a constitutional monarchy recognizing the British sovereign as Head of State. The British sovereign is represented federally by the Governor-General, who must act in accordance with the Australian Constitution, as well as by State governors, who must act in accordance with State constitutions. A referendum is required to change the Australian Constitution, and a referendum to change Australia’s status, from a Commonwealth headed by the British monarch to a republic, was defeated in �999.
The Commonwealth of Australia is governed under the doctrine of separation of powers: legislative, executive and judicial. The Parliament makes the laws, the Government implements and supervises, and the Courts interpret them. The legislative power of the Commonwealth is vested in a federal parliament. The executive power is vested in the Queen and is exercisable by the Governor-General as the Queen’s representative. Judicial power is exercised by the High Court of Australia and the Federal Court of Australia, and other State courts exercising federal jurisdiction.
Government is based on a popularly elected parliament. Australia’s Federal Parliament is bicameral with two chambers: the House of Representatives (or lower house) and the Senate (or upper house). Members of the lower house are directly elected from single member electorates by a preferential voting system for a three-year term. Members of the upper house are directly elected by proportional representation for six-year terms, with one-half of Senate members retiring every three years, usually to coincide with elections for the lower house. Voting by secret ballot in federal and State elections is compulsory for all Australians aged �8 and over; those who fail to vote without good reason may be fined.
Under the prevailing Westminster system, the party (or parties in a coalition) with a majority of seats in the lower house, becomes the executive government, and the leader of this party (or parties) becomes the Prime Minister. The party with the second largest number of members usually forms the official “Opposition”. The lower house has the task of representing the views and wishes of the Australian people and initiating much of the legislation. The upper house is regarded as “the States house”, since it has equal representation from all the States and Territories, regardless of their population, and is regarded as the chamber of review, although it may not initiate or amend money bills. Minority parties often hold the balance of power in the upper house.
While broadly speaking the Commonwealth Parliament is able to make laws only in relation to the areas listed in the Constitution, the power of the Commonwealth has broadened over the years through its capacity to raise

�0
Health systems in transition Australia
revenue through taxation, and through amendments and interpretations to the Constitution. The Commonwealth Government is responsible for national affairs and collects about 80% of all tax revenue (Australian Bureau of Statistics 2004i). Besides the collection of various levies and excise, Commonwealth responsibilities include external trade and commerce, quarantine, currency, patents, marriage, immigration, defence, telecommunications, and the provision of welfare and other assistance payments. The Commonwealth also has a leadership role in health policy-making, particularly in national issues like public health, research and national information management (see Chapter 2 Organizational structure).
Intergovernmental relations on social programmes have varied with political swings over the last few decades (Healy �998). The hallmarks of the Commonwealth Government in the Labor years of Prime Minister Whitlam (�972–�975) were increased central intervention, competitive federalism (some overlapping functions) between the Commonwealth and the States, the pursuit of national goals, increased social expenditure and more use of tied grants to the States. The Fraser Liberal and National Coalition Government (�975–�983) pursued coordinated federalism with the States (separate functions), devolved social responsibilities, reined back public sector spending, and reinstated more revenue sharing. The Hawke Labor Government (�983–�99�) increased funds for social programmes, sought cooperative federalism, and consolidated social programmes into cost-sharing arrangements with the States. The Keating Labor Government (�99�–�996) was more centralist but engaged in microeconomic reform and joint reviews of intergovernmental areas. The Howard Liberal and National Coalition Government (�996– ) has sought to achieve a more equitable distribution of revenue to the States and Territories, targeted social expenditures, and an increased role for the private sector in activities traditionally undertaken by government. As in other countries, health is a major election issue that resonates with voters, compelling the major parties to place health care at the centre of their electoral campaigns and policies.
1.4.2 StateandTerritorygovernments
States and Territories have their own parliament and their own constitution; however, each State parliament is subject to the national Constitution as well as to its own constitution. All State parliaments, except Queensland, are bicameral with an upper and lower house, while the parliament of each Territory has only one house. Each State is headed by a premier, who is normally the leader of the party with a majority or a working minority in the lower house. Each State (but not the Territories) has its own governor appointed by the British monarch, and in times of constitutional crisis, the governor could appoint a premier. Australia’s

��
AustraliaHealth systems in transition
two self-governing Territories have political systems similar to those of the States. The Territories are headed by chief ministers, who are the leaders of the party with a majority or a working minority in the Territories’ legislature.
These parliaments and governments are responsible for all matters not assigned to the Commonwealth. Each State parliament has plenary powers to make laws for the peace, order and good government within its territorial limits. However, the Federal Parliament also has power to legislate for the whole of the Commonwealth of Australia in respect of specific matters referred to in the Commonwealth Constitution. In some areas of government, therefore, the States will have concurrent legislative powers with their federal counterpart, and where a State law is inconsistent with Commonwealth law, the State law is invalid to the extent of the inconsistency.
1.4.3 Localgovernment
There are more than 850 local government areas that are responsible for their respective district matters. Local governments can be in the form of a city or town council or a shire. Local government, not recognized specifically in the Constitution, is established under legislation of the individual States. The powers and responsibilities of local government vary from State to State, but broadly they are responsible for town planning, building approvals, local roads, parking, public libraries, public toilets, water and sewerage, waste removal, domestic animals and community facilities. Local government bodies do not have the law enforcement or public education functions vested in local bodies in some other countries, and have environmental health rather than clinical health functions. There is no local government in the Australian Capital Territory, where the Territory government has responsibility for local government matters.
1.4.4 Mainpoliticalparties
Currently, there are 62 political parties registered with the Australian Electoral Commission. There are five major political parties: the Liberal Party, the National Party of Australia, the Australian Labor Party, the Australian Democrats and the Australian Greens. The Liberal and National Parties form the current Federal Coalition Government under Prime Minister John Howard. The last elections for the House of Representatives and half of the Senate were held in October 2004.
The Liberal Party, the main conservative party, was founded in �944 and represents political views ranging from the centre to the conservative right. The party’s principles are based on individual initiative and free enterprise, lean

�2
Health systems in transition Australia
government and competition. The Liberal Party is currently in its fourth term in office as part of a coalition government (being elected to its first term in �996). The coalition also has control of the Senate for the first time since �98�.
The National Party (the coalition partner) originally was established as the Country Party in the early �900s. The party has conservative views and believes in the maximum development of private enterprise, is concerned with issues faced by rural Australians and promotes family values and national security. The Liberal and National parties (and their predecessors) have formed coalition governments for most of the period since �923, and have a long history as allies in opposition to Labor governments.
The Australian Labor Party (ALP) has been in opposition since �996, which concluded five consecutive terms in office (�982–�996) under prime ministers Robert Hawke and then Paul Keating. A democratic socialist party, the ALP is Australia’s (and one of the world’s) oldest national political party, founded in �90� as the political arm of the trade union movement. The party represents political views from the centre to the left. Its principles are based on promotion of social equality, economic security, protection of individual rights and support for minority rights. As at May 2006, all the States and Territories had Labor governments in power.
The Australian Democrats were founded in �977 as an independent “reformist” party. The Democrats pursue an issue-driven agenda, which distinguishes them from the other parties who traditionally are linked with powerful interest groups. Democrat priorities include sustainable development, the protection of the environment, civil liberty and social justice. Although not currently represented in the House of Representatives, the Democrats previously were influential in the Senate.
The Australian Greens, formed in �992 as a coalition of various State Greens parties, is the national Greens party in Australia. A conservationist party, it seeks to achieve ecological sustainability, social and economic justice, grassroots democracy, peace, disarmament and non-violence. Its policies focus on global as well as national interests. The Greens have gained support since 200�, at the expense of the Australian Democrats, and to some extent the Australian Labor Party.
Family First is a conservative political newcomer. Closely linked with the Pentecostal Assemblies of God movement, the party supports Christian values and traditional family life. In the 2004 Federal election, the party attracted about 2% of the vote nationally, and won a Senate seat in Victoria.
�3
AustraliaHealth systems in transition
1.4.5 Internationalmemberships
Australia’s membership of international organizations and bilateral engagement provide an opportunity to assist other countries in making health an international priority. This has benefits to Australians in terms of protection from the spread of communicable diseases, in protecting the health system from any potential adverse impact of international trade agreements, in drawing on international experience and expertise to strengthen the health care system, as well as playing a more prominent role in improving health and health care in the region and around the world.
Australia is a member of a number of international organizations, including the following.
The World Health Organization (WHO) is the United Nations’ specialized agency for health whose functions include standards setting, promoting the health and development agenda and managing health crises, such as severe acute respiratory syndrome (SARS) and the avian influenza outbreaks.
The WHO Western Pacific Regional Organization performs a similar range of functions at the regional level.
The International Agency for Research on Cancer was established by WHO to foster international and multidisciplinary collaboration for research into cancer prevention and control.
Australia contributes to and draws on OECD health policy research activities as well as its data collection and analysis work.
Australia is a member of the Asia-Pacific Economic Cooperation (APEC) and has increased its activities in the region in response to recent economic, security and infectious disease crises.
Australia is also a member of the World Trade Organization (WTO) in relation to the health aspects of the rules of trade between nations and its activities to liberalize trade.
Australia collaborates on a bilateral basis with other countries facing similar policy challenges, such as maintaining the sustainability of the health system in the face of increasing public expectations and costs; growth in outlays; addressing shortages in the health workforce; lifting the level of investment in prevention; making better use of information technology; and improving the safety and quality of service delivery. Partner countries draw on one another’s expertise and experiences in developing domestic policies.
Australia is increasing its level of regional engagement, particularly in the Pacific Region, to support sustainable health system development. In 2003,
•
•
•
•
•
•
�4
Health systems in transition Australia
the Australian Government Department of Health and Ageing established the Pacific Senior Health Officials Network to build long-term links with health ministries in several Pacific Island Countries. It provides a mechanism for information sharing, focusing on practical advice, to support efforts to get the best value from existing development cooperation, and to provide a forum to discuss the implications of decisions made at ministerial and other significant Pacific meetings. The Department of Health and Ageing is working closely with AusAID (Australia’s overseas development aid agency) and other agencies to support institutional capacity-building and the development of linkages in the region, in order, for example, to combat re-emerging and new infectious diseases.
Australia has also entered into more formal relationships with countries in the region, signing a memorandum of understanding on health cooperation to provide a framework to improve responses to regional health challenges, for example, to strengthen disease surveillance systems. In more recent times, the threat of emerging communicable diseases has required a dramatically increased level of collaborative global action to strengthen public health surveillance and response measures, and to secure access to necessary medicines.
The health portfolio participates in the negotiation of Australia’s free trade agreements to ensure health-related aspects are consistent with domestic policies and regulations, to ensure access to safe and affordable health services and products. Australia has signed a number of international treaties with health aspects. Examples include: the Framework Convention on Tobacco Control, Convention on the Protection and Promotion of the Rights and Dignity of Persons with Disabilities, Convention on Human Rights, Convention on Women, and the General Agreement on Trade in Services (GATS).
1.5 Healthstatus
The health of the Australian population has improved markedly over the last century. Mortality and morbidity indicators for the last few decades are shown in Table �.3. Life expectancy at birth has continued to increase and is now 80 years (78 for males and 83 for females), one of the highest in the world (Australian Bureau of Statistics 2004j). Infant mortality has declined to 4.7 infant deaths per �000 live births in 2004 (Australian Bureau of Statistics 2004j). There have been falls in the prevalence of many diseases and health conditions, as well as improved survival from them (Australian Institute of Health and Welfare 2004a). In the most recent National Health Survey conducted in 200�, 82% of

�5
AustraliaHealth systems in transition
Australians aged �5 or over reported their overall health as excellent, very good or good, a consistent finding (Australian Bureau of Statistics 2002b).
1.5.1 Mortality,morbidityandhealthylifeexpectancy
Australia collects detailed data on mortality and morbidity, and causes of death are systematically recorded. Morbidity trends are estimated from various data sources, including population health surveys such as the National Health Survey, and from disease registers and administrative collections of health service use. The National Health Survey is a regular three-yearly household survey conducted by the Australian Bureau of Statistics (ABS) to obtain national information on a range of health-related issues. The ABS also conducts regular surveys on disability and Indigenous health, while the Australian Institute of Health and Welfare (AIHW) conducts regular surveys on tobacco, alcohol and drug use and oral health (Australian Institute of Health and Welfare 2004a, pp. 347–349). Most State governments also conduct health surveys. Although data collection is expanding and improving, information on the incidence of major diseases in Australia is limited owing to information gaps and difficulties with definitions and methods. There are also concerns about both the quality and interpretation of existing data, with estimated trends being the subject of many debates.
Australians are generally healthier and living longer, with life expectancy improving 8.4 years since �960, but health gains have not been uniform across
Table1.3 Mortalityandhealthindicators,1970–2004
1970 1980 1990 2000 2002 2004Life expectancy at birth, total (years) 70.8 74.6 77.0 79.3 80.0 –
Life expectancy at birth, male (years) 67.4 71.0 73.9 76.6 77.4 78.1
Life expectancy at birth, female (years) 74.2 78.1 80.1 82.0 82.6 83.0
Mortality rate, adult, female (per 1000 female adults) 8.7 6.4 5.3 4.3 – –
Mortality rate, adult, male (per 1000 male adults) 14.4 11.1 8.9 6.9 – –
Mortality rate, infant (per 1000 live births) 17.9 10.7 8.2 5.2 5.0 4.7
Sources: OECD 2004, Australian Bureau of Statistics 2004f.
Note: Aged standardized to total OECD population for 1980.

�6
Health systems in transition Australia
subpopulations. For example, death rates are higher among males, people living in rural and remote regions, blue-collar workers and the Australian-born (Draper et al. 2004). As discussed in the next section, the morbidity and mortality rates for Indigenous peoples are higher than those of any other group in Australia.
While there is scope for further improvement, Australia’s population enjoys good health relative to other countries. Among comparable OECD nations, Australia fares well on various aspects of health (OECD 2003a). Australian life expectancy is among the best in the world, in 2002 ranking fifth highest for both sexes (fourth for males and seventh for females) (WHO 2004a).
In the past 20 years, the risk of dying has declined for people of all ages, associated with a decline in deaths from chronic diseases, such as heart disease, stroke and cancer. The largest declines in male age-specific death rates occurred in the �0–�4 years age group (down 60%), followed by those aged 5–9 years (down 56%), 50–54 years (down 53%) and 55–59 and �–4 years (each down 52%). Female age-specific death rates declined most substantially for infants (down 50%), followed by those aged �–4, 5–9 and 50–54 years (each down 47%) (Australian Bureau of Statistics 2004j). As in developed countries generally, most deaths in Australia occur among people aged 70 years and over, the main causes being non-communicable diseases (see Table �.4).
Under this classification scheme, circulatory diseases were the leading cause of death, including heart disease (25% of all deaths), with men more at risk than women, with this category also including strokes, which account for 9% of all deaths (Australian Bureau of Statistics 2004j). In the next largest category, malignant neoplasms, the leading types of cancer for males were cancers of the digestive organs (28.4% of all male cancers), lung (2�.4%) and prostate (�3.5%). The leading types of cancer for females were cancers of the digestive organs
Table1.4 Maincausesofdeath(ICD10Classification),2003
2003CauseofdeathandICDcode Males Females TotalPerinatal conditions (P00–P96) 341 266 607
Infectious and parasitic diseases (A00–B99) 926 828 1754
Circulatory diseases (I00–I99) 23 399 25 436 48 835
Malignant neoplasms (C00–C97) 21 081 16 477 37 558
Trachea/bronchus/lung cancers (C33–C34) 4 510 2 466 6 976
Mental and behavioural disorders (F00–F99) 1 243 1 998 3 241
Respiratory diseases (J00–J99) 6 224 5 668 11 892
Digestive diseases (K00–K93) 2 289 2 212 4 501
Allcauses 68330 63962 132292
Source: Australian Bureau of Statistics 2003f, p. 8.

�7
AustraliaHealth systems in transition
(28.4% of all female cancers), breast (�6.5%) and lung (�5.0%) (Australian Bureau of Statistics 2004k). Despite these statistics, Australia has one of the lowest rates of heart disease among OECD countries, and lower death rates from cancer than many other developed countries.
Causes of death are strongly related to a person’s age. Among persons aged under 45 years, transport accidents and suicides are the leading causes of death, and death rates from these causes are much higher for men than for women. Among people aged 45 and over, cancer and heart disease are the leading causes of death, and again men are more at risk than women. Injury and poisoning are the leading causes of mortality and large contributors to morbidity in children aged �–�4 years (Australian Bureau of Statistics 2004l).
1.5.2 Healthylifeexpectancy,burdenofdisease,andriskfactors
Table1.5 Health-adjustedlifeexpectancy(HALE),2002
Indicator Males FemalesHealthy life expectancy at birth (HALE) 70.9 74.3
Healthy life expectancy at age 60 years 16.9 19.5
Expectation of lost healthy years at birth (LHE) 7.0 8.7
Percentage of total life expectancy lost due to poor health 9.0 10.4
Source: WHO 2004b.
Australians can expect to enjoy good health for most of their life span (WHO 2004a). In terms of health-adjusted life expectancy (HALE), an indicator of both quantity and quality of life, Australians born in 2002 could expect to live the equivalent of 72.6 healthy years (70.9 years for males and 74.3 years for females) in full health (Table �.5). Improved health status in Australia is associated with a greater focus on prevention and healthier lifestyles, improvements in living conditions and medical advances (Australian Bureau of Statistics 2004m).
As in other developed countries, most ill health, disability and premature deaths in Australia now arise from non-communicable diseases, particularly cardiovascular diseases, cancers, mental illness, diabetes, asthma, arthritis, nervous system disorders and kidney diseases. Most of these conditions are chronic, but others contribute to disability and some contribute to premature mortality. The first comprehensive national study on the impact of mortality and disability in Australia estimated that in �996 the total burden of disease and injury in Australia was 2.5 million disability-adjusted life years (DALYs), with 54% being years of life lost owing to premature mortality (YLLs), and
�8
Health systems in transition Australia
46% being years of healthy life lost owing to disability (YLDs) (Australian Institute of Health and Welfare 2004a, p. 56). Premature mortality, as indicated by YLLs, is estimated to be responsible for 57% of the total burden of disease in Australian males and 5�% in females, with YLD accounting for the balance. The leading causes of YLL are cardiovascular disease, cancer and injury. The leading causes of disability are depression, adult-onset hearing loss, alcohol dependence and abuse and dementia in males, and depression, dementia, osteoarthritis and asthma in females (Mathers et al. �999).
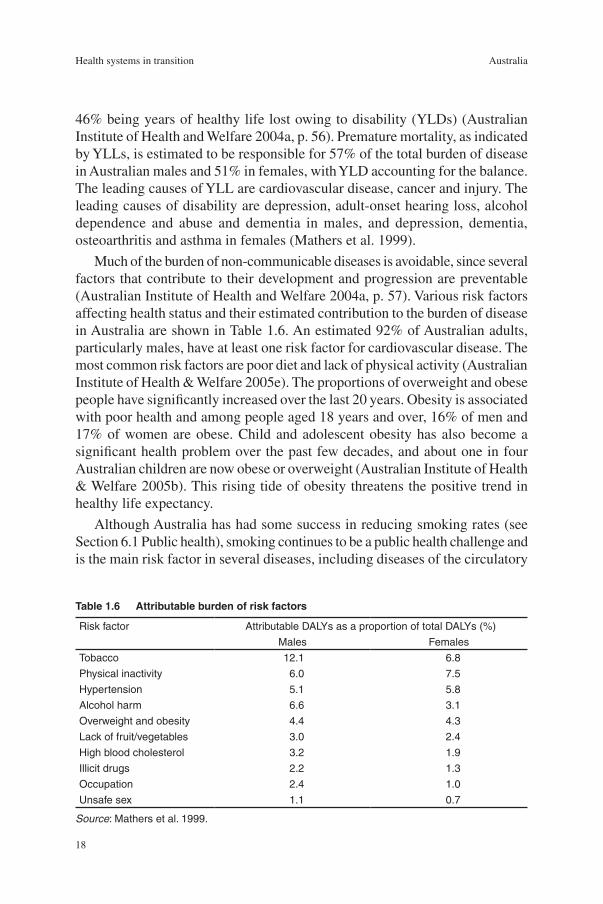
Much of the burden of non-communicable diseases is avoidable, since several factors that contribute to their development and progression are preventable (Australian Institute of Health and Welfare 2004a, p. 57). Various risk factors affecting health status and their estimated contribution to the burden of disease in Australia are shown in Table �.6. An estimated 92% of Australian adults, particularly males, have at least one risk factor for cardiovascular disease. The most common risk factors are poor diet and lack of physical activity (Australian Institute of Health & Welfare 2005e). The proportions of overweight and obese people have significantly increased over the last 20 years. Obesity is associated with poor health and among people aged �8 years and over, �6% of men and �7% of women are obese. Child and adolescent obesity has also become a significant health problem over the past few decades, and about one in four Australian children are now obese or overweight (Australian Institute of Health & Welfare 2005b). This rising tide of obesity threatens the positive trend in healthy life expectancy.
Although Australia has had some success in reducing smoking rates (see Section 6.� Public health), smoking continues to be a public health challenge and is the main risk factor in several diseases, including diseases of the circulatory
Table1.6 Attributableburdenofriskfactors
Risk factor Attributable DALYs as a proportion of total DALYs (%)
Males Females
Tobacco 12.1 6.8
Physical inactivity 6.0 7.5
Hypertension 5.1 5.8
Alcohol harm 6.6 3.1
Overweight and obesity 4.4 4.3
Lack of fruit/vegetables 3.0 2.4
High blood cholesterol 3.2 1.9
Illicit drugs 2.2 1.3
Occupation 2.4 1.0
Unsafe sex 1.1 0.7
Source: Mathers et al. 1999.

�9
AustraliaHealth systems in transition
system, the respiratory system, and cancer. Tobacco is the single biggest contributor to the burden of disease, but for diseases such as lung cancer there is a time lag of several decades before illness and death. In 2004, �7.4% of Australians aged �4 years and over smoked daily. Smoking in males fell, but the rate of smoking among females rose by 0.7% during the �990s. These trends are now being reflected in mortality rates for smoking-related cancers, which have been decreasing for men and increasing for women (Australian Institute of Health and Welfare 2004a, p. 68).
1.5.3 Communicabledisease
While communicable diseases were responsible for many deaths and much illness in Australia in earlier centuries, these diseases are not now major causes of mortality, with the exception of influenza and pneumonia in older age groups. By 2002, communicable disease accounted for only 3.7% of all deaths compared to �8% in �92� (Australian Institute of Health and Welfare 2004a, p. �04). Despite major reductions in mortality, however, communicable diseases remain an important public health priority. The problems facing Australia today are diverse and include:
food-borne diseases
emergence of antimicrobial resistant bacteria
sexually transmitted diseases
vector-borne disease
vaccine-preventable diseases.
New and emerging diseases such as bat lyssavirus and bovine spongiform encephalopathy (BSE) pose potential threats to public health, and two infectious diseases of significant global concern recently emerged: SARS and avian influenza (bird flu). During the international outbreak of SARS in 2003, six suspected cases in Australia were identified and reported to the World Health Organization. Only one was positive for the SARS coronavirus and no secondary transmission occurred. There have been no human cases of avian influenza in Australia (as at April 2006). Responses to these new threats have included stronger quarantine measures, initiating pandemic influenza responses and monitoring the poultry industry for potential outbreaks (Australian Institute of Health and Welfare 2004a, p. ��5).
Blood-borne diseases remain a cause for concern, particularly HIV/AIDS and viral hepatitis. As in other countries, HIV/AIDS has received considerable health policy attention since the early �980s and is addressed by a nationally coordinated programme. The annual number of HIV diagnoses peaked at 2500
•
•
•
•
•

20
Health systems in transition Australia
in �985, and declined to 660 in �998 (Australian Institute of Health and Welfare 2000, p. ��3). HIV diagnoses then increased to 808 in 2002, while AIDS diagnoses peaked in �994, declined to 348 cases in �998, then remained stable at around 200–250 cases per year between �999 and 2002. In 2002, 390 new cases of acquired hepatitis B infection were diagnosed in Australia, an incidence rate of 2.0 per �00 000, and an estimated 225 000 people are living with hepatitis C (Australian Institute of Health and Welfare 2004a, pp. �07–�08).
Gastrointestinal infections have continued to rise, although in the absence of reporting procedures the incidence is said to be underestimated. The incidence of some sexually transmitted diseases, such as syphilis, has declined, but other infections such as Chlamydia and gonorrhoea have continued to rise (Australian Institute of Health and Welfare 2004a, p. �09). Australia has one of the lowest rates for tuberculosis (TB), and vaccine-preventable diseases remain at low levels owing to high vaccination coverage. In 2002, 90.5% of infants were fully covered at one year of age for diphtheria, tetanus, pertussis, poliomyelitis, Haemophilus influenzae type B and hepatitis B (Australian Institute of Health and Welfare 2004a, p. �57). It is expected that the burden of vaccine-preventable disease will be reduced further due to the introduction of a new schedule in 2003. Among other things, the new schedule added routine meningococcal C vaccination at �2 months of age (Australian Institute of Health and Welfare 2004a, p. ��0). Inactivated polio vaccine (IPV) for polio and varicella for chickenpox were also implemented at �8 months of age in 2005. Vector-borne diseases such as Ross River virus and encephalitis are receiving more attention. There were ten cases of malaria of local origin in 2002, the first outbreak of malaria in Australia since �986 (Australian Institute of Health and Welfare 2004a, p. ��0).
1.5.4 Oralhealth
Australian children enjoyed among the best levels of oral health among OECD countries at the end of the 20th century (Spencer 2004). The DMFT score (a sum of permanent teeth that are decayed, missing or filled) for �2-year-old Australian children dropped substantially from a peak of �2 teeth in the years between �945–�955 (Armfied and Spencer 2004) to 0.8 in �999, a low score among developed countries. There has been a deterioration of child oral health in recent years, however, with dental improvements stalling in older children, and caries among younger children increasing over the last decade (Australian Institute of Health & Welfare 2004a). The oral health standard of Australian adults has also improved since �945, and is generally high, albeit lower than for children,
2�
AustraliaHealth systems in transition
although there are inequalities among age and social groups. Routine dental services are not covered under the national health insurance scheme, Medicare, and oral health remains a significant public health concern for disadvantaged and less-affluent Australians – those with the poorest oral health and the lowest access to dental care (Spencer 2004). Not surprisingly, the provision of publicly funded dental services for adults is a contentious issue between the Federal and State governments (see Section 6.�� Dental health care).
1.6 AboriginalandTorresStraitIslanderhealthstatus
In Australia, as in other countries, health status is related to factors such as gender, geographic region, socioeconomic disadvantage, occupation and country of birth (Draper et al. 2004). People who experience social and economic disadvantage tend to be sicker and die younger than others, and this is most stark for Indigenous Australians, who are disadvantaged across a range of socioeconomic factors that impact on health (Australian Institute of Health and Welfare 2004a, p. �95).
An estimated 458 520 Indigenous people were living in Australia in 200�, around 409 800 Aboriginal people, 29 �20 Torres Strait Islanders, and �9 600 of both Aboriginal and Torres Strait Islander descent (Australian Bureau of Statistics 2003g). Although the majority of Australia’s Indigenous people now live in cities and towns, they account for a high proportion of the population in some rural and remote areas: access to appropriate health services therefore is an important issue (Glover et al. �999). Around one-quarter of Indigenous people live in areas classified as “remote” or “very remote” compared with only 2% of non-Indigenous people (Australian Bureau of Statistics 2004f).
Australia’s Aboriginal and Torres Strait Islander people experience much worse health across a range of measures, although the precise extent of the health disadvantage and whether this is improving is hard to measure. This is partly because Indigenous people are not necessarily identified in the census or in administrative records, and partly because of the practical and statistical challenges of surveying a small population that has a relatively high remote area presence (Australian Institute of Health and Welfare 2004a, p. �95). The general picture, however, shows a poor health profile more akin to a developing country compared to good health measures for the rest of the population.
Life expectancy and age-specific mortality rates are much worse than for the general population (Australian Institute of Health and Welfare 2004a, pp. �96–�98). For example, life expectancy at birth is 56 years for Indigenous men

22
Health systems in transition Australia
and 63 years for Indigenous women, compared to the Australian average of 77 years for men and 83 years for women. Indigenous people thus live about 20 years less than the rest of the Australian population. Mortality rates are higher in all age groups but particularly in infancy. Babies born to Indigenous mothers are twice as likely as other babies to die at birth or during the early postnatal period, although infant mortality rates have been improving. Most “excess” deaths relative to other Australians are due to cardiovascular disease or circulatory diseases (including ischaemic heart disease and stroke), injury and poisoning (mainly accidents, self-harm and assault), cancers, respiratory diseases (such as pneumonia) and endocrine diseases (such as diabetes). Diabetes is between two and four times more common among Indigenous Australians, and rates of end-stage renal disease are much higher for Indigenous people than they are for non-Indigenous people, particularly in remote areas where they are up to 30 times higher. Indigenous people are more likely than other Australians to be hospitalized, most commonly for dialysis but also for injuries and poisoning, respiratory diseases, digestive system diseases and mental and behaviour disorders. Indigenous people generally experience more risk factors for ill health than do other Australians. They experience disadvantages in education, housing, income, employment and the physical environment; and also in specific health risk factors, such as smoking, obesity, physical inactivity and high blood pressure. (Health care for Indigenous Australians is reviewed in Section 6.�3.2).
23
AustraliaHealth systems in transition
2.1 Historicalbackground
Until the mid-20th century, individuals had to pay for their own health care or take out insurance with sickness funds. Private practitioners and hospitals provided health services, and some free treatment was
provided by public hospitals run by the States and by charitable hospitals. From the late �9th century to the mid-�940s, the friendly society movement was a driving force behind the health care system, offering members a range of benefits, including unemployment benefits and sick pay, and through negotiated capitation payments, purchased medical services from doctors on behalf of members.
2.1.1 Post-warwelfarestate
The Australian Government began to play a significant role in health matters only after the Second World War (Kewley �973). This was a continuation of the stronger role the national government had assumed during the war years, as well as fulfilling its mandate to build a country “fit for heroes”, and in line with international developments in post-war “welfare states”. First, under the Australian Government’s defence power, a Repatriation Commission was established to care for returned soldiers. Doctors were paid to treat returned servicemen and women, and Commonwealth repatriation hospitals in each State offered comprehensive health care. Second, the Labor Government’s attempt to establish a national health care system partially failed. Third, broader Commonwealth powers in health and social care (such as the payment of pensions) were achieved in a constitutional amendment that eventually led to an unforeseen and much expanded role for the Commonwealth.
2 Organizationalstructure
24
Health systems in transition Australia
The Curtin and Chifley Labor governments (�94�–�949) made repeated efforts to radically reform the health care system. These proposals met strong resistance from doctors, conservative political parties and the voluntary insurance funds, foreshadowing ongoing contests among political and medical stakeholders (Sax �984). The next proposal, free medicines, was introduced in the short-lived Pharmaceuticals Benefits Act �945. Seen as the first step towards “socialized medicine”, this legislation was challenged by the Australian branch of the British Medical Association in the High Court of Australia, which found that Parliament had exceeded its constitutional power.
In �946 the Constitution was amended (Section 5�, xxiiia) to enable the Commonwealth to make laws with respect to “the provision of maternity allowances, widows pensions, child endowment, unemployment, pharmaceutical, sickness and hospital benefits, medical and dental services (but not so as to authorize any form of civil conscription), benefits to students and family allowances”. The Commonwealth introduced subsidized pharmaceuticals through the Pharmaceutical Benefits Act �950 (Cwlth), which legislation remains largely unchanged.
The prohibition of any form of civil conscription was interpreted by the medical profession to mean that medical practitioners could not be compelled to work for the government, and (arguably) could not be made to provide medical services for a prescribed fee. The resistance by the Australian medical profession to government control, and their support for a fee-for-service payment system, have been key themes in health policy debates.
Under the Hospital Benefits Act �946 (Cwlth) the Commonwealth entered into agreements with the States to subsidize public hospital beds on condition that there was no charge for patients in public wards, the intention being to reduce financial barriers to hospital access by patients. This has remained the basis of subsequent hospital financing agreements between the Commonwealth and the States.
The National Health Act �953 (Cwlth) consolidated the four main pillars of the Australian post-war health care system:
the Pharmaceuticals Benefits Scheme;
the Hospital Benefits scheme (Commonwealth funding for State hospitals);
Pensioner Medical Services enacted in �95� (which subsidized health care for pensioners);
the Medical Benefits Scheme (which subsidized medical costs for members of non-profit health insurance schemes).
The National Health Act �953 remains in force, albeit with many amendments.
•
•
•
•

25
AustraliaHealth systems in transition
2.1.2 Nationalhealthinsurance
The Labor Government under Prime Minister Whitlam (�972–�975) introduced a national health insurance scheme in the face of strong opposition from the medical profession, private health insurers and opposition political parties (De Voe and Short 2003). Legislation had been rejected by the Senate in �973 and �974. In accordance with the constitutional provisions for resolving such deadlocks, both Houses of Parliament were dissolved, a new election was held (in which health was a major issue), and a special sitting of both Houses of Parliament was convened to gain agreement on this and other problematic legislation.
Medibank was finally introduced in �975 and the Health Insurance Commission was established to administer the scheme. Patients could be billed directly for a medical service and claim 85% of the schedule fee back from the Health Insurance Commission, or doctors could bill the Health Insurance Commission directly (“bulk-billing”) and accept 85% of the schedule fee as full payment. In relation to hospital care, the Commonwealth Government negotiated relatively generous hospital cost-sharing arrangements with the States, provided that patients were guaranteed universal and free access to public hospitals (Duckett �998).
The Liberal-led Coalition Government (�975–�983) made a series of changes to Medibank: individuals could opt out of Medibank and purchase private health insurance, or pay a levy of 2.5% of taxable income to remain in the scheme. By �98�, a significant proportion of the population was not effectively insured for hospital treatment. Public funding for health care, principally for public hospitals, continued to be negotiated periodically between the Commonwealth and the States.
The Labor Governments (�983–�996) re-established a universal, tax-funded health insurance system, Medicare, which remains in place today. The initial �% mandatory levy on income was raised to �.5%. The national health insurance system has had bipartisan political support since �996 and the current Liberal-National Government (�996– ) continues to support Medicare.
2.2 Organizationaloverview
The health care field, with its plethora of stakeholders, has become increasingly complex. In the Australian system with divided responsibilities, ongoing consultation and cooperation between levels of government are essential, particularly on matters where a national approach is desirable. Further, the
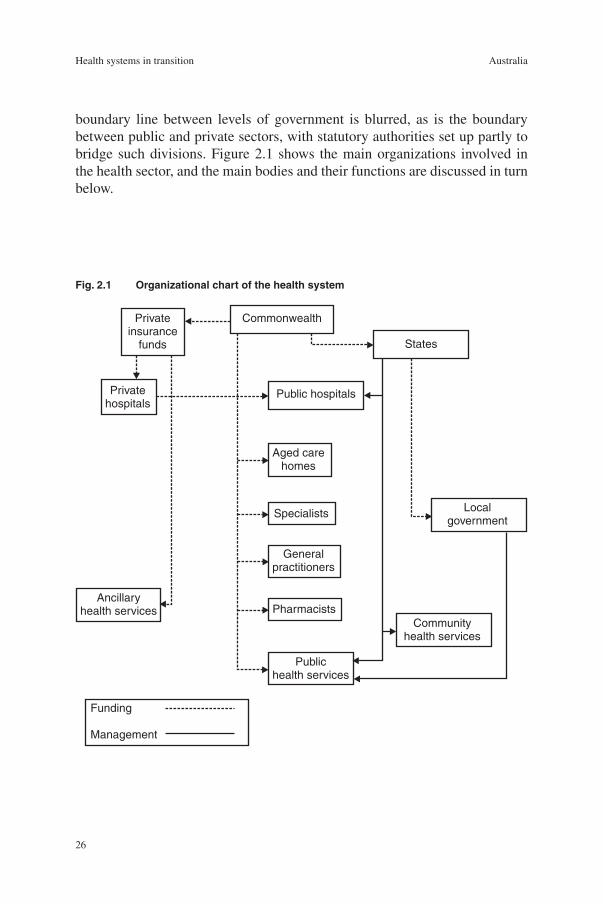
26
Health systems in transition Australia
boundary line between levels of government is blurred, as is the boundary between public and private sectors, with statutory authorities set up partly to bridge such divisions. Figure 2.� shows the main organizations involved in the health sector, and the main bodies and their functions are discussed in turn below.
Fig.2.1 Organizationalchartofthehealthsystem
Commonwealth
Public hospitals
States
Communityhealth services
Localgovernment
Specialists
Pharmacists
Generalpractitioners
Ancillaryhealth services
Publichealth services
Aged carehomes
Privateinsurance
funds
Privatehospitals
Funding
Management
27
AustraliaHealth systems in transition
2.2.1 Federallevel
The �90� Constitution regarded health care as the responsibility of the States and granted powers to the Commonwealth Government only on quarantine matters in order to prevent diseases entering Australia. The Commonwealth played a minor role in the health field over the next four decades apart from some public health and professional functions (Kewley �973). The need for a public health coordination role for the Commonwealth only became evident during the influenza outbreak around �9�8, and accordingly, the Commonwealth Department of Health was established with the agreement of the States in �92�. The Commonwealth also became involved in health research via the Federal Health Council, which was established in �926 to provide expert professional advice, and was expanded in �937 to become the National Health and Medical Research Council (NHMRC).
The Commonwealth has assumed a leadership role in health policy-making and financing, given its constitutional mandate as well as its “power of the purse”. The amendment to Section 5� (xxiiia) of the Constitution has been interpreted broadly in relation to health. Also, Section 8� allows the Commonwealth to allocate funds “for the purposes of the Commonwealth” under the appropriate legislation. In addition, Section 96 allows the Commonwealth to make grants to the States for specific purposes. Continual changes in intergovernmental relations mean that “dynamic tension” between the Commonwealth and the States is a characteristic feature of the Australian health care system.
The Commonwealth is responsible for the following functions:
to fund and administer the Medicare Benefits Schedule (subsidies to consumers for medical consultations and tests);
to fund and administer the Pharmaceutical Benefits Schedule (subsidized drug purchases);
to make payment to the States and Territories through goods and services tax (GST), through general revenue sharing arrangements, and through specific purpose payments;
to make payment to the States and Territories through the Australian Health Care Agreements (formerly known as the Medicare Agreements) (mainly for public hospital services);
to make payments to the States and Territories through the Public Health Outcome Funding Agreements (for certain public health activities);
to make direct grants to non-government organizations for health services;
to provide funds for health research;
to provide support for the training of health professionals.
•
•
•
•
•
•
•
•

28
Health systems in transition Australia
The Commonwealth Government appoints two ministers and a parliamentary secretary to the health and ageing portfolio. The Minister for Health and Ageing takes an overview role for the whole portfolio, and has specific administrative responsibility for a range of issues, including Medicare benefits, hospitals, private health insurance, the Pharmaceutical Benefits Scheme, medical workforce issues, population health, national health priorities, rural and regional health, health and medical research and biotechnology, indigenous health issues and strategic policy analysis and evaluation. The Minister for Aged Care is responsible for aged care and hearing services, as well as for stem cell research. A parliamentary secretary assists the Federal Health Minister by assuming responsibility for matters such as food policy, blood and organ donation, mental health and suicide prevention, alcohol, tobacco and illicit drugs. Health services for veterans and their dependants are the responsibility of the Minister for Veterans’ Affairs in the defence portfolio.
The Department of Health and Ageing provides policy advice to the Federal Government and manages its health and ageing programmes. It sets national health policies and subsidizes the provision of health services by State and Territory governments and by the private sector. As well as national policy and funding, the Department is concerned with public health, emergency preparedness, research and information management. It has been renamed several times over the last decade or so, with functions shifted between departments; for example, aged and community care, and Aboriginal and Torres Strait Islander health, were moved into the Department of Health and Ageing. In addition to the Canberra head office, a Commonwealth office is located in each State and Territory. Portfolio outcomes currently are pursued in conjunction with other agencies: population health and safety, access to Medicare, enhanced quality of life for older Australians, quality health care, rural health services, hearing services, Aboriginal and Torres Strait Islander health, choice through private health care and health investment. The Department has several divisions: Acute Care Division, Ageing and Aged Care Division, Audit and Fraud Control, Business Group, Health Services Improvement Division, Medical and Pharmaceutical Services Division, Office for Aboriginal and Torres Strait Islander Health, Office of Health Protection, Primary Care Division, Population Health Division, and Portfolio Strategies Division.
The Office for Aboriginal and Torres Strait Islander Health funds special programmes for Indigenous Australians and also community-controlled health services to deliver indigenous-specific primary health care.
The Therapeutic Goods Administration (TGA) is a unit of the Australian government Department of Health and Ageing that carries out a range of assessment and monitoring activities to ensure that therapeutic goods available in Australia are of an acceptable standard with the aim of ensuring that the
29
AustraliaHealth systems in transition
Australian community has access, within a reasonable time, to therapeutic advances.
The National Health and Medical Research Council (NHMRC) is the Australian Government’s main funding body for health and medical research. In addition to providing advice to the government on health, health ethics and medical research, administering research funds, and managing the peer review process for grant applications, the NHMRC publishes guidelines and information relating to health ethics and health care. The Council comprises nominees of government, professional associations, unions, universities, and business and consumer groups. The NHMRC became a statutory authority in June 2006 (see Section 3.2.3 Research and development).
Health portfolio agenciesThe Department of Health and Ageing pursues health outcomes in association with a number of other agencies in the portfolio, as outlined below.
Aged Care Standards and Accreditation Agency Limited is responsible for accrediting residential aged care homes. The agency manages the residential aged care accreditation process, promotes high-quality care and helps industry to improve service quality, monitors ongoing compliance with accreditation standards and liaises with the Department about facilities that do not meet the accreditation standards.
The Australian Institute of Health and Welfare (AIHW), a statutory statistics and research agency within the health and ageing portfolio, identifies and meets the health information needs of a range of Commonwealth and State government departments. Government agencies transmit selected data to AIHW that are then incorporated into national data sets. AIHW publishes a large number of regular and occasional reports (many of which are cited in this report) and provides information and analyses on the health and welfare of Australians and their health and welfare services.
General Practice Education and Training Limited (GPET) is a government-owned company responsible for ensuring high-quality general practice education and training, which is provided by 2� regional providers around Australia under the Australian General Practice Training (AGPT) scheme.
The Australian Radiation Protection and Nuclear Safety Agency is responsible for protecting the health and safety of people and the environment from the harmful effects of ionizing and nonionizing radiation.
Food Standards Australia New Zealand, a partnership between the Australian Commonwealth and State governments and the New Zealand Government, is responsible for developing, varying and reviewing standards for food available
30
Health systems in transition Australia
in Australia and New Zealand. It also is responsible for coordinating national food surveillance and recall systems, conducting research, assessing policies about imported food, and developing codes of practice with industry.
Other relevant national agenciesA number of organizations outside the portfolio also play an important role in the development and implementation of health policy, including government departments, statutory authorities and other interested groups. Several other federal-level bodies with direct or indirect involvement with health care are listed below.
The Department of Veterans’ Affairs pays compensation and income support, and funds hospital services, allied health and counselling and community support programmes for war veterans, widows and their dependants. In recent years the Commonwealth has moved from being a provider to a purchaser of veterans’ health care (Lyon 2000). Although the number of veterans is falling, their increasing age means that they need more health care. The Department’s �2 large repatriation hospitals (some dating from the �920s) have been either transferred to the States (six hospitals), or closed or privatized. The Department has contracts with over 40 000 health care providers. Greater priority is now being given to improving coordination of care and treatment, health promotion and mental health services.
The Department of Families, Community Services and Indigenous Affairs (FaCSIA) was created in late �998 (under a different name) bringing together income support (previously the Department of Social Security) and a range of community services into a single department. It also provides income support as well as other services for people with a significant disability. The Department is responsible for improving the lives of Australians by helping to build the capacity and well-being of individuals, families and communities. This includes: policies and programmes for families with children, carers, older people and people in hardship; people with disabilities; community support services (excluding the Home and Community Care programme); family relationship services; welfare housing and rent assistance; youth affairs (excluding income support policies and programmes); and women’s policies and programmes.
Medicare Australia (formerly the Health Insurance Commission) formerly a Commonwealth statutory authority, was established in �974 to administer the government universal health insurance scheme, and has grown to take on the administration of an extensive range of health and allied programmes. It currently administers: Medicare; the Pharmaceutical Benefits Scheme; the Family Assistance Office (in partnership with other departments); special assistance schemes (e.g. Bali 2005); the Australian Childhood Immunisation

3�
AustraliaHealth systems in transition
Register; the Australian Organ Donor Register; the Practice Incentives Program; the General Practice Immunisation Incentives scheme; the Rural Retention Program; the federal government rebate on private health insurance; and payments and claims for the Department of Veterans’ Affairs treatment accounts, Office of Hearing Services and Health Department of Western Australia. The Commission has moved from the health and ageing portfolio to the Department of Human Services.
The Department of Human Services was created in late 2004 with a view to improving service delivery and providing a whole-of-government approach, by bringing together six agencies that in total administer AU$80 billion of human services each year: Centrelink, Health Insurance Commission, Child Support Agency, Health Services Australia, Commonwealth Rehabilitation Services and Australian Hearing.
The Australian Bureau of Statistics (ABS), the national statistical agency, undertakes the five-yearly census of the Australian population as well as surveys of health and health services, while many of its other surveys provide health data. ABS publishes regular reports on many aspects of Australian society and the economy. Some of the collection of health and welfare statistics, including specific population surveys and collections data derived from administrative processes, such as causes of death data, is undertaken by the ABS (see Section 3.2.2 Information systems).
2.2.2 StateandTerritorylevel
The six State and two Territory governments fund and provide health care services. The health portfolio is important in State government administration in political and fiscal terms, typically accounting for around one-third of State recurrent budgets. Each State also has a minister responsible for health, as either a major portfolio in its own right, or the largest component of a broader “human services” portfolio, which might include related areas such as aged and community care. The States essentially are autonomous in administering health services, within the constraints of their own legislation, and within agreements with the Australian Government.
With Commonwealth financial assistance, the States are responsible for the following:
funding and administering public acute and psychiatric hospitals;
funding and providing a wide range of community and public health services, including school health, limited dental services, maternal and child health, occupational health and disease control activities, and health promotion;
registering health professionals;
•
•
•

32
Health systems in transition Australia
licensing public and private hospitals;
making health-specific payments to local governments.
The tradition of “federalism” in Australia means that the health care field has developed somewhat differently in each State, with variations in geography, policies, organizational structures, per capita expenditure, population and resource distribution and utilization rates. Arguably, health service structures and patterns in the States are converging, given the common pressures for cost containment and quality control. State health departments have been reorganized or renamed many times, depending upon the bureaucratic and political choices of the time. During the �970s, the separate administrations for hospitals, community health and mental health generally were amalgamated into “health commissions”; then in the early �980s some States separated “health” and “community” functions. In the next phase of restructuring “super departments” were created that incorporated most aspects of health and community services, but recently some States, for example South Australia, returned these functions to separate departments. The States differ on whether they combine the funding and administration of all their health services under one body, such as Area Health Boards as in New South Wales (NSW), or whether hospitals and other health services are administered through separate departmental divisions. All State health departments in the last few years have undergone major reviews of their policies, structures and programmes. Some reviews have been triggered by inquiries into allegations of clinical incompetence in hospitals (Wilson and Van Der Weyden 2005), and others have been motivated by the desire to reduce the growth of health spending and to improve quality and safety for patients.
The Australian Capital Territory (ACT) was granted self-government in �988, and the ACT government combines the functions of State and local government. ACT Health administers health services for the residents of Canberra and the surrounding area of NSW, necessitating detailed cross-border negotiations over reimbursement.
The Northern Territory Department of Health and Community Services administers health services for people across the vast geographic area of the Northern Territory. Of particular note are Aboriginal health services, remote area services and community care centres. The latter houses a range of health and community services: primary health care, visiting health professionals, public health programmes such as immunization, and domiciliary and community care services.
The NSW Department of Health decentralized delivery in the mid-�980s to nine metropolitan and eight area health service boards, but in January 2005 reduced these to eight Area Health Services (NSW Health 2004). The
•
•

33
AustraliaHealth systems in transition
department’s strategic health plan for 2000–2005 set out four key goals: healthier people, fairer access, quality health care, and better value.
Queensland Health has decentralized health delivery to 38 health service districts. Its strategic plan emphasizes prevention, health promotion and early intervention; evidence-based clinical practice; partnership with all health care providers (including private sector and non-government bodies); and managing the public health risks to Queenslanders. This department has implemented various microeconomic reforms over the last decade. In late 2005 another review of the Queensland health system was triggered by criminal charges of clinical incompetence laid against a particular surgeon and charges of failures in management at the Bundaberg Hospital. Queensland has a long tradition of free public hospitals with universal access, and the Queensland government has responded to the latest review by significantly increasing health expenditure.
In South Australia, the Department of Health was separated in July 2004 from the Department of Human Services, metropolitan hospital boards were abolished, and health administrative boundaries redrawn, but the future of country hospital boards is still unclear.
The Department of Health and Human Services in Tasmania accounts for nearly 30% of the State government budget and is one of the State’s largest employers, making health an important portfolio in State political terms.
The Department of Human Services in Victoria merged health and welfare services into one department in �996. This department takes 32% of the State recurrent budget and hence has considerable political and fiscal importance. The Department over the last decade became a purchaser rather than provider of health services, and purchasing health care from public hospitals currently takes half the department’s budget. Hospital boards were abolished in the mid-�990s and hospitals were grouped into administrative networks each with a management board. The department covers eight geographic regions, and also has eight divisions: financial and corporate, operations, policy and strategic projects, metropolitan health and aged care, rural and regional health and aged care, disability services, Office of Housing, and Office for Children.
The Health Department of Western Australia, one of the State’s largest departments, delivers health services to a sparse but diverse population across huge distances, and was reorganized after a 2004 review.
2.2.3 Localgovernment
Local governments are responsible for some public health services and for public health surveillance, but not for clinical medical services. They undertake local environmental health activities such as collecting rubbish and monitoring food

34
Health systems in transition Australia
standards; for example, environmental health officers undertake surveillance of environmental hygiene and sanitation practices to ensure compliance with State public health laws.
Local governments also are involved in disease prevention such as immunization programmes, and support maternal and child health screening centres, and some undertake health promotion activities. Statutory authorities may be responsible, across several local government areas, for the quality of piped water and for sewage disposal and drainage, for waste disposal, and for regulating air quality. The role of local government varies across the States; for example, Victorian local government is the most active in health and welfare services, including community services for older people.
2.2.4 Privatesector
Australia’s health care system has a large private sector that plays a major role in providing, and to a lesser extent, in funding health services. In 2002–2003, private sector funding accounted for nearly one-third of all health expenditure, including private health insurance expenditure and out-of-pocket payments by individuals (see Chapter 4 Financing).
“Privatization” has advanced over the last decade, covering a range of strategies, including selling public facilities to private providers. The policy thrust in most States has been to change the mix of public–private responsibilities by reducing the role of Government in service delivery and by increasing reliance on the nongovernment and private sectors. Outsourcing is common whereby “non-core” services (such as laundering, catering, cleaning and pathology services) are contracted out to the private sector. Following the New Zealand and United Kingdom reforms of the �980s, many Australian health departments experimented with a purchaser-provider split, but difficulties in purchaser–provider relationships, plus the inability to adequately specify contracts, led to many of these arrangements reverting to more traditional public sector funding arrangements by the mid-�990s. Governments also have promoted private sector competition in health service areas that previously operated as public sector monopolies; an example is the corporatization of the Australian Hearing Services (Department of Health and Aged Care �999).
The distinction between the public, private not-for-profit and private for-profit sector hospitals is increasingly blurred. For example, many public hospitals contract out tasks to private providers and take private patients. Other privatization permutations include a State government contracting with the private sector to finance the construction of a new hospital; contracting with a

35
AustraliaHealth systems in transition
private hospital to run the hospital on behalf of the State; or contracting with a private hospital to provide some services for public patients.
The majority of doctors in Australia are engaged in private practice. Private general practitioners (GPs) provide most primary care. Private medical specialists provide most ambulatory secondary health care, but also may contract their services to public and to private hospitals. Private doctors are key stakeholders, therefore, in health sector governance and have a major influence upon health care policies.
Private hospitals are significant players in the hospital field, with 30� private hospitals providing about 30% of the bed stock. The number of private hospitals grew after the introduction of Medicare in �984, remained fairly constant in terms of hospitals and beds in the first half of the �990s, and expanded their capacity in the late �990s. Private hospitals generally are smaller than public hospitals, deal with a more limited range of cases, rarely offer emergency services, and undertake a substantial amount of elective surgery. The growth of larger corporate players has given the private hospital sector greater negotiating power. Ownership now is more concentrated, with over two-thirds of all private hospital beds owned by large for-profit chains and the Catholic Church.
The diagnostic services industry grew considerably during the �990s, with the expansion of pathology services and diagnostic imaging, and corporatization increased during the �990s with mergers between companies and public listings on the Australian stock exchange (Foley 2000).
Private health insurance funds also are significant players. The current Commonwealth policy is to support the private health insurance industry, which is heavily subsidized by a tax rebate on premiums (see Section 4.�.3 Voluntary health insurance). As at 30 June 2004, there were 4� registered health benefits organizations, but six funds dominate the health insurance industry with a combined share of 76% of the market (measured by premium income) (PHIAC 2004, p. �4). The two largest are Medibank Private (which separated from the Health Insurance Commission in �997 to become a government business enterprise) and Medical Benefits Fund of Australia. The private health insurance industry is regulated by a statutory authority, the Private Health Insurance Administration Council, principally under the regulatory framework set out in the National Health Act �953 and the Health Insurance Act �973. A private insurance fund must be a Registered Health Benefit Organisation and its activities are tightly controlled; for example, insurers must accept all applicants and must not discriminate in setting premiums and paying benefits.

36
Health systems in transition Australia
2.2.5 Professionalassociationsandunions
The numerous professional associations and consumer groups that influence policy-making at federal and State level are represented on many statutory authorities and policy committees, make submissions to inquiries, are involved in certification of professionals and in quality assurance through training programmes. The main groups have peak bodies at the national level. Some examples of professional associations include the Royal Australasian College of Surgeons, the Royal Australian College of Medical Administrators, while broader professional and advocacy groups include the Public Health Association of Australia.
The Australian Medical Association (AMA) is an important actor in the policy process. Membership is voluntary, with about 50% of all practising doctors being members in 2004. The AMA supports fee-for-service payments, patient choice of doctor and the primacy of the doctor–patient relationship. The resistance to government intrusion into medical practice led the profession to oppose national insurance and subsidized medicines in the �940s and to oppose universal compulsory health insurance in the �970s (Sax �984). Doctors have swung from opponents to supporters of national health insurance, however, and from critics to collaborators in many government health programmes (De Voe and Short 2003). The government consults the medical profession, principally through the AMA and the professional colleges, on matters that may affect clinical practice and the medical workforce.
Nurse associations are well organized in Australia, the peak body being the Australian Nursing Federation (ANF). Australian nurses buried their Florence Nightingale image in the �980s when they went on strike to secure a better career structure (Gardner and McCoppin �989), and when nurse education was transferred to the university sector (Short and Sharman �995).
2.3 Decentralizationandcentralization
The delivery of health care in Australia is decentralized to the States and the private sector: the States administer and deliver many health services (principally public health and public hospital services), while local government has only limited health care functions. In the Australian federal system, the States ceded some powers to the national government at the Federation in �90�, and the Commonwealth has continued to expand its policy, funding and regulatory roles in the health care field. The division of health responsibilities between the Federal Government and the States is an ongoing issue that provokes
37
AustraliaHealth systems in transition
considerable debate and many proposals for change (see Chapter 8 Assessment of the health care system).
State health departments have been through cycles of centralization and decentralization of policy and administrative authority. State health departments in the �980s decentralized to regional health administrations, which have been retained in New South Wales but largely abolished in other States that found these an expensive layer of mini head offices. Those States covering huge areas with dispersed populations, however, such as Queensland and Western Australia, administer health services through district offices. The effect of recent reviews of State health departments, however, generally has been to return to more centralized authority structures, and to aggregate administrative functions, such as payroll, financial services and procurement, and also policy functions such as workforce strategies, clinical services and quality and safety (Dwyer 2004, Rix et al. 2005).
2.4 Populationcoverage
Medicare is available to people who reside permanently in Australia; this includes New Zealand citizens. Medicare provides the eligible population with subsidized access to the doctor of choice for out-of-hospital care, subsidized prescription drugs and free public hospital care. Visitors from countries with a reciprocal health care agreement with Australia have access to Medicare – these countries are Finland, Italy, Malta, the Netherlands, New Zealand, Norway, Sweden, the United Kingdom and the Republic of Ireland. In the cases of Ireland and New Zealand, benefits under those agreements are limited to public hospital care and prescription drugs.
2.5 Entitlements,benefitsandpatientempowerment
Medical treatment is largely subsidized and its use largely unlimited – subject to availability. Treatment as a public patient in a public hospital (either as an inpatient or as an outpatient) is free to the user. Treatment out of hospitals by general practitioners and specialists is free (if the doctor is prepared to bulk-bill), and essential pharmaceuticals are subsidized. Subsidies are available for the very extensive items listed on the Medical Benefits Schedule, and pharmaceutical subsidies for items on the Pharmaceutical Benefits Schedule. Pensioners and other concession card-holders are eligible for substantial concessions or free treatment. Generally there is no limit upon the amount of medical services
38
Health systems in transition Australia
that an individual may use (in vitro fertilization (IVF) is currently one of the few exceptions). Health care benefits are not rationed, and there is little public debate on whether or how to ration services. Public hospital services, however, in effect are prioritized through waiting lists. There are no Medicare subsidies for cosmetic surgery, private dental services, private allied health services or for complementary medicine.
2.5.1 Entitlementsandbenefits
The Medicare Benefits Schedule lists the eligible medical services and technologies for which subsidies are provided, selected over the last decade by means of an evidence-based approach (see Section 3.2.� Health technology assessment). Categories covered by Medicare include:
consultation fees for doctors, both general practitioners and specialists;
tests and examinations by doctors needed to treat illnesses, including X-rays and pathology tests;
most surgical and other therapeutic procedures performed by doctors;
eye tests performed by optometrists;
some surgical procedures performed by approved dentists;
specified items under the Cleft Lip and Palate Scheme;
specified allied health and dental care services for chronically ill people who are managed by their general practitioner under an Enhanced Primary Care plan.
The majority of Medicare expenditure is for general practice services, pathology and diagnostic imaging tests and specialist consultations.
Medicare does not cover: private hospital fees, examinations for life insurance, superannuation or membership of a friendly society, vaccinations for overseas travel, overseas medical and hospital fees, or medical costs covered by another body (such as a compensation insurer). Routine foot care, long-term care, medical services that are not clinically necessary, cosmetic surgery, dental treatment, ambulance services, home nursing, physiotherapy, occupational therapy, speech therapy, chiropractic and podiatry services, treatment by psychologists, visual and hearing aids and prostheses also are not covered (Health Insurance Commission 2004). Some of these items, however, are covered by private health insurance funds.
Doctors thus have secured a virtual monopoly over public sector payments for medical services and associated tests.
The Medicare Benefits Schedule (MBS) sets out a list of fees and charges established by the Commonwealth Government for the purpose of paying
•
•
•
•
•
•
•

39
AustraliaHealth systems in transition
benefits under Medicare. Practitioners require a provider number in order to receive rebates through Medicare. GPs have a gatekeeping role since recognized specialists can claim a higher rebate when the patient is referred by a medical practitioner. Practitioners and patients are able to look up the Medicare schedule fees and benefits via the Internet. Medicare usually pays a rebate that is equal to �00% of the schedule fee for general practitioner services, 85% of the schedule fee for other out-of-hospital services (including specialist consultations), and 75% of the schedule fee for in-hospital medical services. However, a safety net to protect patients from high out-of-pocket medical costs has been introduced for non-inpatient services, including GP visits, specialist consultations, tests and X-rays. Once an annual safety net threshold is met, Medicare covers 80% of all out-of-pocket costs over and above the rebate for the rest of the year. The Department of Veterans’ Affairs subsidizes GP and specialist services provided to eligible veterans and war widows at a higher rate than Medicare.
Doctors can choose to charge no more than the Medicare rebate, in which case Medicare will pay the benefit directly to the doctor (bulk-billing) and there is no out-of-pocket cost for the patient. Doctors are allowed, however, to charge more than the rebate, in which case their patients must pay the “gap” or difference. Bulk-billing is more prevalent for general practitioner services, with most consumers facing out-of-pocket costs for visits to private specialists. Following a decline in bulk-billing by doctors (nearly 68% of services were bulk-billed as at June 2003, down from a peak of over 80% in �996), the government increased financial incentives for GPs to bulk-bill concession cardholders and children under �6, depending on their location, and also increased the benefit paid for all GP services from 86% to �00% of the schedule fee. As a result, the GP bulk-billing rate rose to 74.9% in September 2005.
Individuals eligible for Medicare can elect to have free accommodation and medical, nursing and other care as public patients in State-funded hospitals. (Outpatient treatment also is free of charge to public patients in public hospitals.) Alternatively, they may choose treatment as private patients in public or private hospitals, with some assistance from Medicare. Under Medicare, treatment is free of charge in a public hospital as a public patient by doctors and specialists nominated by the hospital. Treatment as a private patient in a public or private hospital allows a choice of doctor. For private patients in private hospitals, Medicare will meet 75% of the schedule fee for medical services provided in hospital, with part or all of the balance being claimable from private health insurers, subject to the doctor having a contract with the insurer. The costs of hospital accommodation are not reimbursable by Medicare when treated as a private patient, but may be claimed through private health insurance.
As discussed in Section 6.5, Australians have access to a wide range of medicines under the Pharmaceutical Benefits Scheme (PBS) through subsidized

40
Health systems in transition Australia
consumer purchases of pharmaceuticals listed on the schedule. These subsidies cover most drug purchases and all “essential” drugs. Very high-cost drugs are dispensed through hospital pharmacies but otherwise the great majority of subsidized drugs are dispensed through private community-based pharmacies. The use of generic drugs is strongly supported by the Australian Government, with several policies introduced to encourage the use of generics, for example, consumers in some cases pay more if they want a particular proprietary brand.
The PBS subsidizes the purchase of pharmaceuticals on its approved list for two groups: general beneficiaries, and concessional beneficiaries (holders of pensioner and other entitlement cards). Concessional cardholders (mainly pensioners) pay a lesser charge than the general public. General consumers are required to pay a co-payment of AU$ 28.60 on each prescription, and for concessional cardholders the co-payment is AU$ 4.60 per prescription (at January 2005). The PBS sets the cost of pharmaceuticals for consumers (indexed to movements in the Cost Price Index). The scheme also includes a patient/family safety net to limit annual expenses on pharmaceuticals covered under the PBS. After reaching the threshold (currently AU$ 874.90 in a calendar year for general consumers, AU$ 239.20 for concessional beneficiaries), general consumers pay for further prescriptions at the concessional co-payment rate, while concession cardholders receive all further prescriptions free (Department of Health and Ageing 2005a).
2.5.2 Patientempowerment
The peak organizations for consumer groups are the Australian Consumers’ Association and the Consumers’ Health Forum. Consumer groups are most active in relation to specific chronic illnesses, however, such as the Stroke, Heart, Cancer and Diabetes Foundations, HIV/AIDS, mental health and reproductive rights, but many of these are provider rather than consumer-driven. These groups are active in research, prevention and treatment, and in policy advocacy (Short �998).
Patient rights are a well-accepted principle in the Australian health care system. The consumer movement, however, prefers the terms “consumer” or “user” rather than the more passive “patient”. The consumer movement has helped bring about significant changes in attitudes on the part of health providers, who now are expected to improve patient/customer relations, conduct patient satisfaction surveys, draw up patient “bill of rights” or charters, and set up informal and formal grievance procedures. The States are required (under the Australian Health Care Agreements) to ensure that public sector hospitals publish patient charters, while the States must maintain complaints bodies
4�
AustraliaHealth systems in transition
independent of the public hospital system. Legislation in each State requires that patients be asked to give informed consent before any major procedure. In the public sector, area health boards and hospital boards have one or more citizen representatives.
Patient choice is also a well-accepted principle. Individuals are free to choose which general practitioner they wish to consult, restricted only by availability. However, they need to obtain a referral from a general practitioner before consulting a specialist physician or surgeon. Patients may consult more than one general practitioner, since there is no requirement to enrol with only one practice. Patients may also exert a choice over the referral made by their general practitioner to a specialist or to a hospital. Patients can also choose the private hospital they wish to attend, assuming they are prepared to pay. Patients who wish to claim private hospital attendances on their private health insurance, however, face incentives to choose hospitals that have entered into purchaser–provider agreements with their funds in order to avoid out-of-pocket payments for hospital stays (ACCC 2000, p. �33).
Health information is widely recognized as an important element of consumer empowerment. HealthInsite, an Internet gateway launched in April 2000, is designed to provide consumers and health professionals with easy access to reliable and relevant information about health and wellbeing. Progress is being made towards developing a national network of electronic health records for use by health providers and consumers, and many local and national initiatives exist to increase consumer access to health information and statistics.


43
AustraliaHealth systems in transition
3.1 Regulation
The term regulation is used here in the general sense, as meaning much the same as governance (including planning) in steering the flow of events, which might be done by government or non-government actors,
and through a variety of mechanisms ranging from persuasion to enforcement (Braithwaite et al 2005). In a second and narrower definition, regulation refers to any form of direct intervention by government or its actors in steering the economy. In the third and narrowest definition, regulation is promulgated through rules, often by a specialist public agency, accompanied by mechanisms for monitoring and enforcing compliance. Governments (at both national and regional level) can exert regulatory leverage over the health system in four ways: funding, legislation, administrative authority, and professional authority.
In the Australian health sector, with its division of powers and responsibilities within a federal system of government, and many public and private providers and professional groups, the ability of any one body to plan and regulate is limited. No one regulatory actor has the power or the knowledge to ensure that all the necessary actions are taken, for example, to reduce the burden of disease, or to improve the safety of health care for patients. Thus the concept of “networked governance” is particularly apt in the governance of Australia’s health care system with its many stakeholders and split governmental powers (Braithwaite et al. 2005). Governments at both Commonwealth and State levels, therefore, use numerous consultative councils, and have set up councils on safety and quality with broad memberships.
Commonwealth and State governments all issue health plans, both comprehensive and on specific areas. National health plans generally require agreement between the Commonwealth and the States, as well as key
3 Planningandregulation

44
Health systems in transition Australia
professional groups and the private sector. One such intergovernmental example is the National Health Priority Areas, which are agreed by the Australian Health Ministers Conference (see Section 6.� Public health). This initiative aims to focus public attention and national and State policies on those areas that contribute significantly to the burden of disease and injury, but are amenable to interventions (Australian Institute of Health and Welfare 2004a).
Regulatory activity in functional areas of the health sector has concentrated upon funding, restructuring public sector administration (e.g. devolution and mergers), regulation of drugs and devices, regulation of facilities, licensing of staff, occupational health and safety for staff, and the supply and training of health professionals. These areas are all subject to regulatory authorities with enforcement powers (the third meaning of regulation). Regulation of clinical performance has only emerged on the public agenda in the last few years, however, being traditionally left to self-regulation by professional groups, rather than being subject to external regulatory bodies. More attention now is being paid to patient safety, however, after a study published in Australia in �995 estimated that at least �0% of patients in Australian hospitals (similar to other OECD countries), experienced an adverse event, that about half these errors were avoidable, and that �–2% of patients suffered serious consequences including death (Wilson et al. �995, Runciman et al 2000).
Regulatory activities in the health sector, in the broad sense of regulation, are carried out by a variety of actors: the government (Commonwealth, and the States and Territories), and agents of the State or other authoritative bodies (e.g. statutory medical boards), as well as non-government sectors. Non-government actors include the non-governmental organizations (NGOs), quasi-autonomous non-governmental organizations (QUANGOs), industry groups (e.g. an association of hospitals), professional groups (e.g. the Australian Medical Council), employers (e.g. public or private hospitals), the market (e.g. the private health insurance industry), and the public through consumer groups or individual patients.
3.1.1 Regulationandgovernanceofthird-partypayers
Health care governance over the last decade in Australia has been concerned with microeconomic reforms intended to contain rising health costs, improve structural efficiency, maintain the private sector, improve technical and allocative efficiency, and to implement new forms of public sector management. The health sector has been prompted in this by the National Competition Policy from �995, which extended competitive conduct rules to all businesses including government business enterprises, and by the Productivity Commission,
45
AustraliaHealth systems in transition
an independent statutory body, which advises governments on aspects of microeconomic reform.
The Council of Australian Governments (COAG), which operates under the chairmanship of the Prime Minister, is the peak intergovernmental forum in Australia. It was set up in the early �990s prompted by the Premiers’ Conferences in response to tensions in intergovernmental relations and in order to address gaps and overlaps in functional responsibilities in the federal system. It has representation from the Australian Government and each of the States and Territories and addresses broad agendas as well as fiscal federalism. In addition to COAG, other Commonwealth–State Ministerial Councils facilitate consultation and cooperation between governments in specific policy areas. They initiate, develop and monitor policy reform, and solve problems where possible in areas such as energy, water, regional development, workplace relations, housing, consumer and environmental issues, and Aboriginal and Torres Strait Islander affairs.
The Australian Health Ministers’ Conference (AHMC) is the key intergovernmental body for the health sector, comprising the Health Ministers of Federal and State governments (and includes the Minister of Health from New Zealand). It aims to ensure a consistent and coordinated national approach to health policy development and implementation. The meeting provides an annual mechanism for agreeing upon collaborative action, and thus is a coordinating mechanism whereby matters of mutual interest concerning health policy, services and programmes can be discussed and public sector health policy direction can be determined. The associated Australian Health Ministers’ Advisory Council (AHMAC), whose members are the heads of the health authorities of the Federal and State governments (and the CEO of the Ministry of Health in New Zealand), is the primary national body that advises the Health Ministers, and facilitates the participation of governments in national programmes, thereby achieving a degree of uniformity.
Funding is a key regulatory lever for governments since they fund nearly 70% of total health expenditure. The Commonwealth Government is the major funder (about 45% of total health expenditure), and hence is also a policy-maker, planner and regulator. The Commonwealth funds rather than provides health services (“steers rather than rows”), and the “power of the purse” gives it considerable regulatory power. The Commonwealth funds three key health areas; medical benefits, pharmaceutical benefits and public hospitals, as well as aged residential care. The Commonwealth potentially has some influence over private general practitioners and specialists deriving from its payments to doctors under the Medicare Benefits Schedule. This sets out the schedule fee for a range of services for which the Commonwealth will pay medical benefits. The Pharmaceuticals Benefits Scheme makes the Commonwealth an

46
Health systems in transition Australia
influential stakeholder in the pharmaceutical sector (see Section 3.2.� Health technology assessment).
The legislative authority of the Commonwealth derives from the Constitution: the main pieces of legislation include the �946 Hospital Benefits Act, the �950 Pharmaceutical Benefits Act, the �953 National Health Act, and the �997 Private Health Insurance Incentives Act (see Box 7.� on p. ��7 for a list of legislation).
Administrative authority is wielded by the Commonwealth through increasing use of bilateral intergovernmental programmes, with agreements signed by all parties, such as the Australian Health Care Agreements, and the National Health Priority Areas. The Australian Health Care Agreements are negotiated every five years, whereby the Commonwealth provides prospective block grants to the States for public hospitals, so that State departments of health are in effect the third-party payer of public hospitals. The current agreements (2003–2008) cover respective government responsibilities, the terms of the financial assistance, patient eligibility and charges (public inpatients must receive free treatment), and financial and performance standards. The current agreements, for example, require the States to publish information on hospital performance (the indicators include information on waiting times but not clinical information such as patient outcomes). The administration of health care services otherwise is primarily a matter for the States and Territories.
The Private Health Insurance Administration Council, a national independent statutory authority, regulates the private health insurance industry within the legislative framework, and provides statistical information to government.
The Auditor-General for the Commonwealth, and also in each of the States and Territories, may conduct an audit on aspects of the health care system. The Victorian Auditor-General in 2005, for example, issued a critical report on the management of patient safety in Victorian hospitals (Auditor-General Victoria 2005).
3.1.2 Regulationandgovernanceofproviders
The regulation and governance of providers is carried out at both Commonwealth and State level and by a variety of public and private bodies. This makes for blurred responsibilities and lines of authority and barriers to implementation of agreed policies. Critics therefore claim that no one governs the Australian health care system, although it is not necessarily feasible nor desirable that one player should.
The Australian Council on Safety and Quality in Health Care, established by the Australian government Health Minister and all State health ministers, ran

47
AustraliaHealth systems in transition
from January 2000 to December 2005, and led national efforts to improve the safety and quality of health care for patients. A policy advisory body, it reported annually to the Australian Health Ministers’ Conference, undertook a large body of work, and significantly raised awareness on patient safety issues. The terms of reference stressed its national leadership role and partnerships with public and private sector stakeholders. The Council had an independent chair, and about 30 members including a nominee from each State, as well as clinicians, consumers, quality experts, private and public health facility chief executives, and a representative from the New Zealand Ministry of Health. The Council also worked closely with a forum of State officials. (For the new Australian Commission on Safety and Quality in Health Care and future developments, see Section 7.2.3 Quality and safety.)
Medicare Australia (previously the Health Insurance Commission see Section 2.2.�) is the national authority responsible for processing and dispensing benefits, primarily the Medicare Benefits Scheme and the Pharmaceuticals Benefits Scheme. It runs a comprehensive compliance programme that monitors and investigates fraud and over-servicing by doctors and pharmacists. While the Commission generally invokes softer sanctions, with counselling and peer review undertaken through its Professional Services Review Scheme, in 2004–2005 it referred nine medical practitioners for fraud to the Director of Public Prosecutions.
State and Territory health departments (as previously discussed) administer much of the health care system, particularly public hospitals and public health. Health legislation in each of the States gives a legislative basis for a health department to exert planning and regulatory power, if they choose, directly over government providers, and through funding contracts with other public and sometimes private sector providers. These providers include public and private hospitals, day hospitals, and community health centres.
Hospital governance is a matter for the States. Pressures to reconfigure public sector hospitals and to improve cost-efficiency have prompted new models of hospital management. Hospitals in most States previously were semi-autonomous organizations with appointed boards, but several States recently abolished hospital boards in order to bring hospitals under more direct State control and in some cases to pool health funds under area boards. New South Wales has been unusual in that hospitals boards were abolished in the mid-�980s, with hospitals brought under an area health board and its chief executive officer. In Victoria, a hospital funding crisis and the need to redistribute hospital beds from inner to outer urban areas, prompted the State in �995 to group 35 Melbourne metropolitan hospitals into seven metropolitan networks, while nine hospitals (mainly small community hospitals) were closed or merged

48
Health systems in transition Australia
(Corden and Luxmore 2000). Since these networks resulted in an expensive layer of management, further restructurings and reductions in networks have occurred.
Hospital licensing of public and private sector hospitals is done by the States under their legislative arrangements, and is required by the Commonwealth for payment of Medicare benefits and private insurance benefits.
Registration of professionals is the responsibility of statutory registration boards in each State, with agreements for mutual recognition across States. The various pieces of legislation in each jurisdiction cover general practitioners, medical specialists and most allied health professionals (see Section 5.2.4 Registration/licensing). The professional registration boards also investigate allegations of malpractice and can invoke a series of disciplinary actions, ranging upwards in severity to revoking a licence to practise.
Accreditation of facilities is offered by the Australian Council on Health Care Standards, the main accreditation body for hospitals established as an autonomous body in �974, which also advises health facilities on quality assurance procedures. Accreditation is voluntary but most large hospitals seek accreditation, and several States now require their public sector hospitals to seek accreditation. There are financial incentives since private insurers pay higher reimbursement rates to accredited facilities. Hospitals seeking accreditation must, as well as meeting other criteria set out in the extensive EQuIP manual, show that they undertake clinical review procedures. Accreditation is awarded for up to four years, depending upon how well the criteria are met. From January 2003, the agency moved from a developmental to an assurance approach by requiring applicants to meet mandatory core criteria. In the 2005 round of accreditation across 640 health facilities, 26 hospitals were given 60 days to remedy problems or lose accreditation. Other accreditation agencies include the Quality Improvement Council that offers accreditation mainly to community health and welfare agencies. The Aged Care Standards and Accreditation Agency, a statutory national agency set up under the Aged Care Act �997, accredits residential aged care, which is mandatory for organizations seeking Commonwealth subsidies. The Australian General Practice Accreditation Ltd (AGPAL) is the main accreditation body for general practices (against standards set by the Royal Australian College of General Practitioners), while the National Association of Testing Authorities (NATA) accredits laboratories. Other bodies, such as the International Standards Organisation (ISO), also are involved in accrediting or certifying other parts of the health care system, such as radiology and optometry, and also procedures and products.
Products regulation is undertaken by the Therapeutic Goods Administration (TGA) in the Commonwealth Department of Health and Ageing, which
49
AustraliaHealth systems in transition
examines the safety and efficacy of products, diagnostic treatment devices, and pharmaceuticals (see Section 3.2.� Health technology assessment). It also regulates the safety of blood and tissues under the Therapeutic Goods Act �989.
Inquiries and investigations are one-off actions in response to a serious event or “medical scandal” with several public inquiries in recent years, for example, the King Edward Memorial Hospital in Western Australia, the Campden and Campbelltown hospitals in New South Wales, and the Bundaberg Hospital in Queensland. The coroner in each State undertakes investigations into unexplained deaths including those in hospital, and may make recommendations that relate to people or systems failures, but generally has no power to ensure that the health department or a hospital takes action to prevent future such events. Health departments and hospitals now undertake internal “root cause analyses” of serious adverse events in hospitals. The success of these investigations in learning lessons for the future depends partly on achieving systemic and cultural changes that promote “a safety culture rather than a blame culture”. The Commonwealth and most States therefore have enacted legislation that provides statutory immunity for material from internal investigative committees being called in court proceedings.
Patient complaints may be addressed by an internal procedure such as in a hospital, by the professional registration board, through the courts, or by commissioners and ombudsmen. All States have an independent and statutory health complaints commissioner. If the complaint is upheld, the commissioner usually seeks a resolution by conciliation, but also has investigative power and the power to determine a remedy. There is also a Private Health Insurance Ombudsman at the national level set up as a statutory body who addresses complaints about insurance matters. Patients may take complaints of medical malpractice to court under Australia’s system of common law through the tort system. A substantial increase in claims over the last decade, and large awards by the courts, contributed to a large rise in medical indemnity insurance premiums for doctors, particularly obstetricians, and the bankruptcy of some professional indemnity funds. Australia does not have no-fault schemes covering malpractice claims, as does New Zealand. All States in recent years have enacted legislation that limit the ambit of claims by patients and also set a cap on the damages that a court can award.
Monitoring and reporting. There are no national mandatory data registries in relation to quality and safety, or reporting systems on adverse events, but rather a proliferation of initiatives at both national and State level. The Health Ministers in 2004 agreed, however, to promote eight key patient safety initiatives in public hospitals, including monitoring and reporting on serious adverse events, so-called “sentinel events” and a reporting framework is being

50
Health systems in transition Australia
developed. National-level committees include the Adverse Drug Reactions Advisory Committee that operates and analyses voluntary reporting by health professionals and consumers. Some States also have their own data registries, such as on surgical or perinatal mortality, as do some of the specialist Colleges, such as the ANZ College of Anaesthetists. The Australian Health Ministers’ Conference has urged each State to put in place a reporting system for the serious adverse events (sentinel events) that occur in hospitals. Several States already require their public sector hospitals to use an incident reporting system, such as the Australian Incident Monitoring System (AIMS), to report adverse events, and they also aggregate de-identified data at the State level. These reporting systems, however, are voluntary, not mandatory, as far as staff reports are concerned, and there is substantial under-reporting in many hospitals.
Information and learning. Information dissemination and learning approaches are the main strategies used by a variety of bodies, including government agencies, to improve the performance of health care. A few promising initiatives are noted here. The National Institute of Clinical Studies (NICS), funded by the Commonwealth Department of Health and Ageing, was established in 2000 to strengthen the evidence base for clinical practice, by disseminating evidence on the best treatment for conditions, and by seeking to improve the uptake among practitioners of such evidence. Numerous organizations, including the specialist colleges, produce clinical guidelines or protocols on the treatment of specific conditions. Another important source for evidence-based medicine is the Australasian Cochrane Centre, which puts out systematic literature reviews in order to inform health care decisions. Several research and development hospital collaborations on patient safety are currently underway and have produced promising results, as in the case of the Medication Safety Breakthrough Collaborative, which enlisted a national group of hospitals in designing, testing and reporting to each other on ways to improve medication safety within their hospital.
3.1.3 Regulationandgovernanceofthepurchasingprocess
The health sector in Australia generally does not resemble a purchaser–provider model in the sense that purchasers contract for specific amounts of health care for specific patients. One exception is Veterans’ Affairs that moved over the last decade to being a purchaser rather than provider of health care. State disability services also contract out for many services, mainly to NGOs and to a lesser extent to private agencies, as do State welfare departments. State health departments also may be considered as third-party payers in that they

5�
AustraliaHealth systems in transition
negotiate funding agreements with area health boards or with hospitals and other health providers.
Australia has a mixed model of health care funding. Some aspects might be described as an integrated model, with health care providers directly employed by State governments (in the case of some but not all public sector hospitals). Other independent health care providers, such as private hospitals and laboratories, are contracted by third-party payers (State governments or State Area Health Boards). General practitioners who provide the bulk of community health care are independent practitioners whose fee-for-service relationship is with their patients (who claim from Medicare directly or via the GP).
With hospital funding, the Commonwealth caps its expenditure for a five-year period through the Australian Health Care Agreements. The States have sought cost-efficiencies through financial agreements with each hospital or hospital grouping that involves negotiated prospective budgets and casemix funding (see Section 4.4.2 Paying for health services).
Price/volume agreements have been reached with pathologists and radiologists. Fee adjustments include a new schedule of fees and remove the right of pathologists to claim Medicare benefits for tests they order themselves. Supplier restrictions were applied by reducing the number of collection centres for pathology. An episode cap was introduced whereby Medicare benefits are paid only for the three most expensive tests ordered per episode. The Commonwealth now has capped total expenditure at an agreed growth rate in four agreements with various professional groups (Department of Health and Ageing 2004a).
3.2 Planningandhealthinformationmanagement
Australia has a comprehensive health statistics system and considerable information is collected and analysed. Australia has also participated in efforts by the World Health Organization and the OECD to measure the effectiveness of its health care system (see Section 8.� The stated objectives of the health system). Considerable progress has been made in Australia in developing performance indicators but, as in other OECD countries, the measurement of health outcomes remains much more difficult (Hurst and Jee-Hughes 2000).
State health departments produce regular strategic plans, including for specific aspects such as hospital services. The Australian Health Ministers Advisory Council (AHMAC) aims to coordinate major components of the

52
Health systems in transition Australia
health care system and sets up many national committees on particular issues. Examples of national bodies established by the Council include:
The Australian Commission for Safety and Quality in Health Care, which leads national efforts to improve the safety and quality of health care;
The National Public Health Partnership, which plans and coordinates national public health activities; and
The National Health Information Group, which coordinates and directs the implementation of the National Health Information Agreement.
National health workforce policy and planning is coordinated by the Australian Health Workforce Advisory Committee and the Australian Medical Workforce Advisory Committee.
3.2.1 Healthtechnologyassessment
In Australia, the process of health technology assessments (HTAs) for pharmaceuticals is well established, with safety and efficacy regulations introduced in the early �960s, and Australia being the first country to introduce a mandatory requirement for cost-effectiveness evaluations of new pharmaceuticals (Productivity Commission 2005a). However, the introduction of formal HTA processes for other medical technologies (such as procedures and devices) is more recent, occurring in the early �980s. Health care information technology currently does not undergo HTA processes (Productivity Commission 2005a).
HTA assessments in Australia are undertaken by a variety of agencies and committees, at the national, State, individual hospital level, and in the private sector. Key agencies involved in the assessment of pharmaceutical products at the national level are the: Therapeutic Goods Administration (TGA); the Pharmaceutical Benefits Advisory Committee (PBAC); and the Australian Technical Advisory Group on Immunisation. Key agencies involved in the assessment of procedures, prostheses and devices at the national level include: the TGA; the Medical Services Advisory Committee; the Australian Safety and Efficacy Register of New Interventional Procedures Surgical; and the Prostheses and Devices Committee (Productivity Commission 2005a, p. �83).
The TGA tests the safety and efficacy of all therapeutic goods for sale in Australia (pre- and post-market testing and surveillance). Once TGA approval has been granted for the marketing of a pharmaceutical, the sponsor (usually the manufacturer) may apply to PBAC for government subsidization (listing the drug on the Pharmaceutical Benefits Scheme (PBS)). The PBAC makes
•
•
•

53
AustraliaHealth systems in transition
recommendations to the Minister in relation to products that should be available for subsidy under the PBS. Following amendments to the National Health Act �953 (Cwlth) in the late �980s, PBAC is required to consider the effectiveness and cost of a drug proposed for PBS listing compared to other therapies or no therapy. If PBAC recommends a listing, the Pharmaceutical Benefits Pricing Authority uses PBAC’s advice to formulate a recommendation to the Minister on the price at which the drug should be listed for subsidy (see Section 6.5 Pharmaceutical care).
Sponsors of a product that receive a negative recommendation can re-submit usually at a lower price, or with new data. While appeals against PBAC recommendations are not allowed, appeals against the PBAC recommendation process are permitted under the Administrative Decisions (Judicial Review) Act �977 (Cwlth). Additionally, a new review mechanism for PBAC recommendations is being implemented under the Free Trade Agreement signed by Australia and the United States in 2004 (Productivity Commission 2005a, p. 236).
The Medical Services Advisory Committee (MSAC) was established in �998 to make recommendations to the Minister on whether a new procedure, test or device should receive public funding. MSAC advice is also utilized by the States in relation to new technologies in public hospitals. The MSAC considers safety, effectiveness and cost-effectiveness of new and existing medical technologies in response to requests by sponsors and governments, and in 2004 completed around 70 evaluations (Productivity Commission 2005a, pp. �89–�90).
Once manufacturers or suppliers of prostheses and medical devices have obtained listing on the Australian Register of Therapeutic Goods (ARTG) they can apply to list the item on the Prostheses Schedule. The Prostheses and Devices Committee (PDC) then assesses and makes recommendations to the Minister on the listing of these products, and the appropriate benefit levels (Productivity Commission 2005a).
As insurers of a range of hospital, medical services and some pharma-ceuticals, private health insurers are increasingly utilizing HTA processes in decisions over the introduction of new medical technologies. While funds primarily rely on government HTA processes, some undertake assessments of new drugs, services and devices (e.g. coronary stents). These are usually undertaken when determinations are needed prior to the outcomes of government HTAs or for low-volume technologies that are not assessed by the national committees (Productivity Commission 2005a, p. �94).

54
Health systems in transition Australia
3.2.2 Informationsystems
Since its inception in �993, the National Health Information Agreement has created a framework for cooperation between government agencies that collect administrative data on health (Australian Government, State and Territory health agencies, the Australian Bureau of Statistics, the Australian Institute of Health and Welfare, and the Health Insurance Commission). In July 2003, the Australian Health Ministers Council endorsed the creation of two new bodies: the Australian Health Information Council as an advisory body, and the National Health Information Group, to carry out work on a variety of national health information initiatives, and a set of national health information development priorities was endorsed by the Australian Health Ministers Advisory Council (AHMAC) (Australian Institute of Health and Welfare 2004a, p. 333). (See also Section 5.�.2 Information technology.)
The main national statistical collection agencies for health data in Australia are the ABS and the Australian Institute of Health and Welfare (AIHW). Australia’s primary statistical collection agency, the Australian Bureau of Statistics, collects information directly from the public and provides survey-based statistics and information on the health status of the Australian population, which involves close liaison with major agencies in the health field. The primary functions of the AIHW relate to the collection, production and publication of health-related and welfare-related information and statistics, mainly obtained from administrative data collections. State health departments also collect and publish information on population health issues, such as cancer statistics, regional health service comparisons, and policy issues of the day.
Statistical data on health in Australia are obtained from a variety of sources including administrative data systems such as for hospitals and disease registers, as well as surveys such as household and telephone surveys. A number of national minimum data sets that support performance indicators also have been specified, and administrative systems are designed and organized to generate this data. The ABS, and health departments to a lesser extent, conduct major health surveys at regular intervals to provide time series data on the health conditions and behavioural health risk factors of Australians.
3.2.3 Researchanddevelopment
Australia spends an estimated 2.3% of the national health budget on research (Australian Institute of Health and Welfare 2004b, p. 84), and substantial health research and development funding comes from public funds.
The National Health and Medical Research Council (NHMRC), a statutory authority, is a major funding body for health and medical research. Following

55
AustraliaHealth systems in transition
release of the Health and Medical Research Strategic Review in �999, which found Australia had fallen behind comparable developed economies in its relative funding of medical research, the Commonwealth Government increased funding to the NHMRC effectively doubling the annual budget to nearly AU$4�2 million by 2005 (Bennett and Vitale 2005). The NHMRC consolidates within a single national organization the functions of research funding and development of advice. It brings together and draws upon the resources of all components of the health system, including governments, medical practitioners, nurses and allied health professionals, researchers, teaching and research institutions, public and private programme managers, service administrators, community health organizations, social health researchers and consumers. The NHMRC has four statutory obligations: to raise the standard of individual and public health throughout Australia; to foster the development of consistent national health standards; to foster national medical and public health research and training; and to address health ethical issues. NHMRC funds are awarded through a variety of schemes on the basis of excellence as assessed by peer review, the research being undertaken in universities and in medical research institutes.
The Australian Research Council (ARC) was established as an independent body, now under the Australian Research Council Act 200�, which reports to the Minister for Education, Science and Training, and is the primary source of advice to the government on investment in the national research effort. Its mission is to advance Australia’s capacity to undertake quality research that brings economic, social and cultural benefit to the Australian community. The ARC funds research and research training in all fields of science, social sciences and the humanities. ARC funding increased by AU$736 million, doubling the funds for research by 2006. The ARC funds research on health issues but not clinically oriented research (which comes under the NHMRC).
3.2.4 Australia’sbiosecurityplanning
Australia’s response to biosecurity threats have been expanded since the Sydney Olympics in 2000, and strengthened following global events such as the �� September 200� attacks in the United States, the Bali bombings in 2002 and 2005, and the outbreak of severe acute respiratory syndrome (SARS), and also avian influenza. Public health authorities have developed a comprehensive health response to deal with biosecurity threats, including communicable disease emergencies such as SARS or pandemic influenza, as well as a bioterrorist incident such as the release of a chemical, biological or radiological agent or other mass casualty disaster. These activities are coordinated at the national level by the Australian Government’s Department of Health and Ageing inpartnership
56
Health systems in transition Australia
with Emergency Management Australia and other Commonwealth departments and agencies.
The Health Protection Committee (first established in February 2003) plans national emergency health responses and includes Commonwealth, State and Territory Chief Medical Officers, as well as representatives from Emergency Management Australia and the Australian Defence Force (Commonwealth of Australia 2004b). Lessons in emergency preparedness were learned from the Indian Ocean tsunami in 2004–2005.
An “Australian Management Plan for Pandemic Influenza” to build national preparedness and capacity was developed June 2005 by the Department of Health and Ageing and the National Influenza Pandemic Action Committee. Measures taken include enhancing national infectious diseases surveillance systems, increased border controls including thermal scanning, the procurement of stockpiles of antiviral therapies, and measures to secure supplies of vaccine through contract arrangements with two vaccine producers. Australia has also supported regional initiatives to enhance diagnostic laboratory capacity in developing countries in South East Asia and has supported the development of an independent WHO Collaborative Centre for Reference and Research on Influenza (Department of Health and Ageing 2005b).
The National Emergency Medicines Stockpile has been expanded creating a national strategic reserve of essential vaccines, antibiotics, antiviral drugs and antidotes. It is designed to supplement existing medical stocks kept in the Australian hospital system to ensure adequate supplies in response to an incident in Australia involving chemical, biological or radiological agents. Other biosecurity measures include enhanced laboratory capacity for diagnosis of infections such as small pox, and measures to ensure the safety and security of Australia’s food supply (Commonwealth of Australia 2004b).
The Commonwealth has announced a range of new biosecurity initiatives, which are discussed in Section 6.�.

57
AustraliaHealth systems in transition
4.1 Revenuemobilization
Australia has a mainly tax-funded health care system financed through general taxation, including a small statutory insurance levy, and private payments.
4.1.1 Mainsourceoffinance
In 2003–2004, nearly 70% of total health revenue came from public sources, mainly from taxation (Table 4.�), while the remaining 30% was derived from private sources (Australian Institute of Health & Welfare 2005a, pp. �8, 33). Commonwealth funds for health are raised principally through general taxes. This includes the Medicare levy calculated at �.5% of taxable income for those above a certain income threshold (low-income earners and prescribed persons are exempt), with an additional �% surcharge for high-income earners who choose not to buy private insurance cover for hospital treatment. In recent years, revenue raised by the Medicare levy has been equal to about �8% of total Commonwealth health expenditure, and about 8.5% of total national health expenditure (Australian Institute of Health & Welfare 2004b).
From � July 2000, Australia implemented a new tax system that abolished some taxes and replaced them with a �0% goods and services tax (GST). The States now receive all GST revenue (estimated at AU$37.3 billion in 2005–2006) to assist them in providing essential services that are their responsibility, including health services. The revenue base of State governments also consists of taxes, including on property and on employers’ payrolls.
4 Financing
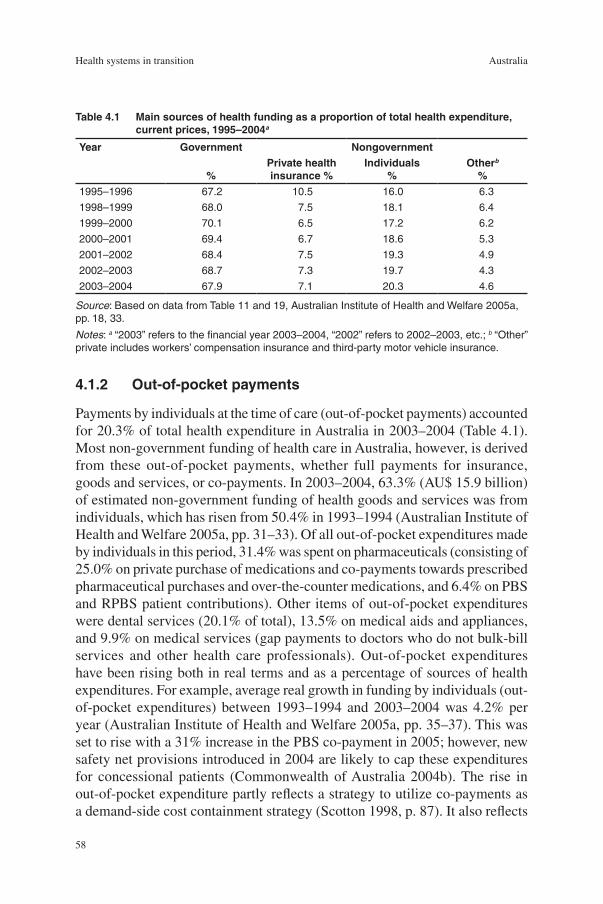
58
Health systems in transition Australia
4.1.2 Out-of-pocketpayments
Payments by individuals at the time of care (out-of-pocket payments) accounted for 20.3% of total health expenditure in Australia in 2003–2004 (Table 4.�). Most non-government funding of health care in Australia, however, is derived from these out-of-pocket payments, whether full payments for insurance, goods and services, or co-payments. In 2003–2004, 63.3% (AU$ �5.9 billion) of estimated non-government funding of health goods and services was from individuals, which has risen from 50.4% in �993–�994 (Australian Institute of Health and Welfare 2005a, pp. 3�–33). Of all out-of-pocket expenditures made by individuals in this period, 3�.4% was spent on pharmaceuticals (consisting of 25.0% on private purchase of medications and co-payments towards prescribed pharmaceutical purchases and over-the-counter medications, and 6.4% on PBS and RPBS patient contributions). Other items of out-of-pocket expenditures were dental services (20.�% of total), �3.5% on medical aids and appliances, and 9.9% on medical services (gap payments to doctors who do not bulk-bill services and other health care professionals). Out-of-pocket expenditures have been rising both in real terms and as a percentage of sources of health expenditures. For example, average real growth in funding by individuals (out-of-pocket expenditures) between �993–�994 and 2003–2004 was 4.2% per year (Australian Institute of Health and Welfare 2005a, pp. 35–37). This was set to rise with a 3�% increase in the PBS co-payment in 2005; however, new safety net provisions introduced in 2004 are likely to cap these expenditures for concessional patients (Commonwealth of Australia 2004b). The rise in out-of-pocket expenditure partly reflects a strategy to utilize co-payments as a demand-side cost containment strategy (Scotton �998, p. 87). It also reflects
Table4.1 Mainsourcesofhealthfundingasaproportionoftotalhealthexpenditure,currentprices,1995–2004a
Year Government Nongovernment
%Privatehealthinsurance%
Individuals%
Otherb
%1995–1996 67.2 10.5 16.0 6.3
1998–1999 68.0 7.5 18.1 6.4
1999–2000 70.1 6.5 17.2 6.2
2000–2001 69.4 6.7 18.6 5.3
2001–2002 68.4 7.5 19.3 4.9
2002–2003 68.7 7.3 19.7 4.3
2003–2004 67.9 7.1 20.3 4.6
Source: Based on data from Table 11 and 19, Australian Institute of Health and Welfare 2005a, pp. 18, 33.
Notes: a “2003” refers to the financial year 2003–2004, “2002” refers to 2002–2003, etc.; b “Other” private includes workers’ compensation insurance and third-party motor vehicle insurance.

59
AustraliaHealth systems in transition
the shift of some health care from inpatient to ambulatory health care, and from the public to the private sector.
4.1.3 Voluntaryhealthinsurance
Members of private health insurance funds can insure against the costs of treatment and accommodation as private patients in hospitals, for the gap between the Medicare benefit and fees charged for inpatients, and for ancillary services. Legislation since �995 has allowed insurance funds to contract with hospitals and individual practitioners, although this initially was opposed by the medical profession who saw it as a threat to their freedom to set fees (Foley 2000). In late 2005, measures were introduced to strengthen portability of policies, with people who transfer their private health insurance between funds no longer having to re-serve waiting periods.
Primary medical care provided by doctors is not covered by private insurance. Since the introduction of Medicare in �984, private health insurance funds are not permitted to cover the cost of out-of-hospital medical services provided by medical practitioners, including any gap between the actual fee charged and the rebate from the Health Insurance Commission (which constitutes a consumer co-payment). However, the cost of some ancillary items not available under Medicare are covered to some extent by private health insurance funds, such as dental and optical services (e.g. glasses and contact lenses), physiotherapy, chiropractic and appliances, and prescribed medicines not covered by the Pharmaceutical Benefits Scheme.
The proportion of total health expenditure funded through private health insurance fell after the introduction of Medicare in �984, from nearly �7% of total health expenditure to just 7.3% in 2002–2003 (Australian Institute of Health and Welfare 2004b, p. 24). The drop in membership (from one-half to one-third of the population) prompted the government to set up an inquiry in �996 into the private health insurance sector (Industry Commission �997). The inquiry attributed the drop in membership and rising insurance premiums to “adverse selection”, since the privately insured population tend to be older and use more health services, and to increasing hospitals costs.
The Commonwealth initiated a number of measures aimed at halting fall-ing membership and ensuring the long-term viability of the private insurance sector. Although private insurance remains voluntary, the Commonwealth offers financial incentives for people to take out private health cover. First, commencing in July �997, individuals with a taxable income of up to AU$ 35 000 per year (AU$ 70 000 for families) received a subsidy for private health insurance, while an additional �% Medicare surcharge was levied upon individuals with

60
Health systems in transition Australia
a taxable income of over AU$ 50 000 (AU$ �00 000 for families) who do not have private hospital coverage. Second, from January �999, a non-means tested 30% tax rebate was offered to those taking out private health insurance, this rebate replacing the previous subsidies. In 2005 the rebate was increased to 40% for people aged 70 and older, and to 35% for those aged 65 to 69 years. Third, from July 2000, under “lifetime health cover”, private health funds charge higher premiums for individuals over 30 years of age who have not maintained “continuous” membership of a private health fund. The premium increases by 2% each year of age in excess of 30 years until an individual has joined (Australian Institute of Health and Welfare 2004a, pp. 250–253). Individuals with hospital cover at �5 July 2000, or who join in future before they turn 3� years of age, will qualify automatically for the lowest premium as long as they retain membership. The tax penalty for the higher income groups without appropriate private health insurance has been retained since its introduction in July �997.
While there is debate about which of these measures has had the greatest effect, private health insurance levels increased significantly, from 30.�% of the population in December �998, to a peak of 45.7% in September 2000 (Australian Institute of Health and Welfare 2004a, p. 252). Coverage was 43.�% in September 2005. The age profile of people with private health insurance also changed, with the proportion of people with private health insurance under the age of 65 increasing from 85.9% to 89.2% between March 2000 and March 200�. From August 2002 to 2003, however, there was a decline of up to 4% in private health insurance coverage for 30–59 year olds, and rises in private health coverage in the over 60 year age group of up to 6%, placing increasing pressure on premiums (PHIAC 2004).
The government has been reviewing private health insurance arrangements. The intentions are to introduce incentives for health funds to promote more cost-effective health care; to more fairly reflect the costs of high-risk groups; and to encourage insurers to protect members from unexpected out-of-pocket charges. Other forms of private sector funding for health care also incorporate workers’ compensation and compulsory third-party motor vehicle insurance.
4.2 Allocationoffunds
A schematic diagram of the financing flow for the health sector is set out in Fig. 4.�. At the Commonwealth level, the health portfolio must compete with other portfolios to maintain or increase its budget share. The Commonwealth
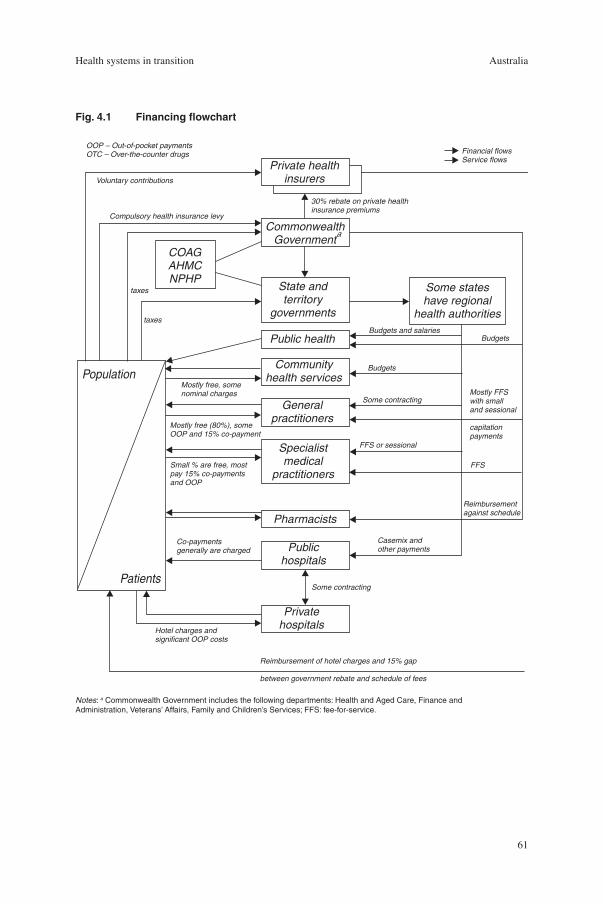
6�
AustraliaHealth systems in transition
CommonwealthGovernment
State andterritory
governments
Public health
Communityhealth services
Generalpractitioners
Specialistmedical
practitioners
Pharmacists
Publichospitals
Privatehospitals
Private healthinsurers
COAGAHMCNPHP
Some stateshave regional
health authorities
Population
Patients
OOP – Out-of-pocket paymentsOTC – Over-the-counter drugs Financial flows
Service flows
30% rebate on private healthinsurance premiums
Voluntary contributions
Compulsory health insurance levy
taxes
taxes
Mostly free, somenominal charges
Mostly free (80%), someOOP and 15% co-payment
Small % are free, mostpay 15% co-paymentsand OOP
Co-paymentsgenerally are charged
Hotel charges andsignificant OOP costs
Reimbursement of hotel charges and 15% gap
between government rebate and schedule of fees
Budgets and salaries
Budgets
Some contracting
FFS or sessional
Budgets
Mostly FFSwith smalland sessional
capitationpayments
FFS
Reimbursementagainst schedule
Casemix andother payments
Some contracting
a
Fig.4.1 Financingflowchart
Notes: a Commonwealth Government includes the following departments: Health and Aged Care, Finance and Administration, Veterans’ Affairs, Family and Children’s Services; FFS: fee-for-service.

62
Health systems in transition Australia
Department of Health and Ageing was allocated AU$ 2.6 billion dollars in 2004–2005, which amounted to �9.�% of the Commonwealth recurrent budget, up from �5.�% in �995–�996 (Department of Health and Ageing 2004b, p. 5).
Commonwealth spending on health mostly is determined by commit-ments under three schemes: Medicare (which reimburses non-hospital private medical care), the Pharmaceuticals Benefits Scheme, and the Australian Health Care Agreements (funding for public hospitals). The allocation of general purpose funds by the Commonwealth to the States is negotiated through the Commonwealth Grants Commission.
State government funding for health care mainly comes from the following sources: their share of the goods and services tax revenues; block grants and specific purpose payments from the Australian Government; funding out of their own fiscal resources; and funding provided by non-government sources (usually user fees). A State Health Department negotiates its budget within the State budgetary process, and the health portfolio is highly significant within the State budgetary process, accounting for up to 40% of their recurrent funds.
Commonwealth health grants to the States, under the Australian Health Care Agreements, are based on a population formula plus components of performance measurement. The fiscal advantage of a State securing large health grants, however, may be offset by a reduction in its other revenue from the Commonwealth. Some grants are subject to “fiscal equalization” administered by the Commonwealth Grants Commission, the intention being to ensure that all States are able to provide an adequate level of services without levying higher taxes or surcharges upon their citizens; that is, the poorer States are cross-subsidized by the richer States.
The Australian Health Care Agreements (funding mainly for public hospitals), first formalized in the �984–�988 Agreement, are negotiated every five years between the Commonwealth and State governments. The current Agreement runs from � July 2003 to 30 June 2008. The working assumption is that public hospitals are “a State responsibility”. The Commonwealth provides capped prospective block grants to the States, who bear most of the risk if demand and costs increase during the five-year period. The renegotiation of these complex agreements involves a debate over the appropriate level of Commonwealth funding, which the States generally regard as insufficient to cover rising hospital costs. The agreements set out a number of conditions and performance indicators, including service targets, but allow the States considerable flexibility over resource allocation to hospitals (Duckett 2004). The key condition is a requirement for States to provide free public hospital treatment to all eligible persons.

63
AustraliaHealth systems in transition
4.3 Purchaserandproviderrelations
Cost shifting is always an issue in the negotiations between the Commonwealth and the States since each party suspects that health care is being “cost shifted” from State-funded to Commonwealth-funded services or vice versa, although the actual extent is unknown. For example, the States have an incentive to encourage patients to see private doctors (who may also consult in public hospitals) who bill Medicare, rather than to attend State-run public hospitals as outpatients. Public outpatient hospital services per person dropped after the introduction of Medicare while Medicare-funded private services rose (Butler �998). This has contributed to the declining overall expenditure share of hospital services and the rising share of medical services. Further, public hospitals have a fiscal incentive to discharge older dependent people as soon as medically possible to Commonwealth-subsidized nursing homes. In terms of overall health cost-effectiveness, however, these might be regarded as positive rather than perverse cost incentives, but the issue of “cost shifting” is complex and does not always deliver the best patient outcomes. State health departments also experimented with purchaser–provider splits but by the mid-�990s had ceased many of these arrangements (see Section 2.2.4).
4.4 Paymentmechanisms
The States differ in the way they allocate funds to health care administrators and providers. The New South Wales health department, for example, allocates funds to eight Area Health Services according to a “resource allocation formula” based variously on historical funding, a population-based formula weighted for age and sex, with some adjustment for resource use, including activity-related measures such as casemix (Stoelwinder and Viney 2000). Other States negotiate contracts with providers, such as hospitals, and fund hospitals partly on a casemix formula, as discussed in the next section. Much of the budgetary attention of a State Health Department, as well as the State Treasury, concerns payments to public sector hospitals, since these take a large proportion of a State health budget.
4.4.1 Payinghealthcarepersonnel
The contractual terms and conditions and rates of payment of doctors employed by public hospitals vary across States. There are two main categories. Salaried medical officers are engaged as employees of the hospital and paid a salary
64
Health systems in transition Australia
to work at the hospital full time. Visiting medical officers are engaged as independent contractors to the hospital and can be paid a fee-for-service for each procedure or on a sessional basis for a certain amount of time per week.
The Workplace Relations Act �996 shifted the industrial relations focus away from centrally determined awards towards enterprise-level bargaining on wages and employment conditions. Following the 2004 federal election, the re-elected Coalition Government announced proposals for further reforms to industrial relations in Australia (Buchanan 2005). Inter alia, Australian Workplace Agreements will gradually take over from Collective Enterprise Agreements, and the effect of these latest changes on the health workforce remains to be seen.
Medical practitioners in the private sector charge a fee-for-service. They can bill patients directly, or “bulk-bill” the Health Insurance Commission that administers Medicare, provided that the doctor accepts the Medicare rebate (as discussed in Section 2.5.�) as full payment for their service. Alternatively, doctors may charge the patient the schedule fee or a higher amount and the patient may then claim the schedule fee amount back from the Health Insurance Commission (Medicare Australia). General practitioners may also be paid a small amount (in terms of their overall income) to deliver agreed public health services. Although the Medical Benefits Schedule fee acts as a break in medical fees (but also provides guaranteed payments), funding has not been used as a significant lever to change clinical practice.
4.4.2 Payingforhealthservices
Governments (Federal, State and Territory) contribute more than 90% of all funding for public hospitals. The Australian government contribution, estimated at 49.2% in 2002–2003, is largely through payments under the Australian Health Care Agreements. The net operating costs balance is met by the States, which are responsible for operating and regulating public hospitals within their jurisdictions. State contributions in 2002–2003 accounted for 42.9% of the funding for public hospitals, with nongovernment sources accounting for the remaining 7.9% (Australian Institute of Health and Welfare 2004b, p. 44).
As the States are responsible for meeting any increase in the demand for services over the life of an agreement, and given their limited revenue-raising capacity, cost containment and cost-effectiveness has been a key policy focus. The last decade has seen substantial changes in the way that public hospitals are funded; in particular, purchaser specificity and management accountability have increased. The States have not adopted capitation models of financial risk

65
AustraliaHealth systems in transition
sharing and cost containment, however, and private health funds are prohibited from using capitation contracts (Duckett 2004).
State governments exert precautionary budget controls on public hospitals, principally through payment methods. Public hospitals previously were funded using one or a mix of methods: an historical budget according to line items (such as salaries); patient cost per day (particularly in long-stay hospitals); or cost per patient stay. There was little standardization across hospitals or States. Most States had moved towards a mix of historical and negotiated hospital budgets by the �980s. In the mid-�980s, the States began to negotiate 40–50 pages of detailed “health service agreements” based on global prospective budgets and output goals. The next step, in the �990s, was the introduction of casemix payments, whereby the funds received by a hospital would depend in part on the type and mix of cases that it treated.
Australia has a long history of casemix funding, that is, “paying hospitals a benchmark price for the mix of patients (cases) they treat” (Duckett 2004, p. �40). Australia began to pilot the United States diagnosis-related group (DRG) method of payment in �985, now has 20 years’ experience in the intricacies of DRG systems, and has produced its own standardized classification system, currently with over 665 individual categories, known as the Australian Refined Diagnosis-Related Groups (AR-DRGs) (Australian Institute of Health and Welfare 2005b, p. 250). Promoted by the Commonwealth, all States (except New South Wales) now have incorporated the DRG system in their formulae for funding public hospitals. New South Wales has retained a large element of population funding in paying hospitals and uses casemix information more as a management tool. The large hospitals all have computerized databases that keep transaction costs low.
There appears to be an efficiency advantage in casemix funding in that targets have been achieved through efficiencies, rather than through service cuts, although in the context of State government budget constraints. There is, however, little evidence of the impact of casemix funding upon effectiveness, that is, upon patient health outcomes and service quality (Hughes 2004, p. ��3). A common criticism is that patients are discharged “quicker but sicker”. Attention now is being paid to developing comparable measures of quality and health outcomes.
State governments also purchase hospital services from private providers under detailed purchase-of-service contracts. In relation to private hospitals, direct Commonwealth funding is limited to the reimbursement of 75% of the Medical Benefits Scheme fee for medical practitioners’ services. Private health insurance may cover private hospital accommodation and medical and other
66
Health systems in transition Australia
inpatient services. Private insurers partly reimburse insured patients who use private facilities in either public or private hospitals. In 200�–2002 more than two-thirds (67.2%) of private hospital activity was funded through private health insurance, but �9.9% of this was indirectly funded out of private health rebates paid by the Australian Government. Thus 47.3% of private hospital activity was paid directly out of the premiums paid by members and other revenues flowing to the private insurers (Australian Institute of Health and Welfare 2004b, p. 47). So far, the Australian private insurance industry has not adopted an active “managed care” approach to paying private hospitals, as done, for example, by the insurance industry in the United States.
4.5 Healthcareexpenditure
Expenditure on health care in Australia has increased steadily over the last few decades (Table 4.2). Wealthy countries tend to devote a larger proportion of their GDP to health, and from the early �990s in Australia the size of the health sector has grown more than proportionately to GDP. Australia spent 9.7% of its GDP on health in 2003–2004 (Australian Institute of Health and Welfare 2005a, p. 4), up from 9.5% of GDP in 2002–2003 which was slightly above the OECD average of 8.4%. Fig. 4.2 shows that many OECD countries had a growth trend throughout the �970s and �980s, with some flattening in the �990s before rising again in the early 2�st century (Fig. 4.3). Expenditure per capita in terms of purchasing power parity was US$ PPP 3652 in Australia in 2002, slightly above the OECD average of AU$2925 (see Fig. 4.4) (Australian Institute of Health and Welfare 2004b, p. 60).
Australia maintains a predominantly publicly funded health care system, with almost 70% from the public sector (Australian Institute of Health and Welfare, 2004b, p.60–63). The public share of total health expenditure jumped in �975 with the introduction of Medibank (to 72.8% from the �970 share of 56.7%), declined in the late �970s as a result of the dismantling of Medibank, increased again after the introduction of Medicare in �984 and yet again after the introduction of subsidies for private health insurance in �997, but is now declining. Compared to nearly 70% public funding in Australia, the OECD average in 2002–2003 was 72.7%, but this covers a large range including 83.4% in the United Kingdom and 44.9% in the United States. Health care systems that are largely publicly funded, and particularly tax-funded systems, have been more successful in containing costs, while guaranteeing universal insurance cover, compared to systems that are more privately funded (Mossialos and Le Grand �999).

67
AustraliaHealth systems in transition
Dips and peaks in respective shares reflect changes in fiscal arrangements between the Commonwealth and the States, depending partly upon the political party in power and phases in negotiations at the Australian Health Ministers’ Conference. The Commonwealth share of health services expenditure is around 46%, which is around the same as in the mid-�980s (Table 4.3). The proportion funded by the States has dropped to 22%, however, while the nongovernment sector share has increased from 28% to 3�% (the very small local government contribution being included with the States) (Australian Institute of Health and Welfare 2004a, p. 242). The Commonwealth share of health expenditure dropped during the early �990s but was restored from �993–�994 under the Australian Health Care Agreement that increased funding to the States for public hospitals (Australian Institute of Health and Welfare �998b, p. �65). State and Territory expenditures decreased slightly during the �990s, although there were considerable differences between the States in spending patterns and growth rates.
As a proportion of total health expenditure in Australia, expenditure on inpatient care has declined since �980, whilst expenditures on pharmaceuticals and ambulatory health care services have grown. In 2002, inpatient care accounted for 39.2% of total health expenditure compared to 5�.2% in �980 (Table 4.4). Acute care hospitals still account for the largest share of total health expenditure with a 3�.8% share of total expenditure in 2002. Under the 2003–2008 Health Care Agreements, the Australian Government will provide funding of up to AU$ 42 billion and require each State and Territory to increase their
Table4.2 TrendsinhealthcareexpenditureinAustralia,1970–2002a
1970b 1975 1980 1985 1990 1995 2000 2001 2002
Total health expenditure, current prices (AU$ million) 1 992 5 719 10 224 18 586 31 267 42 082 60 897 66 582 72 183
Total health expenditure as share of GDP (%) 5.1 7.2 7.0 7.5 7.9 8.4 9.1 9.3 9.5
Total health expenditure, constant prices (iii)
13 651
20 982
23 457
28 148
33 628
41 444
53 078
54 776
69 306
Total per capita health expenditure, current prices (US$ PPP) 217 460 684 994 1 300 1 737 2 379 2 504 3 652
Annual per capita growth, constant prices (%) 11.0 13.3 –0.3 3.5 0.9 3.5 4.2 1.9 4.2
Public share of total health care expenditure (%) 60.5 72.8 63.0 71.7 67.7 67.1 69.9 68.6 67.9
Sources: Australian Institute of Health and Welfare 2004b, pp. 7, 18; OECD 2005 for PPP conversion rates and Health Price Index deflator.
Notes: a “2002” refers to the financial year 2002–2003, “2000” refers to 2000–2001, etc.; b Data are not available for 1970–1971. The 1970–1971 figures in the table are an average of the years 1969–1970 and 1971–1972; c Constant price health expenditure is expressed in chain volume measures, referenced to the year 1995–1996. The deflator is the AIHW’s Total Health Price Index.

68
Health systems in transition Australia
Fig.4.2 HealthcareexpenditureasashareofGDP(%)inAustraliaandselectedOECDcountries
Source: OECD Health data 2006.
5.6
5.9
6.5
6.5
7.1
7.3
7.5
7.7
8.0
8.0
8.1
8.3
8.3
8.4
8.4
8.9
9.1
9.2
9.2
9.2
9.6
9.9
10.0
10.0
10.1
10.2
10.5
10.9
11.6
15.3
0 4 8 12 16
Republic of Korea
Slovak Republic (2003)
Mexico
Poland
Ireland
Czech Republic
Finland
Turkey
Japan (2003)
Luxembourg
Spain
Hungary
United Kingdom
Italy
New Zealand
Denmark
Sweden
Australia (2003)
Netherlands
Norway
Austria
Canada
Greece
Portugal
Belgium (2003)
Iceland
France
Germany (2003)
Switzerland
United States

69
AustraliaHealth systems in transition
Fig.4.3 TrendsinhealthcareexpenditureasashareofGDP(%)inAustraliaandselectedothercountries,1990–2004
Source: OECD Health data 2006.
4.0
6.0
8.0
10.0
12.0
14.0
16.0
18.0
1990 1992 1993 1994 1995 1996 1997 1998 1999 2000 2001 2002 2003 2004
Australia United Kingdom Canada United States New Zealand
Table4.3 Governmentandnongovernmentexpenditureasaproportionoftotalhealthservicesexpenditure,1993/1994–2003/2004a(%)
YearAustralian
GovernmentState/Territory
andlocalGovernment
TotalNon-
government1993/1994 45.1 21.3 66.4 33.6
1994/1995 44.8 21.6 66.3 33.7
1995/1996 45.2 22.0 67.2 32.8
1996/1997 43.7 22.9 66.7 33.3
1997/1998 44.4 23.8 68.2 31.8
1998/1999 46.1 21.9 68.0 32.0
1999/2000 47.1 22.9 70.1 29.9
2000/2001 46.8 22.7 69.4 30.6
2001/2002 46.2 22.2 68.4 31.6
2002/2003 46.3 22.4 68.7 31.3
2003/2004 45.6 22.3 67.9 32.1
Source: Australian Institute of Health and Welfare 2005a, p. 19.
Note: a “2003” refers to the financial year 2003/2004; “2002” refers to 2002/2003, etc.

70
Health systems in transition Australia
Fig.4.4 HealthcareexpenditureinUS$PPPpercapitainAustraliaandselectedOECDcountries,latestavailableyear
Source: OECD Health Data 2006.
580
662
777
805
1 149
1 323
1 361
1 813
2 083
2 094
2 162
2 235
2 249
2 392
2 546
2 596
2 825
2 876
2 881
3 005
3 041
3 044
3 124
3 159
3 165
3 331
3 966
4 077
5 089
6 102
0 1000 2000 3000 4000 5000 6000 7000
Turkey
Mexico
Slovak Republic (2003)
Poland
Republic of Korea
Hungary
Czech Republic
Portugal
New Zealand
Spain
Greece
Finland
Japan (2003)
Italy
United Kingdom
Ireland
Sweden
Australia (2003)
Denmark
Germany (2003)
Netherlands
Belgium (2003)
Austria
France
Canada
Iceland
Norway
Switzerland
Luxembourg
United States

7�
AustraliaHealth systems in transition
Table4.4 Healthcareexpenditurebycategory(aspercentageoftotalexpenditureonhealthcare),1980–2002a
%oftotalhealthexpenditure
1980 1985 1990 1995 2000 2002
Inpatient careb 51.2 48.0 45.7 42.1 33.5c 39.2
Ambulatory cared 24.6 27.3 30.6 30.7 29.7e 30.5
Pharmaceuticals 7.9 8.0 8.9 11.1 13.1 13.9
Public health 0.5 0.8 NA 1.6 1.4 1.9
Investment 7.5 7.6 6.3 5.7 5.8 4.8
Source: Australian Institute of Health & Welfare 2004b.
Notes: a “2002” refers to the financial year 2002–2003, “2001” refers to 2001–2002, etc.; b Inpatient care includes admitted patient care in acute care hospitals, psychiatric hospitals, freestanding day hospitals and high-level residential aged care institutions; c Prior to 1998–1999, expenditure on inpatient care includes some ambulatory care expenditure (outpatient services provided to nonadmitted hospital patients). Data from 1998–1999 are a more accurate reflection of expenditure on inpatient care. Thus data for the years to 1995 are not directly comparable to the years from 2000; d Ambulatory care includes medical services, other professional services (e.g. physiotherapy and other allied health services), dental services and community health centres and services; e Data for the years to 1995 are not directly comparable to the years from 2000 because of a reclassification of some ambulatory care expenditure (outpatient services provided to nonadmitted hospital patients) from inpatient care to ambulatory care from 1998–1999.
funding for public hospitals to at least match the rate of growth of Australian Government funding for public hospital services over the period.
Ambulatory care as a proportion of total health expenditure appears to have varied little since �990 (Table 4.4), but changing ambulatory care service classifications make trends difficult to trace and also make international comparisons problematic. Total pharmaceuticals expenditure increased from 8.9% of total health expenditure in �990 to �3.9% in 2002. Total government and consumer expenditure on the Pharmaceutical Benefits Scheme rose by almost two-thirds (60.5%) between �998 and 2002 (Australian Institute of Health and Welfare 2004a, p. 238).
Public health, encompassing disease prevention and population health promotion, receives �.7% of the total recurrent health budget (Australian Institute of Health and Welfare 2004a, p. 239). This share was squeezed in government health budgets in the early �990s, but from �996 has been protected in joint Commonwealth and State programmes (see Section 6.� Public health). Another estimate aggregates community health (such as district nursing and Indigenous health services) and public health services at 4.8% of recurrent health expenditure (Australian Institute of Health and Welfare 2000, p. 403). Public health expenditure is difficult to estimate, since these activities appear under several budgetary headings, and involve all three tiers of government (for

72
Health systems in transition Australia
example, local government is active in environmental health). The argument for increasing public health interventions is that more should be spent on preventing, rather than just treating, the causes of diseases (Sheill and Carter �998). The Commonwealth thus has increased its expenditure on public health with half transferred to the States as specific-purpose grants. While it is difficult to estimate spending, perhaps half of State public health funds come from the Commonwealth (Lin and King 2000).
Investment in the health sector has declined from ��% of total expenditure on health care in �975 to 5.8% in 200� (see Table 4.4). The lack of investment, particularly in public hospitals, is an increasing problem in view of deteriorating public facilities and the need for expensive equipment.
“Who pays” differs according to the type of service (Australian Institute of Health and Welfare 2000, p. 239). This makes it politically and fiscally difficult to change expenditure patterns. For example, the Commonwealth pays the largest share for medical services (general practitioners, ambulatory specialist care, and specialist services for private inpatients), and for aged care homes and pharmaceuticals. The States pay a little more than half the cost of public acute hospitals (jointly funded with the Commonwealth), and also for community health services and public health services, while private hospitals are funded mainly by the non-government sector. Thus expenditure cannot easily be transferred, for example, from hospitals to primary health care. In 2002–2003 approximately 30% of Commonwealth health expenditure went to medical services, 27% to public hospitals, �6% to pharmaceuticals, and ��% on aged care homes (Australian Institute of Health and Welfare 2004b, p. 28).
73
AustraliaHealth systems in transition
5.1 Physicalresources
5.1.1 Infrastructureandcapitalinvestment
The States are responsible for most health sector infrastructure costs but are limited in their ability to raise taxes or expand public borrowing. Many privatization initiatives in the health sector, therefore, are motivated by
the requirement to obtain capital funds to renovate or extend old public hospitals and to build new hospitals in population growth areas. For example, in Victoria, about one quarter of hospital capital between �997 and 200� came from the private sector (Stoelwinder and Viney 2000, p. 2�8). Co-location is one popular privatization strategy. Although attending doctors (consultants) in most large public hospitals already treat private inpatients in public facilities, co-location involves the establishment of a privately owned hospital within or adjacent to a public hospital. There are several options. The private sector might undertake a build-own-operate-transfer hospital that reverts to the public sector after a stipulated period under agreed conditions; the private facility might be physically distinct; it may be linked to the public hospital and provide comprehensive or select services, or the arrangement might involve the sharing of facilities, staff and services. In the early �990s, the private sector negotiated very favourable terms but the public sector has since improved its knowledge and negotiating skills in these public/private financial initiatives (Bloom 2000a).
Australia had �025 acute care hospitals in 200�–2002, of which 724 were public hospitals providing 70% of the bed stock, and 30� were private hospitals (Australian Institute of Health and Welfare 2004a, p. 287). Public hospitals include government hospitals and those originally established by religious or
5 Physicalandhumanresources

74
Health systems in transition Australia
charitable bodies but now directly funded by government. Large public hospitals provide advanced types of treatment such as intensive care, major surgery and organ transplants. Large tertiary care hospitals also have a teaching function and the hospitals associated with university medical schools receive government funds to support their teaching role.
Private hospitals traditionally provided less complex non-emergency care, such as simpler elective surgery, but have extended their clinical capacity since the advent of more accessible technology and also new procedures such as minimally invasive surgery. Their increased range of clinical services thus offers an alternative to elective surgery in public hospitals for which there are long waiting lists. Although the stock of public beds declined substantially during the �990s, the stock of private beds has increased slightly (Australian Institute of Health and Welfare 2004a).
Most Australian hospitals can be classified as “acute” care hospitals since they mostly provide short-stay treatment to patients with acute conditions that require a high level of care or need technology that can be provided only in hospitals. Most new hospitals are now “general” hospitals and most specialist hospitals have merged with general hospitals, although a few remain, such as cancer care hospitals, and children’s hospitals. Psychiatric hospitals are the main exception to the general hospital model since they date from the historical practice of separating mental health services. However, the Commonwealth and State governments are integrating mental health into mainstream health services (see Section 6.�0 Mental health care).
In Australia, as in other OECD countries, the policy has been to reduce the stock of hospital beds in line with changing methods of managing patients. Although the number of acute hospitals in Australia has decreased only slightly from �032 in �99�–�992 to �025 in 200�–2002, bed capacity has decreased significantly over the decade but slowed to an ��% reduction in available beds per �000 population between �995–�996 and 200�–2002 (Australian Institute of Health and Welfare 2004a, pp. 286–288). The number of acute hospital beds per �000 population dropped from 3.0 per �000 population in �995 to 2.6 per �000 in 2003 (Table 5.�). Australia is below the European Union average of 4.4 acute hospital beds per �000 population, but there is considerable variation between countries, and problems of comparability in how countries define an acute care bed. The population rate of acute hospital beds has fallen markedly in most OECD countries since the �970s. The number of all hospitals beds (including long-stay beds) in Australia also has fallen reflecting shorter stays, the growth of nursing homes, and more community-based care. Public hospitals recently have opened new beds, however, in order to reduce waiting times, particularly for elective surgery (a political issue for State governments), with a slight increase from 2.40 beds per �000 weighted population in 2002–2003

75
AustraliaHealth systems in transition
Fig.5.1 Bedsinacutehospitalsper1000populationinAustraliaandselectedothercountries,1990–2004
Source: OECD Health data 2006.
1.0
2.2
2.4
2.8
2.8
2.8
2.9
3.0
3.0
3.0
3.1
3.3
3.6
3.6
3.7
3.8
3.8
4.8
5.1
5.7
5.9
5.9
5.9
6.4
6.4
8.4
1.2
4.1
2.0
3.8
3.6
3.7
3.3
4.0
4.3
3.4
3.8
4.1
4.8
3.8
6.2
5.2
4.9
6.5
5.4
6.3
6.7
7.1
2.7
6.5
8.5
8.3
7.8
12.3
6.5
3.8
0 4 8 12 16
1990
2004
Japan
Austria
Germany
Czech Republic
Slovak Republic (2000,2003)
Republic of Korea (1990,2003)
Hungary
Luxembourg
Poland (1990,2003)
Belgium
Switzerland
Greece (1980,2002)
France
Italy (1990,2003)
United Kingdom (2000,2004)
Australia (1990,2003)
Denmark
Norway
Portugal
Finland
Canada (1990,2003)
Ireland
United States
Spain (1990,2003)
Netherlands (1990,2003)
Turkey
Sweden
Mexico
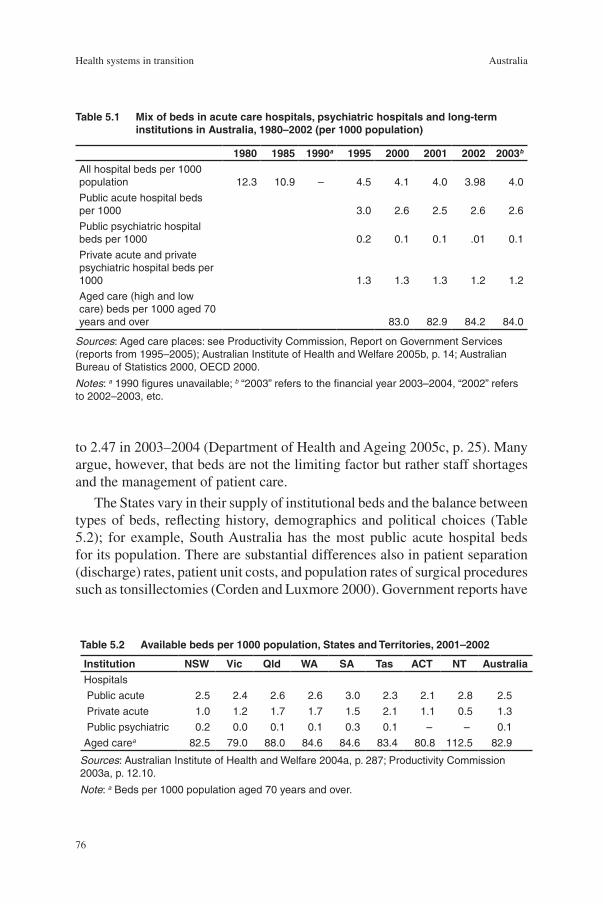
76
Health systems in transition Australia
to 2.47 in 2003–2004 (Department of Health and Ageing 2005c, p. 25). Many argue, however, that beds are not the limiting factor but rather staff shortages and the management of patient care.
The States vary in their supply of institutional beds and the balance between types of beds, reflecting history, demographics and political choices (Table 5.2); for example, South Australia has the most public acute hospital beds for its population. There are substantial differences also in patient separation (discharge) rates, patient unit costs, and population rates of surgical procedures such as tonsillectomies (Corden and Luxmore 2000). Government reports have
Table5.1 Mixofbedsinacutecarehospitals,psychiatrichospitalsandlong-terminstitutionsinAustralia,1980–2002(per1000population)
1980 1985 1990a 1995 2000 2001 2002 2003bAll hospital beds per 1000 population 12.3 10.9 – 4.5 4.1 4.0 3.98 4.0
Public acute hospital beds per 1000 3.0 2.6 2.5 2.6 2.6
Public psychiatric hospital beds per 1000 0.2 0.1 0.1 .01 0.1
Private acute and private psychiatric hospital beds per 1000 1.3 1.3 1.3 1.2 1.2
Aged care (high and low care) beds per 1000 aged 70 years and over 83.0 82.9 84.2 84.0
Sources: Aged care places: see Productivity Commission, Report on Government Services (reports from 1995–2005); Australian Institute of Health and Welfare 2005b, p. 14; Australian Bureau of Statistics 2000, OECD 2000.
Notes: a 1990 figures unavailable; b “2003” refers to the financial year 2003–2004, “2002” refers to 2002–2003, etc.
Table5.2 Availablebedsper1000population,StatesandTerritories,2001–2002
Institution NSW Vic Qld WA SA Tas ACT NT AustraliaHospitals
Public acute 2.5 2.4 2.6 2.6 3.0 2.3 2.1 2.8 2.5
Private acute 1.0 1.2 1.7 1.7 1.5 2.1 1.1 0.5 1.3
Public psychiatric 0.2 0.0 0.1 0.1 0.3 0.1 – – 0.1
Aged carea 82.5 79.0 88.0 84.6 84.6 83.4 80.8 112.5 82.9
Sources: Australian Institute of Health and Welfare 2004a, p. 287; Productivity Commission 2003a, p. 12.10.
Note: a Beds per 1000 population aged 70 years and over.

77
AustraliaHealth systems in transition
drawn attention to such differences, as well as to problems of comparability (Steering Committee for the Review of Commonwealth/State Service Provision �999).
5.1.2 Informationtechnology
About 66% of Australian households had access to a computer at home in 2003, while 53% of households had access to the Internet (Australian Bureau of Statistics 2004n). Health departments (Commonwealth and State) are using such information technology to provide better health information to the community; HealthInsite, an Internet gateway, offers consumers and health professionals information about health and wellbeing (see Section 5.�.2 Patient empowerment).
Promotion of the uptake of information technology in the Australian health system for improved clinical and medical practice has received high-level commitment. In 2003, the Australian Health Ministers Conference endorsed the creation of two new bodies: the Australian Health Information Council (AHIC) and the National Health Information Group (NHIG) to provide leadership on information management and technology in health care (Australian Institute of Health and Welfare 2004a, p. 334).
A survey of Australian general practices in 200� had found that 86% of practices were computerized (Western et al. 2003). While use of computers for clinical functions is less common than for administrative purposes, the survey found that electronic script writing packages are widely employed. The uptake of information technology by Australian medical practices has been accelerated by financial incentives created by the Practice Incentive Program (see Section 6.3.� General practice). For example, by the end of 2003–2004, 95% of practices in the Practice Incentive Program used computers (Department of Health and Ageing 2004a, p. �03).
A new national health record management system that electronically stores individual medical records for those Australians who wish to have them available to doctors and pharmacists, HealthConnect, has undergone trials in parts of Tasmania, the Northern Territory and Queensland. A joint project of the Australian, State and Territory governments, HealthConnect aims to build a network of electronic personal health records in order to improve the flow of accurate and timely information in the Australian health sector. It is anticipated that the network will assist in the delivery of improved health care services and outcomes by addressing issues such as the occurrence of errors and adverse events and inappropriate treatments because of incomplete information at the point of care.

78
Health systems in transition Australia
The HealthConnect project is associated with trials of a new Medicare card project, involving replacement of the current magnetic strip cards by “smartcards” with a computer chip for access to government benefits including medical and pharmaceutical benefits. Privacy advocates have expressed concern about the smartcard scheme, particularly about its integration with HealthConnect.
The National E-Health Transition Authority has been established as a private company owned by the Commonwealth and each of the States, which is developing standards, structures and operating systems.
5.1.3 Medicalequipment,devicesandaids
The utilization of new technology by clinicians is limited by government policy. For example, the availability of subsidized private sector magnetic resonance imaging (MRI) services is restricted, and there are regulations and guidelines for doctors prescribing subsidized medicines listed under the Pharmaceutical Benefits Scheme. National and State-based advisory bodies assess new technologies prior to uptake and advise health ministers on safety and cost-effectiveness issues to determine whether government funding will be provided (see Section 3.2.� Health technology assessment). Nonetheless the adoption of new technologies is a key driver of increasing health expenditure. A Productivity Commission study in 2005 found that new medical technologies were a (probably the) major driver of increased health expenditure in Australia over the last decade (Productivity Commission 2005a).
Single unit high-expenditure technologies have gradually been introduced through public financing. For example, MRI units have increased from �� in �990 to 84 in �998 to 96 in 2004 (Department of Health and Ageing 2005d, p. �38); computed tomography scanners have increased from �� in �980 to 235 in �990 to 375 in �995 (OECD 2005); and there were eight government-subsidized PET scanners in Australia in 2004 (Department of Health and Ageing 2005e).
5.1.4 Pharmaceuticals
(For details of Australian pharmaceutical safety and efficacy regulations, reimbursement, pricing and patent standards, see Section 6.5 Pharmaceutical care. For details on health technology assessment for pharmaceuticals see Section 3.2.�).
The Commonwealth Government makes direct payments to pharmacists for the supply of medicines listed on the PBS to the community. These subsidies
79
AustraliaHealth systems in transition
are set following negotiations between the Commonwealth Government and the Pharmacy Guild of Australia. Under the Fourth Community Pharmacy Agreement from � July 2006 these payments offer in most cases the cost of the medicine (manufacturers price), a wholesale mark-up (7.5%), a retail mark-up to the pharmacists to cover storage and handling (�0%), and a fee for the pharmacists’ professional advice and services in dispensing the medicine to the patient (from AU$ 4.75) (Department of Health and Ageing 2005f).
In �999 there were 4926 pharmacies (excluding hospital pharmacies) in Australia, and �4 747 pharmacists in employment, with an average of 0.8 pharmacists per �000 population (Australian Institute of Health & Welfare 2003b). While the number of pharmacists has increased over the last five years, the number of pharmacies has remained relatively stable. The number of pharmacies is regulated by the Commonwealth Government. The Australian Community Pharmacy Authority is authorized under the National Health Act �953 to regulate the number and location of pharmacies, including minimum distance requirements between pharmacies. The Authority determines level of community need, and control of pharmacies located within, adjacent to, or connected to, a supermarket. These rules have been controversial, with some arguing that they lead to insufficient competition within the pharmacy sector (APL 2005).
Australia’s human-use pharmaceutical industry is dominated by subsidiaries of multinational pharmaceutical firms, though there are large Australian-owned enterprises within the industry. In �999–2000, the Australian pharmaceutical industry employed �3 700 people. Turnover was AU$ 5.4 billion. The value of exports was AU$ �.8 billion and imports AU$ 3.8 billion (Productivity Commission 2003b, pp. �.3–�.7). The pharmaceutical industry accounted for 4.�% (AU$ 200 million) of business expenditure on research and development in 2000–200�, mostly related to clinical trials. In 2002 there were around 3�5 biotechnology firms in Australia with nearly 65% of products being related to human-use pharmaceuticals. In terms of manufacturing, there is little large-scale production of active ingredients in Australia, with most being imported. Australian manufacturing activities related to pharmaceuticals mainly involve secondary activities such as formulation, packaging and labelling. Analysis of 200�–2002 sales by degree of Australian manufacturing shows that 43.6% of products were fully imported, �8.�% were fully imported in bulk and packaged locally, and 33.6% were formulated and packaged locally from imported ingredients.
80
Health systems in transition Australia
5.2 Humanresources
Health care is highly labour intensive. Employment in the health sector peaked at 7.6% of the workforce in �99� before dropping to 6.9% in �999, and then rising to 7.3% in 2003 (Australian Institute of Health and Welfare 2004a, p. 453). Structural changes during the �990s included growth in part-time employment (39% in 200� worked part time), continuing contraction in hospital employment, and strong growth in community health services. Health care is a feminized sector with 74% of the total workforce in 200� being women. The proportion of female doctors has risen from ��% in �96�, to �9% in �98�, to 32% in 200�, and will continue to rise with more female medical students, and as more male doctors reach retirement age. Nursing, in contrast, has always been predominantly female (Palmer and Short 2000). The ethnic composition of the medical workforce also is changing with an increasing number of overseas-born doctors.
The present and future capability of the health workforce has come under question in recent years; namely for its capacity to cope with changes such as: an ageing population; the emergence of new diseases, treatments and technologies; changing employment patterns; an increasing focus on rural and Indigenous health; trends in litigation; and the limited growth expected in the workforce due to low fertility rates. The health care sector is under considerable pressure given significant shortages of health professionals, including doctors and nurses, with these supply shortages projected to continue, prompting a search for both short-term and longer-term solutions. Against this backdrop, government-supported health workforce planning and research occurs at both the national and State/Territory levels. The national-level activities are overseen by several advisory committees, which undertake health workforce research and data analysis, and from this provide workforce planning advice to Australian Health Ministers, jurisidictions and health workforce stakeholders. The workforce planning advice guides workforce policy. In 2004, Australian Government, State and Territory Health Ministers released Australia’s first national health workforce strategic framework to guide national health workforce policy and planning throughout the decade. The framework provided a direction-setting vision for the Australian health workforce and a set of guiding principles for government and all workforce stakeholders to apply to the development of health workforce policy. Coordination with the tertiary education sector, however, remains patchy.
While the health workforce encompasses numerous occupational groups, the next sections focus upon doctors and nurses.
8�
AustraliaHealth systems in transition
5.2.1 Medicalpractitioners
According to ABS Medical Labour Force Surveys, in 2005 there were 36 700 general medical practitioners and �6 000 specialist medical practitioners. The number of employed specialist medical practitioners increased by 47% between 2000 and 2005, but the number of generalist medical practitioners declined by �% (Australian Institute of Health and Welfare 2006, p.3�6).
After a steady increase over earlier decades, Australia had 2.5 practising doctors per �000 population in 2002 (Australian Institute of Health and Welfare 2004a) (see Table 5.3). (It should be noted that the term “physician” in Australia is not a generic term for doctor but refers to a medical specialist.) The population supply of doctors varies markedly between countries and Australia has fewer doctors than many nations (Fig. 5.2 and Fig. 5.3). There is no agreement, however, on the optimal number of doctors. Further, it is difficult to predict future medical workforce needs given continuing changes in medical knowledge and technology, fluctuations in medical migration (in the case of Australia), temporary exits by female doctors from the medical workforce, and the uncertainties inherent in the time-year lag between entry to medical school and graduation. The usual market signals of supply, demand and pricing are also lacking. For example, a government committee in �973 recommended a target of �.8 doctors per �000 population by �99�, but this was achieved by �98� largely due to the inflow of medically qualified migrants (Scotton �998).
The Australian Medical Workforce Advisory Committee (AMWAC), established in �995, monitors the composition and trends in the medical workforce and makes recommendations to government (AMWAC 2004). Its advice in the mid-�990s was to contain the growth of the medical workforce by: first, limiting entry to medical schools; second, limiting the immigration of doctors; and third, restricting the number of medical practitioners eligible to bill Medicare. The AMA wanted to balance supply and demand, since the inflation-adjusted incomes for doctors had declined (Anderson �998). On the advice of AMWAC, the Australian Health Minister’s Advisory Council (AMHAC) in �996 called for a reduction in the annual intake from �200 to �000 (Australian Institute of Health and Welfare �998b). When doctor shortages became evident a few years later, this policy was reversed (Australian Institute of Health and Welfare 2004a, p. 27�).
Another mechanism for regulating numbers of doctors is Commonwealth control over visas for overseas-trained doctors. The number of overseas-trained doctors entering Australia on temporary visas increased from 893 in �993–�994, to 2224 in �998–�999 (Australian Institute of Health and Welfare 2000), and to 3992 in 200�–2002 as “long-term residents” or “long-term visitors” (Australian Institute of Health and Welfare 2004a). State governments wanted to employ

82
Health systems in transition Australia
these doctors in State health services, particularly in hospitals in rural areas, and some States sought to fast-track their registration through medical registration boards as an “area of need” doctor. Medicare offers another means to control doctor numbers. In �996 restrictions were introduced on the assignment of provider numbers (and therefore ability to bill Medicare) to new graduates and temporarily resident overseas-trained doctors, thus limiting their employment to salaried public hospitals and locum positions until specialist training had been completed (Department of Health and Ageing 2005g, p. 97).
Table5.3 Healthcarepersonnel(headcount)per1000inhabitants,1980–2003a
1980 1985 1990 1995 2000 2001 2002 2003Practising doctors 1.8 (1981) 1.9 2.2 2.4 2.5 2.5 2.5 –
Practising dentists 0.4 0.4 0.4 0.4 0.5 0.5 0.5 0.5
Practising certified nurses 10.3 9.5 11.6 10.8 10.5 10.4 10.6 10.2
Practising pharmacists 0.7 (1981) 0.7 (1986) 0.5 0.6 0.8 0.6 0.7 0.8
Sources: Australian Institute of Health and Welfare 2004a, pp. 266–269; OECD 2004.
Note: a “2003” refers to the financial year 2003/2004, “2002” refers to 2002/2003, etc.
Fig.5.2 Activedoctorsper1000inhabitantsinAustraliaandselectedOECDcountries,1980–2004
Source: OECD 2005.
1
1.5
2
2.5
3
1980 1982 1984 1986 1988 1990 1992 1994 1996 1998 2000 2002 2004
Australia Canada New Zealand United Kingdom United States

83
AustraliaHealth systems in transition
Fig.5.3 Numberofphysiciansandnursesper1000inhabitantsinAustraliaandwesternEurope,2004orlatestavailableyear(inparentheses)
Numberper1000inhabitants
Australia(2002,2003)
WesternEurope
Monaco (1995,1995)
Italy (2002, –)
Belgium (2002)
Greece (2001,1992)
Switzerland (2004,2000)
Israel
Iceland (2004,2003)
Norway
Austria (2004,2003)
Germany
France
Portugal (2003,2003)
Sweden (2002,2002)
Malta
Spain (2003,2000)
Andorra
Finland (2003,2004)
Netherlands
Denmark (2003,2003)
Luxembourg
Ireland
Cyprus (2003,2003)
San Marino (1990,1990)
United Kingdom (2002, –)
Turkey (2003,2003)
Averages
EU average
EU Member States before 1 May 2004 (2003,2003)
EU Member States joining EU on 1 May 2004
CIS average 3.7
2.8
3.6
3.5
1.4
2.1
2.6
2.8
2.8
3.0
3.1
3.2
3.2
3.2
3.2
3.3
3.3
3.4
3.5
3.6
3.7
3.8
4.5
4.7
6.2
6.6
2.5
7.9
6.2
7.3
7.2
2.5
5.1
4.3
18.8
9.5
7.0
14.0
7.6
2.9
3.7
5.1
10.2
4.2
7.3
7.7
6.0
14.8
9.2
6.0
8.3
3.4
16.2
10.4
2.5
3.4
3.5
13.4
0 5 10 15 20 25
Physicians
Nurses
Sources: European Health for All database, June 2006; OECD Health data, 2006.Notes: CIS: Commonwealth of Independent States; EU: European Union.
84
Health systems in transition Australia
The maldistribution of the medical workforce is problematic in Australia, as in many other countries, and the government has several strategies underway to increase the supply of doctors in rural and remote areas (Department of Health and Ageing 2005g, p. 95). The distribution of doctors is weighted heavily towards metropolitan areas, and there are more registered nurses in urban and rural centres than in remote areas (Australian Institute of Health and Welfare 2004a, pp. 262–263). The Regional Health Strategy, “More Doctors, Better Services”, was launched in 2000 and subsequent initiatives have included short- and long-term measures to address rural shortages of health practitioners (Commonwealth of Australia 2004c). These include:
additional places and financial incentives for GP registrar training in dedicated Rural Pathways;
the funding of Rural Clinical Schools aimed at encouraging medical students to take up careers in rural practice;
financial incentives for students to remain in rural medical practice, including Medical Rural Bonded Scholarships and the Australian Medical Undergraduate Scholarships; and
incentives through the Higher Education Contribution Scheme Reimbursement Scheme (Commonwealth of Australia 2004c).
Other measures include relocation grants to assist practitioners and their families to move to rural areas, and higher rebates for GPs who bulk-bill in regional, rural and remote Australia (Commonwealth of Australia 2004c). It is still too early to determine whether these initiatives have led to long-term improvements in the distribution of practitioners.
A 2002 report by Access Economics, commissioned by the Australian Medical Association, estimated an overall shortage of general practitioners of between �200 and 2000 (Access Economics 2002, p. 9). A report in 2000 by the Australian Medical Workforce Advisory Committee (AMWAC) on general practice highlighted distributional issues for GP services in Australia. For example, the report found variations in the number of GPs per �00 000 population, ranging from 98.7 in Tasmania to �25.9 in Western Australia, and from 66.� in remote communities to �22.7 in capital cities (AMWAC 2000, pp. 34–35).
5.2.2 Nurses
Nursing is the largest health profession (Australian Institute of Health and Welfare 2004a, 259). Nurse employment declined in the early �990s and the skill mix shifted to more highly trained nurses (registered rather than enrolled nurses). In 200�, there were 228 230 nurses employed in nursing in Australia,
•
•
•
•

85
AustraliaHealth systems in transition
of whom �83 225 (80.3%) were registered nurses and the remaining 45 005 were enrolled nurses (Australian Institute of Health and Welfare 2003a, p. 7; Australian Institute of Health and Welfare 2004a, p. 266). From �995 to 200�, the number of employed registered nurses increased by 6.7%, but the number of employed enrolled nurses declined by 8%. A registered nurse has a minimum of a three-year degree, while an enrolled nurse has a one-year diploma. Australia thus has a more highly trained nursing workforce than previously. Nursing has an ageing workforce since less than 6% of its predominantly female composition are aged under 25 years, but it has become slightly more attractive to men (comprising 8.4% of all nurses) (Australian Institute of Health & Welfare 2003c, Australian Institute of Health and Welfare �998b, pp. 8, �3). In 2003, there were ��.9 nurses per �000 population in Australia (Australian Institute of Health and Welfare 2005c, p. 5).
There are Australia-wide shortages in many areas of nursing, principally operating theatre, critical and intensive care, accident and emergency, cardiothoracic, neonatal care, midwifery and mental health. The Australian Health Workforce Advisory Committee (AHWAC) is concerned about dropping numbers of nurse trainees and the loss of trained nurses from the workforce – an issue in many industrialized countries. The AHWAC provides the Australian Health Minister’s Advisory Council (AHMAC) with an annual report on nursing and allied health workforce issues (AHWAC 2004). A number of government initiatives have been put in place, including financial assistance to encourage non-practising nurses to resume their nursing careers, and scholarships that cover transport, tuition and childcare costs to help with additional training once they are back in nursing.
5.2.3 Trainingofhealthcarepersonnel
Medical school places are being expanded. Fourteen universities offer medical degrees in Australia and additional new medical schools are planned, including at the University of Wollongong and the University of Western Sydney. A new private medical school is scheduled to open in 2006 at Bond University (AHWAC 2004, p. �; Department of Health and Ageing 2004c). Medical education traditionally was based upon a six-year undergraduate course, but several universities have switched to a four-year postgraduate medical degree. In addition to academic merit, selection criteria take account of psychometric tests, rural home residence and Indigenous status. The number of medical graduates increased by �8% from �996 to 200� (Table 5.4). The previous Australian government policy of limiting the number of medical school places has been completely reversed to again expand medical school intakes, with an extra 234 students in place in the 2004 intake, increasing to an extra

86
Health systems in transition Australia
246 in 2005 (AHWAC 2004, p. �). In addition to these numbers there are an unknown although small number of full fee-paying Australian medical students, following the relaxation of restrictions allowing university medical schools to offer a fee-paying option over and above the number of publicly funded places. Overall by 2007, Australian medical school intake is expected to be at least around �860–�900, representing nearly a �00% increase in intake compared to a decade earlier.
Nurse education completed its move a decade ago from hospital-based training to a three-year university degree, and this has led to better grounding in clinical sciences for registered nurses, although vocational education training still plays an important role in the training of enrolled nurses (Productivity Commission 2005b, p. 60). Both the public and private hospital sectors provide places for nurse training. The number completing nursing education dropped by nearly �9% between �996 and 200�, but efforts are underway to increase the intake.
Table5.4 Australiancitizens/residentscompletinghealth-relatedhighereducationcourses,1996and2001
1996 2001%change1996–2001
Dentistry 303 339 11.0
Medical studies 1 743 2 058 18.1
Nursing 10 110 8 216 –18.7
Radiography 493 571 15.8
Nutrition and dietetics 229 248 8.3
Speech pathology/Audiology 252 401 59.1
Podiatry 114 145 27.2
Physiotherapy 681 784 15.1
Occupational therapy 440 665 51.1
Rehabilitation services – other 299 646 116.1
Optometry 184 172 –6.5
Pharmacy 536 682 27.2
Total 15394 14927 –3.0
Source: Australian Institute of Health and Welfare 2004a, 271.
5.2.4 Registration/licensing
Statutory boards in each of the States and Territories register doctors and other health professionals upon graduation and subject to requirements on practical training. Victoria, for example, in 2004 had �2 registration boards. These boards set the educational requirements necessary for registration and practice, set minimum standards of competence, set limits of liability, investigate cases
87
AustraliaHealth systems in transition
of malpractice, and can revoke licences to practise. The legislation allows for reciprocal recognition across States. The Council of Australian Governments in 2006 called for the establishment of one national authority to cover nine health professionals.
Accredited colleges, representing each of the medical specialities (for example, the Royal College of Surgeons) assist in determining educational curricula and examination requirements, as well as the criteria for registration as a practitioner. The colleges also set standards for the continuing medical education of health professionals. Postgraduate training involving Postgraduate Medical Councils in each State is accredited by the Australian Medical Council and is carried out in universities and by professional colleges. Postgraduate training in public health and health administration is offered at �2 universities.


89
AustraliaHealth systems in transition
Both public and private providers deliver health services in Australia. The private sector delivers much of the primary care and much specialist medical care, runs private hospitals, and offers most allied health care.
State and Territory governments run public hospitals, offer most public health programmes, and deliver a small amount of primary health care. Over the past decade, Commonwealth and State governments generally have sought to reduce their role in direct health service delivery and to increase the role of voluntary and for-profit providers.
6.1 Publichealth
The high level of health enjoyed by most Australians is partly due to past and continuing investments in public health. There have been a number of important public health initiatives in the last few years. The States have primary responsibility for public health including delivering population health services through Public Health Acts and other legislation. Local governments monitor sanitation and hygiene, food safety and water quality.
The impact of infectious disease has been much reduced but such disease still causes considerable morbidity. Old diseases return if prevention activities falter, while new diseases will continue to emerge. The Communicable Diseases Network Australia (CDNA) coordinates the surveillance of national communicable diseases, responds to significant communicable diseases outbreaks, develops national policy, and trains communicable disease epidemiologists. The National Notifiable Diseases Surveillance System, which comes under their auspices, as well as the Office of Health Protection in the Australian government Department of Health and Ageing, together coordinate
6 Provisionofservices

90
Health systems in transition Australia
the national surveillance of a range of communicable diseases. In accordance with State public health legislation, health care providers and public health units notify State and Territory health authorities of these diseases, who forward notifications to the Commonwealth for analysis and for publication in the regular Communicable Diseases Intelligence Bulletin.
Immunization is principally the responsibility of the States, with delivery involving State and Local governments and private general practitioners, although the relative balance of providers varies between States. The National Health and Medical Research Council recommends standard immunizations to protect children against diphtheria, tetanus, pertussis, poliomyelitis, invasive Haemophilus influenzae type b (HiB), measles, mumps and rubella. The national Immunise Australia Campaign, launched by the Commonwealth Government in �997, aims to achieve greater than 90% immunization coverage of children at two years of age, and near-universal coverage at school entry, for all diseases specified in the National Immunisation Schedule. Another target is near-universal coverage of girls and boys under �7 years of age for measles (Australian Institute of Health and Welfare 2004a, p. �56). The National Immunisation Committee oversees the programme and access to free vaccines. Australia has high levels of immunization for most vaccine-preventable diseases. For example, the Australian Childhood Immunisation Register calculated vaccination coverage at two years of age for measles at 3� March 2002 as 93.4% (Australian Institute of Health and Welfare 2004a, pp. �57–�58). This figure is among the high range of countries, although the goal is near-universal coverage (Fig. 6.�).
Australia’s burden of disease mostly involves noncommunicable diseases. Australia has identified seven national health priority areas for special attention: cardiovascular disease, cancers, injuries, mental health, diabetes, asthma, and arthritis and musculoskeletal conditions (Australian Institute of Health and Welfare 2004a, p. 388). These areas were selected for several reasons: they are major causes of premature death and poor health; they offer cost-effective opportunities for prevention and treatment; they exhibit marked population inequalities; and data are available to monitor progress towards specified targets. The burden of disease has been calculated for these conditions, as well as their associated health system costs, and a set of indicators has been developed in order to monitor progress towards national health targets.
As well as specific health programmes (such as managing hypertension), population health initiatives play an important role in improving the health status of Australians. For example, getting people to quit smoking will help their general health, as well as reduce mortality and morbidity from specific health problems such as cardiovascular disease and lung cancer. The Returns on Investment in Public Health report, commissioned by the Australian government Department of Health and Ageing and released in 2003, argued that spending on

9�
AustraliaHealth systems in transition
93
93
96
96
97
97
98
98
99
93
95
95
95
95
88
88
87
86
86
84
82
82
81
81
81
74
70 80 90 100
Fig.6.1 LevelsofimmunizationformeaslesinAustraliaandwesternEurope,2004
Australia
WesternEurope
Monaco
Andorra
San Marino
Spain
Finland
Netherlands
Denmark
Luxembourg
Israel
Portugal
Sweden
Iceland
Germany
Norway
Greece
Malta
Cyprus
France
Italy
Belgium
Switzerland
Ireland
United Kingdom
Turkey
Austria
Source: WHO Regional Office for Europe. European Health for All database, June 2006; OECD Health data, 2006.
92
Health systems in transition Australia
illness prevention measures such as public health interventions against tobacco consumption, heart disease and immunization against measles had produced some savings (Applied Economics 2003). The report made Australia a world leader, as few countries have conducted research on return of investment for prevention efforts.
Australia has adopted a number of national strategies aimed at addressing underlying and often interacting risk factors. The Commonwealth and States collaborate on many public health programmes, resulting in some successful public health outcomes. For example, there has been a dramatic reduction in coronary heart disease, a reduction in cigarette smoking, and a decrease in mortality from road traffic accidents (Australian Institute of Health and Welfare 2000).
A National Public Health Partnership was established between the Commonwealth and States from �996 in order to strengthen collaboration and to improve the health of Australians through a national approach to population health. The Partnership also involves the Australian Institute of Health and Welfare (AIHW) and the National Health and Medical Research Council (NHMRC). Its role is to identify and develop strategic and integrated responses to public health priorities in Australia. Current priorities include addressing issues of healthy weight, communicable disease control, environmental health, injury prevention, child public health, information development and workforce development and planning. The Partnership operates through working groups for each of these priorities. The information and evidence base is being strengthened through the Public Health Evidence Based Advisory Mechanism. Initiatives include the National Tobacco Strategy; Acting on Australia’s Weight; the National Public Health Nutrition Strategy 2000–20�0 (referred to as Eat Well Australia); Developing an Active Australia: a Framework for Action for Physical Activity and Health; and the National Primary Prevention Strategy (Australian Institute of Health and Welfare 2004a, p. �44).
The Commonwealth allocates specific-purpose public health grants to the States, now aggregated into “broadband” grants to allow more flexibility. These Public Health Outcome Funding Agreements, which are bilateral funding agreements between the Commonwealth and each State and Territory, also include performance indicators for national strategies such as preventive screening programmes. The current Agreements (2004–2009) have a focus on the following outcome areas: communicable diseases (particularly HIV/AIDS); cancer screening; and health risk factors, focusing on alcohol and tobacco use, women’s health, and sexual and reproductive health. Total Australian government assistance to the States and Territories over the five years of these agreements will be AU$ 8�2 million. Commonwealth support for public health programmes accounts for about one-third of community and public health expenditure, with

93
AustraliaHealth systems in transition
the balance coming from State and local governments (Australian Institute of Health and Welfare 2004a, p. 239).
All States have active health promotion programmes and list this area as a priority in their strategic health plans. A notable initiative is the Victorian Health Promotion Foundation, established in �987 as an independent board with bipartisan support, originally funded by a State tax on tobacco products and now funded through general taxation. The Foundation offers a substitute to tobacco industry sponsorship to the arts and sports, and supports health promotion programmes such as healthy eating, physical activity, sun protection and responsible drinking.
Tobacco control is an example of intergovernmental and cross-sectoral collaboration in interventions ranging across legislation, regulation, public education and service delivery. For example, governments have increased the price of tobacco products through taxes, regulate advertising, require health warnings on tobacco products, set �8 years as the minimum purchasing age, prohibit smoking in government buildings, while increasing legislation bans smoking in public places (Australian Institute of Health and Welfare 2000). Breast cancer screening is another example, with 57.�% of all women in the target group (aged 50–69 years) screened in 200�–2002, with slight reductions now evident in mortality rates (Australian Institute of Health and Welfare 2004a, p. 326).
Globalization is associated with increasing public health threats inter-nationally, as with the SARS and avian influenza outbreaks. The Commonwealth Government has provided funds to fast-track production of a pandemic influenza vaccine for Australia, and has so far committed a total of AU$ 495 million on pandemic preparedness. This includes AU$ 354 million on the Australian health response and AU$ �4� million to help Australia’s regional neighbours. In 2005 the Australian Government announced it will provide a further AU$ �84.8 million over five years to significantly boost Australia’s capacity to prepare and respond to major health emergencies such as an influenza pandemic. The new funding package will be used for a range of essential health measures, including the creation of the Office of Health Protection, a specialist unit within the Department of Health and Ageing, to ensure Australia is able to provide a sustained health response in a health emergency.
As in other countries, there is increasing focus on public health in Australia, and this is reflected in government policies and programmes. A range of initiatives has been implemented to shift the focus from the management of disease and illness to disease prevention and health promotion. A recent Commonwealth initiative is a new cancer agency, Cancer Australia, which will soon be established to guide improvements in prevention and promotion and

94
Health systems in transition Australia
provide support to consumers, health professionals and government. While these moves have been welcomed, critics still argue that there is insufficient expenditure on public health activities.
6.2 Patientpathways
The following patient pathway is provided to illustrate the typical sequence of events for an Australian entering the health care system. For example, a woman in need of a hip replacement due to arthritis would take the following treatment pathway:
She visits the GP of her choice (usually her regular physician), where she will pay nothing if the GP bulk-bills Medicare, or she will pay and later recoup �00% of the schedule fee from Medicare.
The GP refers her to a private orthopaedic specialist, where she will pay and then recoup 75% of the Medicare schedule fee, or the GP will refer her to the hospital orthopaedic outpatient department.
She has free access to any public hospital in Australia. It is likely that she will go to a hospital in her region, and her GP will advise her which hospital mainly on the basis of information about waiting time, and the GP’s personal view on the quality of care in the orthopaedic department.
If she does not want to wait, she can choose to be referred to a private specialist, who will treat her as a private patient in a public hospital, or treat her in a private hospital. Medicare will subsidize 75% of the medical specialist’s fee and ordered tests, but the patient must pay for accommodation in a private hospital either directly or through a private health insurance fund if she is a member. In 2003–2004, 62% of patients undergoing hip surgery chose the private option (Australian Institute of Health and Welfare 2005b, Table 4.5).
Her GP prescribes any necessary medication in the interim.
After referral for an outpatient appointment at a public hospital, the patient may have to wait for three months or more for an examination by a specialist.
After this she will have to wait for inpatient admission and surgery (the median waiting time for hip replacement surgery in Australia in 2003–2004 was 92 days with ��% waiting more than �2 months (Australian Institute of Health and Welfare 2005b, Table 6.5).
Following surgery and primary rehabilitation at the hospital (average length of stay of approximately eight days in uncomplicated cases in Australia
•
•
•
•
•
•
•
•

95
AustraliaHealth systems in transition
in 2003–04), the patient will go home where she might need home care (Australian Institute of Health and Welfare 2005b, Table 4.��).
If she is referred by the hospital or her GP, and is assessed as needing help by the home care agency, assistance will be provided by the district nursing service, the home help agency, or the delivered meals agency, for a means-tested charge.
The GP receives a discharge summary from the hospital. The GP is also responsible for further follow-up such as referral to a physiotherapist, to whom the patient will have to pay a small co-payment if a public agency, or a full payment for private treatment that may be covered by private health insurance.
The patient will also be given a follow-up appointment at the hospital outpatient department or with the private specialist to check the treatment’s outcome.
6.3 Primary/ambulatorycare
General practitioners provide the bulk of medical care consultations. They usually are the first point of medical contact (after pharmacists). They act as gatekeepers to the rest of the health care system, since Medicare will only reimburse the schedule fee for referred consultations, and a hospital outpatient department requires a referral from a GP if they wish to bulk-bill Medicare.
6.3.1 Generalpractice
General practice is the main form of medical practice in Australia, accounting for over 60% of active medical practitioners in 2005 (Australian Institute of Health and Welfare 2006, p. 3�7). General practitioners provide general medical care, family planning and counselling, perform minor surgery in their clinics, offer preventive services including immunization, offer health advice to patients, and issue pharmaceutical prescriptions. They initiate the majority of pathology and radiology investigations. Some general practitioners, mostly in rural areas, also undertake more complex surgical procedures, such as appendectomies.
The 200� National Health Survey found that nearly one in four people (24%) had consulted a doctor in the previous two weeks (up slightly from 23% in �995 and 20% in �989–�990), and most of these consultations were with general practitioners (2�.8%) (Australian Bureau of Statistics 200�). On another measure, however, consultations with doctors (clinic visits), have
•
•
•
96
Health systems in transition Australia
steadily decreased since reaching a peak of 6.7 consultations per year per head of population in �995–�996 to 5.85 in 2002–2003, a rate similar to other industrialized countries (OECD 2000; OECD 2004).
Surveys of general practitioners in 2003–2004 (Bettering the Evaluation and Care of Health – BEACH surveys) found that patients consult general practitioners on a wide range of problems. Hypertension was the most commonly treated health problem, followed by upper respiratory tract infection, lipid disorders, diabetes, osteoarthritis, back-pain, asthma, bronchitis, and immunization. Notably, general practitioners manage most problems, making only ��.6 referrals per �00 patient encounters. Over the five years of the BEACH surveys there has been a decline in prescribed medications (principally for antihypertensive and antibiotics) by GPs per �00 patient encounters from �09.7 in �998–�999 to �04.4 in 2003–2004 (Australian Institute of Health and Welfare 2000, p. 296; Britt et al. 2005). Ongoing research is needed to ascertain whether this decline is real, and whether it reflects the impact of a range of rational prescribing initiatives over the preceding years, such as the establishment of the National Prescribing Service as a source of independent advice on medicines.
General practitioners mostly are self-employed and run their practices as small businesses. Their fee-for-service source of income has shifted over the last few decades, however, from the private to the public purse (Medicare). Some general practitioners also enter into contractual arrangements with companies, for example, to provide health checks for employees. In the general practice industry, the majority (two thirds) of GP practices are solo practices but these employ only a minority (one third) of GPs. At June 2002, 68.5% of the 9600 GP practices in Australia were solo practices, employing 34.9% of Australia’s �8 867 GPs (Australian Bureau of Statistics 2003h). Since �998, there has been a trend towards the “corporatization” of practices with companies taking on the administration of practices under contract to practitioners. An estimated 7.8% of general practitioners worked in corporatized practices in 2002 (Department of Health and Ageing 2005g, p. 377). Sometimes this has involved the co-location of practitioners with pathologists and other specialists. Other models of ownership and integration are emerging including market-based cooperatives and serviced office arrangements where GPs collocate but retain ownership of their practice. A small number of general practitioners are salaried employees of Commonwealth, State or local governments.
The Commonwealth from �999 has funded Divisions of General Practice (��8 in 2005) that are intended to improve the quality of general practice by encouraging general practitioners to update their knowledge and skills, to cooperate more with other health professionals, and to undertake health promotion activities. The Divisions consist of groups of around �00–300 general

97
AustraliaHealth systems in transition
practitioners (GPs) in a geographic area and funding depends upon Divisions identifying local population needs and agreeing on appropriate outcomes. The Divisions offer general practitioners a network for professional support, connect them to other health professionals and consumers, run continuing medical education activities, fund and administer health promotion projects, and coordinate shared care arrangements (Swerissen and Duckett �997). The Divisions of General Practice are considered a successful initiative, with approximately 94% of GPs belonging to a local Division (ADGP 2005).
Vocational registration for general practitioners was introduced in �989, establishing general practice as a specialty in Australia. Around that time, strong growth was being experienced in the number of non-specialist medical practitioners, to the point where oversupply had become a matter of concern (Department of Health and Ageing 2005g, p. 95). In the subsequent decade additional requirements for accessing Medicare benefits for GP services, including legislation introduced in �996 by the Australian Government which made it mandatory for doctors to complete postgraduate training in the specialty of general practice before being granted a Medicare provider number, created a restraining influence on growth. Lower growth rates have meant that concerns about oversupply in general have been replaced by a focus on shortages and maldistribution (see Section 5.2.�, Medical practitioners).
The Practice Incentives Program (PIP) offers financial incentives for general practitioners to improve the quality and accountability of their medical services. The scheme has been successfully utilized to increase the adoption of effective information management systems, availability of after-hours service, the training of medical students, and participation in incentive programmes such as immunization. The Program has been successful in promoting change. For example by the end of 2003–2004, 95% of PIP practices used computers for clinical purposes. A majority of general practices in Australia participate in the PIP with 4650 practices involved in 2002–2003, and nearly 80% of GP patient services occurring in a participating practice (Department of Health and Ageing 2004a, p. �03).
The Enhanced Primary Care (EPC) scheme was introduced in �999 to provide more preventive care for older Australians, and to improve coordination of care for people with chronic conditions and complex care needs (Department of Health and Ageing 2004a, p. �0�). The programme provides a framework for a multidisciplinary approach to health. GPs have access to Medicare rebates for preparing and reviewing GP management plans for patients with chronic medical conditions, and for patients requiring multidisciplinary care GPs can also claim from Medicare for coordinating team care planning and review services. Service Incentive Payments (SIPs) were introduced from 200�–2002 to target chronic diseases, namely asthma, cervical screening, diabetes and mental health, which
98
Health systems in transition Australia
all come within national health priority areas. For example, GPs receive an extra payment for implementing a care plan over three visits for patients with moderate to severe asthma. Further, a new research initiative aiming to involve 600 general practices, the Australian Primary Care Collaborative Program, intends to promote a culture of quality improvement.
6.3.2 Otherprimaryhealthcare
Other health care professionals also provide primary health care. Nurses provide a large but unmeasured amount of primary care in general practitioner clinics, in public community health centres and in other venues. Services provided by nurses include health checks, immunizations, reproductive health checks and health counselling. Nurse consultations are not reimbursable under Medicare except for limited treatment by nurses employed in general practices, and the Commonwealth does offer subsidies to GP practices to employ nurses. Nurse practitioners potentially could undertake more primary care since they now work more independently and their roles and functions are expanding; for example, they prescribe a limited range of drugs and order medical tests. However, there are currently only a small number of qualified nurse practitioners in Australia. Primary health care is provided also by home nursing services and by nurses in public sector mother and baby health clinics.
Allied health professionals, such as physiotherapists and dieticians, also offer primary health care, working in both public and private employment. Consultations may be covered through private insurance schemes although not through Medicare. The exception is people with chronic diseases and complex conditions, who are entitled to Medicare rebates for five allied health and three dental services when referred by a general practitioner.
Community health centres are funded by the States, some operating as multi-service centres for a range of health and social services, as in the Northern Territory. Women’s health centres opened across Australia in the mid-�970s, funded originally under a Commonwealth community health programme, and numbered about 50 centres at their peak in the mid-�980s (Healy �998). Some other health services are run for particular populations, such as Indigenous Australians.

99
AustraliaHealth systems in transition
6.4 Secondary/inpatientcare
Ambulatory secondary care is provided by specialists in private practice, either in their own private consulting rooms, or in public or private hospital outpatient departments. Secondary care may also be provided in day hospitals or as inpatient care. Tertiary care refers to medical and related services of high complexity usually carried out in large acute care hospitals.
6.4.1 Specialists
Medical specialists have extensive postgraduate training in their specialty and must be certified by their specialist college, with an increasing number of sub-specialties being established over the last few decades. The number of specialists has increased greatly since the �960s (see Section 5.2 Human resources). All specialists train and most continue to perform some work in hospitals, while senior specialists also maintain private practices and academic appointments. Specialists are the main routes for admission to hospital for elective surgery, much of which is done in private hospitals. Specialists also perform in-hospital procedures for public and private patients.
6.4.2 Hospitalcare
The way that patients are managed in hospital has changed, as reflected in inpatient utilization indicators. In Australia, as in many OECD countries, patient throughput has increased dramatically with rising admissions, shorter stays, and higher occupancy rates. Therefore the number of acute care hospital beds per �000 population was reduced over the last decade or so in Australia (as noted in 5.�.� Infrastructure and capital investment). Admissions for acute care per �00 persons rose sharply in the �990s. However, the high admission rates for Australia recently, compared with other countries, are because same-day admissions are included in the Australian count (Table 6.�). A better measure is discharges, excluding same-day separations, with �5.7 discharges per �00 population in Australia, compared, for example, with 23.2 in the United Kingdom (OECD 2005).
The average length of stay (ALOS) in acute care hospitals (excluding same-day admissions) has fallen over the last few decades to 6.3 days in 2003–2004, reflecting more active patient management, less invasive surgical techniques and greater cost pressures (Australian Institute of Health and Welfare 2006, p. 362) and to around 3.4 days if same-day admissions are included. This trend is similar to many western European countries (Table 6.�). The Australian ALOS
�00
Health systems in transition Australia
is low given that over half of acute hospital patients are admitted and discharged on the same day for treatments such as chemotherapy and renal dialysis, as well as for same-day treatments using recent technological advances. Bed occupancy rates during the �990s were around 74%, with new treatments and cost-effectiveness pressures resulting in greater throughput.
Patients increasingly are treated on a same-day basis. For example, in �99�–�992, 3�% of separations (discharges) were same-day compared to 52.3% in 200�–2002 (Australian Institute of Health and Welfare 2004a, p. 278). In 2003–2004, 54% of the patients admitted for treatment in Australia’s public hospitals were admitted and discharged on the same day (Department of Health and Ageing 2005c, p. 8). A significant proportion may represent new patients who otherwise would not enter hospital (as suggested by rising admissions) rather than patients diverted from longer inpatient stays. The configuration of hospitals also is changing in response to new treatment methods. Separate centres, particularly in the private sector, are being built for same-day treatments such as day surgery and renal dialysis.
Waiting time for elective surgery in public hospitals is a vexed political issue. Overall, the median waiting time for patients who were admitted for elective surgery in public hospitals from waiting lists was 28 days between 2002 and 2003, and 27 days in the previous three years. In 2002–2003 this ranged from 22 days in Queensland to 46 days in the Australian Capital Territory (Australian Institute of Health and Welfare 2005b, p. ��2). The number of patients using private acute care hospitals increased throughout the �990s, despite the earlier decline in private health insurance cover, and admissions in 2003–2004 continued to grow at a faster rate than for public hospitals, with 39% of all hospital admissions being private patients (Department of Health and Ageing 2005c, p. �7).
Hospitals also provide outpatient services, with public hospitals in 2003–2004 reporting �858 “occasions of service” per �000 weighted population. Consistent data are not available, however, and a new data collection system is being developed (Department of Health and Ageing 2005c, p. 44). As noted in Section 4.3, State governments have a financial incentive to shift outpatient consultations from public sector hospitals to Medicare-subsidized consultations in the community.
6.5 Pharmaceuticalcare
(The organization of the pharmacy sector and pharmaceutical industry is discussed in Section 5.�.4 Physical and human resources. Pharmaceutical

�0�
AustraliaHealth systems in transition
assessments are discussed in Section 3.2.� Health technology assessment. Consumer entitlements are discussed in Section 2.5.� Entitlements and benefits).
As part of a broader National Medicines Policy, the Pharmaceutical Benefits Scheme (PBS), in operation since �948, aims to provide “timely access to the medicines that Australians need, at a cost individuals and the community can afford”. Initially the selection of medicines for listing on the PBS was made on the basis of clinical need alone, largely irrespective of cost. However, since �988 medicines being considered for inclusion on the PBS are evaluated for comparative effectiveness and cost-effectiveness, with economic evaluation mandatory since �993.
Table6.1 InpatientutilizationandperformanceinacutehospitalsinAustraliaandwesternEurope,2004orlatestavailableyear
Hospitalbeds
per1000population
Admissionsper100
population
Averagelengthof
stayindays
Occupancyrate(%)
WesternEuropeAndorra 2.1 10.0 6.7e 70.0e
Austria 6.0a 28.8a 6.4a 76.2a
Belgium 4.8 16.9e 8.3a 65.9a
Cyprus 4.0a 8.1a 5.5a 72.8a
Denmark 3.2a 17.8c 3.6a 84.0c
Finland 2.2 19.9 4.2 74.0i
France 3.8a 16.6d 6.1a 84.0a
Germany 6.4 20.4 8.7 75.5Greece 3.8g 14.5f 6.4f 66.6f
Iceland 3.7h 14.7a 3.6a –Ireland 2.9 14.1 6.5 85.4Israel 2.1 17.3 4.2 98.0Italy 3.6a 15.2b 6.8b 76.9b
Luxembourg 5.5a 18.4j 7.7f 74.3j
Malta 3.0 10.7 4.6 85.4Monaco 15.5i – – –Netherlands 3.1b 8.8c 7.4c 58.4c
Norway 3.1 17.3 5.2 86.4Portugal 3.1a 11.2e 8.2e 85.2a
Spain 2.8b 11.7b 7.0b 78.2b
Sweden 2.2 15.1 6.1 77.5h
Switzerland 3.9a 16.3f 9.0a 85.2a
Turkey 2.3 8.1a 5.6a 64.9United Kingdom 2.4f 21.4h 5.0h 80.8f
Australia 3.6* 20.7* 3.8* 73.5**
Source: WHO Regional Office for Europe. European Health for All database, June 2006; * Australian Institute of Health and Welfare, 2006; ** OECD Health data, June 2006.
Notes: a 2003; b 2002; c 2001; d 2000; e 1999; f 1998; g 1997; h 1996; i 1995; j 1994; CIS: Commonwealth of Independent States; EU: European Union.
�02
Health systems in transition Australia
In 2003–2004, the total cost of the PBS to the government was AU$5.6 billion, an increase of ��% over 2002–2003. Approved medicines are listed in the Schedule of Pharmaceutical Benefits, which is published three times a year. As of August 2005, the Schedule contained 605 drug substances, �58� items and 2703 brands.
As discussed in Section 2.5.�, patients are required to make a co-payment toward the cost of their PBS medicines, depending upon individual and/or family income. In addition PBS safety nets protect individuals and families from the financial burden incurred through high medicine usage.
Before a medicine can be sold in Australia, it must be assessed for its safety, quality and efficacy by the Therapeutic Goods Administration. Once the TGA has approved the medicine for marketing, a submission can be made to the Pharmaceutical Benefits Advisory Committee (PBAC) for listing on the PBS. The PBAC is a statutory independent expert committee established under the National Health Act �953 to make recommendations to the Minister for Health and Ageing on which medicines should be included on the Schedule of Pharmaceutical Benefits and any conditions that should apply. Section �0�(3) of the National Health Act �953 requires that, when considering a proposal for listing, the PBAC takes into account information on the comparative clinical effectiveness, safety and cost-effectiveness of the new product. A product that is more costly is generally only recommended for subsidy if it provides a significant improvement in effectiveness or reduction in toxicity.
The Act does not prevent the PBAC from taking into account any other factor that is relevant. Other relevant factors that the PBAC has identified include the clinical need for the drug; extent of uncertainty relating to costs and health outcomes; the total annual costs to the PBS; and the likelihood of the drug being prescribed beyond any restriction for subsidy and the available methods of limiting this.
Positive listing recommendations by the PBAC are advisory only, with the final decision as to whether, and how, to list being taken at government level. A recommendation by the PBAC for listing of a product, or extension of the terms of an existing listing, is then referred to the Pharmaceutical Benefits Pricing Authority (PBPA) which provides advice regarding negotiation of an appropriate price. The PBPA is a non-statutory body whose role is to advise the Minister for Health and Ageing on the pricing of pharmaceutical benefits supplied under the PBS. The Authority recommends the prices for new drugs and reviews the prices of drugs listed in the PBS schedule at least annually. The PBAC and PBPA recommendations are then referred to the Minister for Health and Ageing for decision. Where a proposed listing is expected to add

�03
AustraliaHealth systems in transition
AU$ �0 million or more per annum to the cost of the PBS, it is also undergoes whole-of-government consideration.
The main pricing method used by the PBPA is reference pricing, whereby the price of medicine is determined by its relationship to either the price and/or the therapeutic benefit of another medicine. “Cost minimization” is the simplest form of reference pricing and is usually applied when the PBAC believes, on the basis of evidence put before it, that a drug provides a similar health outcome (therapeutic benefit) as another drug listed on the PBS (the comparator). The new drug will be linked by a “therapeutic relativity” to the comparator, either joining an existing reference group or forming a new one. Cost minimization ensures the price per quantity of the new drug is no more than the price of a therapeutically equivalent quantity of the comparator. The price the government pays for each drug in a reference group is set by the lowest price (“the benchmark”) which has been secured for any drug in the group. The therapeutic relativity is based entirely on therapeutic benefit, thus the price of a drug which remains under patent may be linked to that of a drug for which the patent has expired and generic versions are available.
Special patient contribution (SPC) arrangements apply where there is a disagreement between the sponsor and the government over the price of PBS medicine, and the government believes that the medicine in question should remain listed on the PBS. In these circumstances, a premium comprising the difference between the acceptable price of the drug and what the sponsor is willing to accept is imposed. Patients pay the extra charge together with the usual patient co-payment.
New pricing and listing arrangements for generic medicines were introduced in August 2005. A minimum �2.5% price reduction is required when the first new brand of any existing PBS medicine is listed. The “first new brand” means the first new brand listed on or after � August 2005, regardless of the number of brands of that medicine already listed prior to that date. The price reduction is applied once only for each medicine, including those medicines in a reference priced group where a reduction has occurred as a flow-on from another medicine.
The use of generic medicines in Australia is low by international standards, with generic medicines accounting for around �0% of PBS script volume and approximately 20% of PBS expenditure. Recent policy initiatives have sought to encourage the greater use of generics. For example, pharmacists are able to substitute an identical generic product without reference to the prescriber, unless the doctor has indicated on the prescription that substitution should not take place. Additional measures to encourage the use of generic medicines include:

�04
Health systems in transition Australia
Government regulations to ensure that prescribing software used by doctors enables the prescribing of a drug by its generic or international non-proprietary name (INN), unless the prescriber specifically chooses a brand.
An information campaign to target prescribers, pharmacists and consumers highlighting the safety and quality of generic medicines and the importance of providing consumers with choice.
Proposed changes to the regulations covering pharmacy dispensing labels, to help increase consumer awareness of the active ingredients in medicines.
Mandatory flagging of bioequivalent medicines in the PBS schedule to promote substitution.
Pharmacy price lists to provide consumers with greater information on the cost of individual brands of medicines.
Direct to Consumer Advertising for prescription medicines is prohibited in Australia. Information about prescription medications is available in the form of Consumer Medicines Information and Approved Product Information, which are approved by the TGA as part of the regulatory process. The advertising of prescription medicines to prescribers is co-regulated with the pharmaceutical industry. The peak industry body, Medicines Australia, has developed a Code of Conduct that sets standards for the ethical marketing and promotion of prescription pharmaceutical products. The Code complements the requirements of the Therapeutic Goods Act �989, the accompanying Therapeutic Goods Regulations �990 and the Therapeutic Goods Advertising Code 2005.
Australia has a strong intellectual property protection framework compliant with the Agreement on Trade-Related Aspects of Intellectual Property Rights (TRIPS). Under Australian law, the rights of patent holders are protected through the Patents Act �990. Patent protection is provided for 20 years with patent term extension allowed under certain conditions, in recognition of the long lead time required to bring pharmaceutical products to market. Effective patent life is fifteen years. In addition, test data are protected for 5 years. The combination of the Patents Act �990, Therapeutic Goods Act (�989) and the National Health Act �953 strike a balance between the interests of patent holders and the rights of generic manufacturers to bring products to market following the expiry of a patent on a pharmaceutical product. Effective “springboarding” provisions also exist where a patent term extension has been granted to enable generics manufacturers to prepare for patent expiry by enabling marketing approval processes to occur before the patent period has expired.
•
•
•
•
•

�05
AustraliaHealth systems in transition
6.6 Rehabilitation/intermediatecare
Rehabilitation and intermediate services following an acute medical event are provided in a variety of settings in Australia, including hospitals, outpatient facilities, and community and home care. Specific rehabilitation programmes following medical conditions, such as myocardial infarction, stroke and spinal injury have expanded in recent years and are provided primarily by hospital rehabilitation units conforming to national guidelines. As with health care services in general, there are issues of limited access and utilization of rehabilitation services in rural and remote settings, and amongst Indigenous Australians (Aoun and Rosenberg 2004; Bunker and Goble 2003).
Public vocational rehabilitation services in Australia are funded under the Disability Services Act �986, and are provided by the Commonwealth Rehabilitation Service (CRS Australia), which operates as a business unit within the Department of Health and Ageing. CRS Australia provides vocational rehabilitation services to people with disabilities with the aim of assisting them to gain or retain employment. Assistance was received by �7 09� new clients in the financial year 200�–2002, along with �3 ��4 existing clients. Of the �0 790 new clients who completed a rehabilitation programme, 57% achieved an employment outcome of �3 weeks or more. Over half (57.3%) of new CRS Australia clients had a physical disability, followed by 26% with a psychiatric disability and 5.3% with acquired brain injury (Australian Institute of Health and Welfare 2003b, pp. 366–367).
6.7 Long-termcare
Long-term care is provided to people with a high level of dependency. These may be frail older people, people with physical or intellectual disabilities, or people with mental health problems. Long-term care is funded by all levels of government and is delivered by a mixed economy of government, voluntary sector, and commercial providers. Both health and social care are involved in long-term care, and the boundary depends upon how the issue is framed; activities across the “interface” thus are subject to continuing negotiations. Also, long-term care needs might be met either by residential or community-based services, but increasingly by the latter. Long-term care is a controversial and peripatetic policy area – its shifts between government departments reflecting problematic cross-sectoral issues.
�06
Health systems in transition Australia
6.7.1 Agedcare
The priority attached to ageing-related health and welfare issues has increased substantially as the population ages (as noted in �.2.2 Population ageing). This demographic transition presents both opportunities and challenges for Australia (Healy 2004) and has been the topic of several recent government reports (Treasurer 2002; Productivity Commission 2005c). The policy area is increasingly well documented (Australian Institute of Health and Welfare 2002) and a National Strategy for an Ageing Australia has been developed by the Commonwealth Government to provide a framework for responding to the changes that population ageing will bring (Australian Institute of Health and Welfare 2003b, p. 275). In Australia, aged care services require collaboration across all levels of government, as well as nongovernment sectors, in policy-making, financing, administering, and providing services.
The Commonwealth introduced nursing home subsidies in �962 as part of policy intended to shift the long-term care of older people out of hospitals. Policies from the �980s onwards have aimed to contain the growth and cost of nursing home places and to regulate the quality of care (Howe �998). Community care has received increasing emphasis beginning with the implementation of the Home and Community Care Program (HACC) in �985, and its rapid expansion in subsequent years. The development in the �990s of respite care services, and the rapid growth of Community Aged Care Packages (community care equivalent to low-level residential care), further supported the growth of community-based care. In 200�–2002, the Commonwealth Government established the Extended Aged Care at Home Program to provide high-level aged care to people in their own homes (Australian Institute of Health and Welfare 2003b, pp. 278–279). Also in 200�, Commonwealth funding was provided to identify “best-practice” models for day therapy centres to better coordinate allied health with other health and aged care services, while the national Innovative Pool was established in the 200�–2002 financial year in order to test alternative service models of flexible care. Some projects were developed, in collaboration with State governments, to test service delivery models to assist older Australians leaving hospital but not yet able to live independently at home (Australian Institute of Health & Welfare 2003d).
Services for people with assistance needs that could be expected to be met by residential aged care require a recommendation from an Aged Care Assessment Team. Such services include permanent residential care, respite residential care, Community Aged Care Packages, and Extended Aged Care at Home places (equivalent to high-level residential care). Other community-based services are available more broadly provided through the HACC Program. In 200�–2002, HACC assistance for those living in private households was received by 87

�07
AustraliaHealth systems in transition
people per �000 population aged 65–74, 245 people per �000 population aged 75–84, and 425 per �000 aged 85 years or more (Australian Institute of Health and Welfare 2004a, p. 378).
6.7.2 Disabilityservices
Disability services are funded under Commonwealth and State Disability Agreements and involve both public and private sectors (Australian Institute of Health and Welfare 2004a, pp. 308–309). Responsibility has shifted between health and welfare portfolios, and at the Commonwealth level comes under the Department of Family and Community Services (FaCS). Disability assistance includes residential care, income support, employment services, rehabilitation services, equipment or environmental modifications, and personal care. The policy is to maintain people with disabilities as far as possible in the community, to promote independence, to improve access, and to promote involvement as members of the community. The National Disability Advisory Council established in �996 advises government on policies and programmes. Following the Commonwealth Disability Discrimination Act �992, standards and guidelines have been implemented in areas such as the workplace and public transport. The prevalence of disability in the community is measured by the presence of �7 limitations, restrictions or impairments, most recently in the 2003 Survey of Disability, Ageing and Carers (Australian Bureau of Statistics 2004o).
Under the Agreement, the Commonwealth has responsibility for the planning, policy setting and management of employment services, whereas the States are responsible for all other specialist services, including accommodation support, community support and respite. While, in practice, services generally are directed to people aged under 65 years, there are no age-based restrictions on access. Of total government expenditure on disability support services, accommodation support services accounted for over half the expenditure. Consumer surveys indicated that the proportion of Indigenous clients accessing services was roughly equivalent to the proportion (2.6%) of Indigenous Australians in the general population aged under 65 in 2002. However, it is likely that “this amounts to under-representation in, or poor access to these services, as the evidence points to higher rates of disability among Aboriginal and Torres Strait Islander peoples” (Australian Institute of Health and Welfare 2003d, p. 36�).
�08
Health systems in transition Australia
6.8 Servicesforinformalcarers
In 2003 there were 2.6 million carers providing some assistance to people who needed help because of disability or age. About one-fifth (�9%) of these were primary carers who provided the majority of informal help required (Australian Bureau of Statistics 2004o). Because many carers are hidden, however, the actual figures are probably higher. Informal support by family, friends and neighbours on an unpaid basis increasingly is recognized as an important source of support. Informal carers have played a pivotal role in the deinstitutionalization of aged care and disability services, since the shift to caring for people with a disability in the community depends on the availability of informal carers prepared to take on a caring role (Australian Institute of Health & Welfare, 2003d). But carers also can experience social isolation, physical and emotional stress, and reduced education and employment potential. As such, carers themselves can require support.
The Home and Community Care Program provides community care services to older people and to people of all ages with disabilities, and notably, also to their carers. The aim is to support independence and to avoid premature or inappropriate admission to long-term residential care. Carers are represented at the State and national level by Carers Australia, which conducts research, makes policy submissions, produces publications and undertakes advocacy on relevant issues. Care coordination and planning services, such as Community Aged Care Packages, help carers to access a range of professional and domestic service providers, and coordinate service delivery on behalf of their care recipients if necessary. Respite care is accessible through several programmes including services under the Commonwealth–State/Territory Disability Agreement, the Home and Community Care Program, Community Aged Care Packages and Veterans’ Home Care.
Among all people living in households in �998 who received assistance with the core activities (self-care, mobility and communication), 3% said they were assisted only by formal service providers, while 46% said they received assistance only from informal carers, and 48% said that they received assistance from both informal carers and formal services (Australian Institute of Health & Welfare 2003d). The imputed value of unpaid informal care during 2000–200� was AU$ 28.8 billion, compared with AU$ �3.7 billion in expenditure incurred by governments. Government pensions and allowances were the principal source of income for over one half (56%) of primary carers and 40% of all carers in �998 (Australian Institute of Health & Welfare 2003d, pp. 76–79).

�09
AustraliaHealth systems in transition
6.9 Palliativecare
The States plan and deliver palliative care and related services in Australia, with the Commonwealth providing funding and strategic direction, as set out in the National Palliative Care Program in 2000. To support the national strategy, the Australian Government has committed AU$ 20�.2 million over 5 years for 2003–2008. Other key stakeholders include Palliative Care Australia, the national peak body for palliative care in Australia, educational institutions, research institutions, health professionals and community groups. The national strategy has targeted priority areas to improve palliative services available in Australia including initiatives to improve access to medications for palliative care in the community; assistance for families and increased support to other care networks; and capacity-building in the palliative care research community. In general, State-run palliative care services include community teams based in capital cities and regional locations, nurse consultants who undertake liaison roles in hospitals, and dedicated palliative care public hospital and hospice beds Community-based services include medical and nursing services providing telephone advisory service and home visits. Throughout most States there is also a significant contribution by palliative care-trained volunteers.
6.10 Mentalhealthcare
Mental health is one of the national health priority areas. In the 200� National Health Survey, nearly �0% of respondents reported a long-term mental health or behavioural problem. The �997 National Survey of Mental Health and Wellbeing provided epidemiological data on the mental health status of the population and gathered benchmark information that can be used to improve the delivery of mental health services. Of the mental disorders that resulted in overnight hospitalization in 200�–2002, the most common were schizophrenia and delusional disorders, followed by depression, neurotic disorders such as anxiety states and mental disorders due to psychoactive substance abuse (Australian Institute of Health and Welfare 2004a, pp. 7�, 3��).
The mental health sector has been radically restructured over the last few decades, so that people with mental health problems now mostly are treated in the community rather than in long-stay psychiatric hospitals. The move from institutional to community care became possible from the �960s onwards with advances in psychotropic drugs and changing attitudes towards incarcerating people (Australian Institute of Health and Welfare 2004a, pp. 304–307). Beds in public psychiatric hospitals in Australia fell from 0.8 per �000 in �986 to

��0
Health systems in transition Australia
0.� in 200�–2002; between �992 and 200�–2002, the number of hospitals fell from 45 to 22 and beds from 7266 to 2457. The National Mental Health Strategy aims to “deinstitutionalize” and “mainstream” by strengthening community mental health services and by moving treatment out of psychiatric hospitals and into general hospitals. The role of nongovernmental organizations (NGOs) in the provision of community mental health services has expanded over the past decade. Additionally, the involvement of consumers and carers in service planning and delivery was a key part of the strategy, with federal funding being contingent on the establishment of community advisory groups. Government funding for mental health increased by 65% between �993 and 2002. While the National Mental Health Strategy has generally been successful, the criticisms are that policies have not been properly implemented in all States, promised funding has not been delivered, and there are concerns over rights and appropriate treatment (Whiteford and Buckingham 2005). Recent campaigns include the “Beyond Blue” campaign to reduce stigma and publicize the treatment opportunities for depression.
6.11 Dentalhealthcare
The dramatic improvement in dental health in Australia over the last few decades (as noted in �.5.4 Oral health) is attributed to water fluoridation, public health campaigns, and public dental services for school-age children (Australian Institute of Health and Welfare �998b, p. �3�). Most dental and allied health services are provided in private practice. The Commonwealth and the States play different roles in supporting Australia’s mixed system of public and private dental and allied health care. State-run services provide dental care for school children, with 60% of children aged 5–9 years using such services during 200� (Australian Institute of Health and Welfare 2004a, p. 303–304). The States traditionally have subsidized dental services for low-income adults, with Commonwealth assistance from �992 until this was discontinued in �996 (Lewis 2000). Individual States continue to provide dental services for low-income adults but generally dental care is financed and delivered privately. As a result, dental services account for a considerable proportion of out-of-pocket health care expenditure borne by Australians, accounting for nearly 20% of all such payments by consumers in 2003–2004 (Australian Institute of Health and Welfare 2005a, p. 35).
According to the Department of Health and Ageing, the key to accessing affordable services has been through private health insurance ancillary cover, which is supported by Australian Government funding through the private

���
AustraliaHealth systems in transition
health insurance rebate (Department of Health and Ageing 2003). However, less than half of the Australian population has private health cover, and income is the strongest predictor of private health cover. Access and equity therefore are problems for people on lower incomes, and for patients with high volume demand for dental services such as those with chronic care needs. Data indicate that cost impacts on utilization rates, since the proportions of people not making a dental visit at all in the previous year are highest for the lowest income group (5�%), decreasing to 37% in the highest income group (Australian Institute of Health and Welfare 2004a, pp. 304–305).
6.12 Alternative/complementarymedicine
Complementary and alternative health services are widely used in Australia. The National Health Survey in 200� found that 3.5% of the population had consulted a complementary or alternative health professional in the previous two weeks, while a survey in South Australia undertaken in 2000 reported that 26% of female respondents and 20% of male respondents had visited an alternative therapist in the previous year. Chiropractors, naturopaths and acupuncturists were the most commonly visited (Australian Institute of Health and Welfare 2004a, p. 3�7). In 2000 Australians were spending an estimated AU$�67� million annually on complementary medicines and a further AU$6�6 million on complementary health practitioners – nearly four times the public contribution amount to pharmaceutical drugs (McLennan et al 2002). It is estimated that more than 60% of Australians currently use complementary medicines at least once a year, and that this figure will probably rise. In May 2003, however, public confidence was shaken by the unprecedented recall of complementary and other medicines from one manufacturer who failed to maintain appropriate manufacturing and quality control standards.
Regulation of the safety and quality of complementary medicines is the responsibility of the Therapeutic Goods Administration, specifically the Office of Complementary Medicine, which monitors the marketing of these products and the recall of faulty or potentially dangerous products. In addition to its regulation role, the Office provides information on complementary medicine for Australians. The regulation of complementary health practitioners is the responsibility of State governments, and to date Victoria is the only State that requires practitioners to be registered when supplying acupuncture or herbal medicine services, as legislated under the Chinese Medicine Registration Act 2000 (Parker 2003). There is, however, a push towards national regulation. Additionally, many general practitioners practice forms of complementary
��2
Health systems in transition Australia
therapies, particularly acupuncture, with one in seven practitioners reported to use it in practice, while Medicare offers accredited medical practitioners rebates for these services (Easthope et al. �998).
6.13 Healthcareforspecificpopulations
6.13.1 Ruralhealthcare
People in rural and remote areas in Australia not only suffer from poorer health than their urban counterparts (as noted in �.2.4 Urbanization). They also have less access to health care services, partly due to difficulties in recruiting and retaining health professionals in rural communities, and there is evidence they are exposed to different health risks (Australian Institute of Health and Welfare �998a; Australian Institute of Health and Welfare 2004a, p. 208). Historically, services in these areas have been provided by often-isolated practitioners, supported by small bush hospitals providing a limited range of services. The Royal Flying Doctor Service has played an important role in overcoming the “tyranny of distance”. While improved telecommunications now support health professionals, new medical graduates can find themselves out of range of mobile telephone networks in rural and remote areas. Steps taken in recent years to address rural challenges include the “More Doctors, Better Services” component of the 2000–200� Federal Budget. The initiative included: greater incentives for general practitioners to practice in rural areas; an increase in the level of support and education for health professionals in rural areas; and an increase in rural health services (as described in 5.2.�, Medical practitioners). A specific feature was the Regional Health Strategy that aims to work with small rural communities to identify local area health priorities, and support new health services designed to meet these needs. It focuses on community involvement to develop local solutions for local problems (Commonwealth of Australia 2004c).
The Regional Health Strategy was reviewed and evaluated in 2003–2004, finding that a number of programmes had been successful in increasing access to services and in meeting community need, including the establishment of training programmes for rural doctors. Following the review, a new Rural Health Strategy was announced in the 2004–2005 budget. Nonetheless, rural health is an ongoing concern and a number of long-term challenges remain, including:
continuing to increase the number of general practitioners, specialists and other health professionals in rural areas;
•

��3
AustraliaHealth systems in transition
increasing the number of students undertaking health and medical training in rural settings;
providing primary and other health services to more remote regions and increasing the focus on preventive health; and
addressing the causes of health differences between metropolitan and rural and remote Australians (Department of Health and Ageing 2004a).
The National Rural Health Alliance, comprised 24 member bodies representing health consumers and health providers, is the peak body working to improve the health of Australians in rural and remote areas.
6.13.2 HealthcareforIndigenousAustralians
Minority population groups typically encounter a range of barriers in using health care services that generally are designed for the majority of the population (Healy and McKee 2004). While there are problems with the statistics on health service use by Aboriginal and Torres Strait Islander peoples, partly because Indigenous people are not necessarily identified in administrative records, the available statistics and studies indicate that Aboriginal and Torres Strait Islander peoples have lower levels of access to, and use of, primary health care and pharmaceuticals, but use public hospitals more than the non-Indigenous population (Australian Bureau of Statistics 2005d). The higher rate of hospitalization is thought to be in part due to the delayed presentation and utilization of ambulatory care. According to a report in 2005 by the Australian Bureau of Statistics, Indigenous Australians face a number of barriers to accessing services including distance from services, lack of transport (particularly in remote areas), financial difficulties, lack of proximity of culturally appropriate services, and a lack of Indigenous health professionals. Commonwealth and State governments therefore fund Indigenous specific health services, controlled by local communities in order to offer more accessible and responsive services to Indigenous Australians. Community-controlled agencies offer primary health care in many urban, rural and remote Indigenous communities (Australian Institute of Health and Welfare 2004a, p. 320). Claims by the Indigenous population to control their own health care services, and the relationships between the various interest groups, have been a highly political process (Griew et al. 2004).
Doctors working for Indigenous agencies generally bulk-bill Medicare plus the agencies receive money for special programmes. The Commonwealth funds community-based services through the Office for Aboriginal and Torres Strait Islander Health (OATSIH). This includes outreach primary care services, programmes to combat infectious diseases, substance abuse programmes, and
•
•
•
��4
Health systems in transition Australia
coordinated care trials. According to an analysis of health expenditure in 200�–2002, about AU$ 390� per capita was spent on health services to Indigenous Australians, compared with AU$ 3308 for services to non-Indigenous people, a difference of �8% (Australian Institute of Health and Welfare 2005d, p. xvii). This has not been sufficient, however, to close the large health gap between Indigenous and other Australians.
��5
AustraliaHealth systems in transition
The Australian health care system generally enjoys both political and public support so that changes, although extremely numerous, have been incremental rather than big-bang in nature. Medicare stands out
as the sole example of major structural reform in the past few decades. Radical change is extremely difficult in the Australian political system (compared, for example, with New Zealand or the United Kingdom) given the federal form of government, the many checks and balances, and the necessity to achieve agreement between the Commonwealth and the States (Bloom 2000b; Palmer and Short 2000).
Australia, like other OECD countries, embarked upon numerous health system reforms from the �980s onwards (Ham �998; Saltman et al. �998). Market-like reforms have been introduced such as budgetary incentives, funding hospitals according to performance, greater emphasis upon micro-efficiency, some limited separation of purchasers and providers, and treating patients as customers. The main determinants of reform over the last decade in the Australian health care system, as in many OECD countries, have been efforts to contain costs and achieve greater equity, efficiency and effectiveness. More recent attention has been paid to ensuring the quality of health care, promoting evidence-based medicine, measuring health outcomes and increasing the focus on prevention. The ongoing pressures between supply and demand, and the changing policy environment mean that health care is a dynamic rather than a static system. The particular concerns in Australia are as follows:
cost pressures upon Commonwealth and State governments given limited budgets and rising health expenditures;
rising out-of-pocket expenditures for consumers;
barriers to greater coordination and accountability in financing and service provision, particularly between the Commonwealth and States;
•
•
•
7 Principalhealthcarereforms
��6
Health systems in transition Australia
the need to ration supply in the face of growing demand fuelled, for example, by new technologies, rising expectations and an ageing population;
the lack of integration of health care services particularly for patients with complex health needs;
workforce shortages and maldistribution of health professionals, associated with difficulties in recruitment and retention;
the persistence of serious health inequalities, most notably affecting Aboriginal and Torres Strait Islander people; and
the need to raise and monitor standards to improve the safety and quality of health care.
The four main objectives of current heath care reforms in Australia are:
�. to build a high-performing and sustainable health care system that provides cost-effective health services;
2. to improve coordination and accountability in the funding and provision of services;
3. to ensure that the public sector is complemented by a private sector that expands choice, and which is fair, affordable, and represents good value for money;
4. to improve the health outcomes of all Australians, particularly Indigenous Australians, and those living in rural and remote areas.
7.1 Analysisofrecentreforms
The three main historical phases during the 20th century in the development of the Australian health care system can be summarized as follows.
In the first phase in the post-war years, a national health care system was established. The Australian Government began to play a significant role in health matters only after the Second World War, in line with international developments in post-war “welfare states”. The �946 referendum followed by a Constitutional amendment (Section 5�, xxiiia) allowed the Commonwealth to make laws affecting health including the “provision of pharmaceutical, sickness and hospital benefits, medical and dental services”. Under the Hospital Benefits Act �946, the Commonwealth and States negotiated agreements on funding public hospitals. In the �950s the Commonwealth began to subsidize drug purchases under the Pharmaceutical Benefit Act �950, and medial services under the National Health Act �953. Passage of the National Health Act �953 consolidated the main pillars of the Australian post-war health care system:
•
•
•
•
•
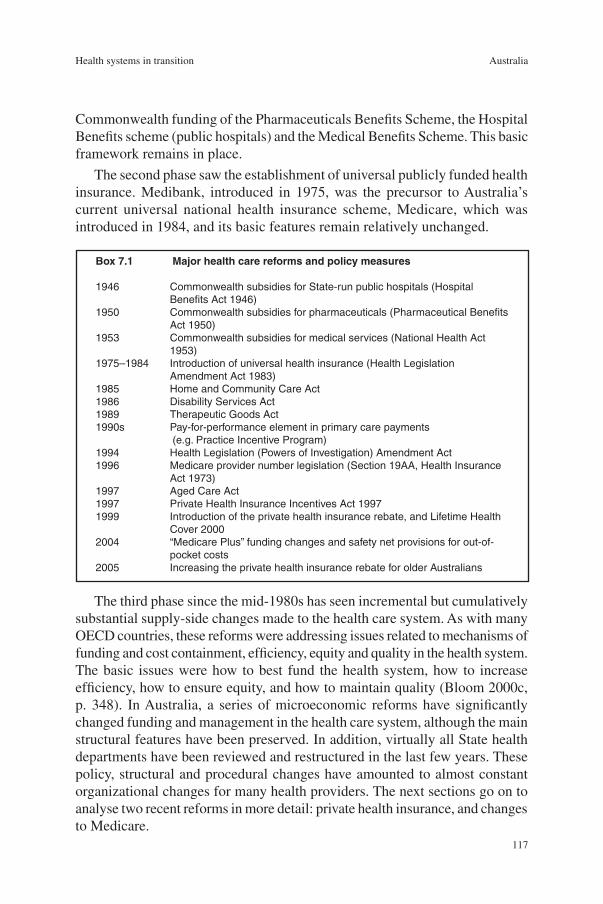
��7
AustraliaHealth systems in transition
Commonwealth funding of the Pharmaceuticals Benefits Scheme, the Hospital Benefits scheme (public hospitals) and the Medical Benefits Scheme. This basic framework remains in place.
The second phase saw the establishment of universal publicly funded health insurance. Medibank, introduced in �975, was the precursor to Australia’s current universal national health insurance scheme, Medicare, which was introduced in �984, and its basic features remain relatively unchanged.
Box7.1 Majorhealthcarereformsandpolicymeasures
1946 Commonwealth subsidies for State-run public hospitals (Hospital Benefits Act 1946) 1950 Commonwealth subsidies for pharmaceuticals (Pharmaceutical Benefits Act 1950)1953 Commonwealth subsidies for medical services (National Health Act 1953)1975–1984 Introduction of universal health insurance (Health Legislation Amendment Act 1983)1985 Home and Community Care Act1986 Disability Services Act1989 Therapeutic Goods Act1990s Pay-for-performance element in primary care payments (e.g. Practice Incentive Program)1994 Health Legislation (Powers of Investigation) Amendment Act1996 Medicare provider number legislation (Section 19AA, Health Insurance Act 1973)1997 Aged Care Act1997 Private Health Insurance Incentives Act 1997 1999 Introduction of the private health insurance rebate, and Lifetime Health Cover 20002004 “Medicare Plus” funding changes and safety net provisions for out-of- pocket costs2005 Increasing the private health insurance rebate for older Australians
The third phase since the mid-�980s has seen incremental but cumulatively substantial supply-side changes made to the health care system. As with many OECD countries, these reforms were addressing issues related to mechanisms of funding and cost containment, efficiency, equity and quality in the health system. The basic issues were how to best fund the health system, how to increase efficiency, how to ensure equity, and how to maintain quality (Bloom 2000c, p. 348). In Australia, a series of microeconomic reforms have significantly changed funding and management in the health care system, although the main structural features have been preserved. In addition, virtually all State health departments have been reviewed and restructured in the last few years. These policy, structural and procedural changes have amounted to almost constant organizational changes for many health providers. The next sections go on to analyse two recent reforms in more detail: private health insurance, and changes to Medicare.

��8
Health systems in transition Australia
7.1.1 Voluntaryprivatehealthinsurance
The appropriate role of public and private insurance in the overall funding of health is an ongoing debate, and an area that has undergone significant change in the last decade (see Section 4.�.3 Voluntary health insurance). The election of the Liberal and National Coalition Government in �996 saw a number of reforms designed to increase the contribution of private health insurance in overall health financing. An important function of private health insurance in Australia is to provide greater consumer choice and quicker access to hospital care. Several incentive/penalty measures were introduced in �999 to promote the uptake of private health cover, the policy rationale being to shift demand from public to private hospitals. Private health membership rose from around 30% in �998 to over 45% by 2000 but dropped to below 43% by 2004 (Australian Institute of Health and Welfare 2004a, p. 252). The reforms increased the affordability of insurance and enabled a rise in the number of services delivered by the private sector. A policy concern in relation to equity and stability of public–private arrangements is whether the expansion of private care and the higher incomes in the private sector may affect the elasticity of the supply of doctors between the public and private system (OECD 2003b, p. 38). In other words, specialists might choose to work mainly in the private sector, leading to a decline in the quality and accessibility of public sector health care.
While greater affordability was an important driver of increased membership, the relaxation of regulations related to the community rating of premiums allowing age-related indexation is generally regarded as the crucial policy lever that led to higher membership (Butler 2002, Australian Institute of Health and Welfare 2004a, p. 253). This makes the tax rebate for private health insurance, over AU$2 billion in 200�–2002, a very expensive and much-debated policy. The reforms have partly addressed the problem of adverse selection amongst private health insurance members, by encouraging younger age groups to take up membership.
As membership rose, however, increasing utilization and health care inflation have seen industry costs rise, and pressure on premiums. In combination with increased out-of-pocket expenditures, this led to a renewed decline in membership, particularly in younger age groups and the re-emergence of adverse selection pressures (OECD 2003b, p. 26). As a result the Federal Government introduced further changes to maintain the affordability of cover. These included measures to reduce uncertainty related to out-of-pocket payments during private hospital stays (no/known gaps), and in 2005 the private health insurance tax rebate was increased from 30% to 35% for people aged 65–69 years and to 40% for people aged 70 and over. Initiatives have also focused on portability

��9
AustraliaHealth systems in transition
and consumer protection. Private health insurance funds are no longer able to impose benefit limitation periods on people who transfer from another fund, which means that fund members are entitled to transfer their cover without penalty if they are in any way dissatisfied with the quality or range of their cover. It is too early to determine the impact of the above reforms on overall membership and stability in the private health insurance industry.
While the recent private health insurance reforms aim to make cover financially more attractive to consumers in the short term, its long-term attractiveness is also dependent on the quality of complements (Medicare), on premium stability, and on reducing out-of-pocket costs (OECD 2003b). Premium stability requires greater incentives for providers to improve efficiency and manage utilization and costs. Due to the heavily regulated nature of Australia’s private health insurance industry, the insurance funds have a limited range of tools to encourage provider efficiency, and to constrain patient and supplier moral hazard. Prior to �995 funds essentially were passive price takers with limited price competition among providers, particularly hospitals.
The first significant move towards providing insurers with greater bargaining power was the �995 health insurance reforms, which allowed health insurers to contract with providers including hospitals and doctors (OECD 2003b). While the intention was to encourage funds to develop preferred provider networks that accepted the benefit level provided by funds (create competitive pressures to lower gaps), selective contracting and preferred provider lists are not widely used. The insurance funds decided that products restricting choice of provider were likely to be unpopular, and the government, in response to concerns by smaller hospitals, regulated a second tier default payment by funds to non-contracted providers (OECD 2003b). Political pressure from both providers and patients is likely to limit further moves towards preferred provider networks or to managed care approaches. The medical profession opposes measures to increase third-party intervention on medical care, and patients in Australia, aware of problems with managed care in the United States, are unlikely to remain with funds that limit provider choice. Additionally, the Australian context for any managed care in the private insurance sector is different to many OECD countries, as funds are not exposed to the risk of managing the entire continuum of care, particularly high-cost and chronic care, which is borne in large part by the public sector.
The importance of private health insurance in Australia is related to its role in funding private hospital services. The private hospital sector is a vital component of Australia’s health system providing about one third of the stock of acute care beds (Australian Institute of Health and Welfare 2004a, p. 287), and for expanded capacity in day-only surgery, which now accounts for over

�20
Health systems in transition Australia
half the surgery performed in Australia (Foley 2000). As a result, any instability in private health insurance membership, costs and premiums will continue to be a policy concern.
7.1.2 Changestouniversalhealthinsurance
Universal health insurance for medical services (Medicare) in Australia was introduced in the �970s on a fee-for-service basis. At the time medical consultations primarily involved interactions between an individual professional and patient (Duckett 2004, p. 2�4). The relationship between health care providers, funders and patients is far more complicated today. Most general practitioners work in group practices (as noted in 6.3.� General practice), some of which are managed as large for-profit entities listed on the stock exchange. In this context, fee-for-service financing encourages doctors to maximize income by maximizing the number of brief consultations, and fails to reward either the management of chronic conditions or better outcomes (Productivity Commission 2005b).
Since the �980s, incremental changes have shifted a small component of primary care financing towards pay-for-performance, which combines fee-for-service arrangements with quality-based payments. The Practice Incentive Program (see Section 6.3.� General practice) pays practices, with adjustments for size and age of patient base, for meeting quality targets such as the adoption of information technology, immunization targets, participating in medical student education, and disease-based care planning. Enhanced Primary Care payments reward practices for providing more preventive care for older Australians and for improving coordination of care for people with chronic conditions and complex care needs (Department of Health and Ageing 2004a, p. �0�). This programme provides a framework for a multidisciplinary approach to health, since GPs can claim Medicare rebates for preparing and reviewing management plans for patients with chronic medical conditions, and for coordinating team care planning and review services.
Government expenditure on general practitioner services increased significantly in the decade to 2002–2003 (Duckett 2004, p. 2�7). Half was due to an increase in Medicare costs in line with inflation, but a substantial proportion was due to unexplained changes in practice patterns, raising questions of supplier-induced demand (Duckett 2004). As a result, a number of reforms have been introduced by the Commonwealth to control expenditures. The supply of general practitioners was constrained in the mid-�990s by limiting the number of overseas trained practitioners, by limiting intake to medical schools, and by restricting the number of medical graduates able to bill Medicare to those who had completed postgraduate training in general practice. In 2004, the fee-for-

�2�
AustraliaHealth systems in transition
service funding provisions of Medicare were changed. The Medicare rebate, based on the government “schedule fee”, effectively acted as a constraint on fee increases given the administrative incentive to bulk-bill (nil patient co-payment) Medicare and thereby accept the rebate. Bulk-billing rates peaked in �996 when nearly 80% of all general practitioner attendances were bulk-billed (Swerissen 2004). But since then, in association with declining practitioner numbers, and the eroding value of the schedule fee, bulk-billing rates declined, which meant greater out-of-pocket payments for patients. Increasing costs and the disparity in the burden of these costs created political pressure for change. Rather than raise the schedule fee, the government introduced the Medicare Plus package in 2004 to address the issue of increasing out-of-pocket costs. The rebate was increased for all concessional patients, with higher rebates for rural areas and children. The benefit for GP services was increased from 85% to �00% of the Medicare schedule fee. Additionally, the safety net provisions were modified to provide greater protection from annual out-of-pocket payments. Rates of direct billing have subsequently increased, particularly for concession card-holding patients and those in rural areas, addressing capacity-to-pay issues. The concern, however, is whether an emerging two-tier payment system will undermine social solidarity and perhaps quality, and whether the safety net provisions will be inflationary (doctors will raise their fees) and thus will require further reform in coming years (Swerissen 2004).
7.2 Futuredevelopments
7.2.1 Coordinatedcare
The delivery of fragmented and uncoordinated services and programmes by a multiplicity of providers is widely recognized as a key structural problem of the Australian health system. Analysts have called upon the Australian Government to develop a better strategy to coordinate the management of chronic disease (Gross et al. 2003). Commonwealth funding for health is directed through 60 separate programmes, however, which results in duplication of services and makes care coordination difficult (Duckett 2004, p. 232). Programme boundaries, particularly the Commonwealth–State divide, are also a significant barrier to integration. The trend to more direct control of health care services by State governments, related to the challenges of budgetary pressures and quality and safety problems, and the resulting tendency towards micro-management, also deter greater integration. Much discussion has ensued over the years on how best to integrate this “jigsaw” of services (National Health Strategy �99�).

�22
Health systems in transition Australia
The aim of an “integrated” health care system is to build services around the needs of people, rather than providers or institutions, by managing a continuum of care (a seamless system) for a defined population. In pursuit of this goal, in the �990s the Australian Government established coordinated care trials for people with above-average health needs (mainly those with a chronic illness and Indigenous Australians). These trials involved new forms of health care organization and coordination with the pooling of funds, including Medicare and PBS funds, and the introduction of a care coordinator to facilitate the care of chronic patients. However, the trials were unable to show improvements in health or other outcome measures or in savings from the new care coordinator position (Esterman and Ben-Tovim 2002). Nevertheless, the trials showed that Commonwealth boundaries, particularly in relation to Medicare and PBS funding, could be overcome. Trials in the Indigenous population have been expanded into the Primary Health Care Access Program, where Commonwealth, States and area health services support community-controlled health clinics to provide more integrated care for Aboriginal and Torres Strait Islander people. The expansion of coordinated care into the mainstream community will be a direction of future reform, and several States, including New South Wales and Victoria, have announced integrated programmes to manage some chronic conditions such as diabetes. Some commentators have proposed a form of managed care adapted to the Australian context (Scotton �999), although the managed care model that arose to address extremely fragmented care in the United States context has not been successful there.
7.2.2 Workforceplanning
Workforce planning is likely to receive increasing attention in coming years in Australia, as in other OECD countries. Shortages and maldistribution of health professionals, increasing costs and increasing demand create challenges for maintaining adequate levels of services and for containing inflationary pressures on health expenditures. The perceived importance of health workforce planning is highlighted by the Council of Australian Government initiation of a high-level study into the Australian health workforce by the Productivity Commission in 2004.
A position paper released in 2005 by the Productivity Commission proposed a number of areas for reform in the context of an ageing workforce that is projected to cease to grow by 2020 (Productivity Commission 2005b, p. �22). These proposals include rationalizing the roles and responsibilities of the multiplicity of professions and specialties within the health system, shifting towards more multi-skilled practitioners, and delegating other health workers to support medical practitioner services. The report also suggested extending
�23
AustraliaHealth systems in transition
eligibility for Medicare payments to health professionals other than medical practitioners. For example, nurse practitioners with limited prescribing rights already provide primary care, particularly in rural areas, and nurses work in some specialty areas such as nurse anaesthetists (as is currently the case in the United States). Proposals of this nature usually are strongly opposed by organized medicine in Australia, and are likely to be controversial.
7.2.3 Qualityandsafety
The health ministers established a new Australian Commission on Safety and Quality in Health Care from January 2006 in order to continue the work of the previous national council. The need for ongoing action to improve the governance of safety is underscored by a recent survey of patients in six countries by the Commonwealth Fund that reported 22% to 34% of patients (with Australia at 27%) had experienced a medical mistake, medication error or lab error in the previous two years (Schoen et al. 2005).
The previous Australian Council for Safety and Quality in Health Care had undertaken a large body of work over its five years, but was constrained in having no statutory power, or administrative or operational capacity to monitor the implementation of its many safety and quality guidelines. A national body is needed, for example, to monitor the implementation of the eight recommendations made in 2004 by the Australian Conference of Health Ministers, calling for action on safety and quality by officials from the Commonwealth and the States in the following areas:
all public hospitals should use the five-step correct patient and correct procedure protocol;
all public hospitals should introduce an adverse incident reporting system by mid-2005;
public hospitals should report sentinel events by the end of 2005;
the States should contribute to a national report on sentinel events;
public hospitals should all use a common medication chart by 2006;
public hospitals should review their safe medication procedures by 2006;
all hospital patients should receive an information booklet on safety.
The challenge for safety and quality is to design safer systems and to inculcate safety cultures, and the challenge for governance is to ensure that such systems and practices actually are applied. Despite the emergence of new regulatory bodies and a host of initiatives, commentators are frustrated by an apparent lack of national progress. For example, Australia lacks valid and reliable measures of adverse events, despite the beginnings of State-based monitoring of sentinel
•
•
•
•
•
•
•

�24
Health systems in transition Australia
events, and lacks agreed (let alone published) indicators of clinical performance and hospital performance. There is no way to benchmark performance and to systematically trace progress without some form of standardized measures, or a system that, for example, can pick up serious incidents as well as infrequently occurring but potentially serious events (Wilson and Van Der Weyden 2005). If health systems are made safer then a safety culture will follow, which is the philosophy that has underwritten the accomplishments of the 20th century in making other risky industries safer. The challenge then is to shift from a blame culture to a learning culture, in order to learn from near misses, adverse events, performance indicators, and intervention studies (Braithwaite et al. 2005).
Future developments may include moving to some form of meta-regulation, whereby an external regulator checks that a self-regulator is regulating internally to externally acceptable standards. One example is the move to mandatory accreditation of public hospitals including mandatory core accreditation criteria. Another example is a move to a single national system for the registration of doctors, with discussions underway in a working group of the Australian Health Ministers Advisory Council, plus an ongoing debate on the controversial issue of whether ongoing registration of doctors (re-validation) should be required, as is done by some specialist colleges, and how this might be linked to the demonstration of competency.
7.2.4 Healthexpenditures
The overall level of health expenditure as a proportion of GDP has been increasing steadily in the last decade in Australia. From a low level relative to comparable OECD countries in the �960s, health expenditure as a proportion of GDP remained relatively stable from the mid-�970s to the late �980s, at around 7.5%. A recent report on health expenditure sets out the trends and the drivers of future growth (Australian Institute of Health & Welfare 2005c). Since the late �990s, faster health spending growth has meant that by 2003–2004, 9.7% of GDP was spent on health, with Australia spending slightly more than the unweighted OECD average. Between �993–�994 and 2003–2004, the average rate of general inflation was 2.2% per year while health inflation during the period averaged 3.�% per year giving an excess inflation rate of 0.8%. Expenditure on hospitals accounted for the largest proportion of the real growth in recurrent health expenditure between �993–�994 and 2002–2003 (28.�%), while another quarter of the growth was due to increased expenditures on pharmaceuticals (24.5%), and expenditures on medical services (�2.3%). Examining the drivers of nominal growth in health expenditures over the decade up to 2003–2004 is incisive. Of the estimated ���.9% of growth, 39.4% was due to inflation (combined effects of general inflation and excess health inflation),
�25
AustraliaHealth systems in transition
�2.6% due to population growth, and 35.0% to the increase in real expenditure per person (more intensive per capita use of services) with the balance due to the interaction between these elements. Despite concerns about population ageing (Productivity Commission 2005c), the main drivers of future health expenditure increases generally are regarded as new technology and consumer demand (Zweifel et al. �999).
Growth in pharmaceutical expenditures over the decade from �993–�994 to 2002–2003 averaged nearly �0% per annum and represented one of the fastest growing components of public and individual expenditures on health (Productivity Commission 200�, p. 2). The mandatory requirement for economic evaluation of pharmaceuticals prior to PBS listing introduced in �992 has meant that by 2003–2004, 46% of all PBS listed pharmaceuticals had been evaluated compared to only 4% in �992–�993 when the requirement became mandatory. These reforms, particularly the use of therapeutic group reference pricing of equivalent products to the cheapest drug in the group, have reduced the prices of patented medicines in Australia in comparison to other OECD countries (Productivity Commission 200�). Other policy reforms also were aimed at increasing the share and reducing the price of generic medicines supplied under the PBS (see Section 6.5 Pharmaceutical care). However, the impact of these policies has not been great and further reforms are proposed by the Treasury, including changes to generic pricing and PBS listing in order to promote generic drug prescribing and price competition. Pharmaceuticals were included in the Australia–United States Free Trade Agreement, signed in 2004, and the effects will be monitored.
Australian Governments also are likely to pay more attention to regulating the entry of other medical technologies, since medical technology has been a major driver of increased private and public health expenditure (Productivity Commission 2005a). Medical goods and services are likely to be formally incorporated into health technology assessments in coming years. The Productivity Commission found that while existing health technology assessments ensured that new technologies entering the health system were cost-effective, there was considerable scope for improvement. The study recommended that a more systematic approach be taken to health technology assessments prior to entry as well as determining cost-effectiveness of technologies already in the health system. The Commission also recommended greater national coordination of clinical guidelines incorporating cost-effectiveness assessments.
Another significant area of future health expenditure will flow from policies to increase the supply of medical practitioners. Government policies in the mid-�990s constrained supply and thus expenditure growth. However, these policies have been reversed and over coming years the number of new medical graduates able to bill Medicare is likely to increase substantially. Some argue
�26
Health systems in transition Australia
that more doctors plus the expanded Medicare safety net will create inflationary pressures that may require changes to the fee-for-service funding arrangements in coming years (Swerissen 2004). Finally, cost pressures are likely to lead to further changes in the regulatory environment for private hospitals in Australia (as discussed in 7.�.� Voluntary private health insurance).
�27
AustraliaHealth systems in transition
8.1 Thestatedobjectivesofthehealthsystem
A National Health Performance Committee was set up in �999 charged with developing a national health performance framework to support benchmarking for improvement and to provide information to monitor
performance. The framework of three tiers (health outcomes, determinants of health and health system performance) drew on similar work in Canada and Europe. The performance tier calls for reporting on a range of services and interventions, while the criteria call for the health system to be equitable, effective, appropriate, efficient, responsive, accessible, safe, continuous, capable and sustainable. Another set of indicators to measure the effectiveness and efficiency of hospital performance is being refined by the National Health Information Management Group (Australian Institute of Health and Welfare 2004a, p. 334).
Against these health system criteria the Australian health system has considerable strengths, and in general and in comparison to other health systems, is regarded as satisfactorily meeting the needs and expectations of Australians (Australian Institute of Health and Welfare 2004a, p. 5). On World Health Organization measures, for example, the Australian health care system consistently ranks among the best performing countries (World Health Organization 2005). While policy-makers generally argue that the Australian health system requires only ongoing incremental rather than radical change (or else argue that radical change is not possible), health providers and consumers are less happy. For example, the Australian Health Care Reform Alliance lists the key problems with the health system as a chronic shortage of doctors, nurses and other health professionals, insufficient focus on prevention and primary care, the inefficient allocation of resources caused by the current State/
8 Assessmentofthehealth system

�28
Health systems in transition Australia
Commonwealth funding structure, and the lack of political commitment from government to undertake reform. Further, the public increasingly is alarmed by a spate of hospital scandals and revelations of poor clinical performance and poor management (Wilson and Van Der Weyden 2005).
The following section discusses the performance of the Australian health system against the overall criteria of equity (distribution), efficiency, accountability and effectiveness (contribution to health improvements).
8.2 Distributionofthehealthsystem’scostsandbenefitsacrossthepopulation
Universal health insurance (Medicare) has ensured that a high level of equity of access exists in Australia in terms of the removal of financial barriers to the utilization of medical services and guaranteed access to public hospitals. Equity of financing remains as Medicare is financed through general taxation (progressive) including a minimal health levy and citizens cannot opt out of contributing to the public system. Overall bipartisan agreement continues on the importance of maintaining a publicly funded universal health insurance system, though recent debates have seen policy differences emerging. Rising out-of-pocket expenditures on medical services have raised questions about whether bulk-billing should be universally available, or be seen only as a safety net provision for low-income groups and older people (Swerissen 2004). Reforms in 2003 offering differential incentives to promote bulk-billing in specific groups were seen as undermining the principle of universality. This, along with private health insurance membership that covers less than half the population, and rising out-of-pocket payments, led to concerns that a two-tier system may develop that impacts adversely on equity of access. Issues in relation to equity of financing are also emerging due to the rise in out-of-pocket expenditures by patients. The average real growth in funding by individuals (out-of-pocket expenditures) between �993–�994 and 2003–2004 was 4.2% per year, and consumers directly paid for 20.3% of total health expenditure in 2003–2004 (Australian Institute of Health and Welfare 2005a, p. 37).
While financial barriers may reduce access to medical services, non-financial barriers also are a concern. For example, studies have found associations between waiting times for surgery and the duration of consultations with socioeconomic factors, income and geographic location (Furler et al. 2002, p. 268). People in rural areas have less access to health care than those in urban areas, since the per capita number of health professionals in rural areas is lower (Department of Health and Ageing 2005g, p. 95). Rural and regional access to
�29
AustraliaHealth systems in transition
both public and private hospital services is lower, due to lower per capita bed numbers, while many need to travel long distances to seek specialist services. Indigenous Australians also make fewer visits to general practitioners and specialists and use fewer pharmaceuticals, despite having considerably worse health (Australian Bureau of Statistics 2005c, p. �8�).
8.3 EfficiencyoftheAustralianhealthsystem
The division in health care responsibilities between the Commonwealth and the States is regarded as a cause of considerable inefficiency and lack of accountability, resulting in poor integration and also cost-shifting by the States to address short-term budgetary pressures. There have been repeated calls over the years to remove these jurisdictional inefficiencies and thereby to promote better integration in the financing and management of health services (Menadue 2003). Health care providers are unhappy about endemic “buck-passing” between the Commonwealth and the States, particularly in relation to funding public hospitals. Sole funding of public hospitals by the Commonwealth has been touted recently. It has also been argued that there is a strong case for a single funder for the health needs of the aged (as happens to some extent with the Department of Veterans’ Affairs), since it is desirable for a single funder to follow the needs of an aged person as they move from the doctor to acute hospital care and to aged care – the goal being coordinated care.
Technical efficiency has been improved through supply-side mechanisms introduced into funding arrangements since the �980s. Technical efficiency calls for using given resources to maximum advantage (outputs and outcomes). The most significant changes have been in hospital funding whereby the Commonwealth in the early �980s capped amounts in the Australian Health Care Agreements with the States. States then sought cost-efficiencies through financial agreements with each hospital or hospital grouping, which involved negotiated prospective budgets and casemix funding. Patient throughput increased dramatically with rising admissions, shorter stays, and higher occupancy rates. The States also introduced limited “public management” methods intended to achieve efficiencies, including the introduction of market structures and practices, as promoted by the Productivity Commission and in the National Competition Policy. Examples include the public hospitals contracting out for services, competing for a larger market share of patients and competing to supply regional or Statewide services, such as lithotripsy or complex neurosurgery.

�30
Health systems in transition Australia
The Commonwealth does not, however, cap the overall levels of Medicare Benefits, Pharmaceuticals Benefits, or the Private Health Insurance Rebate. Improvements in efficiency have been limited in these areas. Payments to doctors primarily involve fee-for-service arrangements, although a small component of outcome-based funding has been introduced in the form of blended payments, such as the Practice Incentives Programme that offers financial incentives for general practitioners to improve the quality and efficiency of their services. Other initiatives claiming to improve efficiency include price-volume caps, targets negotiated with pathologists and radiologists and restrictions on provider numbers (the number of doctors eligible to bill Medicare).
The Pharmaceuticals Benefits Scheme encourages generic substitution by giving pharmacists the authority to supply generic alternatives, and by imposing brand premiums on consumers who wish to purchase brand-named products priced above the reference product in certain therapeutic groups. Nonetheless, the share of generic medicines is very small in comparison to other OECD countries (comprising less than 20% of all dispensed prescription drugs in 2000–200�) (Lofgren 2002, p. �0). Australia has a sophisticated system of approving, listing and subsidizing drugs – a model adopted by other countries – which aims to limit the use of inefficient therapies. Yet the Pharmaceuticals Benefits Scheme is the fastest growing component of health outlays, so undoubtedly more emphasis will be placed on improving the cost-effectiveness of prescribing.
While technical efficiency has improved, political considerations and vested interests have constrained attempts to measure or improve allocative efficiency. Allocative efficiency seeks to achieve the optimal balance of resources between diseases, and within diseases in terms of preventative and curative care in order to maximize outcomes and meet the needs of the population. However, since the two main components of financing (the Medicare Benefits Scheme and the Pharmaceutical Benefits Scheme) are uncapped, and further are based on fee-for-service funding arrangements, health care providers determine how a considerable proportion of the overall health budget is allocated.
While the focus on public health is increasing, spending on public health accounts for only a small percentage of overall expenditure (Australian Institute of Health and Welfare 2005a, p. 59). Additionally, Australia’s health financing mechanisms (Medicare and PBS) do not fund allied health therapies, despite evidence of their cost-effectiveness in the management of some diseases. The public sector therefore under-invests in allied health and complementary health practitioners in the management of chronic conditions, and in dental care, and might have to place more emphasis upon workforce substitution and devising a different mix of responsibilities (Duckett 2005). Workforce

�3�
AustraliaHealth systems in transition
substitution, particularly the use of nurse practitioners and allied health staff rather than medical practitioners, is underutilized in Australia in comparison to the United States and other OECD countries, and has been identified as an area for considerable improvement (Productivity Commission 2005b).
8.4 Accountabilityofpayersandproviders
The Australian health system now is paying more attention to strengthening accountability to consumers and to funders. The accountability of health administrators and providers to the community, however, is weakened by the divisions of responsibility between the Australian Government and the States, as noted in the previous section. The resulting lack of accountability leads to cost shifting, blame shifting and duplication of services, problems that are difficult to address under current intergovernmental arrangements and ensuing protracted negotiations.
Consumer involvement in their own health care and in health policy formulation is perhaps the best guarantee that reforms to the health care system will be soundly based (Podger and Hagan 2000). The last few decades have seen the emergence of active and vocal consumer groups, with some consumer organizations supported by Commonwealth funding. The Consumer Health Forum, the Health Issues Centre, as well as the Public Health Association of Australia, for example, work towards ensuring the voice of consumers is represented in health policy formulation and debates (Palmer and Short 2000). Each Australian State has developed consumer rights and complaints procedures of varying effectiveness, and the extent to which these have fed back into health policy-making is unclear (Lapsley 2000). The States have been required since �993, under the Australian Health Care Agreements, to develop public patient hospital charters.
Legislation in each State requires that patients give informed consent before any major procedure. In the public sector, Area Health Boards and Hospital Boards have citizen representatives. All States also have grievance procedures in place though health services complaints commissioners, who were mandated under the �993–�998 Medicare Agreements to receive complaints from consumers and to act as mediators to resolve disputes (Duckett 2004, p. 276). The powers of the commissioners vary between the States, however, particularly in relation to powers to prescribe a course of remedial action to be taken by the provider. Private hospital patients can complain to the Private Health Insurance Ombudsman, a statutory body funded by the Commonwealth through a levy on private insurance funds.
�32
Health systems in transition Australia
Patient satisfaction surveys are one way to strengthen accountability. The Commonwealth Fund undertakes regular surveys of public opinion in several nations (Australia, Canada, New Zealand, the United Kingdom and the United States). A consistent finding is that no nation is totally content with its health system, although the concerns differ depending on the type of health system. The proportions expressing dissatisfaction in Australia (and in other countries) have risen from previous decades although such findings are based on small samples and can be interpreted in various ways: that health services are worse, that public expectations are higher, or that the population views health reform as an ongoing process (Hall �998–�999). In the eighth survey by the Commonwealth Fund, of patients in six countries who were regular users of health services, only a minority thought that their health system worked well and only needed minor changes, a consistent finding over the series of surveys in all countries (Schoen et al. 2005).
8.5 Contributionofthehealthsystemtohealthimprovement
Quality and outcome issues in the health sector now receive more attention. While governments have a responsibility to obtain “value for money” when devoting public resources to health, it is difficult to disentangle the contribution that different interventions make to improving population health. Research on the determinants of health has evolved from seeing relationships as simple and linear to identifying multiple factors acting through interrelated pathways, involving socioeconomic, genetic, behavioural and healthcare determinants. There is evidence from Europe and the United States, however, that a substantial part of the fall in deaths in the last few decades can be attributed to improved medical treatment (McKee and Healy 2002; Nolte and McKee 2004). Health services, therefore, do save lives and improve health, although other factors also impact on health.
Over the last two decades the overall health status of the Australian population has been rising, as has total health care expenditure. For example, life expectancy increased from 74.6 years in �980 to 80.0 in 2002, while total health expenditure as a proportion of GDP increased from 7.0% in �980 to 9.5% in 2002. Over the last two decades, total expenditure on Aboriginal and Torres Strait Islander health has increased along with life expectancy, but a 20-year gap in life expectancy still remains between Indigenous and non-Indigenous Australians. This suggests that funding alone is not the key, but it helps.
�33
AustraliaHealth systems in transition
A study commissioned by the Australian Department of Health and Ageing to examine the contribution of public health programmes to improvements in Australia’s population health since the �970s found that health interventions in several areas had contributed to improvements in life expectancy (Applied Economics 2003). Public health programmes to reduce tobacco consumption were associated with the decline in smoking over this period from 30% to 23% of adults, with every AU$ � of expenditure on reducing tobacco consumption producing a saving of AU$ 2 in health costs. Similarly, health programmes that reduced coronary risk factors contributed to the fall in deaths from coronary heart disease. The public health response to HIV/AIDS control averted an epidemic and reduced transmission rates by an estimated 25%. Finally, immunization programmes have produced net savings for governments.
The proposed national health information network of patient electronic health records, HealthConnect, is expected to improve individual treatment and care, and to generate a better evidence base for the Australian health care system. The network should enable the safe electronic collection, storage and exchange of health information Australia-wide, and improve information flow with the permission of the person receiving the care. This information could then be retrieved at any time and exchanged via a secure network between authorized health care providers.
Australia has developed a good information base upon which to base population health programmes and clinical interventions, and by international standards has good national data collections. However, better information is required since government programmes increasingly incorporate performance targets and outcomes measures (Frommer and Rubin 2000). The Commonwealth has subsidized the Australasian Cochrane Centre since �992 to produce systematic reviews of the effects of clinical health care interventions upon which to develop evidence-based guidelines. The National Health and Medical Research Council also issues guidelines on evidence-based practice, as do the professional colleges, while the National Institute of Clinical Studies (NICS) promotes the take-up of “best practice”. There is a big gap between evidence and practice, however, and more measures are being taken to ensure that evidence is disseminated and used.


�35
AustraliaHealth systems in transition
The Australian population generally enjoys good health, most have ready access to health services, services usually are of good quality, and the public make fair payments and share the fiscal risks of ill health
(Podger and Hagan 2000). The amount of spending and the cost of the health system to the economy is reasonable (in international terms) at around 9.7% of GDP, and the Australian health care system consistently ranks among the best performing countries for healthy life expectancy and health expenditure per person (Australian Institute of Health and Welfare 2005a, p. 4). The health care system generally enjoys both political and public support, since the major political parties are committed to the retention of Medicare, and public financing and public involvement in health care is widely supported.
The reform approach adopted is one of incremental rather than radical change. This gradual evolution of the system is a product of history and also a result of the political institutions in place: a federal system of government; a bicameral Parliament; responsibility for health care divided between levels of government; and a complex health care field including a large private sector. The ability of this complex system and its many stakeholders to agree upon or to adapt quickly to major change is limited. Consequently, many reforms are incremental and often crisis-driven. The Australian federal system of government and the divided responsibility for the funding and delivery of health care mean that intergovernmental relations in the health sector are characterized, to put it politely, by “dynamic tension” between the Commonwealth and the States.
Health care professionals are increasingly frustrated by intergovernmental blame games, particularly over public hospital funding, and believe that the structure of the health system has not modernized to meet current and future health care needs. A central challenge for policy-makers is how best to manage the increasing burden of chronic disease and the health needs of an
9 Conclusion
�36
Health systems in transition Australia
ageing population. This requires more emphasis upon health promotion and efforts to reduce health risk factors, intervening earlier with conditions that are amenable to treatment, better coordinated management of chronic disease, and more emphasis upon cost-effective care. Steps have, and are being taken, to address these issues. However, the division of responsibilities between the Commonwealth and the States, an inflexible workforce with ongoing battles over respective professional jurisdictions, and the fee-for-service arrangements of Medicare, mitigate against a better coordinated approach.
The three basic goals of health care system reform are equity (fair payment contributions and fair access to and use of services), efficiency (value for money), and quality (high standards and good health outcomes). Equity of financing has been protected in that Australia retains a health care system funded through progressive taxation. However, out-of-pocket payments have increased and it is not yet clear whether recent safety net provisions will sufficiently lower the financial barriers for low-income and high-use groups. Choice has been enhanced through public subsidies for voluntary private health insurance that have resulted in an increase in insured levels to nearly half the population. Health workforce movement from the public to the private sector, however, may reduce quality in the public sector, and reinforce a tiered health care system.
Efforts have been made to improve allocative (or distributional) equity across geographic areas and across population groups. Workforce and service shortages in rural compared to urban areas are a significant issue, as are the health disparities affecting the Indigenous population. These issues have received considerable attention in recent years with targeted programmes, as well as measures to make mainstream services better meet the needs of these populations, and to increase access to culturally appropriate primary health care services in Indigenous populations.
Australian spending on health care is about the level that might be expected for a similar economy (around 9.7% of GDP). Efficiency has been improved over the last decade, and government funding programmes have achieved some success in containing costs, principally through supply-side methods. The health care system has invested considerable effort in microeconomic measures, such as formalizing intergovernmental programmes, casemix funding, and better management information systems. The extent of and reasons for some of the cost-efficiency gains are arguable, however, as is their effect on cost-effectiveness. A renewed focus in recent years has been further developments in health technology assessments to ensure the introduction of new medical technology is both effective and cost-effective.
Quality and safety are on the health policy agenda at the beginning of the 2�st century. Health outcomes for the population generally are positive

�37
AustraliaHealth systems in transition
with long life expectancies and falling mortality rates for many diseases and conditions. Australia now seeks to expand the production of well-trained health professionals and education and training curricula are regularly reviewed. However, more attention is to be paid to improving the quality of health care delivery and to measuring and monitoring specific health outcomes. Australia collects considerable health data but there are as yet few formal systems in place for monitoring standards.
While there are numerous options, reform will continue to be shaped by the surrounding environment and ultimately hinge on political will. Health care reform in Australia is an ongoing process in the context of changing population health needs, advances in technology, and changes in governments and their ideological preferences. Concerns about health system viability, efficiency and effectiveness will continue to be addressed in the 2�st century.


�39
AustraliaHealth systems in transition
10.1 References
ABS (�999). Australian social trends, 1998. Canberra, Australian Bureau of Statistics.
ABS (2000). Yearbook Australia 2000. Cat. No. �30�.0.0. Canberra, Australian Bureau of Statistics.
ABS (200�). National health survey, summary of results. Canberra, Australian Bureau of Statistics.
ABS (2002a). Australian demographic statistics. Cat. No. 3�0�.0. Canberra, Australian Bureau of Statistics.
ABS (2002b). National health survey – summary of results, Australia. Cat. No. 42664.0. Canberra, Australian Bureau of Statistics.
ABS (2003a). Year book Australia 2003. Cat. No. �30�.0. Canberra, Australian Bureau of Statistics.
ABS (2003b). Population by age and sex, Australian states and territories. Cat. No. 320�.0. Canberra, Australian Bureau of Statistics.
ABS (2003c). Population projections Australia 2002–2101. Cat. No. 3222.0. Canberra, Australian Bureau of Statistics.
ABS (2003d). Australian social trends 2002, population – population composition: regional population ageing. Cat. No. 4�02.0. Canberra, Australian Bureau of Statistics.
ABS (2003e). The health and welfare of Australia’s Aboriginal and Torres Strait Islander peoples. Cat. No. 4704.0. Canberra, Australian Bureau of Statistics.
ABS (2003f). Causes of death, Australia. Cat. No. 3303.0. Canberra, Australian Bureau of Statistics.
10 Appendices

�40
Health systems in transition Australia
ABS (2003g). Australian demographic statistics quarterly: 2001, March quarter 2003. Cat. No. 3�0�.0. Canberra, Australian Bureau of Statistics.
ABS (2003h). Private medical practices, Australia. Cat. No. 8685.0. Canberra, Australian Bureau of Statistics.
ABS (2004a). Population, population clock (table 1). Canberra, Australian Bureau of Statistics.
ABS (2004b). Regional population growth, Australia and New Zealand. Cat. No. 32�8.0. Canberra, Australian Bureau of Statistics.
ABS (2004c). Migrants changing our population mix. Cat. No. 34�2.0. Canberra, Australian Bureau of Statistics.
ABS (2004d). Australia’s recent immigrants: where do they fit in? Cat. No. 2053.0. Canberra, Australian Bureau of Statistics.
ABS (2004e). Year book Australia 2004. Cat. No. �30�.0. Canberra, Australian Bureau of Statistics.
ABS (2004f). Year book Australia. Cat. No. �30�.0. Canberra, Australian Bureau of Statistics.
ABS (2004g). Australian labour market statistics, 2003. Cat. No. 6�05. Canberra, Australian Bureau of Statistics.
ABS (2004h). Australian system of national accounts 2003–04. Cat. No. 5204.0. Canberra, Australian Bureau of Statistics.
ABS (2004i). Taxation revenue, Australia. Cat. No. 5506.0. Canberra, Australian Bureau of Statistics.
ABS (2004j). Deaths 2004, Australia. Cat. No. 3302.0. Canberra, Australian Bureau of Statistics.
ABS (2004k). Causes of death, Australia: summary tables. Cat, No. 3303.0.55.00�. Canberra, Australian Bureau of Statistics.
ABS (2004l). Health of children. Cat. No. 4829.0.55.00�. Canberra, Australian Bureau of Statistics.
ABS (2004m). Measures of Australia’s health progress. Cat. No. �370.0. Canberra, Australian Bureau of Statistics.
ABS (2004n). Household use of information technology 2002 and 2003. Cat. No. 8�4 6.0. Canberra, Australian Bureau of Statistics.
ABS (2004o). Disability, ageing and carers, Australia, 2003. Cat. No 4430.0. Canberra, Australian Bureau of Statistics.
ABS (2005a). Consumer price index, Australia. Cat. No. 640�.0. Canberra, Australian Bureau of Statistics.

�4�
AustraliaHealth systems in transition
ABS (2005b). Household income and income distribution, Australia 2003–04. Cat. No. 6523.0. Canberra, Australian Bureau of Statistics.
ABS (2005c). The health and welfare of Australia’s Aboriginal and Torres Strait Islander peoples 2005. Cat. No. 4704.0. Canberra, Australian Bureau of Statistics.
ACCC (2000). Report to the Australian Senate on anti-competitive and other practices by health funds and providers in relation to private health insurance for the period ending 31 December 1999. Canberra, Australian Competition and Consumer Commission.
ADGP (2005). Submission in response to the Productivity Commission’s issues paper: the health workforce August 2005. Australian Divisions of General Practice, Canberra (http://www.adgp.com.au/site/content.cfm?page_id=5258¤t_category_code=�05, last accessed 3 August 2006).
AHWAC (2004). Annual report 2003–04. NSW, Australian Health Workforce Advisory Committee.
AIHW (2000). Australia’s health 2000. Canberra, Australian Institute of Health & Welfare.
AMWAC (2000). The general practice workforce in Australia: supply and requirements 1999–2010 AMWAC report 2000.2. Canberra, Australian Medical Workforce Advisory Committee.
AMWAC (2004). Annual report 2003–04. NSW, Australian Medical Workforce Advisory Committee.
APL (2005). Health legislation amendment (Australian community pharmacy authority) Bill 2005. Bills digest No. �59 2004–05. Canberra, Australian Parliamentary Library.
Access Economics (2002). Primary health care for all Australians: an analysis of the widening gap between community need and the availability of GP services. Report, February 2002, Canberra, Australian Medical Association from Access Economics Pty Ltd.
Anderson GF (�998). Multinational comparisons of health care, expenditures, coverage and outcomes. New York, The Commonwealth Fund.
Aoun S, Rosenberg M (2004). Are rural people getting HeartSmart? Australian Journal of Rural Health, �2(2): 8�–88.
Applied Economics (2003). Returns on investments in public health: an epidemiological and economic analysis. Canberra, Population health division of the Commonwealth Department of Health and Ageing, Applied Economics.

�42
Health systems in transition Australia
Armfield J, Spencer AJ (2004). Increases in caries experience in Australian children (http://iadr.confex.com/iadr/2003Goteborg/techprogram/abstract_35789.htm, last accessed �8 July 2006).
Auditor-General Victoria (2005). Managing patient safety in public hospitals. Victoria, Government Printer.
Australian Institute of Health and Welfare (�998a). Health in rural and remote Australia, 1998. Cat. No. 89�9.0. Canberra, AIHW.
Australian Institute of Health and Welfare (�998b). Australia’s health 1998. Cat. No. AUS �0. Canberra, AIHW.
Australian Institute of Health and Welfare (2000). Australia’s health 2000. Canberra, AIHW.
Australian Institute of Health & Welfare (2002). Australian health inequalities: � Birthplace. AIHW Bulletin, Issue No. 2, July. Canberra, AIHW.
Australian Institute of Health and Welfare (2002a). Older Australia at glance. Canberra, AIHW. Australian Institute of Health and Welfare (2003). Medical labour force. Canberra, AIHW (National Health Labour Force Series, Number 32).
Australian Institute of Health & Welfare (2003a). Rural, regional and remote health: a study on mortality. Canberra, AIHW (Rural Health Series No. 2).
Australian Institute of Health & Welfare (2003b). Pharmacy labour force to 2001. Canberra, AIHW (National Health Labour Force Series, AIHW Cat. No. HWL–25).
Australian Institute of Health & Welfare (2003c). Nursing labour force 2002. Canberra, AIHW.
Australian Institute of Health & Welfare (2003d). Australia’s welfare 2003. Canberra, AIHW.
Australian Institute of Health & Welfare (2004). Australia’s health survey, Australia 1999: trends across the 1990s. AIHW Cat. DEN 95; DSRU 27, Canberra, AIHW.
Australian Institute of Health and Welfare (2004a). Australia’s health 2004. Canberra, AIHW.
Australian Institute of Health and Welfare (2004b). Health expenditure in Australia 2002–03. Cat. No. HWE 27. Canberra, AIHW.
Australian Institute of Health and Welfare (2004c). Medical labour force 2002. Canberra, AIHW.
Australian Institute of Health & Welfare (2005). Overweight and obesity (http: //www.aihw.gov.au/riskfactors/overweight.cfm, last accessed �� March 2005).

�43
AustraliaHealth systems in transition
Australian Institute of Health and Welfare (2005a). Health expenditure in Australia 2003–04. Cat. No. HWE 32. Canberra, AIHW,
Australian Institute of Health and Welfare (2005b). Australian hospital statistics 2003–04. Canberra, AIHW.
Australian Institute of Health and Welfare (2005c). Nursing and midwifery labour force 2003. Cat. No. HWL 3�. Canberra, AIHW.
Australian Institute of Health and Welfare (2005d). Expenditures on health for Aboriginal and Torres Strait Islander peoples, 2001–02. Cat. No. HWE 30. Canberra, AIHW.
Australian Institute of Health & Welfare (2005e). Living dangerously: Australians with multiple risk factors for cardiovascular disease. AIHW Bulletin No. 24. Canberra, AIHW.
Australian Institute of Health and Welfare (2006). Australia’s health 2006. Canberra, AIHW.
Bloom A (2000a). Context and lead-up to health reform. In: Bloom AL, ed. Health reform in Australia and New Zealand. Melbourne, Oxford University Press: �3–38.
Bloom A (2000b). Hospital co-locations: private sector participation in the hospital sector. In: Bloom AL, ed. Health reform in Australia and New Zealand. Melbourne, Oxford University Press: 235–250.
Bloom A (2000c). Health Reform in Australia and New Zealand. Melbourne, Oxford University Press.
Braithwaite J, Healy J, Dwan K (2005). The governance of health safety and quality: a discussion paper. Canberra, Commonwealth of Australia.
Britt H et al. (2005). General practice activity in Australia 2003–04, A joint report by the University of Sydney and the Australian Institute of Health and Welfare AIHW Cat. No. GEP �6. General Practice Series Number �6 BEACH Bettering the Evaluation and Care of Health. Canberra, Australian Institute of Health & Welfare.
Buchanan J (2005). Recasting Australian employment law: implications for the health sector. Australian Health Review, 29(3): 265–269.
Bunker SJ, Goble AJ (2003). Cardiac rehabilitation: under-referral and underutilisation. Medical Journal of Australia, �79(7): 332–333.
Butler JRG (�998). Health expenditure. In: Mooney G, Scotton R, eds. Economics and Australian Health Policy. Sydney, Allen & Unwin: 40–7�.
Butler JRG (2002). Policy change and private health insurance: did the cheapest policy do the trick? Australian Health Review, 25(6): 33–4�.

�44
Health systems in transition Australia
Bennett C, Vitale M (2005). Australian health and medical research: are we there yet? Medical Journal of Australia, �82(��): 550–55�.
Commonwealth of Australia (2004a). Economic roundup summer 2004–05. Canberra, The Treasury (http://www.treasury.gov.au/documents/958/PDF/full.pdf, last accessed �8 July 2006).
Commonwealth of Australia (2004b). Federal budget 2004–05. Canberra, Health Budget.
Commonwealth of Australia (2004c). Federal budget 2004–05, health budget health fact sheet 4 – a continuing commitment to rural, regional and remote Australians. Canberra, The Treasury.
Commonwealth of Australia (2005). 2005–0�: Why has Australia done better than New Zealand? Good luck or good management? Canberra, The Treasury (http://scholar.google.com/url?sa=U&q=http://www.airc.gov.au/snr2005/acci/Att8_�.pdf, last accessed �8 July 2006).
Corden S, Luxmore J (2000). Managing performance for better results. In: Bloom AL, ed. Health Reform in Australia and New Zealand. Melbourne, Oxford University Press: 293–306.
Department of Health and Aged Care (�999). Public and private, in partnership for Australia’s health. Canberra, Department of Health and Aged Care.
Department of Health and Ageing (2003). Australian Senate, Select Committee on Medicare Inquiry into the access to and affordability of general practice under Medicare. Submission of the Commonwealth Department of Health and Ageing. Canberra, Department of Health and Ageing (http://www.aph.gov.au/senate/committee/medicare_ctte/fairer_medicare/submissions/sub�38.pdf, last accessed 3 August 2006).
Department of Health and Ageing (2004a). Annual report 2003–04. Canberra, Department of Health and Ageing.
Department of Health and Ageing (2004b). Australian health and ageing system: the concise factbook, August 2004. Canberra, Department of Health and Ageing.
Department of Health and Ageing (2004c). Record numbers studying medicine, 3� March 2004, ABB037/04, Media release. Canberra, Department of Health and Ageing.
Department of Health and Ageing (2005a). Changes to Pharmaceutical Benefits Scheme (PBS) Co-payments. (http://www.health.gov.au/internet/wcms/publishing. nsf/Content/Pharmaceutical+Benefit+Scheme+%28PBS%29-�.

�45
AustraliaHealth systems in transition
Department of Health and Ageing (2005b). Interim Australian management plan for pandemic influenza June 2005. Canberra, Department of Health and Ageing.
Department of Health and Ageing (2005c). The state of our public hospitals, June 2005 report. Canberra, Department of Health and Ageing.
Department of Health and Ageing (2005d). Portfolio budget statements 2005–06. Health and ageing budget related paper No. �.��. Canberra, Department of Health and Ageing.
Department of Health and Ageing (2005e). Positron emission tomography (PET). Canberra, Department of Health and Ageing. (http://www.health.gov.au/internet/wcms/publishing.nsf/content/diagnosticimaging-pet.htm, last accessed 20 July 2006).
Department of Health and Ageing (2005f). Fourth community pharmacy agreement. Press release, The Hon Tony Abbott, 8 November, ABB�34/05.
Department of Health and Ageing (2005g). General practice in Australia: 2004. Canberra, Department of Health and Ageing.
De Voe JE, Short SD (2003). A shift in the historical trajectory of medical dominance: the case of Medibank and the Australian doctors’ lobby. Social Science and Medicine, 57: 343–353.
Dixon J, Eckersley R (200�). Health care in rural and remote areas. Melbourne, Cambridge University Press.
Draper G, Turrell G, Oldenburg B (2004). Health inequalities in Australia: mortality. Health Inequalities Monitoring Series No. �. AIHW Cat. No. PHE 55. Queensland University of Technology and Canberra, Australian Institute of Health and Welfare.
Duckett S (2005). Health workforce design for the 2�st century. Australian Health Review, 29(2): 20�–2�0.
Duckett SJ (�998). Economics of hospital care. In: Mooney G and Scotton R, eds. Economics and Australian health policy. Sydney, Allen & Unwin: 93–��4.
Duckett SJ (2004). The Australian health care system. 2nd edn. Melbourne, Oxford University Press.
Dwyer JM (2004). Australian health system restructuring – what problem is being solved? Australia and New Zealand Health Policy, �(6): �–6.
Easthope G et al. (�998). Acupuncture in Australian general practice: practitioner characteristics. Medical Journal of Australia, �69: �97–200.

�46
Health systems in transition Australia
Esterman AJ, Ben-Tovim DI (2002). The Australian coordinated care trials: success or failure? The second round of trials may provide more answers. Medical Journal of Australia, �77: 470–47�.
Foley M (2000). The changing public–private balance. In: Bloom AL, ed. Health reform in Australia and New Zealand. Melbourne, Oxford University Press: 99–��4.
Ford J et al. (2003). Reproductive health indicators Australia 2002. Canberra, Australian Institute of Health and Welfare.
Frommer MS, Rubin GL (2000). Evidence-based health care. In: Bloom AL, ed. Health reform in Australia and New Zealand. Melbourne, Oxford University Press: 307–324.
Furler J et al. (2002). The inverse care law revisited: impact of disadvantaged location on accessing longer GP consultation times. Medical Journal of Australia, �77(2): 80–83.
Gardner H, McCoppin B(�989). Emerging militancy? The politicisation of Australian allied health professionals. In: Gardner H, ed. The politics of health: the Australian experience. Melbourne, Churchill Livingstone: 303–348.
Glover J, Harris K, Tennant S (�999). A social health atlas of Australia. Vol �: Australia 2nd edition. Adelaide, Public Health Information Development Unit, University of Adelaide.
Griew R et al (2004). ‘On our terms’: the politics of Aboriginal health in Australia. In: Healy J, McKee M, eds. Accessing health care: responding to diversity. Oxford, Oxford University Press: 257–302.
Gross P, Leeder S, Lewis M (2003). Australia confronts the challenge of chronic disease. Medical Journal of Australia, �79(5): 233–234.
Hall J (�998–�999). Five country survey shows rising dissatisfaction with health care systems. Healthcover, 8(6): ��–�5.
Ham C (�998). Lessons and conclusions. In: Ham C, ed. Health care reform. Buckingham, Open University Press. ��9–�40.
Healy J (�998). Welfare options: delivering social services. Sydney, Allen & Unwin.
Healy J (2004). The benefits of an ageing population. Canberra, The Australia Institute.
Healy J, McKee M (2004). Delivering health services in diverse societies. In: Healy J, McKee M, eds. Accessing health care: responding to diversity. Oxford, Oxford University Press: 35�–369.
Health Insurance Commission (2004). Annual report 2003–04. Canberra, HIC.

�47
AustraliaHealth systems in transition
Howe A (�998). The economics of aged care: achieving quality and containing costs. In: Mooney G, Scotton R, eds. Economics and Australian health policy. Sydney, Allen & Unwin: �37–�53.
Hughes AD (2004). Towards an outcomes-based system. Australian Health Review, 28(�): ��3.
Hurst J, Jee-Hughes M (2000). Performance measurement and performance management in OECD health systems. Paris, OECD.
Industry Commission (�997). Private health insurance. Report No. 57. Canberra, Australian Government Publishing Service.
Kewley TH (�973). Social security in Australia: 1900–1972. Sydney, Sydney University Press.
Lapsley H (2000). Quality measures in Australian health care. In: Bloom AL, ed. Health Reform in Australia and New Zealand. Melbourne, Oxford University Press. 282–292.
Lewis J (2000). From fightback to biteback: the rise and fall of a national dental program. Australian Journal of Public Administration, 59: 84–96.
Lin V, King C (2000). Intergovernmental reforms in public health. In: Bloom AL, ed. Health reform in Australia and New Zealand. Melbourne, Oxford University Press: 25�–263.
Lofgren H (2002). Generic drugs: international trends and policy developments in Australia. Working Paper No. �0, Pharmaceutical Industry Project Equity, Sustainability and Industry Development. Melbourne, Centre for Strategic Economic Studies, Victoria University of Technology.
Lyon K (2000). They said it couldn’t be done: contracting for veterans’ hospital care in Australia. In: Bloom AL, ed. Health reform in Australia and New Zealand. Melbourne, Oxford University Press: 223–234.
Mathers C (�994). Health differentials among adult Australians aged 25–64 years. Health Monitoring Series No �. Canberra, Australian Government Publishing Service.
Mathers C, Vos T, Stevenson C (�999). The burden of disease and injury in Australia, AIHW Cat. No. PHE �7. Canberra, Australian Institute of Health and Welfare.
McKee M, Healy J, eds. (2002). Hospitals in a changing Europe. Buckingham & Philadelphia, Open University Press.
McLennan AH et al. (2002). The escalating cost and prevalence of alternative medicine. Preventive Medicine 2002, 35: �66–�73.
Menadue J (2003). Healthcare reform: possible ways forward. Medical Journal of Australia, �79(7): 367–369.

�48
Health systems in transition Australia
Mossialos E, Le Grand J (�999). Cost containment in the EU: an overview. In: Mossialos E, Le Grand J, eds. Health care and containment in the European Union. Aldershot, Ashgate: �–�54.
National Health Strategy (�99�). The Australian health jigsaw: integrated health service delivery. Issues Paper No. �. Canberra, Australian Government Publishing Service.
Nolte E, McKee M (2004). Does health care save lives? Avoidable mortality revisited. London, Nuffield Trust.
NSW Health (2004). Annual report 2003–04. Sydney, NSW Department of Health.
OECD (2000). OECD Health data 2000: Comparative analysis of 29 countries. Paris, Organisation for Economic Co-operation and Development.
OECD (2003a). Health at a glance: OECD indicators 2003. Paris, Organisation for Economic Co-operation and Development.
OECD (2003b). Private health insurance in Australia, a case study. Paris, Organisation for Economic Co-operation and Development.
OECD (2004). Health data 2004, 1st edition. Paris, Organisation for Economic Co-operation and Development.
OECD (2005). Health data 2005, 1st edition. Paris, Organisation for Economic Co-operation and Development.
OECD (2006). Health data 2006, 1st edition. Paris, Organisation for Economic Co-operation and Development.
OECD Health Working Papers, prepared by Francesca Colombo and Nicole Tapay, DELSA/ELSA/WD/HEA(2003)8. Paris, Organisation for Economic Co-operation and Development.
Palmer GR, Short SD (2000). Health care and public policy: an Australian analysis, 3rd edition. Melbourne, Macmillan.
Parker MH (2003). The regulation of complementary health: sacrificing integrity? Medical Journal of Australia, �79(6): 3�6–3�8.
PHIAC (2004). Operations of the registered health benefits organisations, annual report, 2003–04. Canberra, Private Health Insurance Administration Council.
Podger A, Hagan P (2000). Reforming the Australian health care system: the role of government. In: Bloom AL, ed. Health reform in Australia and New Zealand. Melbourne, Oxford University Press: ��5–�3�.
Productivity Commission (200�). International pharmaceutical price differences. Canberra, Productivity Commission.

�49
AustraliaHealth systems in transition
Productivity Commission (2003a). Report on government services 2003. Canberra, Productivity Commission.
Productivity Commission (2003b). Evaluation of the pharmaceutical industry investment program. Research report. Canberra, Productivity Commission.
Productivity Commission (2005a). Impact of advances in medical technology in Australia. Research Report. Canberra, Productivity Commission.
Productivity Commission (2005b). Australia’s health workforce. Position paper. Canberra, Productivity Commission.
Productivity Commission (2005c). Economic implications of an ageing Australia. Melbourne, Commonwealth of Australia.
Rix M, Owen A, Eagar K (2005). (Re)form with substance? Restructuring and governance in the Australian health system 2004/05. Australia and New Zealand Health Policy, 2(�9): �–8.
Runciman WR et al. (2000) A comparison of iatrogenic injury studies in Australia and the United States. II: reviewer behaviour and quality of care. International Journal of Quality in Health Care, �2: 379–388.
Saltman RB, Figueras J, Sakellarides C (�998). Critical challenges for health care reform in Europe. Buckingham, Open University Press.
Sax, S. (�984). A strife of interests: politics and policies in Australian health services. Sydney, Allen & Unwin.
Schoen C, et al. (2005). Taking the pulse of health care systems: experiences of patients with health problems in six countries. Health Affairs, Web exclusive: W5 509–525.
Scotton R (�998). The doctor business. In: Mooney G, Scotton R, eds. Economics and Australian Health Policy. Sydney, Allen & Unwin: 72–92.
Scotton R (�999). Managed competition: the policy context. Melbourne Institute Working Paper No. �5/99). Melbourne, Melbourne Institute of Applied Economic and Social Research, The University of Melbourne.
Sheill A, Carter R (�998). Public health: some economic perspectives. In: Mooney G, Scotton R, eds. Economics and Australian Health Policy. Sydney, Allen & Unwin: 232–248.
Short SD (�998). Community activism in the health policy process: the case of the Consumers’ Health Forum of Australia. In: Yeatman A, ed. Activism and the policy process. Sydney, Allen & Unwin: �22–�45.
Short SD, Sharman E (�995). Dissecting the current nursing struggle in Australia. In: Lupton GM, Najman JM, eds. Sociology of health and illness: Australian readings, 2nd edition. Melbourne, Macmillan: 230–232.

�50
Health systems in transition Australia
Spencer J (2004). Narrowing the inequality gap in oral health and dental care in Australia. Commissioned Paper Series 2004. Sydney, Australian Health Policy Institute, University of Sydney.
Steering Committee for the Review of Commonwealth/State Service Provision (�999). Report on government services. Canberra, AusInfo.
Stoelwinder J, Viney R (2000). A tale of two states: New South Wales and Victoria. In: Bloom AL, ed. Health reform in Australia and New Zealand. Melbourne, Oxford University Press: 2��–220.
Swerissen H (2004). Australian primary care policy in 2004: two tiers or one for Medicare? Australia and New Zealand Health Policy, �: 2.
Swerissen H, Duckett S (�997). Health policy and financing. In: Gardner H, ed. Health policy in Australia. Melbourne, Oxford University Press: �3–48.
Treasurer (2002). Intergenerational report. Canberra, Commonwealth of Australia.
United Nations Population Division (2004). World population prospects: the 2002 revision population database, United Nations Population Division (http://esa.un.org/unpp/, last accessed 20 July 2006).
Western MC. et al. (2003). Computerisation in Australian general practice. Australian Family Physician, 32(3): �80–�85.
Whiteford HA, Buckingham WJ (2005). Ten years of mental health service reform in Australia: are we getting it right? Medical Journal of Australia, �82(8): 396–400.
WHO (2004). The world health report 2004, changing history. Geneva, World Health Organization.
WHO (2004b). Statistics by country or region, WHO statistical information system (WHOSIS) ( http://www.who.int/whosis/en/, last accessed 20 July 2006).
WHO (�999). Health 21: health for all in the 21st century. Copenhagen, WHO Regional Office for Europe.
WHO (200�). European Health For All database. Copenhagen, WHO Regional Office for Europe.
WHO (2005). The world health report 2005: make every mother and child count. Geneva, World Health Organization.
Wilson RM et al. (�995). The quality in Australian health care study. Medical Journal of Australia, �63: 458–47�.
Wilson R, Van Der Weyden M (2005). The safety of Australian healthcare: �0 years after QAHCS. Medical Journal of Australia, �82: 260–26�.

�5�
AustraliaHealth systems in transition
Zweifel P, Felder S, Meiers M (�999). Ageing of population and health care expenditure: a red herring? Health Economics, 8(6): 485–496.

�52
Health systems in transition Australia
ACT Health www.health.act.gov.au
Advanced Incident Management System (AIMS) www.apsf.net.au
Aged Care Standards and Accreditation Agency Ltd www.accreditation.org.au
Australasian Cochrane Centre www.cochrane.org.au
Australian Bureau of Statistics (ABS) www.abs.gov.au
Australian Commission for Safety and Quality in Health Care www.safetyandquality.gov.au
Australian Council on Healthcare Standards (ACHS) www.achs.org.au
Australian Divisions of General Practice (ADGP) www.adgp.com.au
Australian General Practice Accreditation Ltd (AGPAL/QIP) www.qip.com.au
Australian General Practice Training (AGPT) www.agpt.com.au
Australian Government Department of Health and Ageing www.health.gov.au
Australian Health Care Reform Alliance (AHCR) www.healthreform.org.au
Australian Institute of Health and Welfare (AIHW) www.aihw.gov.au
Australian Medical Association (AMA) www.ama.com.au
Australian Medical Council (AMC) www.amc.org.au
Australian Nursing Federation www.anf.org.au
Australian Radiation Protection and Nuclear Safety Agency (ARPANSA)
www.arpansa.gov.au
Australian Research Council (ARC) www.arc.gov.au
beyondblue: the national depression initiative www.beyondblue.org.au
Commonwealth Department of Families, Community Services and Indigenous Affairs (FaCSIA)
www.facs.gov.au
Commonwealth Department of Human Services (DHS) www.humanservices.gov.au
Commonwealth Department of Veterans’ Affairs (DVA) www.dva.gov.au
Consumers’ Health Forum of Australia (CHF) www.chf.org.au
Council of Australian Governments (COAG) www.coag.gov.au
Food Standards Australia New Zealand (FSANZ) www.foodstandards.gov.au
HealthInsite www.healthinsite.gov.au
Medical Journal of Australia (MJA) www.mja.com.au
Medicare Australia www.medicareaustralia.gov.au
National Health and Medical Research Council (NHMRC) www.nhmrc.gov.au
National Institute of Clinical Studies (NICS) www.nicsl.com.au
National Public Health Partnership (NPHP) www.nphp.gov.au
NSW Department of Health (NSW Health) www.health.nsw.gov.au
NT Department of Health and Community Services www.health.nt.gov.au
Note: Websites current as of �4 November 2006.
10.2 Usefulwebsitesa

�53
AustraliaHealth systems in transition
Office for Aboriginal and Torres Strait Islander Health (OATSIH) www.health.gov.au/oatsih
Private Health Insurance Administration Council (PHIAC) www.phiac.gov.au
Productivity Commission www.pc.gov.au
Queensland Department of Health (Queensland Health) www.health.qld.gov.au
SA Department of Health www.health.sa.gov.au
Tasmanian Department of Health and Human Services www.dhhs.tas.gov.au
Therapeutic Goods Administration (TGA) www.tga.gov.au
Victorian Department of Human Services www.dhs.vic.gov.au
Victorian Health Promotion Foundation (VicHealth) www.vichealth.vic.gov.au
WA Department of Health (WA Health) www.health.wa.gov.au
10.3 HiTmethodologyandproductionprocess
The Health Systems in Transition (HiT) profiles are produced by country experts in collaboration with the Observatory’s research directors and staff. The profiles are based on a template that, revised periodically, provides detailed guidelines and specific questions, definitions, suggestions for data sources, and examples needed to compile HiTs. While the template offers a comprehensive set of questions, it is intended to be used in a flexible way to allow authors and editors to adapt it to their particular national context. The most recent template is available online at: http://www.euro.who.int/observatory/Hits/20020525_�.
Authors draw on multiple data sources for the compilation of HiT profiles, ranging from national statistics, national and regional policy documents, and published literature. Furthermore, international data sources may be incorporated, such as those of the Organisation for Economic Co-operation and Development (OECD) and the World Bank. OECD Health data contain over �200 indicators for the 30 OECD countries. Data are drawn from information collected by national statistical bureaux and health ministries. The World Bank provides World Development Indicators, which also rely on official sources.
In addition to the information and data provided by the country experts, the Observatory supplies quantitative data in the form of a set of standard comparative figures for each country, drawing on the European Health for All (HFA) database. The HFA database contains more than 600 indicators defined

�54
Health systems in transition Australia
by the WHO Regional Office for Europe for the purpose of monitoring Health for All policies in Europe. It is updated for distribution twice a year from various sources, relying largely upon official figures provided by governments, as well as health statistics collected by the technical units of the WHO Regional Office for Europe. The standard HFA data have been officially approved by national governments. With its summer 2004 edition, the HFA database started to take account of the enlarged European Union (EU) of 25 Member States.
HiT authors are encouraged to discuss the data in the text in detail, especially if there are concerns about discrepancies between the data available from different sources.
A typical HiT profile consists of ten chapters.
1. Introduction: outlines the broader context of the health system, including geography and sociodemography, economic and political context, and population health.
2. Organizational structure: provides an overview of how the health system in a country is organized and outlines the main actors and their decision-making powers; discusses the historical background for the system; and describes the level of patient empowerment in the areas of information, rights, choice, complaints procedures, safety and involvement.
3. Financing: provides information on the level of expenditure, who is covered, what benefits are covered, the sources of health care finance, how resources are pooled and allocated, the main areas of expenditure, and how providers are paid.
4. Planning and regulation: addresses the process of policy development, establishing goals and priorities; deals with questions about relationships between institutional actors, with specific emphasis on their role in regulation and what aspects are subject to regulation; and describes the process of health technology assessment and research and development.
5. Physical and human resources: deals with the planning and distribution of infrastructure and capital stock; the context in which information technology (IT) systems operate; and human resource input into the health system, including information on registration, training, trends and career paths.
6. Provision of services: concentrates on patient flows, organization and delivery of services, addressing public health, primary and secondary health care, emergency and day care, rehabilitation, pharmaceutical care, long-term care, services for informal carers, palliative care, mental health

�55
AustraliaHealth systems in transition
care, dental care, complementary and alternative medicine, and health care for specific populations.
7. Principal health care reforms: reviews reforms, policies and organizational changes that have had a substantial impact on health care.
8. Assessment of the health system: provides an assessment based on the stated objectives of the health system, the distribution of costs and benefits across the population, efficiency of resource allocation, technical efficiency in health care production, quality of care, and contribution of health care to health improvement.
9. Conclusions: highlights the lessons learned from health system changes; summarizes remaining challenges and future prospects.
10. Appendices: includes references, useful web sites, legislation.
Producing a HiT is a complex process. It involves:
writing and editing the report, often in multiple iterations;
external review by (inter)national experts and the country’s Ministry of Health – the authors are supposed to consider comments provided by the Ministry of Health, but not necessarily include them in the final version;
external review by the editors and an international multidisciplinary editorial board;
finalizing the profile, including the stages of copy-editing and typesetting;
dissemination (hard copies, electronic publication, translations and launches).
The editor supports the authors throughout the production process and in close consultation with the authors ensures that all stages of the process are taken forward as effectively as possible.
•
•
•
•
•

The Health Systems in Transition (HiT) country profiles provide an analytical description of each health care system and of reform initiatives in progress or under development. They aim to provide relevant
comparative information to support policy-makers and analysts in the develop-ment of health systems and reforms in the countries of the European Region and beyond. The HiT profiles are building blocks that can be used:
to learn in detail about different approaches to the financing, organization and delivery of health care services;to describe accurately the process, content and implementation of health care reform programmes;to highlight common challenges and areas that require more in-depth analysis; and to provide a tool for the dissemination of information on health systems and the exchange of experiences of reform strategies between policy-makers and analysts in countries of the WHO European Region.
•
•
•
•
TheHealthSystemsinTransitionprofiles
AseriesoftheEuropeanObservatoryonHealthSystemsandPolicies
ThepublicationsoftheEuropeanObservatory
onHealthSystemsandPoliciesareavailableon
www.euro.who.int/observatory
HowtoobtainaHiTAll HiT profiles are available in PDF format on www.euro.who.int/observatory, where you can also join our listserve for monthly updates of the activities of the European Observatory on Health Systems and Policies, including new HiTs, books in our co-published series with Open University Press, policy briefs, the EuroObserver newsletter and the Eurohealth journal. If you would like to order a paper copy of a HiT, please write to:

HiTcountryprofilespublishedtodate:
Albania (1999, 2002a,g)Andorra (2004)Armenia (2001g, 2006)Australia (2002, 2006)Austria (2001e, 2006e)Azerbaijan (2004g)Belgium (2000)Bosnia and Herzegovina (2002g)Bulgaria (1999, 2003b)Canada (2005)Croatia (1999, 2006)Cyprus (2004)Czech Republic (2000, 2005g)Denmark (2001)Estonia (2000, 2004g,j)Finland (2002)France (2004c,g) Georgia (2002d,g)Germany (2000e, 2004e,g) Hungary (1999, 2004)Iceland (2003)Israel (2003)Italy (2001)Kazakhstan (1999g)Kyrgyzstan (2000g, 2005g)Latvia (2001)Lithuania (2000)Luxembourg (1999)Malta (1999)Netherlands (2004g)New Zealand (2002)Norway (2000, 2006)Poland (1999, 2005)Portugal (1999, 2004)Republic of Moldova (2002g)Romania (2000f)Russian Federation (2003g)Slovakia (2000, 2004)Slovenia (2002)Spain (2000h)Sweden (2001, 2005)Switzerland (2000)Tajikistan (2000)The former Yugoslav Republic of Macedonia (2000)Turkey (2002g,i)Turkmenistan (2000)Ukraine (2004g)United Kingdom of Great Britain and Northern Ireland (1999g) Uzbekistan (2001g)
Key
All HiTs are available in English. When noted, they are also available in other languages: a Albanian b Bulgarian c French d Georgian e German f Romanian g Russian h Spanish i Turkish j Estonian

The
Euro
pean
Obs
erva
tory
on
Hea
lth S
yste
ms
and
Polic
ies
is a
par
tner
ship
bet
wee
n th
e W
HO
Reg
iona
l Offi
ce fo
r Eur
ope,
the
Gov
ernm
ents
of B
elgi
um, F
inla
nd, G
reec
e, N
orw
ay, S
love
nia,
Spai
n an
d Sw
eden
, the
Ven
eto
Regi
on o
f Ita
ly, t
he E
urop
ean
Inve
stm
ent B
ank,
the
Ope
n So
ciet
y In
stitu
te, t
he W
orld
Ban
k, C
RP-S
anté
Lux
embo
urg,
the
Lond
on S
choo
l of E
cono
mic
s an
d Po
litic
al S
cien
ce a
nd th
e Lo
ndon
Sch
ool o
f Hyg
iene
& T
ropi
cal M
edic
ine.
HiT
s ar
e in
-dep
th p
rofil
es o
f hea
lth s
yste
ms
and
polic
ies,
pro
duce
d us
ing
a st
anda
rdiz
ed a
ppro
ach
that
allo
ws
com
paris
on a
cros
s co
untr
ies.
The
y pr
ovid
e fa
cts,
figu
res
and
anal
ysis
and
hi
ghlig
ht re
form
initi
ativ
es in
pro
gres
s.
ISSN
1
817-
6127