australia future oil and gas text · lng – continues to grow source: ... india source:abare. lng...
TRANSCRIPT

Australia – The Future for Oil and Gas
Philip AikenPresident and CEO BHP Billiton Petroleum
Asia Pacific Petroleum ConferenceSingapore, September 2003

Australia – historical production
Production profiles of individual Australian fields and cumulative production forecast at 50 per cent probability derived from industry data.
Source: T Powell AGSO 2001, ABARE
200
150
100
50
01967 1973 1979 1985 1991 1997 2003 2009
MMbo
e
Gippsland Basin Fields
Barrow Island Fields
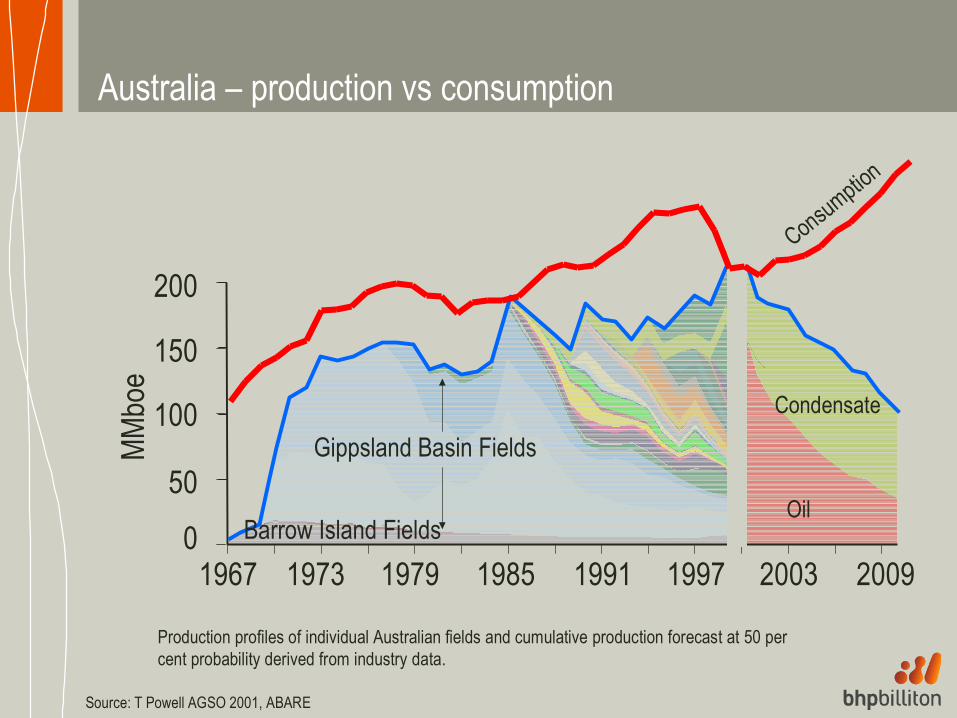
Australia – production vs consumption
Production profiles of individual Australian fields and cumulative production forecast at 50 per cent probability derived from industry data.
Source: T Powell AGSO 2001, ABARE
200
150
100
50
01967 1973 1979 1985 1991 1997 2003 2009
MMbo
e
Gippsland Basin Fields
Oil
Condensate
Consumption
Barrow Island Fields

Australia – some future liquids developmentsField name Product Liquids reserves Startup
Gorgon Gas/condensate 316 MMbbl 2009
Mutineer/Exeter Oil & Gas 120 MMbbl 2006
Stybarrow Oil & Gas Appraisal 2006
Enfield Oil & Gas 43 MMbbl 2005
Cliff Head Oil 25 MMbbl 2005
Yolla Gas/condensate 24.5 MMbbl 2004
Kipper Oil & Gas 13 MMbbl 2006
Egret Oil 11 MMbbl 2005
Source Wood Mackenzie, Nov 02.

Global Prospectivity – world undiscovered oil
Australia<1% of World Oil
Middle East & North Africa
Central & South America
Sub-Saharan Africa & Antartica
US
Europe
North America (excl U.S.)
Former Soviet Union
Asia Pacific (excl Australia)
Source: USGS

Global Materiality
0
1
2
3
4
0 0.5 1 1.5 2 2.5 3 3.5 4
Australia…not a place to rush to for oil
Fiscal Terms Increasingly Onerous
Incr
easin
g Po
litica
l Risk
.
Size of the button reflects average discovery size (MMboe, 1995-1999)
Australia
Russia
Nigeria
NorwayBrazil
UK
AngolaIndonesia
ColombiaTurkey
Algeria
Libya
China
Pakistan
US
Source: IHS Energy Group/Wood Mackenzie

0
2000
4000
6000
8000
10000
12000
1960 1964 1968 1972 1976 1980 1984 1988 1992 1996 2000
Rese
rves
Add
ition
s ( M
Mboe
)
0
20
40
60
80
100
120
140
Num
ber o
f Well
s per
Yea
r
Australia – maturity in shallow waters
Oil
Oil & Condensate
Wells

Australia – activity in maturing areas
But these are unlikely to yield material quantities of hydrocarbons…
• Shallow water basins are well explored
• Infill exploration close to infrastructure will continue
– ‘new’ technology application (3D seismic)
– incremental reserves• New plays in existing shallow water
– eg. Enfield area in WA-271-P
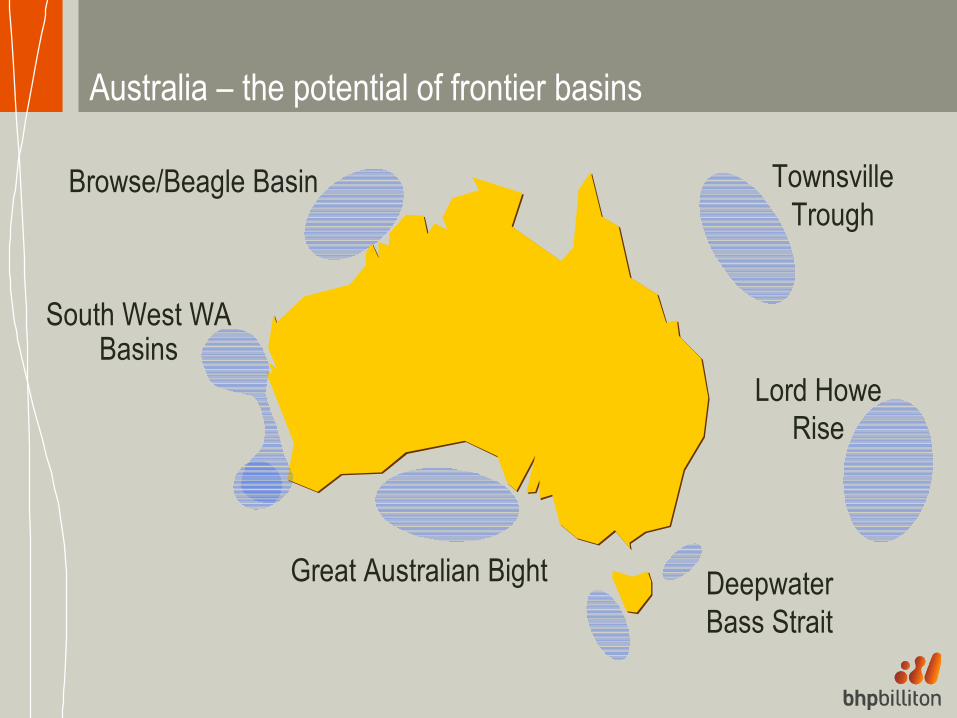
Browse/Beagle Basin
Great Australian Bight DeepwaterBass Strait
Lord Howe Rise
TownsvilleTrough
South West WA Basins
Australia – the potential of frontier basins

Responses:• Funding for technical data• Review of fiscal terms
Australia – oil Trends in industry:• Declining liquids production• Industry focus is diverging
- Minors focus on mature areas, generally smaller prizes- Majors focus on larger opportunities
• Australia regarded as maturing, and lacking prospectivity• Some untested frontier areas, mainly offshore

Australia – history of gas production
Domestic
Export
0
200
400
600
800
1000
1200
1400
1600
1973-74 1976-77 1979-80 1982-83 1985-86 1988-89 1991-92 1994-95 1997-98 2000-01
PJ
Includes: Gippsland, Cooper, Carnarvon, and other
Source: AGA

Gas consumption by State*
New South Wales
Victoria
Queensland Western Australia
South Australia
Northern Territory
0
200
400
600
800
1000
1200
1969 1973 1977 1981 1985 1989 1993 1997 2001
PJ
* Includes ethane, non-commercial natural gas and methane produced from other than natural gas fields. ** Includes ACT. Source: AGA

Australia – progressive inter-linking of markets
• 10 Years Ago – Bass Strait gas sold in
Victoria– Cooper Basin sold in NSW
& South Australia• Now
– Eastern Gas Pipeline– Tasmania supply - July
2002– South Australia pipeline to
be completed by 2004– Other interconnection
proposals– Timor Sea & PNG
discussion
Proposed Pipeline
SA
Vic
NSW
Qld
Bass Strait
Cooper Basin
Minerva
SeaGasPipeline
TGP
EGP
PNG
Timor Sea
Australia – domestic gas
Trends in industry:• Continuing increase in number of upstream suppliers• New gas supply source likely to be required for SE Aust. ~ 2010/15
- Including necessary transmission pipeline investment• Gas pipeline network growing without Govt. sponsorship/incentives• Emerging role of coal bed methane
- Level of ongoing investments dependant on supply experience and available market
• Continued retail and pipeline consolidation• Gas market remaining relatively immature and shallow
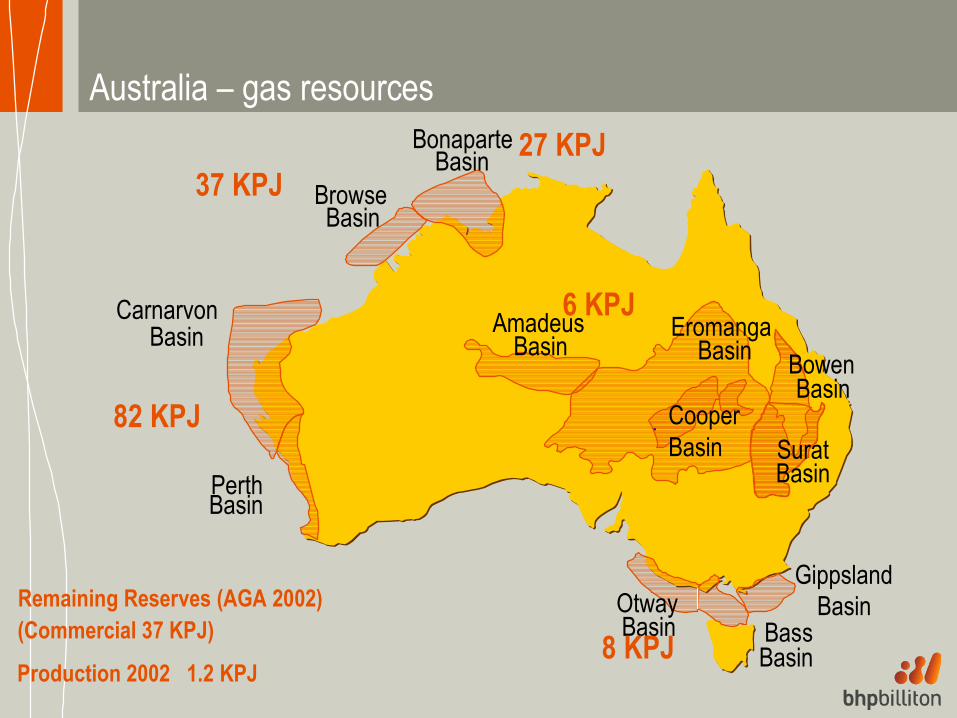
Australia – gas resources
CarnarvonBasin
PerthBasin
AmadeusBasin
BonaparteBasin
BrowseBasin
EromangaBasin
CooperBasin
GippslandBasinOtway
Basin
SuratBasin
BowenBasin
BassBasin
82 KPJ
6 KPJ
8 KPJRemaining Reserves (AGA 2002)(Commercial 37 KPJ)
Production 2002 1.2 KPJ
37 KPJ27 KPJ

Major Gas Trade MovementsTrade flows (billion cubic metres)
Source: BP Statistical Review of World Energy 2002
4.87 109.02
4.28 30.59
12.36
48.3
20.24.2
10.9338.31
75.65
4.6
2.62
6.75
20.073.63
5.3
6.896.67
8.3
15.273.04
2.6 8.25.36 10.05
22.743.7
USACanadaMexicoSth & C AmericaEuropeFormer Soviet UnionMiddle EastAfricaAsia PacificNatural GasLPG
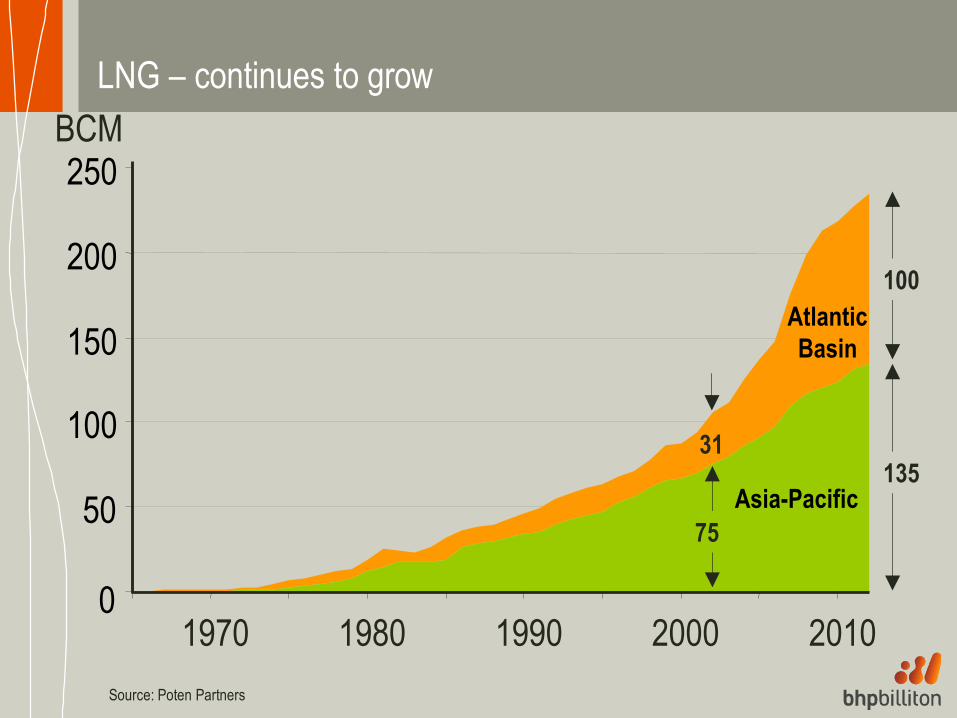
Atlantic Basin
Asia-Pacific
0
50
100
150
200
250
LNG – continues to grow
Source: Poten Partners
BCM
1970 1980 1990 2000 2010
135
75
100
31

LNG – world imports, 2002 (million tonnes)
5.2North & South
America
28.5
Europe
17.6
Korea 5.1Taiwan
53.1
Japan
Source: ABARE

LNG – supply to Asia, 2002 (million tonnes)
USA
1.2UAE
4.6
Qatar
11.2
Oman
4.8
Malaysia
14.9Brunei
6.6
Australia
7.3
Indonesia
25.1
Source: ABARE

LNG – Asian demand projections (million tonnes per annum)
2001
2010
2015
2015 high
55.262.8
6572.9
Japan
16.725 31.6 34.8
Korea
4.7 9.513.5 14.9
Taiwan
1018 20
China
5 7.5 12.5
IndiaSource:ABARE

LNG – capacity expansion plans
0
30
60
90
120
150
2003 2005 2007 2009 2011 2013 2015
Projected demand
Projected new capacity
Mt/pa
Existing capacity
Source: ABARE

LNG – market dynamics
Trends in industry:
• Fierce producer competition is lowering prices and margins
• Cost base of liquefaction is reducing
• LNG moving to “commodity status” in global market
• New LNG markets slow to materialise
• US emerging as a market
• Around 2010, expect another Australian producer of LNG other than NWS

Summary
• Australia will need to compete for exploration dollars
• Domestic gas market is immature but developing
• Australia positioned to supply growing LNG market