austin’s urban forest, 2014 - us forest service€™s urban forest, 2014 the authors david j....
TRANSCRIPT
Austin’s Urban Forest 2014
United States Department of Agriculture
Forest Service Northern Research Station
Resource Bulletin NRS-100
Publication Date February 2016
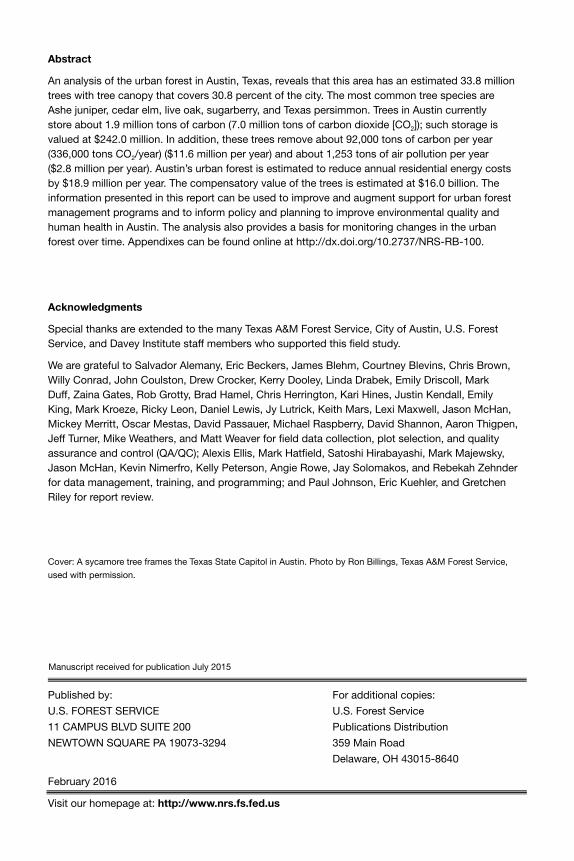
Abstract
An analysis of the urban forest in Austin, Texas, reveals that this area has an estimated 33.8 million trees with tree canopy that covers 30.8 percent of the city. The most common tree species are Ashe juniper, cedar elm, live oak, sugarberry, and Texas persimmon. Trees in Austin currently store about 1.9 million tons of carbon (7.0 million tons of carbon dioxide [CO2]); such storage is valued at $242.0 million. In addition, these trees remove about 92,000 tons of carbon per year (336,000 tons CO2/year) ($11.6 million per year) and about 1,253 tons of air pollution per year ($2.8 million per year). Austin’s urban forest is estimated to reduce annual residential energy costs by $18.9 million per year. The compensatory value of the trees is estimated at $16.0 billion. The information presented in this report can be used to improve and augment support for urban forest management programs and to inform policy and planning to improve environmental quality and human health in Austin. The analysis also provides a basis for monitoring changes in the urban forest over time. Appendixes can be found online at http://dx.doi.org/10.2737/NRS-RB-100.
Acknowledgments
Special thanks are extended to the many Texas A&M Forest Service, City of Austin, U.S. Forest Service, and Davey Institute staff members who supported this �eld study.
We are grateful to Salvador Alemany, Eric Beckers, James Blehm, Courtney Blevins, Chris Brown, Willy Conrad, John Coulston, Drew Crocker, Kerry Dooley, Linda Drabek, Emily Driscoll, Mark Duff, Zaina Gates, Rob Grotty, Brad Hamel, Chris Herrington, Kari Hines, Justin Kendall, Emily King, Mark Kroeze, Ricky Leon, Daniel Lewis, Jy Lutrick, Keith Mars, Lexi Maxwell, Jason McHan, Mickey Merritt, Oscar Mestas, David Passauer, Michael Raspberry, David Shannon, Aaron Thigpen, Jeff Turner, Mike Weathers, and Matt Weaver for �eld data collection, plot selection, and quality assurance and control (QA/QC); Alexis Ellis, Mark Hat�eld, Satoshi Hirabayashi, Mark Majewsky, Jason McHan, Kevin Nimerfro, Kelly Peterson, Angie Rowe, Jay Solomakos, and Rebekah Zehnder for data management, training, and programming; and Paul Johnson, Eric Kuehler, and Gretchen Riley for report review.
Cover: A sycamore tree frames the Texas State Capitol in Austin. Photo by Ron Billings, Texas A&M Forest Service,
used with permission.
Manuscript received for publication July 2015
Published by: For additional copies:
U.S. FOREST SERVICE U.S. Forest Service
11 CAMPUS BLVD SUITE 200 Publications Distribution
NEWTOWN SQUARE PA 19073-3294 359 Main Road
Delaware, OH 43015-8640
February 2016
Visit our homepage at: http://www.nrs.fs.fed.us
Austin’s Urban Forest, 2014
The Authors
DAVID J. NOWAK is a research forester and project leader with the U.S. Forest Service’s Northern Research Station, Syracuse, New York.
ALLISON R. BODINE is a research forester with Davey Tree’s Davey Institute, Syracuse, New York.
ROBERT E. HOEHN III is a forester with the U.S. Forest Service’s Northern Research Station, Syracuse, New York.
CHRISTOPHER B. EDGAR is a forest resource analyst with the Texas A&M Forest Service, College Station, Texas.
DUDLEY R. HARTEL is Center Manager of Urban Forestry South with the U.S. Forest Service’s Southern Research Station, Athens, Georgia.
TONYA W. LISTER is a research forester with the U.S. Forest Service’s Northern Research Station, Newtown Square, Pennsylvania.
THOMAS J. BRANDEIS is a research forester with the U.S. Forest Service’s Southern Research Station, Knoxville, Tennessee.

Austin skyline. Photo by Brad Hamel, Texas A&M Forest Service, used with permission.
CONTENTS
INTRODUCTION . . . . . . . . . . . . . . . . . . . . . . . . . . . . . . . . . . . . . . . . . . . . . . . . . . . . . . . . . .1
METHODS . . . . . . . . . . . . . . . . . . . . . . . . . . . . . . . . . . . . . . . . . . . . . . . . . . . . . . . . . . . . . . .2
Field Measurements . . . . . . . . . . . . . . . . . . . . . . . . . . . . . . . . . . . . . . . . . . . . . . . . . . . . . .2
i-Tree Eco . . . . . . . . . . . . . . . . . . . . . . . . . . . . . . . . . . . . . . . . . . . . . . . . . . . . . . . . . . . . . .5
ASSESSMENT SUMMARY . . . . . . . . . . . . . . . . . . . . . . . . . . . . . . . . . . . . . . . . . . . . . . . . . .8
Urban Forest Structure and Composition . . . . . . . . . . . . . . . . . . . . . . . . . . . . . . . . . . . . . .9
Number of Trees . . . . . . . . . . . . . . . . . . . . . . . . . . . . . . . . . . . . . . . . . . . . . . . . . . . . . . . 9
Tree Density . . . . . . . . . . . . . . . . . . . . . . . . . . . . . . . . . . . . . . . . . . . . . . . . . . . . . . . . . . 13
Leaf Area . . . . . . . . . . . . . . . . . . . . . . . . . . . . . . . . . . . . . . . . . . . . . . . . . . . . . . . . . . . . 13
Tree Size. . . . . . . . . . . . . . . . . . . . . . . . . . . . . . . . . . . . . . . . . . . . . . . . . . . . . . . . . . . . . 16
Species Composition . . . . . . . . . . . . . . . . . . . . . . . . . . . . . . . . . . . . . . . . . . . . . . . . . . . 18
Invasives. . . . . . . . . . . . . . . . . . . . . . . . . . . . . . . . . . . . . . . . . . . . . . . . . . . . . . . . . . . . . 19
Trees in Maintained Areas . . . . . . . . . . . . . . . . . . . . . . . . . . . . . . . . . . . . . . . . . . . . . . .21
Tree and Ground Cover . . . . . . . . . . . . . . . . . . . . . . . . . . . . . . . . . . . . . . . . . . . . . . . . .21
Urban Forest Values . . . . . . . . . . . . . . . . . . . . . . . . . . . . . . . . . . . . . . . . . . . . . . . . . . . . .25
Air Pollution Removal . . . . . . . . . . . . . . . . . . . . . . . . . . . . . . . . . . . . . . . . . . . . . . . . . . .25
Avoided Runoff . . . . . . . . . . . . . . . . . . . . . . . . . . . . . . . . . . . . . . . . . . . . . . . . . . . . . . . .28
Carbon Storage and Sequestration . . . . . . . . . . . . . . . . . . . . . . . . . . . . . . . . . . . . . . . .28
Energy Consumption . . . . . . . . . . . . . . . . . . . . . . . . . . . . . . . . . . . . . . . . . . . . . . . . . . .30
Structural and Functional Values . . . . . . . . . . . . . . . . . . . . . . . . . . . . . . . . . . . . . . . . . .33
Urban Forest Health . . . . . . . . . . . . . . . . . . . . . . . . . . . . . . . . . . . . . . . . . . . . . . . . . . . . .35
Damage Indicators of Tree Health. . . . . . . . . . . . . . . . . . . . . . . . . . . . . . . . . . . . . . . . . .36
Crown Indicators of Tree Health . . . . . . . . . . . . . . . . . . . . . . . . . . . . . . . . . . . . . . . . . . .38
Tree Mortality . . . . . . . . . . . . . . . . . . . . . . . . . . . . . . . . . . . . . . . . . . . . . . . . . . . . . . . . .39
MANAGEMENT IMPLICATIONS . . . . . . . . . . . . . . . . . . . . . . . . . . . . . . . . . . . . . . . . . . . . .40
Current Size Distribution and Potential Species Changes . . . . . . . . . . . . . . . . . . . . . . . .41
Nonnative Invasive Species . . . . . . . . . . . . . . . . . . . . . . . . . . . . . . . . . . . . . . . . . . . . . . .42
Insect and Disease Impacts . . . . . . . . . . . . . . . . . . . . . . . . . . . . . . . . . . . . . . . . . . . . . . .42
Population Growth. . . . . . . . . . . . . . . . . . . . . . . . . . . . . . . . . . . . . . . . . . . . . . . . . . . . . . .45
CONCLUSION . . . . . . . . . . . . . . . . . . . . . . . . . . . . . . . . . . . . . . . . . . . . . . . . . . . . . . . . . . .45
LITERATURE CITED . . . . . . . . . . . . . . . . . . . . . . . . . . . . . . . . . . . . . . . . . . . . . . . . . . . . . .48
APPENDIXES. . . . . . . . . . . . . . . . . . . . . . . . . . . . . . http://dx.doi.org/10.2737/NRS-RB-100
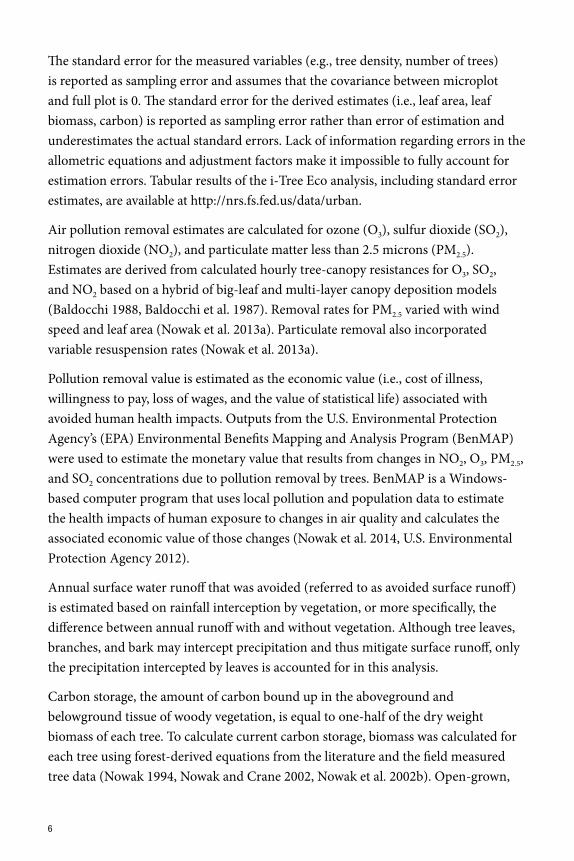
Bald cypress on Lady Bird Lake in Austin. Photo by Ron Billings, Texas
A&M Forest Service, used with permission.
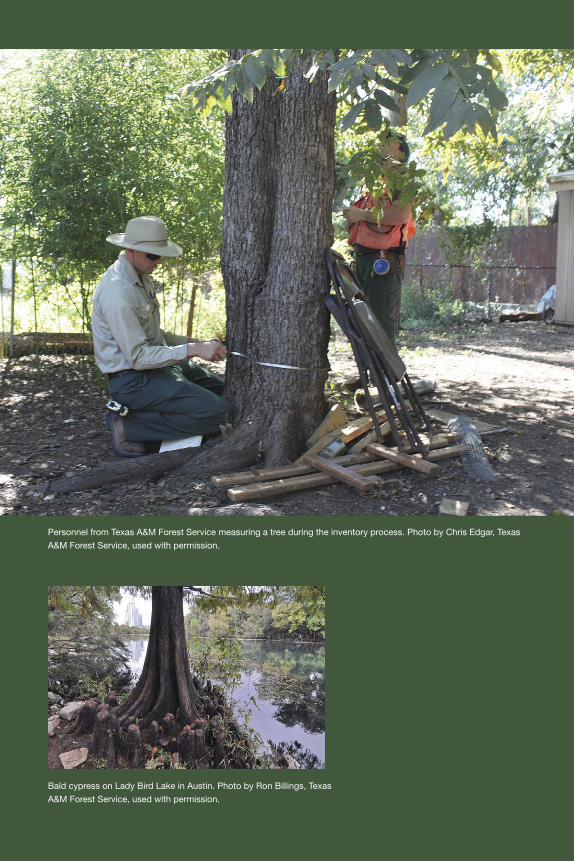
Personnel from Texas A&M Forest Service measuring a tree during the inventory process. Photo by Chris Edgar, Texas
A&M Forest Service, used with permission.

1
INTRODUCTION
Urban forests o�er a wide range of environmental bene�ts, such as the provision of wildlife habitat, aesthetic appeal, and visual barriers; reduced air temperatures, improved water quality, and mitigated air and noise pollution. Since 1930, the U.S. Forest Service Forest Inventory and Analysis (FIA) program has provided information on the amount, status, and character of forest land across the country. FIA has collected data about trees within FIA-de�ned forest land, but o�en excludes urban trees. Recognizing the importance of urban forests, and with direction from the 2014 U.S. Farm Bill1 to include urban forest monitoring in its strategic plan, FIA initiated an annualized urban inventory program. For this report, the urban forest includes all trees in the city, both within and outside forested areas, including street trees, trees on public and private lands, and trees that are planted and naturally occurring. FIA has partnered with the U.S. Forest Service’s i-Tree researchers, who have a long tradition of conducting urban forest inventories and delivering data about urban forests and ecosystems services. �e partnership o�ers an opportunity to use the strengths of each group in the combined urban inventory e�ort.
A new urban FIA framework has been designed with lessons learned from previous urban inventory pilot studies that were conducted at the state level (Cumming et al. 2007, Nowak et al. 2007, Nowak et al. 2011). �is new initiative will build a strategic, consistent national inventory of urban forests.
Austin, Texas, is one of the �rst cities to be included in the FIA Urban Inventory Program (urban FIA). �is location is ideal because of the Forest Service’s established relationships with the State of Texas, and an enthusiasm and willingness on behalf of the Texas A&M Forest Service (TFS) to collaborate and support the program. With an increasing population in Texas and the growing recognition of the environmental and economic bene�ts that trees contribute in urban areas, TFS has a pressing need to provide city governments, nonpro�t organizations, and consultants with accurate information to strengthen urban forest management and advocacy e�orts. In Texas, these urban forests are located in areas where 85 percent of Texans live. TFS has welcomed a partnership with FIA to establish an urban forest inventory in Austin. TFS is applying the credibility and rigor of FIA inventory procedures to urban areas and solidifying TFS and FIA as trusted sources of science-based information about urban forests in Texas. New partnerships, cooperators, and supporters are involved to strengthen support for the sustainability of urban forests. With the implementation of urban FIA in Austin, seamless rural-to-urban resource monitoring has begun.
1 The Agricultural Act of 2014 (H.R. 2642; Pub. L. 113-79, also known as the 2014 Farm Bill.

2
During the 2014 field season, data collection was accelerated and a full, intensified sample of urban FIA data were collected in Austin, making it the first city to have a complete set of urban FIA data. This report is a summary and analysis of the urban FIA data collected in Austin. The collected data were used with the i-Tree Eco modeling software (i-Tree 2009) to analyze and understand Austin’s urban forest. Along with this report, an online, querying application is being developed to serve information to stakeholders and will be used to garner interest and support from other metropolitan areas.
METHODS
Field MeasurementsThe estimates reported here are based on a sample of 223 plots within the city limits (Fig. 1) of Austin. Field data collection occurred from May to October 2014. TFS and FIA crews located the urban forest inventory sampling locations using global positioning system (GPS) units and aerial photographs. Two-hundred six of the 223 sampling locations were accessible (i.e., landowners gave permission to work on the plot and it was not hazardous to do so) and a permanent inventory and monitoring plot was installed on each (Fig. 2). These plots were monumented by taking GPS coordinates and measuring distance and azimuth to witness objects. Every effort was made to avoid damaging private property or overtly indicating plot location in such a way that it might compromise plot integrity.
Each urban forest inventory plot consisted of one circular area one-sixth acre in size with a radius of 48 feet (Fig. 3). Each plot contained four nested microplots, each 1/300 acre in size with a radius of 6.8 feet and offset 12 feet horizontally in each cardinal direction from the plot center. For more information on urban FIA plots, including sampling design, remeasurement, and plot layout, see appendix 1.
In the urban plot, data were collected for all trees2 that had a diameter at breast height (d.b.h.) or diameter at root collar (d.r.c.) of 5 inches or greater. In the nested microplots, data were collected on all trees with a d.b.h./d.r.c. of 1 inch through 4.9 inches (i.e., saplings). FIA field crews are trained to collect data for species based on a regional tree species list. For urban FIA, this list has been expanded beyond the traditional FIA tree species list to include exotic and ornamental trees that are not usually seen on rural forest land.The complete urban FIA tree species list is available in the FIA field guide (U.S. Forest Service 2014a).2 In general, FIA defines a tree as a perennial woody plant species that can attain a height of 15 feet at maturity. Trees are distinguished from shrubs, not by their height at the time of sample collection, but rather by the general growth form of the species in a particular region.

3
Figure 2.—Approximate locations for 206 urban inventory plots, Austin, 2014.
!
!!
!!
!!
!
!
!
!
! !
!
!
!
!
!
!
!
!
!
!!
!
!
!
!
!
!
!!
!
!
!
!
!
!
!
!
!
!
!
!
!
!!
!
!
!
!!
!
!
!
!
!
!
!
!
!
!
!
!
!
!
!
!
!
!
!!!
!
!
!
!
!
!
!
!
!
!!
!
!
!
!
!
!
!
!
!
!
!
!
!
!
!
!
!
!
!
!
!
!
!
!
!
!!
!
!
!
!
!
!
!
!
!!
!
!
!
!!
!
!
!
!!
!
!
!!
!
!
!
!!
!
!
!
!
!
!
!
!
!!
!
!
!
!
!
!
!
!
!
!
!
!
!
!
!
!
!
!
!
!
!
!!
!
!
!
!!
!
!
!
!
!
!
!
!
!
!
!
!
!
!
!
!
!
!
!
!
!
!
!
!!
!
!
!
¯0 5 102.5Miles
Figure 1.—Austin, Texas, city boundaries as de�ned by the 2010 U.S. Census.
£¤290
£¤183
£¤79
£¤183
£¤290
§̈¦35
Travis
HaysBastrop
Williamson
Caldwell¯ 0 10 205Miles
^

4
Generally, inventory crews measured the d.b.h. at 4.5 feet above the ground for each tree. For special situations, such as forked trees, urban FIA protocol was followed (U.S. Forest Service 2014a). Diameter measurements were not taken at breast height for trees identi�ed as woodland species on the regional tree species list. For woodland species, inventory crews measured the d.r.c. at the ground line or stem root collar, whichever was farthest from the ground. �ese d.b.h. and d.r.c. data are collectively referred to as diameter throughout this report.
In addition to diameter data, inventory crews identi�ed tree species, measured tree length (i.e., measurement of bole from ground level to tree top), and described tree status, health, and presence of damages. (�e complete lists of potential urban tree damages, pests, and diseases can be found in the urban FIA �eld guide [U.S. Forest Service 2014a].) Additional measurements and descriptions were made of each individual tree’s crown to further assess its health (i-Tree 2009). Crown variables recorded include crown ratio (as a percentage of total tree length), crown class (relative to the surrounding trees), crown light exposure, crown dieback, crown diameter, and the absence of foliage. Inventory crews also noted whether each tree was within a maintained (e.g., as evidenced by the presence of landscaping or maintenance activities) or riparian area, whether it was a street tree (e.g., located within 8 feet of the edge of a maintained, surfaced roadway) or a planted tree.
Additional data were collected for trees (live or dead) greater than 20 feet in height within 60 feet of residential buildings. �ese data (i.e., distance and direction to building) were used for estimating tree e�ects on building energy use. Space-conditioned structures (heated and perhaps cooled) were classi�ed as buildings if
Figure 3.—Urban forest inventory plot diagram, Austin, 2014.

5
they were no more than three stories (two stories plus attic) in height above ground level. i-Tree Eco uses an algorithm for single standing structures no larger than 4,000 square feet in total inhabitable (heated or cooled) space, although larger single-family homes or duplexes were included regardless of size. Unheated detached garages, sheds, or other outbuildings were not included. �e building a�ected by the tree did not have to be on the plot.
Data collection methods included the delineation of unique condition classes on the urban plot including the determination of whether a condition was forest land, nonforest land, water, etc. Forested conditions were further delineated based on forest type, stand size, reserve status, etc., in the same manner as traditional FIA methods. Condition classes on nonforest land were established based on land use, ownership, and reserved status (U.S. Forest Service 2014a). For each condition on the plot, �eld crews estimated percentage covers for trees/saplings, shrubs/seedlings, buildings, impervious surfaces, permeable surfaces, herbaceous vegetation, and water.
Please note that the urban FIA data collection protocol described here di�ers somewhat from the data collection procedures typically prescribed by the i-Tree program. More technical information on the di�erent methodologies is being developed and, when completed, will be available at http://nrs.fs.fed.us/data/urban.
i-Tree Eco �e urban FIA data collected in the �eld were analyzed using the i-Tree Eco modeling so�ware (Nowak and Crane 2000, Nowak et al. 2008). i-Tree Eco quanti�es forest structure and associated ecosystem services and monetary values using standardized �eld data. Structure is a measure of various physical attributes of the urban forest, including tree species composition, number of trees, tree density, tree health, leaf area, biomass, and species diversity. Ecosystem services are determined by forest structure and include such attributes as air pollution removal and carbon storage or sequestration. Monetary values are an estimate of the economic worth of the various forest functions.
i-Tree Eco calculates totals, averages, and standard errors by species, land cover, and city for forest structure and associated ecosystem services and values, such as carbon storage and sequestration, air pollution removal and value, tree e�ects on building energy use, and compensatory value.
6
�e standard error for the measured variables (e.g., tree density, number of trees) is reported as sampling error and assumes that the covariance between microplot and full plot is 0. �e standard error for the derived estimates (i.e., leaf area, leaf biomass, carbon) is reported as sampling error rather than error of estimation and underestimates the actual standard errors. Lack of information regarding errors in the allometric equations and adjustment factors make it impossible to fully account for estimation errors. Tabular results of the i-Tree Eco analysis, including standard error estimates, are available at http://nrs.fs.fed.us/data/urban.
Air pollution removal estimates are calculated for ozone (O3), sulfur dioxide (SO2), nitrogen dioxide (NO2), and particulate matter less than 2.5 microns (PM2.5). Estimates are derived from calculated hourly tree-canopy resistances for O3, SO2, and NO2 based on a hybrid of big-leaf and multi-layer canopy deposition models (Baldocchi 1988, Baldocchi et al. 1987). Removal rates for PM2.5 varied with wind speed and leaf area (Nowak et al. 2013a). Particulate removal also incorporated variable resuspension rates (Nowak et al. 2013a).
Pollution removal value is estimated as the economic value (i.e., cost of illness, willingness to pay, loss of wages, and the value of statistical life) associated with avoided human health impacts. Outputs from the U.S. Environmental Protection Agency’s (EPA) Environmental Bene�ts Mapping and Analysis Program (BenMAP) were used to estimate the monetary value that results from changes in NO2, O3, PM2.5, and SO2 concentrations due to pollution removal by trees. BenMAP is a Windows-based computer program that uses local pollution and population data to estimate the health impacts of human exposure to changes in air quality and calculates the associated economic value of those changes (Nowak et al. 2014, U.S. Environmental Protection Agency 2012).
Annual surface water runo� that was avoided (referred to as avoided surface runo�) is estimated based on rainfall interception by vegetation, or more speci�cally, the di�erence between annual runo� with and without vegetation. Although tree leaves, branches, and bark may intercept precipitation and thus mitigate surface runo�, only the precipitation intercepted by leaves is accounted for in this analysis.
Carbon storage, the amount of carbon bound up in the aboveground and belowground tissue of woody vegetation, is equal to one-half of the dry weight biomass of each tree. To calculate current carbon storage, biomass was calculated for each tree using forest-derived equations from the literature and the �eld measured tree data (Nowak 1994, Nowak and Crane 2002, Nowak et al. 2002b). Open-grown,

7
maintained urban trees (i.e., trees that do not grow in a forested area and experience regular maintenance such as pruning) tend to have less biomass than predicted by forest biomass equations. To adjust for this di�erence, biomass results for open-grown urban trees are multiplied by 0.8 (Nowak 1994, Nowak and Crane 2002, Nowak et al. 2002b). No adjustment was made for trees found in natural stand conditions. Tree dry-weight biomass was converted to stored carbon by multiplying by 0.5 (Nowak 1994, Nowak and Crane 2002, Nowak et al. 2002b).
Carbon sequestration is the amount of carbon removed from the atmosphere and turned into tissue by a tree in a single year. To estimate annual carbon sequestration, average annual diameter growth based on appropriate diameter class, crown competition level, and tree condition was added to the existing tree diameter (in year x) to estimate tree diameter and carbon storage in year x+1.
To estimate the monetary value of carbon storage and sequestration, tree carbon values were multiplied by $126.40 per ton of carbon based on the estimated social costs of carbon for 2013 using a 3 percent discount rate. �e social cost of carbon is a monetary value that encompasses the economic impact of increased carbon emissions on factors such as agricultural productivity, human health, and property damages (Interagency Working Group 2013).
�e e�ect of trees on residential building energy use was calculated using distance and direction of trees from residential structures, tree height, and tree condition data (McPherson and Simpson 1999). Savings in residential energy costs were calculated based on state average 2012 costs for natural gas (U.S. Energy
Photo from Thinkstock.com

8
Information Administration 2014b), 2012/2013 heating season fuel oil costs (U.S. Energy Information Administration 2014c), 2012 residential electricity costs (U.S. Energy Information Administration 2012a), and 2012 costs of wood (U.S. Energy Information Administration 2012b).
Compensatory values were based on valuation procedures of the Council of Tree and Landscape Appraisers (2000), which uses tree species, diameter, condition, and location information (Nowak et al. 2002a). More information on i-Tree Eco methods (Nowak et al. 2008, Nowak and Crane 2000, Nowak et al. 2002b) can be found at www.itreetools.org.
ASSESSMENT SUMMARY
To assess Austin’s urban forest and establish a baseline for future monitoring, a �eld study was conducted during the summer and fall of 2014 as part of the FIA’s urban protocol. �e standardized �eld data were processed using i-Tree Eco. �is report summarizes the results of this study (Table 1).
Table 1.—Summary of the urban forest features, Austin, 2014
Feature Estimate
Number of trees 33.8 million
Tree cover 30.8%
Most abundant species by:
Number of trees Ashe juniper, cedar elm, live oak, sugarberry, Texas persimmon
Leaf area Ashe juniper, live oak, cedar elm, sugarberry, Buckley oak
Proportion of trees less than 5 inches in diametera 61.3%
Pollution removal 1,300 tons/year ($2.8 million/year)
VOC emissions 5,900 tons/year
Avoided runoff 65 million ft3/year
Carbon storage 1.9 million tons ($242 million)
Carbon sequestration 92,000 tons/year ($11.6 million/year)
Value of reduced building energy use $18.9 million/year
Value of reduced carbon emissions $4.9 million/year
Compensatory value $16.0 billion
a Diameter measurements were taken at breast height (d.b.h.) or root collar (d.r.c.) for woodland species
Note: ton = short ton (U.S.) (2,000 lbs)

9
Urban Forest Structure and Composition
Number of TreesAustin’s urban forest has an estimated 33.8 million trees. �e �ve most common species in the urban forest in terms of number of trees were Ashe juniper, cedar elm, live oak, sugarberry, and Texas persimmon (Fig. 4). �e 10 most common species account for 83.6 percent of all trees. Sixty-two unique tree species were sampled in Austin (Table 2); these species and their relative abundance are presented in appendix 2.
�e city was divided into areas based on National Land Cover data in order to analyze variability of the urban forest across the city by land cover. Plots were categorized among the following landcover classes (Table 3):
• Developed–Open: open space on developed land
• Evergreen Forest: evergreen forest land
• Developed–Medium: medium intensity developed land
• Developed–Low: low intensity developed land
• Deciduous/Mixed Forest: deciduous forest, mixed forest, and woody wetland lands
• Developed–High: high intensity developed land
• Shrub/Herbaceous: shrub/scrub, grassland/herbaceous, pasture/hay, and cultivated crop lands.
• Water/Barren includes open water, barren land, and emergent herbaceous wetlands.
�ese land cover de�nitions3 are based on the 2011 National Land Cover Database (NCLD) (Homer et al. 2015) (for complete de�nitions of each category, see appendix 3). �e distribution of the land cover classes across Austin shows that the northwestern area of the city is dominated by Evergreen and Deciduous/Mixed Forest land and the central portion of the city, corresponding to the Interstate-35 corridor, is primarily Developed (Fig. 5). �e 206 plots sampled in Austin are also representative of this pattern (Fig. 6). See appendix 4 for information on species distribution by land cover.
3 Land cover de�nitions provided at http://www.mrlc.gov/nlcd11_leg.php

10
Ashe juniper 39.3%
Cedar elm 13.5% Live oak
8.4%
Sugarberry 6.1%
Texas persimmon 6.0%
Yaupon 2.5%
Green ash 2.2%
Honey mesquite 1.9%
Mescalbean 1.9%
Glossy privet 1.8%
other species 16.4%
Figure 4.—Urban forest species composition as a percentage of all trees, Austin, 2014.
Table 2.—Statistics of species sampled in the urban forest, Austin, 2014
Diametera
Genus Species Common Name Trees Median Average
number % inches inches
Acacia farnesiana sweet acacia 5,000 <0.1 5.5 5.5
Acer negundo boxelder 368,000 1.1 1.8 4.2
Albizia julibrissin mimosa* 5,000 <0.1 5.5 5.5
Arbutus xalapensis Texas madrone 6,000 <0.1 7.5 7.5
Betula nigra river birch 60,000 0.2 1.5 1.5
Broussonetia papyrifera paper mulberry* 336,000 1.0 2.7 4.7
Carya illinoinensis pecan 196,000 0.6 12.8 13.6
Celtis laevigata sugarberry 2,059,000 6.1 1.8 3.5
Celtis occidentalis northern hackberry 162,000 0.5 5.3 5.8
Cercis canadensis eastern redbud 6,000 <0.1 11.5 11.5
Cornus drummondii roughleaf dogwood 60,000 0.2 1.5 1.5
Diospyros texana Texas persimmon 2,016,000 6.0 1.7 1.8
Eriobotrya japonica loquat tree 313,000 0.9 2.0 2.0
Ficus carica common fig 23,000 0.1 6.2 6.1
Fraxinus berlandieriana Mexican ash 185,000 0.5 1.8 4.9
Fraxinus pennsylvanica green ash 751,000 2.2 4.1 5.0
Fraxinus texensis Texas ash 438,000 1.3 1.9 3.0
Fraxinus velutina velvet ash 59,000 0.2 8.4 10.9
Ilex vomitoria yaupon 834,000 2.5 1.5 1.5
Juglans nigra black walnut 105,000 0.3 0.0 4.4
Juniperus ashei Ashe juniper 13,300,000 39.3 5.1 6.0
Juniperus virginiana eastern red cedar 38,000 0.1 6.3 6.3
Koelreuteria paniculata goldenrain tree 6,000 <0.1 6.5 6.5
Lagerstroemia indica common crapemyrtle 175,000 0.5 5.3 6.9
Ligustrum japonicum Japanese privet* 17,000 0.1 9.5 10.2
Ligustrum lucidum glossy privet* 624,000 1.8 2.1 3.0
Ligustrum sinense Chinese privet* 124,000 0.4 9.2 9.7
Magnolia grandiflora southern magnolia 6,000 <0.1 6.5 6.5
Melia azedarach chinaberry* 539,000 1.6 2.0 3.4
Morus alba white mulberry* 14,000 <0.1 5.5 5.5
Morus rubra red mulberry 125,000 0.4 2.0 2.3
(Table 2 continued on next page)
11
(Table 2 continued)
Diametera
Genus Species Common Name Trees Median Average
number % inches inches
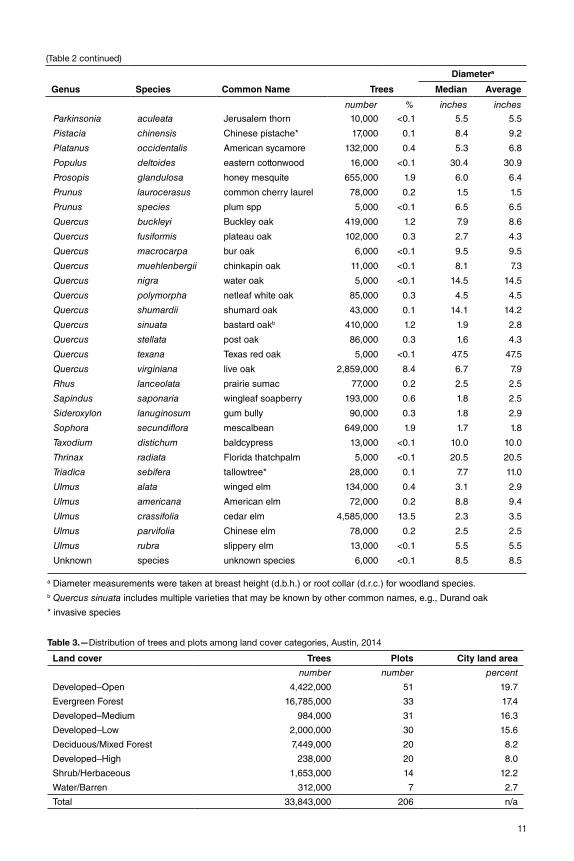
Table 3.—Distribution of trees and plots among land cover categories, Austin, 2014
Land cover Trees Plots City land area
number number percent
Developed–Open 4,422,000 51 19 .7
Evergreen Forest 16,785,000 33 17 .4
Developed–Medium 984,000 31 16 .3
Developed–Low 2,000,000 30 15 .6
Deciduous/Mixed Forest 7,449,000 20 8 .2
Developed–High 238,000 20 8 .0
Shrub/Herbaceous 1,653,000 14 12 .2
Water/Barren 312,000 7 2 .7
Total 33,843,000 206 n/a
a Diameter measurements were taken at breast height (d .b .h .) or root collar (d .r .c .) for woodland species .b Quercus sinuata includes multiple varieties that may be known by other common names, e .g ., Durand oak
* invasive species
Parkinsonia aculeata Jerusalem thorn 10,000 <0 .1 5 .5 5 .5
Pistacia chinensis Chinese pistache* 17,000 0 .1 8 .4 9 .2
Platanus occidentalis American sycamore 132,000 0 .4 5 .3 6 .8
Populus deltoides eastern cottonwood 16,000 <0 .1 30 .4 30 .9
Prosopis glandulosa honey mesquite 655,000 1 .9 6 .0 6 .4
Prunus laurocerasus common cherry laurel 78,000 0 .2 1 .5 1 .5
Prunus species plum spp 5,000 <0 .1 6 .5 6 .5
Quercus buckleyi Buckley oak 419,000 1 .2 7 .9 8 .6
Quercus fusiformis plateau oak 102,000 0 .3 2 .7 4 .3
Quercus macrocarpa bur oak 6,000 <0 .1 9 .5 9 .5
Quercus muehlenbergii chinkapin oak 11,000 <0 .1 8 .1 7 .3
Quercus nigra water oak 5,000 <0 .1 14 .5 14 .5
Quercus polymorpha netleaf white oak 85,000 0 .3 4 .5 4 .5
Quercus shumardii shumard oak 43,000 0 .1 14 .1 14 .2
Quercus sinuata bastard oakb 410,000 1 .2 1 .9 2 .8
Quercus stellata post oak 86,000 0 .3 1 .6 4 .3
Quercus texana Texas red oak 5,000 <0 .1 47 .5 47 .5
Quercus virginiana live oak 2,859,000 8 .4 6 .7 7 .9
Rhus lanceolata prairie sumac 77,000 0 .2 2 .5 2 .5
Sapindus saponaria wingleaf soapberry 193,000 0 .6 1 .8 2 .5
Sideroxylon lanuginosum gum bully 90,000 0 .3 1 .8 2 .9
Sophora secundiflora mescalbean 649,000 1 .9 1 .7 1 .8
Taxodium distichum baldcypress 13,000 <0 .1 10 .0 10 .0
Thrinax radiata Florida thatchpalm 5,000 <0 .1 20 .5 20 .5
Triadica sebifera tallowtree* 28,000 0 .1 7 .7 11 .0
Ulmus alata winged elm 134,000 0 .4 3 .1 2 .9
Ulmus americana American elm 72,000 0 .2 8 .8 9 .4
Ulmus crassifolia cedar elm 4,585,000 13 .5 2 .3 3 .5
Ulmus parvifolia Chinese elm 78,000 0 .2 2 .5 2 .5
Ulmus rubra slippery elm 13,000 <0 .1 5 .5 5 .5
Unknown species unknown species 6,000 <0 .1 8 .5 8 .5

12
Land Cover and Percentage of Total
Developed–Open (20%)
Developed–Low (16%)
Developed–Medium (16%)
Developed–High (8%)
Deciduous/Mixed Forest (8%)
Evergreen Forest (17%)
Shrub/Herbaceous (12%)
Water/Barren (3%)
Figure 5.—Land cover distribution based on National Land Cover Database (Homer et al. 2015), Austin, 2014. Land
was classi�ed into one of eight land cover classes.

13
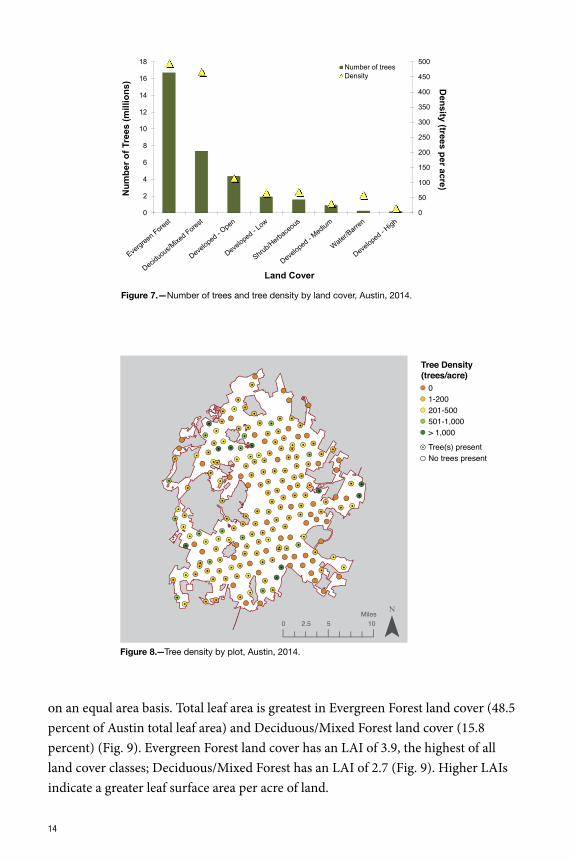
Tree Density�e urban tree density in Austin is 173 trees per acre. �e highest density of 495 trees per acre occurs in the Evergreen Forest category, followed by Deciduous/Mixed Forest (466 trees per acre), and Developed–Open land (115 trees per acre) (Fig. 7). �e Evergreen Forest land cover is present in 17.4 percent of the city and contains 49.6 percent of the trees. �e Deciduous/Mixed Forest covers 8.2 percent of the land area and contains 22.0 percent of the trees.
Tree density ranges from 6 to 2,049 trees per acre based on plots where trees are present (Fig. 8). Ten of the 206 plots sampled have a tree density greater than 1,000 trees per acre. �ese plots are located mostly in the forested areas of the city; plots with signi�cantly lower tree densities are primarily located in the developed areas of the city.
Leaf AreaLeaf area is a measure of one side of a leaf ’s surface area. Leaf area index (LAI) is a measure of the sum of all leaves’ surface area (one side) divided by the area of a land cover class. To visualize this, imagine all the leaves in a certain land class—such as Deciduous/Mixed Forest—being plucked from the trees and laid side by side on the ground. LAI refers to the proportion of land that is covered by leaves. As each land cover class has a di�erent amount of land area, LAI standardizes the canopy volume
Figure 6.—Plot distribution by land cover, Austin, 2014.
Land CoverDeveloped–OpenDeveloped–LowDeveloped–MediumDeveloped–HighDeciduous/Mixed ForestEvergreen ForestShrub/HerbaceousWater/Barren
Tree(s) presentNo trees present
14
on an equal area basis. Total leaf area is greatest in Evergreen Forest land cover (48.5 percent of Austin total leaf area) and Deciduous/Mixed Forest land cover (15.8 percent) (Fig. 9). Evergreen Forest land cover has an LAI of 3.9, the highest of all land cover classes; Deciduous/Mixed Forest has an LAI of 2.7 (Fig. 9). Higher LAIs indicate a greater leaf surface area per acre of land.
Figure 8.—Tree density by plot, Austin, 2014.
Tree Density (trees/acre)
01-200201-500501-1,000> 1,000
Tree(s) presentNo trees present
Figure 7.—Number of trees and tree density by land cover, Austin, 2014.
Fig7
Page 2
0
50
100
150
200
250
300
350
400
450
500
0
2
4
6
8
10
12
14
16
18
Density (trees per acre) N
umbe
r of T
rees
(mill
ions
)
Land Cover
Number of treesDensity

15
Many tree bene�ts calculated by i-Tree Eco are linked to the leaf area of the plant. Leaf area has a positive correlation with environmental bene�ts, i.e., the greater the leaf area, the greater the bene�t. In Austin’s urban forest, tree species with the greatest leaf area are Ashe juniper, live oak, and cedar elm (Fig. 10). Of trees accounting for at least 1.0 percent of the population, Buckley oak, live oak, and boxelder represent a much greater percent of Austin’s leaf area than population. Tree species that account for at least 1.0 percent of the population with relatively low amounts of leaf area per stem are yaupon, Texas persimmon, and mescalbean.
Fig9
Page 3
0.0
0.5
1.0
1.5
2.0
2.5
3.0
3.5
4.0
4.5
0
20
40
60
80
100
120
140
Leaf Area Index (LAI) Le
af A
rea
(1,0
00 a
cres
)
Land Cover
Leaf area
Leaf area index
Figure 9.—Leaf area and leaf area index by land cover, Austin, 2014.
Figure 10.—Percentage of total tree population and total leaf area for 10 most
common species by leaf area, Austin, 2014.
0
5
10
15
20
25
30
35
40
45
Perc
ent
Species
Leaf areaAbundance
16
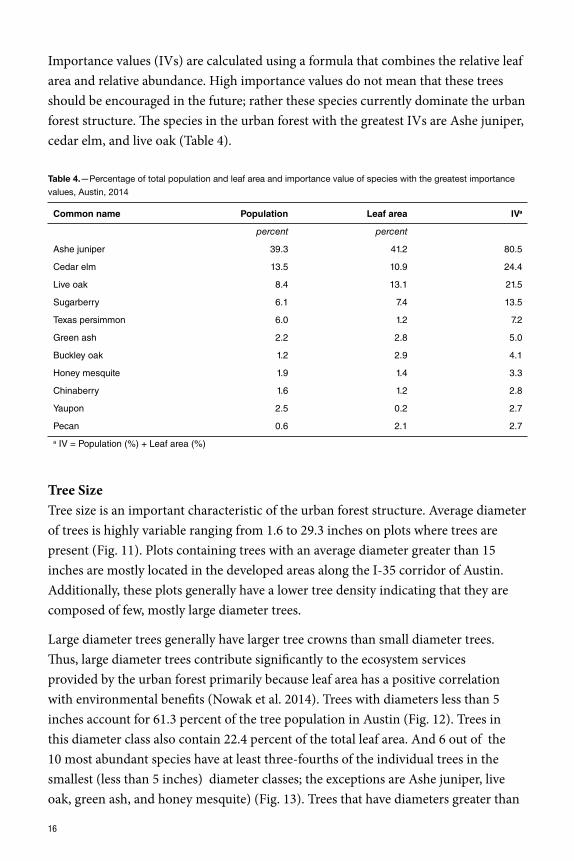
Importance values (IVs) are calculated using a formula that combines the relative leaf area and relative abundance. High importance values do not mean that these trees should be encouraged in the future; rather these species currently dominate the urban forest structure. The species in the urban forest with the greatest IVs are Ashe juniper, cedar elm, and live oak (Table 4).
Tree SizeTree size is an important characteristic of the urban forest structure. Average diameter of trees is highly variable ranging from 1.6 to 29.3 inches on plots where trees are present (Fig. 11). Plots containing trees with an average diameter greater than 15 inches are mostly located in the developed areas along the I-35 corridor of Austin. Additionally, these plots generally have a lower tree density indicating that they are composed of few, mostly large diameter trees.
Large diameter trees generally have larger tree crowns than small diameter trees. Thus, large diameter trees contribute significantly to the ecosystem services provided by the urban forest primarily because leaf area has a positive correlation with environmental benefits (Nowak et al. 2014). Trees with diameters less than 5 inches account for 61.3 percent of the tree population in Austin (Fig. 12). Trees in this diameter class also contain 22.4 percent of the total leaf area. And 6 out of the 10 most abundant species have at least three-fourths of the individual trees in the smallest (less than 5 inches) diameter classes; the exceptions are Ashe juniper, live oak, green ash, and honey mesquite) (Fig. 13). Trees that have diameters greater than
Common name Population Leaf area IVa
percent percent
Ashe juniper 39 .3 41 .2 80 .5
Cedar elm 13 .5 10 .9 24 .4
Live oak 8 .4 13 .1 21 .5
Sugarberry 6 .1 7 .4 13 .5
Texas persimmon 6 .0 1 .2 7 .2
Green ash 2 .2 2 .8 5 .0
Buckley oak 1 .2 2 .9 4 .1
Honey mesquite 1 .9 1 .4 3 .3
Chinaberry 1 .6 1 .2 2 .8
Yaupon 2 .5 0 .2 2 .7
Pecan 0 .6 2 .1 2 .7
a IV = Population (%) + Leaf area (%)
Table 4.—Percentage of total population and leaf area and importance value of species with the greatest importance
values, Austin, 2014

17
Figure 12.—Percentage of total population and leaf area by diameter class, Austin,
2014. Diameter classes are designated by their midpoint (e.g., 2 is actually 1 to 2.9
inches). Diameter measurements were taken at breast height (d.b.h.) or root collar
(d.r.c.) for woodland species.
0
5
10
15
20
25
30
35
40
45
50
2 4 6 8 10 12 14 16 18 20 22 24 26 28 30+
Perc
ent
Diameter Class (inches)
Leaf areaAbundance
Figure 11.—Average tree diameter by plot, Austin, 2014.
Average Tree Diameter (inches)
0.00.1-4.95.0-9.910.0-14.915.0+
Tree(s) presentNo trees present

18
or equal to 15 inches account for 3.4 percent of the tree population, but comprise 18.4 percent of the total leaf area. �ough these large diameter trees are a small percentage of the tree population, they are an important part of the urban forest in Austin. For more information about environmental bene�ts by diameter class, see appendix 5.
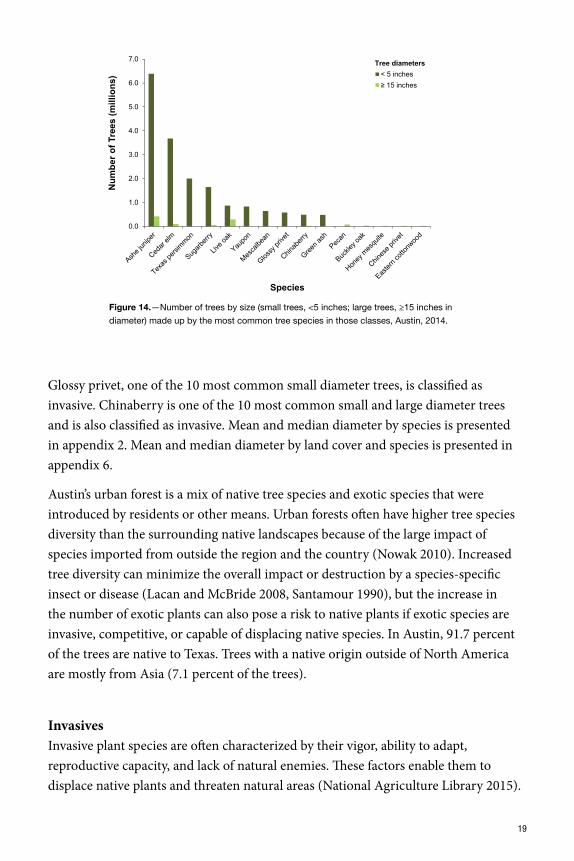
Species CompositionTree species composition varies between the small diameter (less than 5 inches) and large diameter trees (greater than or equal to 15 inches). �e 10 most common species of small diameter trees are Ashe juniper (30.8 percent of trees in d.b.h. class), cedar elm (17.7 percent), Texas persimmon (9.6 percent), sugarberry (7.9 percent), live oak (4.2 percent), yaupon (4.0 percent), mescalbean (3.1 percent), glossy privet (2.8 percent), chinaberry (2.3 percent), and green ash (2.3 percent). �e 10 most common species of large diameter trees are Ashe juniper (35.9 percent of trees in class), live oak (25.1 percent), cedar elm (8.4 percent), pecan (6.7 percent), sugarberry (4.6 percent), Buckley oak (2.4 percent), honey mesquite (1.8 percent), Chinese privet (1.6 percent), chinaberry (1.6 percent), and eastern cottonwood (1.4 percent). Five species—Ashe juniper, cedar elm, sugarberry, live oak, and chinaberry—are among the 10 most common small diameter trees and the 10 most common large diameter trees (Fig. 14).
Figure 13.—Percentage of species population by diameter class for 10 most
common species, Austin, 2014. Diameter classes are designated by their midpoint
(e.g., 2 is actually 1 to 2.9 inches). Diameter measurements were taken at breast
height (d.b.h.) or root collar (d.r.c.) for woodland species.
01020304050
60
70
80
90
100
26
1014
1822
2630+
Spec
ies
Popu
latio
n (p
erce
nt)
Diameter Class (inches)
19
Glossy privet, one of the 10 most common small diameter trees, is classi�ed as invasive. Chinaberry is one of the 10 most common small and large diameter trees and is also classi�ed as invasive. Mean and median diameter by species is presented in appendix 2. Mean and median diameter by land cover and species is presented in appendix 6.
Austin’s urban forest is a mix of native tree species and exotic species that were introduced by residents or other means. Urban forests o�en have higher tree species diversity than the surrounding native landscapes because of the large impact of species imported from outside the region and the country (Nowak 2010). Increased tree diversity can minimize the overall impact or destruction by a species-speci�c insect or disease (Lacan and McBride 2008, Santamour 1990), but the increase in the number of exotic plants can also pose a risk to native plants if exotic species are invasive, competitive, or capable of displacing native species. In Austin, 91.7 percent of the trees are native to Texas. Trees with a native origin outside of North America are mostly from Asia (7.1 percent of the trees).
InvasivesInvasive plant species are o�en characterized by their vigor, ability to adapt, reproductive capacity, and lack of natural enemies. �ese factors enable them to displace native plants and threaten natural areas (National Agriculture Library 2015).
Figure 14.—Number of trees by size (small trees, <5 inches; large trees, ≥15 inches in
diameter) made up by the most common tree species in those classes, Austin, 2014.
0.0
1.0
2.0
3.0
4.0
5.0
6.0
7.0
Num
ber o
f Tre
es (m
illio
ns)
Species
< 5 inches
Tree diameters

20
Nine of the 62 tree species sampled in Austin are identi�ed on the regional invasive species list (Watershed Protection Development Review, n.d.). �ese nonnative invasive species comprise 5.1 percent of the tree population; the most common invasive species are glossy privet, chinaberry, and paper mulberry (Table 5). Most Austin plots had no measured invasive tree species. Twenty-eight of the 206 plots sampled have invasive tree species present; these plots are distributed throughout the city (Fig. 15).
Common name Proportion of
all trees
Leaf area as a proportion
of all leaf area
Number of
plots found
percent percent
Glossy privet 1.8 0.7 6
Chinaberry 1.6 1.2 9
Paper mulberry 1.0 0.9 3
Chinese privet 0.4 0.5 8
Tallowtree 0.1 0.1 4
Japanese privet 0.1 0.2 2
Chinese pistache 0.1 0.1 2
White mulberry <0.1 0.1 1
Mimosa <0.1 0.1 1
a Species is listed on Texas invasive species list (Watershed Protection Development Review, n.d.)
Table 5.—Tree species that are classi�ed as invasivea and were observed in the inventory, Austin, 2014
Figure 15.—Proportion of invasive trees as a percent of all trees, by plot,
Austin, 2014.
Invasives(percent)
01-1011-3031-60> 60
Tree(s) presentNo trees present
21
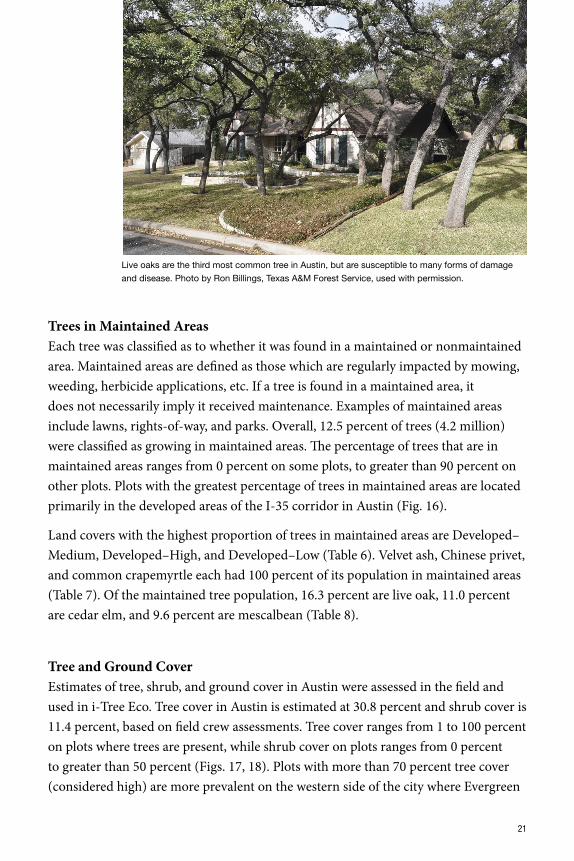
Trees in Maintained AreasEach tree was classi�ed as to whether it was found in a maintained or nonmaintained area. Maintained areas are de�ned as those which are regularly impacted by mowing, weeding, herbicide applications, etc. If a tree is found in a maintained area, it does not necessarily imply it received maintenance. Examples of maintained areas include lawns, rights-of-way, and parks. Overall, 12.5 percent of trees (4.2 million) were classi�ed as growing in maintained areas. �e percentage of trees that are in maintained areas ranges from 0 percent on some plots, to greater than 90 percent on other plots. Plots with the greatest percentage of trees in maintained areas are located primarily in the developed areas of the I-35 corridor in Austin (Fig. 16).
Land covers with the highest proportion of trees in maintained areas are Developed–Medium, Developed–High, and Developed–Low (Table 6). Velvet ash, Chinese privet, and common crapemyrtle each had 100 percent of its population in maintained areas (Table 7). Of the maintained tree population, 16.3 percent are live oak, 11.0 percent are cedar elm, and 9.6 percent are mescalbean (Table 8).
Tree and Ground CoverEstimates of tree, shrub, and ground cover in Austin were assessed in the �eld and used in i-Tree Eco. Tree cover in Austin is estimated at 30.8 percent and shrub cover is 11.4 percent, based on �eld crew assessments. Tree cover ranges from 1 to 100 percent on plots where trees are present, while shrub cover on plots ranges from 0 percent to greater than 50 percent (Figs. 17, 18). Plots with more than 70 percent tree cover (considered high) are more prevalent on the western side of the city where Evergreen
Live oaks are the third most common tree in Austin, but are susceptible to many forms of damage
and disease. Photo by Ron Billings, Texas A&M Forest Service, used with permission.

22
Figure 16.—Percentage of trees on maintained area, by plot, Austin, 2014.
Trees on Maintained Land(percent)
01-1011-3031-90> 90
Tree(s) presentNo trees present
Land cover Trees
percent
Developed–Medium 94.8
Developed–High 90.1
Developed–Low 85.0
Developed–Open 26.9
Shrub/Herbaceous 6.8
Evergreen Forest 0.4
Deciduous/Mixed Forest 0.3
Water/Barren 0.0
Total 12.5
Table 6.—Percent of trees in maintained areas by land cover, Austin, 2014
Species Trees Species Trees
percent percent
Velvet ash 100.0 Live oak 24.2
Chinese privet 100.0 Sugarberry 18.7
Common crapemyrtle 100.0 Buckley oak 15.8
Mexican ash 90.1 Cedar elm 10.2
Pecan 80.4 Texas ash 7.8
Mescalbean 62.9 Northern hackberry 5.7
American sycamore 58.4 Glossy privet 4.4
Chinaberry 51.0 Ashe juniper 0.7
Yaupon 28.4
Table 7.—Percentage of trees in maintained areas (minimum sample size = 10 trees) by species, Austin, 2014. For
example, 100 percent of velvet ash trees are in maintained areas.

23
Species Trees Species Trees Species Trees
percent percent percent
Live oak 16 .3 American sycamore 1 .8 Black walnut 0 .2
Cedar elm 11 .0 Buckley oak 1 .6 Bur oak 0 .2
Mescalbean 9 .6 Velvet ash 1 .4 Goldenrain tree 0 .2
Sugarberry 9 .1 Shumard oak 1 .0 Southern magnolia 0 .2
Loquat tree 7 .4 Texas ash 0 .8 Eastern cottonwood 0 .1
Chinaberry 6 .5 Glossy privet 0 .6 Eastern redbud 0 .1
Yaupon 5 .6 Common fig 0 .5 Gum bully 0 .1
Common crapemyrtle 4 .1 Chinese pistache 0 .4 Mimosa 0 .1
Mexican ash 3 .9 Japanese privet 0 .4 Texas red oak 0 .1
Pecan 3 .7 Baldcypress 0 .3 American elm 0 .1
Chinese privet 2 .9 Slippery elm 0 .3 Florida thatchpalm 0 .1
Ashe juniper 2 .1 Chinkapin oak 0 .3 Plum spp 0 .1
Netleaf white oak 2 .0 Tallowtree 0 .3 Water oak 0 .1
Chinese elm 1 .8 Northern hackberry 0 .2
Common cherry laurel 1 .8 Post oak 0 .2
Table 8.—Species composition in maintained areas, Austin, 2014. For example, 16.3 percent of trees in maintained
areas are live oak.
and Deciduous/Mixed Forest land covers are common. Shrub cover shows no apparent land cover patterns in Austin (Fig. 18), which may indicate that understory species occur with equal likelihood in both maintained and nonmaintained areas.
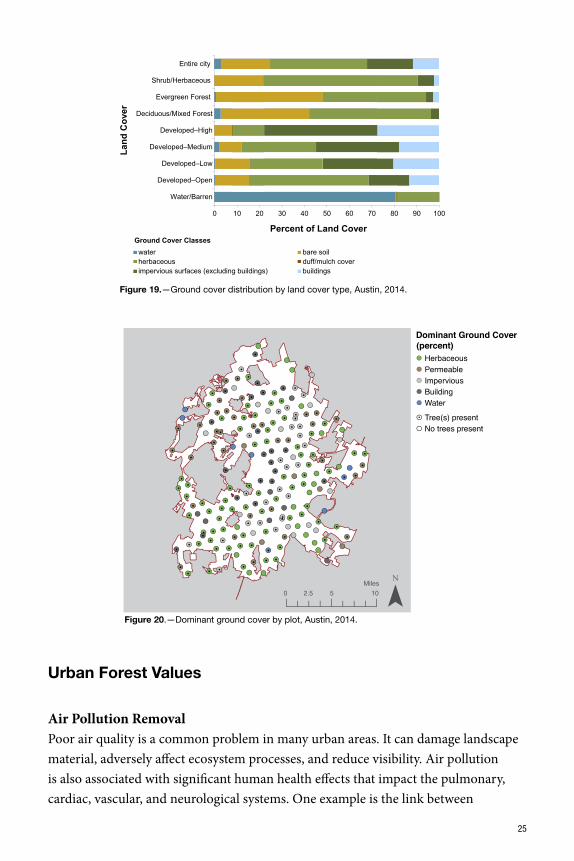
Ground cover in Austin was also estimated by field crews; ground cover categories include all manmade and natural cover types within the plots, including cover beneath trees and shrubs. Herbaceous cover (grass and other nonwoody plants) accounts for 43.2 percent of all ground cover (Fig. 19). Herbaceous cover is the most common ground cover type in the following land cover areas: Shrub/Herbaceous, Deciduous/Mixed Forest, Developed–Open, Evergreen Forest, and Developed–Low land covers. Medium and Developed–High land covers were dominated by impervious surfaces excluding buildings, while areas of the Water/Barren land cover were dominated by water.
The dominant ground cover type varies across the 206 plots in Austin (Fig. 20). Herbaceous ground cover is dominant on the greatest number of plots, while water is the dominant ground cover on the fewest plots. Of the plots with no trees present, herbaceous cover is the most common dominant ground cover occurring on 19 plots. Impervious ground cover was the second most common, occurring on 16 plots.

24
Tree Cover(percent)
01-1516-4041-70> 70
Tree(s) presentNo trees present
Figure 17.—Percentage of tree cover by plot, Austin, 2014.
Figure 18.—Percentage shrub cover by plot, Austin, 2014.
Shrub Cover(percent)
01-1011-2526-50> 50
Tree(s) presentNo trees present
25
Urban Forest Values
Air Pollution RemovalPoor air quality is a common problem in many urban areas. It can damage landscape material, adversely a�ect ecosystem processes, and reduce visibility. Air pollution is also associated with signi�cant human health e�ects that impact the pulmonary, cardiac, vascular, and neurological systems. One example is the link between
Figure 19.—Ground cover distribution by land cover type, Austin, 2014.
0 10 20 30 40 50 60 70 80 90 100
Entire city
Shrub/Herbaceous
Evergreen Forest
Deciduous/Mixed Forest
Developed–High
Developed–Medium
Developed–Low
Developed–Open
Water/Barren
Percent of Land Cover
Land
Cov
er
water bare soilherbaceous duff/mulch coverimpervious surfaces (excluding buildings) buildings
Ground Cover Classes
Figure 20.—Dominant ground cover by plot, Austin, 2014.
Dominant Ground Cover(percent)
HerbaceousPermeableImperviousBuildingWater
Tree(s) presentNo trees present

26
particulate matter exposure and cardiopulmonary and lung cancer mortality (Pope et al. 2012). �e urban forest can help improve air quality by directly removing pollutants from the air and reducing energy consumption in buildings, which consequently reduces air pollutant emissions from power plants and other sources. While trees emit volatile organic compounds (VOCs) that can contribute to ozone formation, integrative studies have revealed that an increase in tree cover leads to reduced ozone formation (Nowak and Dwyer 2000).
Pollution removal by trees in Austin was estimated using i-Tree Eco in conjunction with �eld data and hourly pollution and weather data for the year 2013. Pollution removal was greatest for O3 (1,120 tons removed per year), followed by NO2 (86 tons/year), PM2.5 (24 tons/year), and SO2 (23 tons/year) (Fig. 21). �e value associated with pollution removal was greatest for O3 ($1.6 million), followed by PM2.5 ($1.2 million), NO2 ($26,000), and SO2 ($2,000). It is estimated that trees alone remove 1,253 tons of air pollution (NO2, O3, PM2.5, and SO2) per year with an associated value of $2.8 million.
Decreases in pollution concentration due to its removal by trees also have a positive e�ect on human health in Austin. �e economic value of pollution removal is based on the number of cases per year of avoided health e�ects (Nowak et al. 2014, U.S. Environmental Protection Agency 2012). For example, in 2014, reductions in NO2 concentration were estimated to result in 13 fewer cases of acute respiratory symptoms with an associated value of $410 (Table 9).
Figure 21.—Annual air pollution removal and value by urban trees, Austin, 2014.
Fig21
Page 9
0.0
0.2
0.4
0.6
0.8
1.0
1.2
1.4
1.6
1.8
0.0
0.2
0.4
0.6
0.8
1.0
1.2
NO O PM SO
Value (million dollars/year)
Pollu
tion
Rem
oved
(1,0
00 to
ns/y
ear)
Pollutant
Pollution removed
Value
2 3 2 2.5

27
In 2014, trees in Austin emitted an estimated 5,910 tons of VOCs (5,320 tons of isoprene and 590 tons of monoterpenes). Emissions vary among species based on species characteristics (e.g., some genera such as oaks are high isoprene emitters) and leaf biomass. Ninety-six percent of the urban forest’s VOC emissions were from oak and juniper genera (Fig. 22). �ese VOCs are precursor chemicals to ozone formation.4 General recommendations for improving air quality with trees are given in appendix 7.
Health Effect NO2 SO2 O3 PM2.5
$/year
number of cases/
year
$/year
number of cases/
year
$/year
number of cases/
year
$/year
number of cases/
year
Acute bronchitis n/a n/a n/a n/a n/a n/a 10 0.14
Acute myocardial infarction
n/a n/a n/a n/a n/a n/a 3,190 0.04
Acute respiratory symptoms
410 12.83 40 1.10 57,070 667.60 9,370 95.57
Asthma exacerbation
15,880 190.22 840 10.66 n/a n/a 5,050 62.09
Chronic bronchitis
n/a n/a n/a n/a n/a n/a 18,510 0.07
Emergency room visits
90 0.21 20 0.05 130 0.32 40 0.10
Hospital admissions
9,240 0.31 1,070 0.04 13,130 0.43 n/a n/a
Hospital admissions, cardiovascular
n/a n/a n/a n/a n/a n/a 730 0.02
Hospital admissions, respiratory
n/a n/a n/a n/a n/a n/a 400 0.01
Lower respiratory symptoms
n/a n/a n/a n/a n/a n/a 100 1.83
Mortality n/a n/a n/a n/a 1,470,950 0.19 1,145,420 0.15
School loss days n/a n/a n/a n/a 21,300 216.95 n/a n/a
Upper respiratory symptoms
n/a n/a n/a n/a n/a n/a 60 1.34
Work loss days n/a n/a n/a n/a n/a n/a 2,810 16.32
Total value 25,610 n/a 1,970 n/a 1,562,580 n/a 1,185,680 0.14
n/a indicates that the value is not estimated for that pollutant and health effect. The same health effects were not analyzed for each pollutant.
Table 9.—Associated value ($/year) and incidence (number of cases/year) of avoided health effects from changes in
pollution concentrations due to pollution removal by trees, Austin, 2014
4 Some economic studies have estimated VOC emission costs. These costs are not included here as there is a tendency to add positive dollar estimates of ozone removal effects with negative dollar values of VOC emission effects to determine whether tree effects are positive or negative in relation to ozone. This combining of dollar values to determine tree effects should not be done, rather estimates of VOC effects on ozone formation (e.g., via photochemical models) should be conducted and directly contrasted with ozone removal by trees (i.e., ozone effects should be directly compared, not dollar estimates). In addition, air temperature reductions by trees have been shown to signi�cantly reduce ozone concentrations (Cardelino and Chameides 1990, Nowak et al. 2000), but are not considered in this analysis. Photochemical modeling that integrates tree effects on air temperature, pollution removal, VOC emissions, and emissions from power plants can be used to determine the overall effect of trees on ozone concentrations.

28
Avoided Runo� Surface water runo� (commonly referred to as surface runo�) can be a cause for concern in many urban areas as it can contribute pollution to streams, wetlands, rivers, lakes, and oceans. During precipitation events, some portion of the precipitation is intercepted by vegetation (trees and shrubs) while the other portion reaches the ground. �e portion of the precipitation that reaches the ground and does not in�ltrate into the soil or end up in depression storage becomes surface runo� (Hirabayashi 2012). In urban areas, the large extent of impervious surfaces increases the amount of surface runo�.
Urban trees, however, are bene�cial in reducing surface runo�. Trees intercept precipitation while their root systems promote in�ltration and water storage in the soil. Although trees have other impacts on local hydrology, i-Tree Eco estimates avoided runo� as a function of the annual precipitation interception by trees. �e trees of Austin help to reduce runo� by an estimated 65 million cubic feet a year. Tree species with the greatest overall impact on runo� are Ashe juniper, live oak, and cedar elm (Fig. 23).
Carbon Storage and Sequestration Climate change is an issue of global concern that threatens to impact species existence, vulnerable ecosystems such as coral reefs and polar and coastal areas, food production, water resources, and existing human health problems (Intergovernmental Panel on Climate Change 2014). �e city’s trees can help mitigate climate change by sequestering atmospheric carbon (from carbon dioxide [CO2]) in tissue and by
0.0 1.0 2.0 3.0 4.0 5.0 6.0
Walnut
Hackberry
Broussonetia
Maple
Hickory
Soapberry
Sycamore
Cottonwood
Juniper
Oak
VOCs Emitted (1,000 tons)
Tre
e G
ener
a
Isoprene
Monoterpene
VOCs Emitted
Figure 22.—Annual volatile organic compounds (VOCs) emitted by tree genera with
greatest emissions, Austin, 2014.

29
reducing the amount of energy used to heat or cool buildings, thus reducing CO2 emissions from fossil-fuel based power sources (Abdollahi et al. 2000).
Carbon storage is one way trees can in�uence global climate change. As a tree grows, it stores more carbon by holding it in its accumulated tissue. As a tree dies and decays, it releases much of the stored carbon back into the atmosphere. �us, carbon storage is an indication of the amount of carbon that can be released if trees are allowed to die and decompose. Although tree maintenance practices (e.g., pruning) can contribute to carbon emissions, maintaining healthy trees helps to maximize the amount of carbon stored in trees (Nowak et al. 2002c). Using the wood contained in dead trees for wood products is one way to help forestall carbon emissions due to wood decomposition. Wood from dead trees can also be used to produce energy (e.g., heat buildings) in which case carbon stored in the tree will still be released. However, using wood for energy production replaces energy production from fossil-fuel-based power sources, thus reducing carbon emissions by preventing emissions from both decomposition and fossil-fuel-based power sources. Trees in Austin store an estimated 1.9 million tons of carbon (7.0 million tons of carbon dioxide); such storage is valued at $242 million.
Average carbon storage is highly variable, ranging from 0.2 to 77.3 tons per acre based on plots where trees are present (Fig. 24). Plots with lower average carbon storage are distributed mostly in the developed areas of the I-35 corridor in Austin. Plots with greater average carbon storage generally have a large number of trees per acre, consist of large diameter trees, or have a combination of these two characteristics.
0
5
10
15
20
25
30
Avo
ided
Run
off (
1 m
illio
n ft3 /y
ear)
Species
Figure 23.—Avoided runoff for species with greatest overall impact on runoff, Austin, 2014.
Avoided runoff by species is proportional to leaf area as runoff reduction is estimated on a
city-wide basis.

30
In addition to carbon storage, trees reduce the amount of carbon in the atmosphere by sequestering carbon in new tissue growth. �e amount of carbon annually sequestered is increased with healthier and larger diameter trees. Gross sequestration by urban trees in Austin is about 92,000 tons of carbon per year (336,000 tons per year of CO2) with an associated value of $11.6 million per year. Net carbon sequestration in Austin is estimated at about 67,000 tons per year (246,000 tons per year of CO2) by subtracting estimated carbon loss due to tree mortality and decomposition from gross sequestration.
Of all the species sampled, Ashe juniper stores the most carbon, estimated at 30.7 percent of total estimated carbon stored, and annually sequesters the most carbon— estimated at 25.2 percent of all sequestered carbon (Figs. 25, 26). Trees 12 to 15 inches in diameter store the most carbon in the city, while trees greater than 30 inches in diameter store the most carbon on a per tree basis (Figs. 27, 28).
Energy ConsumptionTrees a�ect energy consumption by shading buildings, providing evaporative cooling, and blocking winter winds. Trees tend to reduce building energy consumption in the summer months and can either increase or decrease building energy use in the winter months, depending on the location of trees around the building. Estimates of tree e�ects on energy use are based on �eld measurements of tree distance and direction to space-conditioned residential buildings (McPherson and Simpson 1999).
Figure 24.—Average carbon storage per acre by plot, Austin, 2014.
Carbon Storage(tons/acre)
01-1011-2021-40> 40
Tree(s) presentNo trees present

31
Figure 25.—Estimated annual carbon storage and value for urban tree species with
the greatest storage, Austin, 2014.
0
10
20
30
40
50
60
70
80
0
100
200
300
400
500
600
700
Ashe j
unipe
r
Live o
ak
Cedar
elm
Sugarb
erry
Pecan
Buckle
y oak
Honey
mes
quite
Green a
sh
Texas
red o
ak
Easter
n cott
onwoo
d
Value ($1 million)
Stor
age
(1,0
00 to
ns)
Carbon storageValue
Figure 26.—Estimated annual carbon sequestration and value for urban tree species
with the greatest sequestration, Austin, 2014.
Fig26
0.0
0.5
1.0
1.5
2.0
2.5
3.0
0
5
10
15
20
25
Value (million dollars/year)
Sequ
estr
atio
n (1
,000
tons
/yea
r)
Carbon sequestrationValue
Ashe j
unipe
r
Live o
ak
Cedar
elm
Sugarb
erry
Pecan
Buckle
y oak
Honey
mes
quite
Green a
sh
Chinab
erry
Chines
e priv
et

32
Figure 27.—Estimated total carbon storage and sequestration by tree diameter class, Austin, 2014. Diameter classes are designated by their midpoint (e.g., 2 is actually 1 to 2.9 inches). Diameter measurements were taken at breast height (d.b.h.) or root collar (d.r.c.) for woodland species.
0
2
4
6
8
10
12
14
0
50
100
150
200
250
2 4 6 8 10 12 14 16 18 20 22 24 26 28 30+
Carbon Sequestration (1,000 tons/year)
Car
bon
Stor
age
(1,0
00 to
ns)
Diameter Class (inches)
Carbon storageCarbon sequestration
Figure 28.—Estimated average per tree carbon storage and sequestration by tree diameter class, Austin, 2014. Diameter classes are designated by their midpoint (e.g. 2 is actually 1 to 2.9 inches). Diameter measurements were taken at breast height (d.b.h.) or root collar (d.r.c.) for woodland species.
0
10
20
30
40
50
60
70
80
90
0
1
2
3
4
5
6
7
2 4 6 8 10 12 14 16 18 20 22 24 26 28 30+
Average C
arbon Sequestration (lbs/year)
Ave
rage
Car
bon
Stor
age
(1,0
00 lb
s)
Diameter Class (inches) Carbon storageCarbon sequestration
In Austin, interactions between trees and buildings are projected to annually increase energy requirements by 273,000 million British �ermal Units (MBTUs) and 9,000 megawatt-hours (MWHs) during the heating season (Table 10). Based on average energy costs in 2012 (U.S. Energy Information Administration 2012a, 2012b, 2014b, 2014c), this projected increase in energy requirements is associated with an increase in energy costs of $4.0 million per year (Table 11). �e increased energy requirements seen during the winter is likely because trees modify climate, produce shade, and

33
reduce wind speeds. When this occurs in the winter, a tree (particularly evergreen species) located on the southern side of a residential building may produce a shading effect that causes increases in heating requirements. During the cooling season, energy requirements are projected to decrease by an estimated 205,000 MWHs with an associated value of $22.9 million per year. The net effect of trees on residential energy costs is a decrease of $18.9 million annually. Trees also provide an additional $4.9 million in value per year by reducing the amount of carbon released by fossil-fuel-based power sources (Table 11). This is a reduction of 39,000 tons of carbon emissions (Table 10) which is the equivalent of 142,000 tons of CO2.
Structural and Functional ValuesThe city’s forest has a structural value based on the tree itself that includes compensatory value and carbon storage value. The compensatory value is an estimate of the value of the forest as a structural asset (e.g., how much should one be compensated for the loss of the physical structure of the tree). The compensatory value (Nowak et al. 2002a) of the trees in Austin is about $16.0 billion (Fig. 29). For small trees, a replacement cost can be used; for larger trees, several estimation
Heating Cooling Total
MBTUb (273,000) n/a (273,000)
MWHc (9,000) 205,000 196,000
Carbon avoided (tons)d (6,000) 45,000 39,000
a Negative values indicate an increase in energy requirements
b MBTU–Million British Thermal Units (not used for cooling)
c MWH–Megawatt-hour
d To convert carbon estimates to CO 2, multiply carbon value by 3 .667
Table 10.—Annual energy savingsa (MBTU, MWH, or tons) due to trees near residential buildings, Austin, 2014
Heating Cooling Total
U.S. dollars
MBTUc ($) (2,948,000) n/a (2,948,000)
MWHd ($) (1,056,000) 22,901,000 21,845,000
Carbon avoided ($) (786,000) 5,692,000 4,906,000
a Based on 2012 statewide energy costs (U .S . Energy Information Administration 2012a, 2012b, 2014b, 2014c) and 2013 social cost of carbon (Interagency Working Group 2013)
b Negative values indicate an increase in energy requirements
c MBTU–Million British Thermal Units (not used for cooling)
d MWH–Megawatt-hour
Table 11.—Annual monetary savingsa,b in residential energy expenditures during heating and cooling seasons, Austin,
2014

34
procedures are used (Nowak et al. 2002a). �e structural value of the forest resource tends to increase with an increase in the number and size of healthy trees. Note that some invasive tree species are listed with a high compensatory value (Fig. 29) because the methods used to estimate compensatory value do not account for management preferences (e.g., noninvasive species). Additionally, despite their status as an invasive, these species still contribute ecosystem services.
Compensatory value varies across the plots in Austin (Fig. 30). It is a function of the number and condition of trees, types of species, diameter of trees, and land use found on each plot. �e greatest compensatory values per acre are located mostly on plots in northwestern Austin. In this area, Evergreen and Deciduous/Mixed Forest lands are common and many of the plots have high tree densities. Forests also have functional values (either positive or negative) based on the functions the trees perform, including sequestering carbon, removing air pollutants, and reducing the amount of energy used to heat or cool buildings. Annual functional values also tend to increase with increased number and size of healthy trees and are usually on the order of several million dollars per year. �ere are many other functional values of the forest, though they are not quanti�ed here (e.g., reduction in ultraviolet radiation, aesthetics, and wildlife habitat). �us the functional estimates provided in this report represent only a portion of the total forest functional values. �rough proper management, urban forest values can be increased. However, the values and bene�ts can also decrease as the amount of healthy tree cover declines. �ere are also various monetary costs associated with urban forest management, such as tree pruning, inspection, removal and disposal, which are not accounted for in this assessment (McPherson et al. 2005).
Figure 29.—Tree species with the greatest collective compensatory value,
Austin, 2014.
0
1
2
3
4
5
6
7
Com
pens
ator
y Va
lue
(bili
ons
of d
olla
rs)

35
Urban trees in Austin have the following structural values:
• Compensatory value: $16.0 billion
• Carbon storage: $242 million
Urban trees in Austin have the following annual functional values:
• Carbon sequestration: $11.6 million
• Pollution removal: $2.8 million
• Reduced energy costs: $18.9 million
Urban Forest HealthA healthy urban forest will provide greater bene�ts to society than an unhealthy one. �is report highlights tree damage variables, crown measurements, and mortality as indicators of urban forest health in Austin.
Urban FIA protocols were used to collect data for seven damage variables on trees in the urban plots: trunk bark inclusion, root/stem girdling, con�ict with overhead wires, topping/pruning, sidewalk/root con�ict, excessive mulch, and improper planting. For a detailed description and images of these variables, see U.S. Forest Service 2014a. �e presence or absence of these damage variables, along with the
Figure 30.—Average compensatory value per acre by plot, Austin, 2014.
Compensatory Value(dollars/acre)
01-75,00075,001-180,000180,001-340,000> 340,000
Tree(s) presentNo trees present

36
location of the damage, was recorded for all trees at least 1 inch diameter. Damage at the root level or tree bole can potentially be more significant in terms of tree health as compared to damages in branches or upper bole. The severity of the damage was also recorded. Field crews recorded the presence or absence of these damage variables for each tree, with inspections starting at the roots and bole and progressing up to the crown (U.S. Forest Service 2014a).
In addition to damage variables, field crews collected crown data for all trees at least 1 inch in diameter (see U.S. Forest Service 2014a for details). Crown measurements evaluate the growth and vigor of the crown of each tree and include width, height, percent missing, and dieback. Crown dieback, specifically, is demonstrative of tree health (Steinman 1998) and is defined as recent mortality of small branches and twigs in the upper and outer portion of the trees’ crown.
Tree mortality is an extension of the crown dieback measurements. Trees with 100 percent crown dieback are considered to be standing dead and can be an indication of a specific problem, such as a pest or disease, within the urban forest. Based on urban FIA protocols, all trees greater than 1 inch diameter that were standing dead were recorded as such.
Damage Indicators of Tree HealthTrunk bark inclusions are the most common damage and occurred on 6.1 percent of the trees in Austin. Trunk bark inclusions are places where branches are not strongly attached to the tree. A weak union occurs when two or more branches grow so closely together that bark grows between the branches and inside the union. This ingrown, or included, bark does not have the structural strength of wood and the union can become very weak. The inside bark may also act as a wedge and force the branch union to split apart. The land cover with the greatest proportion of trees with trunk bark inclusions is Developed–Medium (Table 12). Poor pruning practices can result in the formation of included trunk bark. Species with the highest percent of its population with trunk bark inclusions were velvet ash and common crapemyrtle (Table 13).
Stem girdling is the second most common damage and occurred on 0.5 percent of the trees in Austin. Stem girdling is a common issue among urban trees where the roots of a tree begin to grow around the main stem of the tree. When this occurs, the flow of water and nutrients is restricted. In Developed–Low areas, stem girdling is found on 8.1 percent of the trees (Table 12). Sugarberry and live oak are the only species for which a minimum sample size of 10 was met and that exhibited this damage (Table 13).

37
Damage classEvergreen
forestDeciduous/
mixed forest
Developed Shrub/ Herb
Water/ Barren
TotalOpen Low Medium High
percent
Trunk bark inclusion 2 .5 4 .7 13 .9 15 .3 23 .5 7 .9 3 .1 22 .5 6 .1
Root/stem girdling 0 .0 0 .0 0 .0 8 .1 0 .7 2 .0 0 .0 0 .0 0 .5
Overhead wires 0 .1 0 .0 1 .8 1 .2 2 .0 4 .0 0 .0 0 .0 0 .5
Topping/pruning < 0 .1 0 .0 0 .9 1 .2 5 .9 7 .9 0 .0 0 .0 0 .4
Sidewalk-root conflict 0 .0 0 .0 1 .1 0 .3 3 .3 17 .8 0 .0 0 .0 0 .4
Excess mulch 0 .0 0 .1 0 .2 0 .6 2 .6 2 .0 0 .0 0 .0 0 .2
Improper planting 0 .0 0 .0 0 .5 0 .3 0 .7 5 .9 0 .0 0 .0 0 .1
Table 12.—Percentage of trees with various types of damage by land cover, Austin, 2014. For example, 22.5 percent of
trees in the Water/Barren land cover had trunk bark inclusion.
Damage type and species Class Damage type and species Class
percent percent
Trunk bark inclusion Sidewalk-root conflict
Velvet ash 68 .2 Velvet ash 55 .7
Common crapemyrtle 52 .7 American sycamore 20 .8
Pecan 38 .6 Mexican ash 13 .9
Mexican ash 34 .2 Pecan 2 .3
Paper mulberry 27 .6 Sugarberry 0 .7
Root/stem girdlinga Excess mulch
Sugarberry 4 .1 Mexican ash 13 .9
Live oak 0 .2 Pecan 6 .4
Overhead wires Common crapemyrtle 5 .3
Pecan 9 .5 Live oak 0 .2
American sycamore 6 .9 Cedar elm 0 .1
Common crapemyrtle 5 .3 Improper planting
Northern hackberry 2 .8 Velvet ash 23 .2
Glossy privet 2 .2 Chinese privet 5 .0
Topping/pruning Pecan 4 .7
Velvet ash 23 .9 American sycamore 3 .5
Chinese privet 15 .5 Live oak 0 .6
Mexican ash 13 .9
American sycamore 6 .9
Northern hackberry 2 .8
Note: Only species with minimum sample size of 10 trees are included in this analysis to minimize effect of small sample size on percentage estimates . All species values are given in appendix 8 .
a There were not five species having the specific damage type of root/stem girdling with a minimum sample size of 10 trees
Table 13.—Species with greatest proportion of their population with damage, by damage type, Austin, 2014. For
example, 68.2 percent of velvet ash had trunk bark inclusion.

38
Overhead wires are the third most common damage. In 0.5 percent of the trees in Austin, �eld crews observed tree crown con�icts with utility wires. A con�ict occurs when utility wires are within 5 feet of the tree crown and is common for street trees or trees located in residential or developed areas. �e land cover with the greatest proportion of trees with crown con�icts is Developed–High (Table 12). Pecan, American sycamore, and common crapemyrtle trees have the highest proportion of their population with tree crown con�icts with utility wires (Table 13).
Crown Indicators of Tree HealthMeasurement of tree crowns can be used as an indicator of tree health. Large dense crowns are o�en indicative of vigorously growing trees, while small, sparsely foliated crowns signal trees with little or no growth and possibly in a state of decline. One measurement of crown health used to estimate tree condition is dieback.
Trees with more than 25 percent crown dieback may be in decline for both hardwoods and conifers (Steinman 1998). Based on the live tree population with at least 10 trees in the sample, species with the highest percent crown dieback are honey mesquite and chinaberry (Table 14). Higher levels of dieback may indicate a potential insect, disease, or environmental problem associated with this species and further evaluation is warranted.
Species Sample Dieback
number percent
Honey mesquite 72 26.9
Chinaberry 14 21.7
Northern hackberry 16 15.2
Green ash 56 12.8
Ashe juniper 1,090 11.4
Paper mulberry 22 11.0
Mexican ash 14 10.1
Texas persimmon 33 9.0
Live oak 345 8.5
Buckley oak 68 7.3
Table 14.—Species with greatest average dieback (minimum sample size = 10 trees), Austin, 2014
The presence of overhead wires is considered a ‘damage’
for urban trees in Austin and other cities. Photo by Chris
Edgar, Texas A&M Forest Service, used with permission.

39
Dead Tree Density(trees/acre)
01-1011-4041-80> 80
Tree(s) presentNo trees present
Figure 31.—Number of standing dead trees per acre by plot, Austin, 2014.
Tree MortalityFour percent of the total urban tree population is standing dead. Plots with the lowest dead tree density are located in the urbanized (and maintained) areas along the I-35 corridor (Fig. 31). �e species with the highest percentage of its total urban population in standing dead trees are eastern redcedar, American elm, tallowtree, northern hackberry, and honey mesquite (Table 15).
Table 15.—Species with the largest proportion of its population classi�ed as dead, Austin, 2014
Species Total population Dead
number percent
Eastern red cedar 38,000 62.5
American elm 72,000 48.9
Tallowtree 28,000 16.4
Northern hackberry 162,000 13.9
Honey mesquite 655,000 13.1
Ashe juniper 13,300,000 6.8
Black walnut 105,000 6.1
Green ash 751,000 4.4
Buckley oak 419,000 4.0
Live oak 2,859,000 3.7

40
Higher proportions of standing dead trees may indicate potential insect, disease, or environmental problems associated with a specific species. Further evaluation and monitoring of these species is warranted. A high percentage of dead trees does not necessarily indicate a health problem with the species, but could be due to the fact that some trees will naturally remain standing as dead trees for longer periods, or that they might be left standing dead depending upon the land cover, risk associated with dead trees, and maintenance activities related to their removal. Thus, some species may have a higher proportion of dead trees as they are in locations where they are not immediately removed and therefore have a higher probability of being sampled as dead. Long-term monitoring of plots can help determine actual species mortality rates. Land covers with the highest proportion of trees sampled as dead trees are Evergreen Forest, Shrub/Herbaceous, and Deciduous/Mixed forest (Table 16).
MANAGEMENT IMPLICATIONS The urban forest of Austin and its associated benefits vary across the city and inevitably will change over time. An important aspect of managing the urban forest for current and future residents is to understand how to sustain the benefits for all city residents. Here we report urban forest benefits and provide a baseline by which to start making decisions about management. Future monitoring is important as long-term urban forest plot data can be used to more accurately assess changes in species composition, size class distribution, and environmental benefits, in addition to assessing tree growth and mortality (Nowak et al. 2004, 2013b).
Urban forest managers must consider prioritizing areas to protect or enhance the existing tree cover. The accepted paradigm is the “right tree in the right place” so
Table 16.—Percentage of tree population classified as dead by land cover, Austin, 2014
Land cover Dead
percent
Evergreen Forest 5 .6
Shrub/Herbaceous 3 .7
Deciduous/Mixed Forest 3 .4
Developed–Medium 2 .0
Developed–Open 1 .2
Developed–Low 0 .3
Water/Barren 0 .0
Developed–High 0 .0

41
that the trees can provide desired services and survive with minimal maintenance. While current tree cover for all of Austin is estimated at 30.8 percent, it ranges from 7.1 percent in the Developed–High land areas to 74.0 percent in the Evergreen Forest lands. This tree-cover variability corresponds to variability in urban forest benefits across the city.
Additional issues to consider in urban forest management are the forces that can cause species changes and alterations to the structure and composition of the urban forest over time and thus the provision of environmental benefits. Natural forces that could play a role in shaping the future urban forest include the current tree size distribution, nonnative invasive species, and potential pest infestations. Human activities, such as development and population growth, can have a large impact on the future urban forest as well. Other factors that will influence future forest structure include land cover changes, climate change, changing infrastructure, and natural resource management.
Current Size Distribution and Potential Species ChangesChange in species composition and tree size structure of Austin’s urban forest may have a significant influence on the benefits provided by the urban forest for the next several decades. These changes are likely to require a different approach in forest management strategies that affect species composition. These strategies include pest management, regeneration, and restoration efforts.
The future urban forest will be determined, in part, by the structure and composition of today’s urban forest. Younger trees will grow to larger sizes and older trees will eventually decline and die. Austin has more small trees than large trees (this leads to an inverse J-shaped distribution of diameter structure; see Fig. 12). This pattern is a favorable indication of long-term sustainability of tree cover. The shape of the diameter distribution curve is dependent on many factors such as mortality rates, growth rates, and influx rates (i.e., the number of trees being planted or naturally regenerating each year which is not analyzed in this report).
By comparing the species composition of small trees (less than 5 inches diameter) with that of the large trees (greater than 15 inches diameter), the future urban forest can be predicted. Several of the most common large diameter tree species, particularly pecan, Buckley oak and eastern cottonwood, are underrepresented among the small diameter trees (Fig. 14). This indicates that there may not be enough regeneration and planting of these species to maintain the current species mix in the future. Species

42
that dominate the small diameter class and appear to be regenerating well are Ashe juniper, cedar elm, and sugarberry. Some other species dominating the small diameter class, such as mescalbean and glossy privet, do not attain a large stature at maturity. If these individual small trees are replacing large trees in the urban landscape, this could lead to lower canopy levels and altered size structure.
Nonnative Invasive SpeciesNonnative invasive species are another concern in Austin (Watershed Protection Development Review, n.d.). Invasive tree species account for 1.7 million trees with a leaf area of 448 million square feet. �e invasive species observed in Austin can alter the urban forest composition through time as they spread into the surrounding landscape, potentially displacing native species and altering local ecosystems (Pimentel et al. 2000).
Insect and Disease ImpactsInsects and diseases can infest urban forests, potentially killing trees and reducing the health, value, and sustainability of the urban forest. Various pests have di�erent tree hosts, so the potential damage or risk of each pest will di�er. We evaluated 31 exotic insects/diseases for their potential impact using range maps of the pests in the coterminous United States (U.S. Forest Service 2014b, U.S. Forest Service 2013, Worrall 2007). For a complete list of the 31 exotic insects/diseases, see appendix 9.
In Austin, concerns about insect and disease impacts are compounded by the local climate. During periods of prolonged droughts, trees can become distressed, making them more vulnerable to pest infestations and diseases. Texas has historically
Residential area of Austin with trees (in center) showing symptoms of oak wilt. Photo by
Ron Billings, Texas A&M Forest Service, used with permission.

43
experienced intense droughts, most notably the drought that lasted from 1950 to 1957. In more recent years, the state recorded one of its most extreme 12-month precipitation deficits from October 2010 to September 2011 (Nielsen-Gammon 2011).
Although there are additional pests that could impact Austin’s urban forest, Asian longhorned beetle (ALB), Dutch elm disease (DED), gypsy moth (GM), oak wilt (OW), and emerald ash borer (EAB) pose the most serious threats, each putting more than 1 million trees at risk to infestation (Table 17). At the time of this study (summer and fall 2014), DED and OW were confirmed present in Hays, Travis, and Williamson Counties where Austin is located. Potential loss from DED is 4.8 million trees with an associated compensatory value of $1.6 billion, while OW could impact 4.0 million trees ($4.5 billion compensatory value). EAB, which was detected in southwestern Arkansas in summer 2014 and northwestern Louisiana in February 2015, is located within 250 miles of Hays, Travis, and Williamson Counties. Potential loss of trees from EAB is 1.4 million ($546 million compensatory value). ALB and GM have not been found within 750 miles of Hays, Travis, and Williamson Counties, but the impacts of these two pests could be devastating. Potential loss of trees from ALB is 6.2 million ($2.1 billion in compensatory value) and GM is 4.2 million ($4.5 billion in compensatory value).
Oak wilt has resulted in the loss of thousands of oak trees in Austin over the last few decades. Since 1988, the Oak Wilt Suppression Project, originally organized by the City of Austin’s Parks and Recreation Department, has been working to help educate city residents about the disease and assist in the efforts to locate and treat infected trees and limit susceptibility (Planning and Development Review Department 2015b).
Code
Scientific name
Common name
Trees
at risk
As proportion
of all trees
Compensatory
value
number percent $ millions
ALB Anoplophora glabripennis Asian longhorned beetle 6,214,000 19 .1 2,121
DED Ophiostoma novo-ulmi Dutch elm disease 4,804,000 14 .8 1,583
GM Lymantria dispar gypsy moth 4,170,000 12 .8 4,530
OW Ceratocystis fagacearum oak wilt 4,032,000 12 .4 4,521
EAB Agrilus planipennis emerald ash borer 1,434,000 4 .4 546
TCD Pityophthorus juglandis & Geosmithia spp .
thousand canker disease 105,000 0 .3 50
DA Discula destructive dogwood anthracnose 60,000 0 .2 <1
LAT Choristoneura conflictana large aspen tortrix 60,000 0 .2 4
Table 17.—Potential risk to trees by insect or disease, Austin, 2014
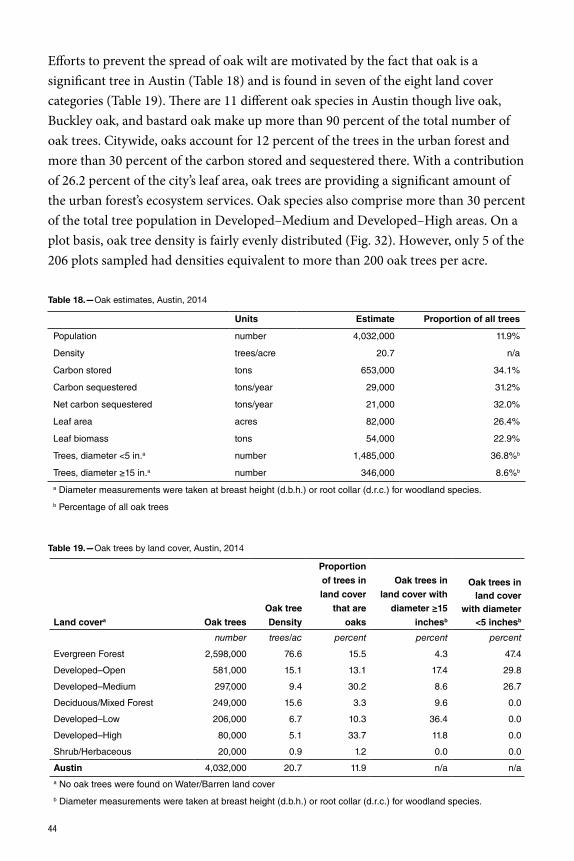
44
Efforts to prevent the spread of oak wilt are motivated by the fact that oak is a significant tree in Austin (Table 18) and is found in seven of the eight land cover categories (Table 19). There are 11 different oak species in Austin though live oak, Buckley oak, and bastard oak make up more than 90 percent of the total number of oak trees. Citywide, oaks account for 12 percent of the trees in the urban forest and more than 30 percent of the carbon stored and sequestered there. With a contribution of 26.2 percent of the city’s leaf area, oak trees are providing a significant amount of the urban forest’s ecosystem services. Oak species also comprise more than 30 percent of the total tree population in Developed–Medium and Developed–High areas. On a plot basis, oak tree density is fairly evenly distributed (Fig. 32). However, only 5 of the 206 plots sampled had densities equivalent to more than 200 oak trees per acre.
Units Estimate Proportion of all trees
Population number 4,032,000 11 .9%
Density trees/acre 20 .7 n/a
Carbon stored tons 653,000 34 .1%
Carbon sequestered tons/year 29,000 31 .2%
Net carbon sequestered tons/year 21,000 32 .0%
Leaf area acres 82,000 26 .4%
Leaf biomass tons 54,000 22 .9%
Trees, diameter <5 in .a number 1,485,000 36 .8%b
Trees, diameter ≥15 in .a number 346,000 8 .6%b
a Diameter measurements were taken at breast height (d .b .h .) or root collar (d .r .c .) for woodland species .
b Percentage of all oak trees
Table 18.—Oak estimates, Austin, 2014
Land covera Oak trees
Oak tree
Density
Proportion
of trees in
land cover
that are
oaks
Oak trees in
land cover with
diameter ≥15
inchesb
Oak trees in land cover
with diameter <5 inchesb
number trees/ac percent percent percent
Evergreen Forest 2,598,000 76 .6 15 .5 4 .3 47 .4
Developed–Open 581,000 15 .1 13 .1 17 .4 29 .8
Developed–Medium 297,000 9 .4 30 .2 8 .6 26 .7
Deciduous/Mixed Forest 249,000 15 .6 3 .3 9 .6 0 .0
Developed–Low 206,000 6 .7 10 .3 36 .4 0 .0
Developed–High 80,000 5 .1 33 .7 11 .8 0 .0
Shrub/Herbaceous 20,000 0 .9 1 .2 0 .0 0 .0
Austin 4,032,000 20 .7 11 .9 n/a n/aa No oak trees were found on Water/Barren land cover
b Diameter measurements were taken at breast height (d .b .h .) or root collar (d .r .c .) for woodland species .
Table 19.—Oak trees by land cover, Austin, 2014

45
Oak Tree Density(trees/acre)
01-3536-100101-200> 200
Tree(s) presentNo trees present
Figure 32.—Number of oak trees per acre by plot, Austin, 2014.
Population GrowthOne anthropogenic force that could shape Austin’s future urban forest is population growth. In 2014, Austin’s population reached 865,500 people, an increase of 9.5 percent from 2010. In fact, Austin has experienced population growth every decade dating back to the 1830s when the city was founded (Planning and Development Review Department 2015a). Population is projected to increase to nearly 1.2 million people by 2030 (Texas Water Development Board 2015). �is trend of continued population growth in Austin can have many implications for the urban forest. Most notably, development of land to support growing housing and economic needs could impact the land cover composition of the city and change local infrastructure.
CONCLUSION
�e Austin urban forest contributes signi�cantly to the environment, the economy, and residents’ well-being. �roughout the city, an estimated 33.8 million trees, representing more than 62 species, provide a canopy cover of 30.8 percent. �at canopy, particularly leaf surface area, provides a wide range of important environmental bene�ts including air pollution removal, reduced carbon emissions,

46
carbon storage and sequestration, reduced energy use for buildings, storm water capture, and many others.
�ere are a number of change forces that will impact Austin’s forest structure, health, and the environmental bene�ts provided to the city’s residents in the future. Some of these forces include insect and disease infestations, invasive trees and other plants, aging and loss of larger trees, expansion of opportunistic species, changes in the management and use of the forest, and human population growth.
�is analysis provides a baseline for future monitoring. While data from this report captures the current urban forest resource and the ecosystem services and values provided by it, future monitoring will be necessary to identify how the forest is changing over time. One-tenth of the plots established in the city of Austin will be remeasured every year as part of the continuing urban FIA program. Future analyses of the city’s forest can be used to determine the role that natural and human forces play in shaping forest structure and composition.
A tree from the urban forest frames the Austin skyline. Photo by Ron
Billings, Texas A&M Forest Service, used with permission.

47
For now, managers can use this data to inform long-term management plans and policies to sustain a healthy urban tree population and ecosystem services for future generations. Planning and management of the urban forest resource can help sustain vital ecosystem services and values for current and future generations in Austin. In the future, change analyses can be used to evaluate the success of urban forest management programs.
More information on trees in Austin can be found at: http://nrs.fs.fed.us/data/urban.
APPENDIXES
�e following appendixes are available online at: http://dx.doi.org/10.2737/NRS-RB-100.
Appendix 1—Urban FIA
Appendix 2—Species Sampled in the Austin Urban Forest
Appendix 3—Land Cover Category Descriptions
Appendix 4—Tree Species Distribution
Appendix 5—Relative Tree E�ects
Appendix 6—Tree Species Statistics
Appendix 7—General Recommendations for Air Quality Improvements
Appendix 8—Damage Type and Maintenance or Site Issue Statistics
Appendix 9—Potential Insect and Disease Impacts

48
LITERATURE CITED
Abdollahi, K.K.; Ning, Z.H.; Appeaning, A., eds. 2000. Global climate change and the urban forest. Baton Rouge, LA: GCRCC and Franklin Press. 77 p.
Baldocchi, D. 1988. A multi-layer model for estimating sulfur dioxide deposition to a deciduous oak forest canopy. Atmospheric Environment. 22: 869-884.
Baldocchi, D.D.; Hicks, B.B.; Camara, P. 1987. A canopy stomatal resistance model for gaseous deposition to vegetated surfaces. Atmospheric Environment. 21: 91-101.
Bechtold, W.A.; Scott, C.T. 2005. �e forest inventory and analysis plot design. In Bechtold, W.A.; Patterson, P.L., eds. �e enhanced Forest Inventory and Analysis program - national sampling design and estimation procedures. Gen. Tech. Rep. SRS-80. Asheville, NC: U.S. Department of Agriculture, Forest Service, Southern Research Station: 27-42.
British Columbia Ministry of Water, Land, and Air Protection. 2005. Residential wood burning emissions in British Columbia. British Columbia. Victoria, BC: British Columbia, Ministry of Water, Land and Air Protection. 45 p. http://www.bcairquality.ca/reports/pdfs/wood_emissions.pdf (accessed Dec. 30, 2015).
Cardelino, C.A.; Chameides, W.L. 1990. Natural hydrocarbons, urbanization, and urban ozone. Journal of Geophysical Research. 95(D9):13,971-13,979.
Council of Tree and Landscape Appraisers. 2000. Guide for plant appraisal. Ninth edition. Champaign, IL: International Society or Arboriculture. 143 p.
Cumming, A.B.; Nowak, D.J.; Twardus, D.B.; Hoehn, R.; Mielke, M.; Rideout, R. 2007. Urban forests of Wisconsin: pilot monitoring project 2002. NA-FR-05-07. Newtown Square, PA: U.S. Department of Agriculture Forest Service, Northeastern Area State and Private Forestry Report. 33 p.
Georgia Forestry Commission. 2009. Biomass energy. Dry Branch, GA: Georgia Forestry Commission. http://www.gfc.state.ga.us/utilization/forest-biomass/research/BiomassEnergyConversions.pdf. 1 p. (accessed January 20, 2016).
Heirigs, P.L.; Delaney, S.S.; Dulla, R.G. 2004. Evaluation of MOBILE models: MOBILE6.1 (PM), MOBILE6.2 (Toxics), and MOBILE6/CNG. Sacramento, CA: National Cooperative Highway Research Program, Transportation Research Board. 123 p. http://onlinepubs.trb.org/onlinepubs/archive/NotesDocs/25-25(7)_FR.pdf (accessed January 19, 2016).

49
Hirabayashi, S. 2012. i-Tree Eco precipitation interception model descriptions. Washington, DC: U.S. Department of Agriculture, Forest Service and Kent, OH: Davey Tree Expert Co. http://www.itreetools.org/eco/resources/iTree_Eco_Precipitation_Interception_Model_Descriptions_V1_2.pdf (accessed March 2015).
Homer, C.G.; Dewitz, J.A.; Yang, L.; Jin, S.; Danielson, P.; Xian, G.; Coulston, J.; Herold, N.D.; Wickham, J.D.; Megown, K. 2015. Completion of the 2011 National Land Cover Database for the conterminous United States-Representing a decade of land cover change information. Photogrammetric Engineering and Remote Sensing. 81(5): 345-354.
i-Tree. 2009. i-Tree Eco manual. Version 4.1.0. Washington, DC: U.S. Departmentof Agriculture, Forest Service and Kent, OH: Davey Tree Expert Co. 113 p. http://www.itreetools.org/resources/manuals/i-Tree%20Eco%20Users%20Manual.pdf(accessed March 2015).
Interagency Working Group on Social Cost of Carbon, United States Government. 2013. Technical support document: technical update of the social cost of carbon for regulatory impact analysis under Executive Order 12866. http://www.whitehouse.gov/sites/default/�les/omb/inforeg/social_cost_of_carbon_for_ria_2013_update.pdf (accessed August 26, 2015).
Intergovernmental Panel on Climate Change. 2014. Climate change 2014 synthesis report. Geneva, Switzerland: World Meteorological Organization and United Nations Environment Programme. 138 p. http://www.ipcc.ch/pdf/assessment-report/ar5/syr/SYR_AR5_LONGERREPORT_Corr2.pdf (accessed March 31, 2015).
Lacan, I.; McBride, J.R. 2008. Pest vulnerability matrix (PVM): A graphic model for assessing the interaction between tree species diversity and susceptibility to insects and diseases. Urban Forestry & Urban Greening. 7: 291-300.
Leonardo Academy. 2011. Leonardo Academy’s guide to calculating emissions including emission factors and energy prices. Madison, WI: Leonardo Academy Inc.
McPherson, E.G.; Simpson, J.R. 1999. Carbon dioxide reduction through urban forestry: guidelines for professional and volunteer tree planters. Gen. Tech. Rep. PSW-171. Albany, CA: U.S. Department of Agriculture, Forest Service, Paci�c Southwest Research Station. 237 p.
McPherson, E.G.; Simpson, J.R.; Peper, P.J.; Maco, S.E.; Xiao, Q. 2005. Municipal forest bene�ts and costs in �ve US cities. Journal of Forestry. 103: 411-416.

50
National Agriculture Library. 2015. Plants. Beltsville, MD: U.S. Department of Agriculture, National Agriculture Library, Invasive Species Information Center. http://www.invasivespeciesinfo.gov/plants/main.shtml (accessed March 2015).
Nielsen-Gammon, J.W. 2011. �e 2011 Texas drought: a brie�ng packet for the Texas Legislature. College Station, TX: Texas A&M University, College of Geosciences, O�ce of the State Climatologist. 43 p. http://climatexas.tamu.edu/�les/osc_pubs/2011_drought.pdf (accessed March 2015).
Nowak, D.J. 1994. Atmospheric carbon dioxide reduction by Chicago’s urban forest. In: McPherson, E.G.; Nowak, D.J.; Rowntree, R.A., eds. Chicago’s urban forest ecosystem: results of the Chicago urban forest climate project. Gen. Tech. Rep. NE-186. Radnor, PA: U.S. Department of Agriculture, Forest Service, Northeastern Forest Experiment Station: 83-94.
Nowak, D.J. 2010. Urban biodiversity and climate change. In: Muller, N.; Werner, P.; Kelcey, J.G., eds. Urban biodiversity and design. Hoboken, NJ: Wiley-Blackwell Publishing: 101-117.
Nowak, D.J.; Civerolo, K.L.; Rao, S.T.; Sistla, S.; Luley, C.J.; Crane, D.E. 2000. A modeling study of the impact of urban trees on ozone. Atmospheric Environment. 34:1601-1613.
Nowak, D.J.; Crane, D.E. 2002. Carbon storage and sequestration by urban trees in the USA. Environmental Pollution. 116(3): 381-389.
Nowak, D.J.; Crane, D.E. 2000. �e Urban forest e�ects (UFORE) model: quantifying urban forest structure and functions. In: Hansen, M.; Burk, T., eds. Integrated tools for natural resources inventories in the 21st century. Proceedings of IUFRO conference. Gen. Tech. Rep. NC-212. St. Paul, MN: U.S. Department of Agriculture, Forest Service, North Central Research Station: 714-720.
Nowak, D.J.; Crane, D.E.; Dwyer, J.F. 2002a. Compensatory value of urban trees in the United States. Journal of Arboriculture. 28(4): 194-199.
Nowak, D.J.; Crane, D.E.; Stevens, J.C.; Ibarra, M. 2002b. Brooklyn’s urban forest. Gen. Tech. Rep. NE-290. Newtown Square, PA: U.S. Department of Agriculture, Forest Service, Northeastern Research Station. 107 p.
Nowak, D.J.; Cumming, A.B.; Twardus, D.B.; Hoehn, R.; Mielke, M. 2007. Monitoring urban forests in Indiana: pilot study 2002, part 2: statewide estimates using the UFORE model. NA-FR-01-07. Newtown Square, PA: U.S. Department of Agriculture Forest Service, Northeastern Area, State and Private Forestry. 13 p.

51
Nowak, D.J.; Cumming, A.B.; Twardus, D.; Hoehn, R.E., III; Oswalt, C.M.; Brandeis, T.J. 2011. Urban forests of Tennessee, 2009. Gen. Tech. Rep. SRS-149. Asheville, NC: U.S. Department of Agriculture Forest Service, Southern Research Station. 52 p.
Nowak D.J.; Dwyer, J.F. 2000. Understanding the bene�ts and costs of urban forest ecosystems. In: Kuser, John E., ed. Handbook of urban and community forestry in the northeast. New York, NY: Kluwer Academics/Plenum: 11-22. http://dx.doi.org/10.1007/978-1-4615-4191-2_2
Nowak, D.J.; Hirabayashi, S.; Bodine, A.; Green�eld, E.J. 2014. Tree and forest e�ects on air quality and human health in the United States. Environmental Pollution. 193: 119-129.
Nowak, D.J.; Hirabayashi, S.; Bodine, A.; Hoehn, R. 2013a. Modeled PM2.5 removal by trees in ten U.S. cities and associated health e�ects. Environmental Pollution. 178: 395-402.
Nowak, D.J.; Hoehn, R.E.; Bodine, A.R.; Green�eld, E.J.; O’Neil-Dunne, J. 2013b. Urban forest structure, ecosystem services and change in Syracuse, NY. Urban Ecosystems.
Nowak, D.J.; Hoehn, R.E.; Crane, D.E.; Stevens, J.C.; Walton, J.T; Bond, J. 2008. A ground-based method of assessing urban forest structure and ecosystem services. Arboriculture and Urban Forestry. 34(6): 347-358.
Nowak, D.J.; Kuroda, M.; Crane, D.E. 2004. Tree mortality rates and tree population projections in Baltimore, Maryland, USA. Urban Forestry & Urban Greening. 2: 139-147. http://dx.doi.org/10.1078/1618-8667-00030
Nowak, D.J.; Stevens, J.C.; Sisinni, S.M.; Luley, C.J. 2002c. E�ects of urban tree management and species selection on atmospheric carbon dioxide. Journal of Arboriculture. 28(3): 113-122.
Pimentel, D.; Lach, L.; Zuniga, R.; Morrison, D. 2000. Environmental and economic costs of nonindigenous species in the United States. BioScience. 50 (1): 53–65. http://dx.doi.org/10.1641/0006-3568(2000)050[0053:eaecon]2.3.co;2
Planning and Development Review Department. 2015a. Demographic data. Austin, TX: City of Austin, Planning and Development Review Department. http://www.austintexas.gov/page/demographic-data (accessed March 2015).
52
Planning and Development Review Department. 2015b. Oak wilt suppression. Austin, TX: City of Austin, Planning and Development Review Department. http://austintexas.gov/page/oak-wilt-suppression (accessed March 2015).
Pope, C.A.; Burnett, R.T.; �un, M.J.; Calle, E.E.; Krewski, D.; Ito, K.; �urston, G.D. 2002. Lung cancer, cardiopulmonary mortality, and long-term exposure to �ne particulate air pollution. Journal of the American Medical Association. 287 (9): 1132e1141. http://dx.doi.org/10.1001/jama.287.9.1132
Reams, G.A.; Smith, W.D.; Hansen, M.H.; Bechtold, W.A.; Roesch, F.A.; Moisen, G.G. 2005. �e forest inventory and analysis sampling frame. In: Bechtold, W.A.; Patterson, P.L., eds. �e enhanced Forest Inventory and Analysis program—national sampling design and estimation procedures. Gen. Tech. Rep. SRS-80. Asheville, NC: U.S. Department of Agriculture, Forest Service, Southern Research Station: 11-26.
Santamour, F.S. 1990. Trees for urban planting: diversity, uniformity, and common sense. In: Proceedings of the seventh conference of the Metropolitan Tree Improvement Alliance (METRIA); 1990 June 11-12; Lisle, IL. Mills River, NC: North Carolina State University Cooperative Extension, Mountain Horticulture Crops Research and Extension Center: 57-65. http://www.ces.ncsu.edu/�etcher/programs/nursery/metria/metria07/ (accessed August 31, 2015).
Steinman, J. 1998. Tracking the health of trees over time on forest health monitoring plots. In: Hansen, M.; Burk, T., eds. Integrating tools for natural resources inventories in the 21st century. Gen. Tech. Rep. NC-212. St. Paul, MN: U.S. Department of Agriculture Forest Service, North Central Forest Experiment Station: 334-339.
Texas Water Development Board. 2015. 2016 Regional water plan—population projections for 2020-2070: city summary. Austin, TX: State of Texas, Water Development Board. http://www2.twdb.texas.gov/ReportServerExt/Pages/ReportViewer.aspx?%2fProjections%2fpop_City&rs:Command=Render (accessed October 2, 2015).
U.S. Bureau of Transportation Statistics. 2010. Estimated national average vehicle emissions rates per vehicle by vehicle type using gasoline and diesel. Table 4-43. Washington, DC: U.S. Department of Transportation, Bureau of Transportation Statistics. http://www.rita.dot.gov/bts/sites/rita.dot.gov.bts/�les/publications/national_transportation_statistics/html/table_04_43.html (accessed August 11, 2015).
53
U.S. Energy Information Administration.1994. Energy use and carbon emissions: non-OECD countries. OE/EIA-0579(94). Washington, DC: Department of Energy, Energy Information Administration. http://webapp1.dlib.indiana.edu/virtual_disk_library/index.cgi/4265704/FID1578/pdf/internat/0587.pdf (accessed August 11, 2015).
U.S. Energy Information Administration. 2012a. Average retail price of electricity to ultimate customers by end-use sector. Table 5.6.A. Washington, DC: U.S. Department of Energy, Energy Information Administration. http://www.eia.gov/electricity/monthly/epm_table_grapher.cfm?t=epmt_5_6_a (accessed October 15, 2014).
U.S. Energy Information Administration. 2012b. Residential sector energy price estimates, 2012. Table E3. Washington, DC: U.S. Department of Engergy, Energy Information Administration. http://www.eia.gov/state/seds/sep_sum/html/pdf/sum_pr_res.pdf (accessed October 15, 2014).
U.S. Energy Information Administration. 2013. CE2.1 Fuel consumption totals and averages, U.S. homes. Washington, DC: U.S. Department of Energy, Energy Information Administration. http://www.eia.gov/consumption/residential/data/2009/c&e/ce2.1.xlsx (accessed October 15, 2014).
U.S. Energy Information Administration. 2014a. Household wood consumption.Table CE5.2. Washington, DC: U.S. Department of Energy, Energy Information Administration. https://www.eia.gov/consumption/residential/data/2009/index.cfm?view=consumption (accessed October 15, 2015).
U.S. Energy Information Administration. 2014b. Natural gas prices. Washington, DC: Energy Information Administration, U.S. Department of Energy. http://www.eia.gov/dnav/ng/ng_pri_sum_a_EPG0_PRS_DMcf_a.htm (accessed October 15, 2014).
U.S. Energy Information Administration. 2014c. Residential heating oil weekly oil and propane prices (October—March). Washington, DC: U.S. Department of Energy, Energy Information Administration. http://www.eia.gov/dnav/pet/PET_PRI_WFR_A_EPD2F_PRS_DPGAL_W.htm (accessed October 15, 2014).
U.S. Environmental Protection Agency. 2010. Light-duty vehicle greenhouse gas emission standards and corporate average fuel economy standards. EPA-420-R-10-012a. Washington, DC: U.S. Environmental Protection Agency. 841 p. http://www.epa.gov/otaq/climate/regulations/420r10012a.pdf (accessed August 11, 2015).
U.S. Environmental Protection Agency. 2012. Environmental bene�ts mapping and analysis program (BenMAP version 4.0). Washington, DC: U.S. Environmental Protection Agency. http://www.epa.gov/air/benmap/ (accessed May 24, 2012).

54
U.S. Federal Highway Administration. 2013. Highway statistics 2011. Table VM-1. Washington, DC: U.S. Department of Transportation, Federal Highway Administration. https://www.�wa.dot.gov/policyinformation/statistics/2011/vm1.cfm (accessed October 15, 2016).
U.S. Forest Service. 2013. Dutch elm disease. Asheville, NC: U.S. Department of Agriculture, Forest Service, Forest Health Protection. http://www.fs.fed.us/nrs/tools/afpe/maps/pdf/DED.pdf (accessed December 17, 2014).
U.S Forest Service. 2014a. Forest Inventory and Analysis national urban FIA plot �eld guide. Version 6.0. Newtown Square, PA: U.S. Department of Agriculture, Forest Service, Northern Research Station. 390 p. http://www.nrs.fs.fed.us/�a/urban/�eld-guides/national/2014_National_Urban_FIA_FG_6.0-min.pdf (accessed February 2015).
U.S. Forest Service. 2014b. 2012 National insect & disease risk maps/data. Fort Collins, CO: U.S. Department of Agriculture, Forest Service, Forest Health Technology Enterprise Team. http://www.fs.fed.us/foresthealth/technology/nidrm2012.shtml (accessed August 11, 2015).
Watershed Protection Development Review. N.d. Central Texas invasive plants. Austin, TX: City of Austin, Watershed Protection Development Review. http://www.ci.austin.tx.us/growgreen/downloads/invasiveplants.pdf (accessed October 2, 2015).
World Bank. 2010. CO2 emissions (metric tons per capita). Washington, DC: �e World Bank, Carbon Dioxide Information Analysis Center. http://data.worldbank.org/indicator/EN.ATM.CO2E.PC (accessed August 14, 2015).
Worrall, J.J. 2007. Chestnut blight. Forest and Shade Tree Pathology. www.forestpathology.org/dis_chestnut.html (accessed August 11, 2015).

55

Austin skyline through the trees of central Texas. Photo from Thinkstock.com.

Nowak, David J.; Bodine, Allison R.; Hoehn, Robert E., III; Edgar, Christopher B.; Hartel, Dudley R.; Lister, Tonya W.; Brandeis, Thomas J. 2016. Austin’s Urban Forest, 2014. Resource Bulletin NRS-100. Newtown Square, PA: U.S. Department of Agriculture, Forest Service, Northern Research Station. 55 p.
An analysis of the urban forest in Austin, Texas, reveals that this area has an estimated 33.8 million trees with tree canopy that covers 30.8 percent of the city. The most common tree species are Ashe juniper, cedar elm, live oak, sugarberry, and Texas persimmon. Trees in Austin currently store about 1.9 million tons of carbon (7.0 million tons of carbon dioxide [CO2]); such storage is valued at $242.0 million. In addition, these trees remove about 92,000 tons of carbon per year (336,000 tons CO2/year) ($11.6 million per year) and about 1,253 tons of air pollution per year ($2.8 million per year). Austin’s urban forest is estimated to reduce annual residential energy costs by $18.9 million per year. The compensatory value of the trees is estimated at $16.0 billion. The information presented in this report can be used to improve and augment support for urban forest management programs and to inform policy and planning to improve environmental quality and human health in Austin. The analysis also provides a basis for monitoring changes in the urban forest over time. Appendixes can be found online at http://dx.doi.org/10.2737/NRS-RB-100.
KEY WORDS: ecosystem services, air pollution removal, urban forestry inventory, carbon sequestration, tree value
In accordance with Federal civil rights law and U.S. Department of Agriculture (USDA) civil rights regulations and policies, the
USDA, its Agencies, of�ces, and employees, and institutions participating in or administering USDA programs are prohibited from
discriminating based on race, color, national origin, religion, sex, gender identity (including gender expression), sexual orientation,
disability, age, marital status, family/parental status, income derived from a public assistance program, political beliefs, or reprisal or
retaliation for prior civil rights activity, in any program or activity conducted or funded by USDA (not all bases apply to all programs).
Remedies and complaint �ling deadlines vary by program or incident.
Persons with disabilities who require alternative means of communication for program information (e.g., Braille, large print, audiotape,
American Sign Language, etc.) should contact the responsible Agency or USDA’s TARGET Center at (202) 720-2600 (voice and TTY)
or contact USDA through the Federal Relay Service at (800) 877-8339. Additionally, program information may be made available in
languages other than English.
To �le a program discrimination complaint, complete the USDA Program Discrimination Complaint Form, AD-3027, found online
at http://www.ascr.usda.gov/complaint_�ling_cust.html and at any USDA of�ce or write a letter addressed to USDA and provide
in the letter all of the information requested in the form. To request a copy of the complaint form, call (866) 632-9992. Submit your
completed form or letter to USDA by: (1) mail: U.S. Department of Agriculture, Of�ce of the Assistant Secretary for Civil Rights, 1400
Independence Avenue, SW, Washington, D.C. 20250-9410; (2) fax: (202) 690-7442; or (3) email: [email protected].
