austin mitchell, elizabeth casman phd, carnegie mellon ... · pdf fileaustin mitchell,...
TRANSCRIPT

Austin Mitchell, Elizabeth Casman PhD,Carnegie Mellon University, Department of
Engineering and Public Policy

Total volume of approved water withdrawals in Pennsylvania’s Ohio River Basin ~100 MGD as of July 1st 2010
July 2010 Average daily discharge of the Ohio River at Sewickley ~9,200 MGD
Source: http://www.marcellus-shale.us/impoundments.htm


- 20 40 60 Million gallons per day (MGD)
Approved Sources by TypePennsylvania - Ohio River Basin
Withdrawal impact assessments are necessary for the approval of surface water sourcesWater allocations based on discharge statistics
Wastewater Treatment Plant
Surface Water
Public Water Supply
Groundwater
Acid Mine Drainage

Q7-10◦ 10 percent or less of the natural or continuously
augmented 7-day, 10-year low flow of the stream or river. (SRBC)
Passby flow◦ Prescribed quantity of flow that must be allowed to
pass a prescribed point downstream from a water supply intake at any time during which a withdrawal is occurring. (SRBC)◦ Monitored using provisional daily discharge data

Gaged streams
Stage-discharge field
measurements
Rating Curve
Daily stage measurements
Provisional Daily Discharge
Approved Discharge Record
Q7-10 Discharge & Average daily flow
Regional Regressions and
Gage CorrelationsUngaged streams

Gaged streams
Stage-discharge field
measurements
Rating Curve
Daily stage measurements
Daily Discharge
Approved Discharge Record
Q7-10 Discharge & Average daily flow
Regional Regressions and
Gage CorrelationsUngaged streams
Provisional Daily Discharge

Measurement device and operator erroro ‘Good’ measurement
3-6% error (Sauer and Meyer,1992)
Variable environmental conditions
Source: USGS OSWSource: USGS Basic Training Materials

Gaged streams
Stage-discharge field
measurements
Rating Curve
Daily stage measurements
Daily Discharge
Approved Discharge Record
Q7-10 Discharge & Average daily flow
Regional Regressions and
Gage CorrelationsUngaged streams
Provisional Daily Discharge

Log-linear rating curveLog-Pearson Type III
Source: Bayesian Power Law Regression, Reitan 2008

Gaged streams
Stage-discharge field
measurements
Rating Curve
Daily stage measurements
Daily Discharge
Approved Discharge Record
Q7-10 Discharge & Average Daily Flow
Regional Regressions and
Gage CorrelationsUngaged streams
Provisional Daily Discharge
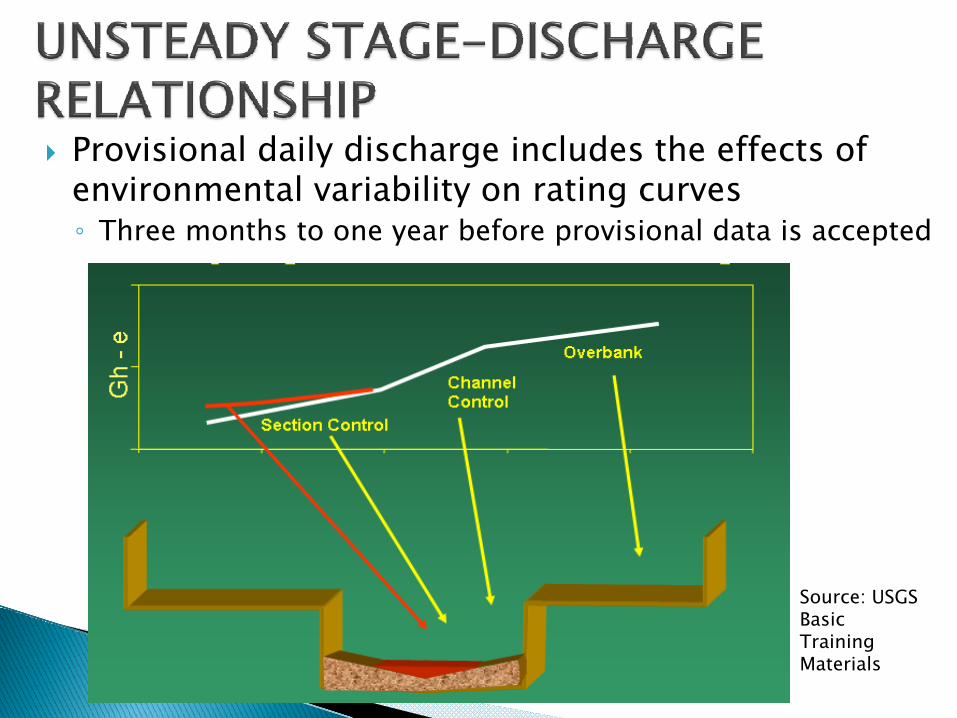
Provisional daily discharge includes the effects of environmental variability on rating curves◦ Three months to one year before provisional data is accepted
Source: USGS Basic Training Materials

Ungaged streams
Gaged streams
Stage-discharge field
measurements
Rating Curve
Daily stage measurements
Daily Discharge
Approved Discharge Record
Q7-10 Discharge & Average Daily Flow
Regional Regressions and
Gage Correlations
Provisional Daily Discharge
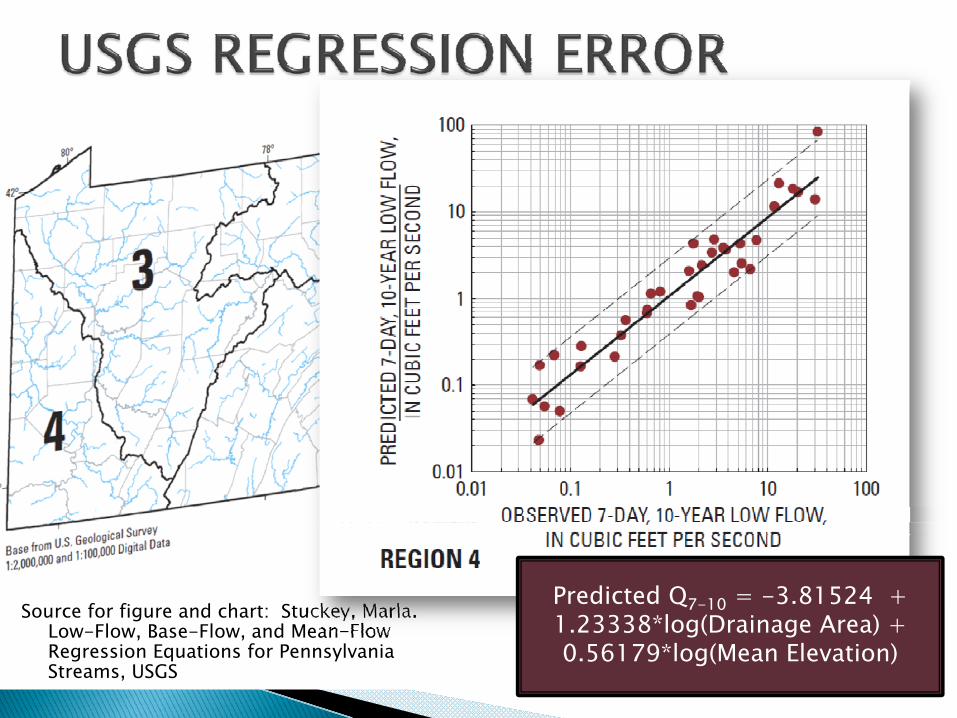
Source for figure and chart: Stuckey, Marla. Low-Flow, Base-Flow, and Mean-Flow Regression Equations for Pennsylvania Streams, USGS
Predicted Q7-10 = -3.81524 + 1.23338*log(Drainage Area) + 0.56179*log(Mean Elevation)
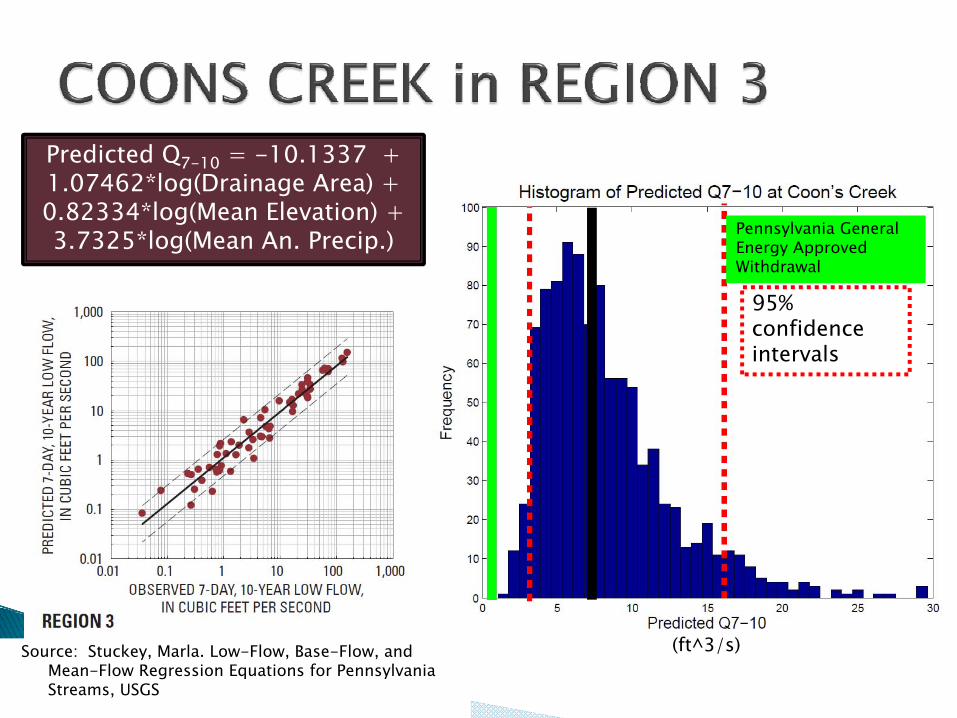
Predicted Q7-10 = -10.1337 + 1.07462*log(Drainage Area) + 0.82334*log(Mean Elevation) + 3.7325*log(Mean An. Precip.)
Source: Stuckey, Marla. Low-Flow, Base-Flow, and Mean-Flow Regression Equations for Pennsylvania Streams, USGS
(ft^3/s)
95% confidence intervals
Pennsylvania General Energy Approved Withdrawal

Unknown water diversions and consumption Streams impacted by mining
Surface Withdrawals and
mining operations in Southwestern Pennsylvania

Under current system, streams have been “sucked” dryLow flow raises water temperature which decreases dissolved oxygenProtect existing uses◦ Public water supplies◦ Power plant and industrial cooling◦ NPDES permitted dischargers

USGS StreamStats◦ Use given confidence intervals for Q7-10
extrapolation◦ Uphold assumptions on which the regression is
basedEstablish margin of error when using reference gages for passby flows Long-term solution involves more gaging

Taking too much water, especially during low-flow, negatively impacts local ecology and downstream usersDischarge statistics are uncertain at gagedand ungaged sites◦ Extrapolation to ungaged sites must be done with
careProvisional gage data includes natural variability

Jeanne VanBriesen PhD, Carnegie Mellon UniversityKan Shao, Carnegie Mellon University
Nektarios Leontiadis, Carnegie Mellon UniversityDerek Smith & Brian Dillemuth – PaDEP
Tony Spehar & Clinton Hittle - USGS
This research was made possible through support from the Climate Decision Making Center (CDMC) located in the Department of Engineering and Public Policy. This Center has been created through a cooperative agreement between the National Science Foundation (SES-0345798) and Carnegie Mellon University.