austerity is not a solution: why the deficit hawks are ... economy research institute austerity is...
TRANSCRIPT

PO
LIT
ICA
L E
CO
NO
MY
R
ESEA
RC
H IN
ST
ITU
TE
Austerity Is Not a Solution:
Why the Deficit Hawks Are Wrong
Robert Pollin
Forthcoming in Challenge,
November/December 2010
September 2010
WORKINGPAPER SERIES
Number 235
Gordon Hall
418 North Pleasant Street
Amherst, MA 01002
Phone: 413.545.6355
Fax: 413.577.0261
www.umass.edu/peri/

AUSTERITY IS NOT A SOLUTION: WHY THE DEFICIT HAWKS ARE WRONG
Forthcoming in Challenge, November/December 2010
Robert Pollin Department of Economics and
Political Economy Research Institute (PERI) University of Massachusetts-Amherst
I am grateful to Michael Ash, Jerry Epstein, Jayati Ghosh, James Heintz, Jeff Madrick and Josh Mason for comments on an earlier draft. Josh Mason also provided excellent research assistance.
Pollin, “Austerity is not a Solution” Forthcoming in Challenge, November/December 2010 Page 2
AUSTERITY IS NOT A SOLUTION: WHY THE DEFICIT HAWKS ARE WRONG
By Robert Pollin
JEL Codes: E60, E62, E50
Abstract:
Wall Street hyper-speculation brought the global economy to its knees in 2008-09. To prevent a 1930s-level Depression at that time, economic policymakers throughout the world enacted extraordinary measures. These included large-scale fiscal stimulus programs, financed by major expansions in central government fiscal deficits. In the U.S., the fiscal deficit reached 9.9 percent of GDP in 2009, and is projected at 10.3 percent of GDP in 2010. But roughly 18 months after these measures were introduced, a new wave of opposition to large-scale fiscal deficits has emerged.
This paper reviews the arguments developed by various leading deficit hawks. In fact, they are not advancing one main argument or even a unified set of positions, but rather four distinct claims: 1) Large fiscal deficits will cause high interest rates, large government debts, and inflation; 2) Even if the current deficits have not caused high interest rates and inflation, they are eroding business confidence; 3) The multiplier for fiscal stimulus policies is always close to zero and has been so with the current measures; and 4) Regardless of short-term considerations, we are courting disaster in the long run with structural deficits that the recession only worsened.
This paper argues that none of these deficit hawk positions stand up to scrutiny. I also argue that through critiquing the four deficit-hawk positions, we can also bring greater clarity toward developing a workable recovery program. This will include fiscal deficits that can stabilize state and local government budgets; maintain sufficient funds for unemployment insurance; and continue support for long-term investments in traditional infrastructure and clean energy. But such fiscal policies also need to combine with credit-market measures that are capable of ‘pulling on a string’—i.e. creating strong enough incentives for both lenders and borrowers to unlock credit markets.
2
Pollin, “Austerity is not a Solution” Forthcoming in Challenge, November/December 2010 Page 3
Wall Street hyper-speculation brought the global economy to its knees in 2008-09. To
prevent a 1930s-level Depression at that time, economic policymakers throughout the world—including the U.S., the countries of the European Union, Japan, South Korea, China, India, and Brazil—all enacted extraordinary measures to counteract the crisis created by Wall Street. These included financial bailouts; monetary policies that pushed central bank controlled rates close to zero; and large-scale fiscal stimulus programs, financed by major expansions in central government fiscal deficits.
In the U.S., the fiscal deficit reached $1.4 trillion, or 9.9 percent of GDP in 2009, and is projected at $1.5 trillion, or 10.3 percent of GDP, in 2010. Prior to that, the U.S. deficit averaged 2.0 percent of GDP under the full eight years (2001-08) of George W. Bush and 0.8 percent of GDP under Bill Clinton (1993-2000).
Among the 27 countries of the European Union, fiscal deficits for 2009 averaged 6.8 percent of GDP, up from a 1.8 percent average between 2001-07. The largest deficits for 2009 were those in Ireland (14.3 percent), Greece (13.6 percent), the UK (11.4 percent) and Spain (11.2 percent). France was also relatively high at 7.5 percent, while Germany was a low outlier at 3.3 percent. According to the EU Stability and Growth Pact agreed on in 1997, annual fiscal deficits were supposed to not exceed 3 percent of GDP other than in severe recessions.
Fiscal deficits of this magnitude emerged first as the normal result of the recession itself, with tax revenues falling along with incomes, business profits and asset prices, while government support payments rose for ‘automatic stabilizers’ such as unemployment insurance, Medicaid and other basic safety nets. But in addition, governments enacted major programs of tax cuts and increased spending to strengthen aggregate demand and prevent the economy’s floor from collapsing.
Roughly 18 months after these strong anti-recession measures were enacted, a new wave of opposition to large-scale fiscal deficits has emerged. Deficit hawks have gained strong momentum in the U.S. as well as Europe. They have taken control of economic policy in Britain and Greece, and are gaining ascendency elsewhere. The new Conservative-led coalition government in Britain wasted almost no time to begin implementing its plan to cut government spending in almost all areas by 25 percent over five years, along with a two-year wage freeze for most public-sector workers. In Greece, the Socialist government has made even bigger cuts than required by the International Monetary Fund-managed program, reducing government spending this year by 10 percent. The main justification for such measures is that—in the spirit of the Margaret Thatcher’s famous dictum of the late 1970s—‘there is no alternative.’ That is, deficit hawks argue that self-imposed austerity measures, starting immediately, are the only serious
3
Pollin, “Austerity is not a Solution” Forthcoming in Challenge, November/December 2010 Page 4 policy choice now available. Perhaps big deficit-financed fiscal expansions made sense 18 months ago, but no longer.
The dramatic policy reversal in Europe was of course triggered by the sovereign debt crisis that first broke last spring with the governments of Greece, but then soon thereafter, Spain, Portugal and Ireland required a 750 billion Euro rescue package from the EU governments and IMF to avoid defaulting on their debts to private banks. Germany, in particular, agreed only grudgingly to the rescue package, and only in exchange for strong measures—tax increases but mostly cuts in social spending—to close the fiscal deficits of the governments in crisis.
In the U.S., commentators frequently explain why ‘we are not Greece.’ At the same time, state and local governments throughout the country are imposing major cuts on health, education and social services because of the severe drop in their tax revenues and the unwillingness of the federal government to expand revenue-sharing to make up the difference. Thus, the state of Washington is increasing premiums by up to 70 percent for its health plan serving low-income people, and California is cutting health-care subsidies for nearly 1 million children. The public school system in Hawaii has moved to a four-day week to save money. About 250,000 state and local government workers have been laid off since August 2008, while furloughs and cuts in wages and benefits have also been widespread. This is while state and local governments are still receiving revenue-sharing support from the federal government. The situation could rapidly deteriorate further if the federal government adopts an austerity budget, including minimal further revenue sharing for states and municipalities. Meanwhile, last February, President Obama established a bipartisan “National Commission on Fiscal Responsibility and Reform,” that will present its findings and recommendations by the end of the year. But the Commission’s co-chairs have already stated that the current budget trend is “a cancer that will destroy the country from within” unless it is checked by strong corrective measures (Washington Post, 7/12/10).
We are clearly in the midst of a high-stakes debate about fiscal deficits and macroeconomic policy. In reviewing the arguments developed by various leading deficit hawks, what also becomes clear is that they are not advancing one main argument or even a unified set of positions, but rather four distinct claims. We can characterize these four arguments as follows:
1. The traditional view. Large fiscal deficits will cause high interest rates, large government debts, and inflation.
2. Declining business confidence is the real danger. Even if the current deficits have not caused high interest rates and inflation, they are eroding business confidence. When business confidence is low, the economy is highly vulnerable to small changes in conditions, what some economists call “non-linearities.”
3. Fiscal stimulus policies never work. New Classical economists, Robert Barro most notably, have long argued that the multiplier for fiscal stimulus policies is zero or thereabouts.
4

Pollin, “Austerity is not a Solution” Forthcoming in Challenge, November/December 2010 Page 5
4. A long-term fiscal train-wreck is coming. Regardless of short-term considerations, we are courting disaster in the long-run with structural deficits that the recession has only worsened.
Because the distinctiveness of these four positions has not been clearly recognized, the current debates over fiscal policy have been more muddled than necessary. Moreover, because these arguments are not closely interconnected, three of them could actually be wrong, but a viable case in behalf of deficit-hawk policies could still make sense on the basis of the one correct argument.
All of these deficit hawk positions warrant careful consideration, especially because we clearly have not hit upon a successful plan of recovery through alternative measures. At the same time, in what follows, I argue that none of these deficit hawk positions stand up to scrutiny. I also try to show that, through the process of critiquing the four deficit-hawk positions, we can also bring greater clarity to developing a recovery program that can work. In the short-run, this will entail fiscal deficits that can, in particular, accomplish three things: 1) Stabilize state and local government budgets, including spending on social safety net programs such as Medicaid and food stamps; 2) Maintain sufficient funds for unemployment insurance; and 3) Continue support for long-term investments in traditional infrastructure and clean energy. Large-scale investments in retrofitting public buildings, in particular, will pay for themselves in energy savings within 3-4 years. But crucially, these expansionary fiscal policies need to operate in combination with credit-market measures that are capable of ‘pulling on a string’—i.e. creating strong enough incentives for both lenders and borrowers to unlock credit markets. Achieving long-run fiscal stability will not require austerity today, but rather long-term cuts in healthcare spending and the military, as well as new taxes on Wall Street.
The focus on this discussion is the U.S. economy. I do also touch briefly on conditions in Europe, and will consider the European situation more fully in a companion article for the next issue of Challenge.
Interest Rates, Debt Burdens, Crowding Out, Inflation
Other than during World War II, current government deficit levels in the range of 10 percent of GDP for the U.S. and ranging as high as 11-14 percent for the UK, Spain and Greece, are historically unprecedented. Ronald Reagan’s term of office is well-known as having itself generated unprecedented fiscal deficits. But the Reagan deficits peaked at 6.0 percent of GDP in 1983 and averaged 4.2 percent during his full eight-year term, 1981-90. There is validity to the characterization of this period by the Harvard University historian Niall Ferguson as “world war finance without the war,” (Financial Times, 7/19/10). But these deficits emerged as a response to a recession of unprecedented severity since the 1930s. Beyond their magnitude alone, what might render these deficits dangerous? A large number of deficit hawks start with four points: 1)
5
Pollin, “Austerity is not a Solution” Forthcoming in Challenge, November/December 2010 Page 6 By increasing demand for credit faster than supply, the large deficits drive up interest rates; 2) Large government deficits at high interest rates will generate large government debt burdens, as reflected in rising government debt/GDP ratios; 3) The high interest rates generated by excessive government borrowing will crowd out private sector investors from borrowing and investing; and 4) The government deficits will create significant inflationary pressures.
These are all matters of serious concern. But how exactly we should act on our concerns should be guided by the facts of the situation. Two facts in particular are crucial as starting points: that the interest rates of U.S. government bonds, including long-term bonds, have ranged at historically low levels throughout the months since the Obama stimulus program was introduced (as of this writing, we are able to observe data from March 2009.3 through July 2010); and similarly, the inflation rate has been subdued throughout this full period.
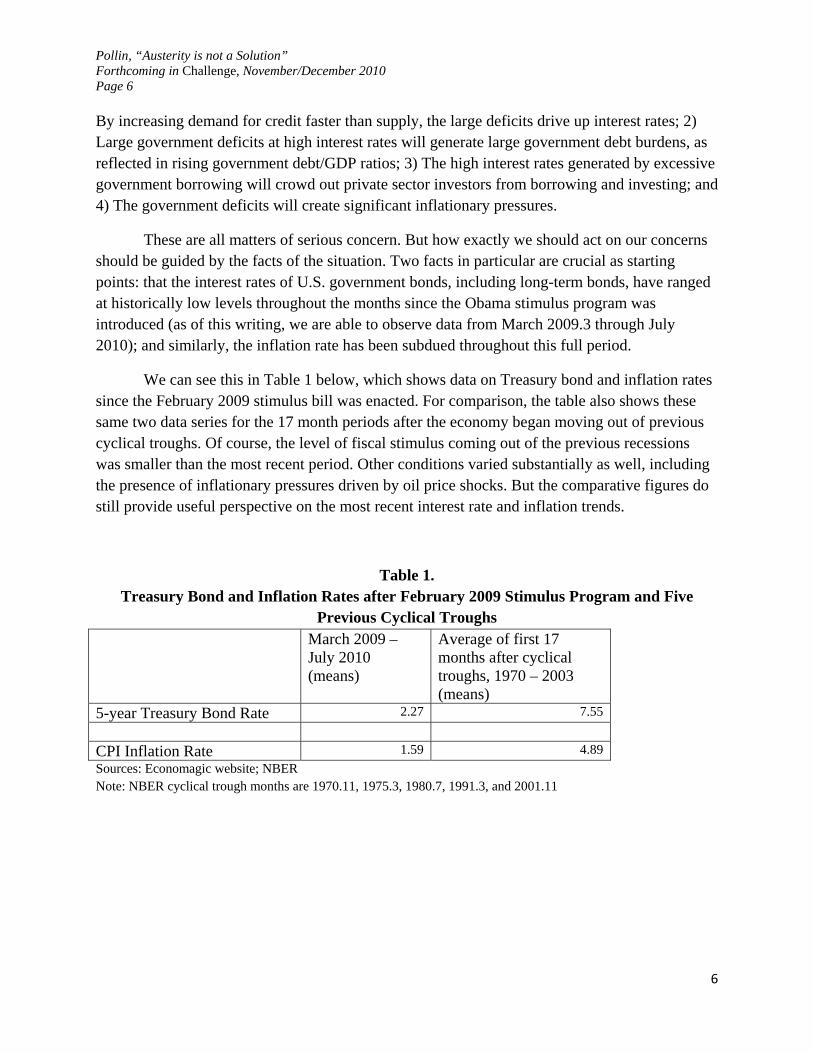
We can see this in Table 1 below, which shows data on Treasury bond and inflation rates since the February 2009 stimulus bill was enacted. For comparison, the table also shows these same two data series for the 17 month periods after the economy began moving out of previous cyclical troughs. Of course, the level of fiscal stimulus coming out of the previous recessions was smaller than the most recent period. Other conditions varied substantially as well, including the presence of inflationary pressures driven by oil price shocks. But the comparative figures do still provide useful perspective on the most recent interest rate and inflation trends.
Table 1. Treasury Bond and Inflation Rates after February 2009 Stimulus Program and Five
Previous Cyclical Troughs March 2009 –
July 2010 (means)
Average of first 17 months after cyclical troughs, 1970 – 2003 (means)
5-year Treasury Bond Rate 2.27 7.55 CPI Inflation Rate 1.59 4.89 Sources: Economagic website; NBER Note: NBER cyclical trough months are 1970.11, 1975.3, 1980.7, 1991.3, and 2001.11
6
Pollin, “Austerity is not a Solution” Forthcoming in Challenge, November/December 2010 Page 7
As we see, the 5-year Treasury bond rate, as a representative long-term Treasury rate, averaged 2.27 percent between March 2009 and July 2010. There was also little variation around this average rate (standard deviation of 0.27). For the previous five cycles, the average rate was much higher at 7.55 percent and much less stable. The average monthly inflation rate was similarly very low at 1.59 percent between March 2009 and July 2010, as opposed to 4.89 percent during the previous five cycles.
Why have interest rates on government bonds and inflation remained low despite the large deficits? The low interest rates reflect that financial market investors globally have been highly risk averse since the financial collapse, in a dramatic reversal of their mindset during the bubble years. Investors are now clearly voting strongly in support of U.S. government bonds as the single safest store of their wealth. The European fiscal crisis that began in the spring of 2010 and led to a plunge in the Euro relative to the dollar, provided yet another reminder that, however bad conditions are in the U.S., they can easily become worse someplace else. As for lack of inflationary pressure, this is a direct result of the high rate of unemployment and low rate of capacity utilization, which imply little upward pressure on wages and prices. As the Harvard economist Martin Feldstein, one of the most prominent deficit hawks, acknowledges “sustained budget deficits…do not cause inflation unless they lead to excess demand for goods and labor,” (Project Syndicate column 6/23/10). The other factor that could create inflationary pressures is an oil price shock. But this hasn’t happened and, during what is at best a weak recovery, is not about to happen.
The reality of low interest rates, in particular, also greatly alleviates concerns about worsening long-term debt burdens. Consider that when the Reagan-era deficits peaked in 1983, the government paid, on average, 10.8 percent on 5-year Treasuries. If the U.S. Treasury had to pay 10.8 percent today on the $1.4 trillion it borrowed in 2009, annual interest payments on this debt would be $151 billion, as opposed to the $32 billion the Treasury pays with a 2.27 percent interest rate. Considering also the 7.75 average rate on 5-year Treasuries for the previous five cycles as our comparison point, annual interest payments on $1.4 trillion in federal borrowing would be $106 billion, still three times more than the payments generated by the 2.27 rate on 5-year bonds that prevailed between March 2009 and July 2010. The sustained low interest rates over the period since the stimulus program have thus dramatically reduced the federal government’s debt servicing burden.
Declining Business Confidence is the Real Danger
Despite the recent favorable interest rate and inflation trends, one variant of the deficit hawk position argues that, nonetheless, conditions can deteriorate rapidly as long as the federal government continues running historically large deficits. Under such conditions, as opposed to more ordinary circumstances, risk perceptions among business owners and financial market investors are highly vulnerable to what might otherwise appear as relatively modest changes in
7
Pollin, “Austerity is not a Solution” Forthcoming in Challenge, November/December 2010 Page 8 current market conditions. For example, a single significant credit-rating downgrade in the state or municipal bond market could produce sharper run-ups in interest rates or inflation than would otherwise occur because business confidence is fragile. These are what some economists refer to as the “non-linearities” in the economy that emerge under fragile conditions. Kenneth Rogoff of Harvard explains this factor as follows:
The fact that markets seem nowhere near forcing adjustment on most advanced economies can hardly be construed as proof that rising debts are riskless. Indeed, the evidence generally suggests that the response of interest rates to debt is highly non-linear. Thus, an apparently benign market environment can darken quite suddenly as a country approaches its debt ceiling. Even the US is likely to face a relatively sudden fiscal adjustment at some point if it does not put its fiscal house in order (Financial Times 7/20/10).
Jean-Claude Trichet, President of the European Central Bank is still more emphatic on this point:
“Given the magnitude of the annual budget deficits and the ballooning of outstanding public debt, the standard linear economic models used to project the impact of fiscal restraint or fiscal stimuli may no longer be reliable. In extraordinary times, the economy may be close to non-linear phenomena such as a rapid deterioration of confidence among broad constituencies of households, enterprises, savers, and investors. My understanding is that an overwhelming majority of industrial countries are now in those uncharted waters, where confidence is potentially at stake. Consolidation is a must in such circumstances (Financial Times 7/22/10).
A recent paper by Harvard University economists Alberto Alesina and Silvia Ardagna (2009) offers support to these arguments. They present evidence for OECD countries between 1970 – 2007 showing, among other things, a large number of instances where large-scale deficit reductions are associated with subsequent economic expansions. They hypothesize that the causal factor here is that such fiscal consolidations can indeed succeed in raising confidence among business owners and households, and that such measures will stabilize the economy moving forward. Working from these findings and hypotheses, several popular commentators have concluded that an austerity agenda today will promote a healthy recovery from the recession.
A Fuller Picture on Business Confidence
8
Pollin, “Austerity is not a Solution” Forthcoming in Challenge, November/December 2010 Page 9 It is certainly correct that businesses will not undertake new investments to the necessary extent if they lack confidence in the economy’s future. It is also true that financial market players will not purchase government bonds—or at least will demand exorbitant interest rates—if they perceive, correctly or not, that a government default is a real possibility. However, this particular deficit hawk argument hinges on a crucial unsupported assumption: that the most powerful, and perhaps even the only way to restore business confidence is through closing large-scale fiscal deficits.
But certainly the factors influencing business confidence—both in financial markets and in the non-financial economy—are more complex, as is evident from the history of the U.S. economy over the past 15 years. That history includes the run up and collapse of the biggest stock market bubble in U.S. history, which was then followed in short order by the run up and collapse of the biggest real estate bubble in U.S. history. One lesson that should emerge from these experiences is that a range of factors influence business confidence, including, crucially, what Alan Greenspan himself termed “irrational exuberance.” Irrational exuberance during the recent stock market and real estate bubbles drove activity on financial markets, and, through that channel, also exerted strong influence among non-financial businesses in deciding how much to borrow, invest, and expand their operations.
Of course, other factors besides bubble psychology also influence business confidence and investment decisions. In fact, decades of research show that the single most influential factor in promoting capital expenditures by businesses is a healthy present and future market for the products that businesses aim to produce and sell. That is precisely why accelerator models—with the rate of new business investment being a function of changes in overall sales or economy-wide spending—have consistently performed robustly in econometric studies of private business investment patterns. Because businesses respond positively to sales opportunities in their target markets, it follows that, to the extent that increased government spending—however it is financed—helps deliver sales to businesses, that in turn will promote business confidence.
It also follows that when reductions in government spending produce austerity, this will also contribute to diminishing business confidence, no matter how large is the fiscal deficit at that time. It is therefore not surprising that a survey last August by the Bank of England reported that business confidence had fallen, with companies ascribing their increased nervousness to the government spending cutbacks. The Bank survey found that “many businesses linked the decline in confidence to the planned cuts in public spending, which were expected to lead to weaker demand, both directly in those sectors with significant public sector exposure, and indirectly by reducing public sector employment and hence household income,” (Financial Times, 8/18/10).
These broader considerations on business confidence also provides crucial context for assessing the actual dangers that can result from rapid negative shifts in business confidence—i.e. the “non-linearities.” The deficit hawks are correct that we must maintain vigilance regarding
9
Pollin, “Austerity is not a Solution” Forthcoming in Challenge, November/December 2010 Page 10 rapid negative shifts in business perceptions, including the perceptions of financial market traders and investors. These can indeed turn on a dime, especially when the markets are weakly regulated and the costs are low for traders who frequently change their mind.
But again, we must recognize here all the factors that can generate rapid negative shifts in business perceptions. Thus, a double-dip recession and/or long-term austerity conditions could engender political instability that in turn leads to various unpredictable government actions. Deflation is also a very high risk event associated with a double-dip recession and austerity. The rise in the value of the dollar that deflation would produce will increase debt burdens for households and businesses, a high proportion of which are already heavily overindebted. Deflation will thus bring more debt defaults, bankruptcies, and home foreclosures, which in turn will bring new rounds of financial market instability. This is a ‘real balance effect’ in reverse, an outcome that Ben Bernanke, and even Alan Greenspan before him, have repeatedly cited as a major danger to avoid.
In light of these considerations, it is instructive to return briefly to the recent findings by Alesina and Ardagna which, for many commentators, appear to show that austerity policies can promote an economic recovery. A recent careful analysis of these results by Arjun Jayadev of the University of Massachusetts and Mike Konczal (2010) of the Roosevelt Institute finds that, in fact, in virtually all of the cases cited by Alesina and Ardagna, the fiscal consolidations that were associated with accelerating economic growth occurred in periods when the economy was already growing. Jayadev and Konczal show that there are no cases in the Alesina and Ardagna data set in which a country facing conditions similar to the U.S. today (sharp recession, high unemployment, low interest rates) has succeeded in promoting recovery through austerity policies.
The Obama Stimulus Failed and Had to Fail
Here we come to what is probably the deficit hawks’ single most influential argument, even if the case is made largely through casual observation. But the casual observation is straightforward and powerful: when the stimulus bill was passed in February 2009, the Obama administration predicted that unemployment would be at 7.5 percent by mid-2010. Yet as of this past August, unemployment is at 9.6 percent and there are few signs that we are likely to see significant improvements soon. Thus, the stimulus program appears to have failed to accomplish what the administration had predicted.
Some deficit hawks of this variety push the argument further, into the realm of theory, in particular the new New Classical perspective on deficit spending, as advanced most notably by Robert Barro of Harvard. Within this theoretical framework, the Obama stimulus program, and similar initiatives in Europe and throughout the world, have not succeeded because they are not capable of succeeding. This is due to what Barro terms “Ricardian equivalence,” the argument
10

Pollin, “Austerity is not a Solution” Forthcoming in Challenge, November/December 2010 Page 11 that households and businesses view the government deficits as creating increased future tax liabilities for themselves. As such, they anticipate these future tax burdens in their present behavior, by reducing their present levels of spending, more or less by the amount that their future tax burden will rise. The rise in deficit-financed government spending will therefore be matched by an equivalent reduction in private-sector spending—that is, the multiplier effects of a government debt-financed stimulus program will be zero. Barro argues that it is much more plausible to assume that the multiplier is zero as opposed to some significant positive number. In the zero multiplier case, as Barro writes, “the real GDP is given, and a rise in government purchases requires an equal fall in the total of other parts of GDP—consumption, investment and net exports,” (2009, p. 2).
Barro’s notion of Ricardian equivalence has always rested on an implausible set of behavioral assumptions, including that businesses and households operate with perfect foresight within the context of perfectly functioning financial markets. This is how they are able to accurately calculate their future tax burdens associated with current fiscal deficits. His model also assumes that the households and businesses will always choose to save more money now to cover these future tax burdens rather than, at least in some substantial number of cases, spend more now and worry about the future later.
But theories aside, Barro also produced evidence supporting his theoretical conclusion that government spending multipliers would be zero, though only under peacetime conditions. Significantly, as he acknowledges, his own research finds that multipliers could be much larger during wartime, as high as 0.8, because, as he proposed, the temporary nature of much of military spending means that consumer demand would not fall significantly in this situation. Barro also adds that, during wars, conscription creates a forced increase in labor supply, which in turn expands output.
But Barro’s conclusion of a zero multiplier in even peacetime has long represented an extreme position among a wide range of estimates in the literature. For example, a 2002 survey paper by Hemming, Kell and Mahfouz of the IMF reported estimates for the case of the U.S. that range between zero and 2.0. Their primary explanation as to why the multiplier estimates range widely is that the impact of the government’s deficit spending will vary, depending on conditions in the economy when the spending injection occurs. Of course, this conclusion is fully consistent with that reached by Barro himself through his acknowledging that multipliers will vary widely under war- and peacetime conditions. Hemming et al. argue that the conditions under which a government stimulus will generate a relatively large multiplier will include the following: significant excess capacity; liquidity-constrained households; government spending is not substituting for private spending; the government is not facing financing constraints; and there is an accompanying monetary expansion with limited inflationary consequences.
11
Pollin, “Austerity is not a Solution” Forthcoming in Challenge, November/December 2010 Page 12
What about the U.S. Multiplier since 2009?
Conditions in the U.S. economy when the stimulus program was enacted in February 2009 appear to have corresponded well with the conditions that Hemming et al. identify as being conducive to a large multiplier. With unemployment at 8.2 percent and industrial capacity utilization at 70.2 percent as of February 2009, the economy was clearly operating with considerable excess capacity. Households were also clearly liquidity constrained, due to stagnant or falling incomes, high unemployment and heavy debt obligations. The financial crisis brought a sharp increase in risk aversion by private investors and corresponding drop in private investment, so the rise in government spending would not be substituting for private spending. Extremely low Treasury bond rates and a relatively low debt-servicing burden meant that the federal government did not face major financing constraints. Monetary policy also appeared to be highly expansionary, with the federal funds rate close to zero, while inflation was also negligible—though we will examine this issue further below.
But given at least the appearance of favorable conditions for a strong federal spending multiplier, why then, 18 months after the stimulus bill was enacted, is unemployment still stuck at nearly 10 percent?
One factor is that 24 percent of the overall $787 billion measure was in the form of tax cuts for businesses and households. These were not particularly effective at inducing increased spending, because households also had to repay debts and businesses, in a risk-averse mode, were reluctant to spend for new investment projects. These circumstances would imply that a substantially larger proportion of the overall stimulus should have financed direct government spending initiatives, where a dollar targeted to be spent is most likely to get spent. About 22 percent of the overall stimulus was channeled directly to state and local governments for revenue sharing, to prevent layoffs in the areas of education, health care, and public safety that would have occurred otherwise due to their tax revenue shortfalls. This component of the stimulus was quite successful in achieving exactly its aim of preventing layoffs. Alan Blinder and Mark Zandi (2010) estimate the state and local government spending multiplier as having been 1.41, five times larger than that for corporate tax cuts.
The spending in the stimulus targeted for infrastructure and clean-energy investments also has succeeded in generating jobs basically as was anticipated. In the interests of full disclosure here, I have consulted with the Department of Energy on implementing the Obama administration’s green investment agenda since it was initiated through the stimulus program. My co-authors and I have found in our research a remarkably tight fit between the number of jobs directly created through green investment spending, as reported by individual projects operating throughout the country, and the number of jobs we had predicted would be created. We have also estimated that the multiplier for these projects to be about 1.4, i.e. roughly the same as with state and local government spending. The problem with the infrastructure and green
12
Pollin, “Austerity is not a Solution” Forthcoming in Challenge, November/December 2010 Page 13 investment components of the stimulus has been the slow pace in getting the projects up to operational speed. These delays have certainly played a role in diminishing the rate of job creation through the overall stimulus program.
But there were also two larger factors, indeed major headwinds, weakening the multiplier effects of the stimulus program. The first was the evaporation of $13 trillion in household wealth over between 2007-09, due to the collapse of the housing market bubble and the subsequent financial crisis. This loss of household wealth in turn led to a decline in household spending through the wealth effect. The literature generally finds that households will reduce their spending by between 3 and 5 cents for every dollar of wealth that they lose, i.e. a wealth effect of between 3 – 5 percent in total spending relative to the change in household wealth. This does assume, as is likely under the recent circumstances, the households see this loss of wealth as a long-term change in their financial situation. Thus, even taking the lower-end 3 percent estimate as the size of the wealth effect, the loss of $13 trillion in household wealth would imply a roughly $360 billion reduction in household spending. This figure is nearly half of the total stimulus package of $787 billion.
But an even greater drag on the spending multiplier has been the dramatic contraction in borrowing and lending resulting from the financial collapse. For the full year 2009, overall business borrowing has fallen by about $1.5 trillion relative to 2007, a figure equal to about 85 percent of all business investment in equipment and buildings for 2009. The largest proportional cutbacks in business borrowing have come from smaller businesses.
Moreover, the private banks were carrying an astronomical $1.1 trillion in cash reserves on their balance sheets as of the first quarter of 2010. By contrast, in 2007, banks were holding only $21 billion in cash reserves. Of course, the banks need to maintain a reasonable supply of cash reserves as a cushion against future economic downturns. One of the main causes of the 2008-09 crisis and other recent financial crises was that banks’ cash reserves were far too low. But increasing reserves from $21 billion to $1.1 trillion is a new form of Wall Street excess.
These figures on borrowing and lending reflect the extremely high level of risk aversion by both borrowers and lenders with respect to new productive investments, as opposed to pure financial engineering. Moreover, the interest rates being charged to private businesses are actually relatively high, despite the fact that the Fed-controlled federal funds rate has been close to zero since November 2008. Thus, the BAA corporate bond rate as of July 2010 was 6.0 percent and had been higher still earlier in the year. This spread last July of 5.8 percentage points between the federal funds rate and BAA rates is basically equal to the peak levels reached over the past 30 years.
These high business borrowing rates, and the ongoing credit market lockup more generally, bring us to a crucial point in understanding the failure of the Obama stimulus program to bring down unemployment. The Fed has held the federal funds rate at nearly zero since
13
Pollin, “Austerity is not a Solution” Forthcoming in Challenge, November/December 2010 Page 14 December 2008. Monetary policy has certainly been expansionary by that standard, in concert with the fiscal stimulus. However, conducting an effective expansionary monetary policy must entail more than simply keeping the federal funds rate close to zero. The real aim of expansionary monetary policy must be to produce conditions in credit markets that will encourage household spending and business investments which in turn, can generate millions of decent jobs. Indeed, the more apt term here should be “credit market policy” as opposed to “monetary policy.” In any case, the situation since the fiscal stimulus program was enacted is that, despite the federal funds rate being held at close to zero for nearly two years, the ongoing tight credit conditions have stood as the most important barrier to the success of the fiscal stimulus.
Learning to Pull on a String
The current conditions in credit markets are hardly unique relative to previous recessions and the 1930s Depression itself. Indeed, they represent just the current variation on the classic problems with monetary policy in recessions of reaching a “liquidity trap” and trying to “push on a string.” This is when banks would rather sit on cash hoards than risk making bad loans and businesses are not willing to accept the risk of new investments, no matter how cheaply they can obtain credit. These problems can appear as insurmountable as long as one defines the limits of monetary/credit market policies as the power of the Federal Reserve to move the federal funds rate up or down. Within that limited range of possibilities, it is obvious that the federal funds, currently still set at close to zero percent, cannot go down any further. However, the government does also have the power to introduce other tools as needed, as Chair Bernanke fully demonstrated over the course of the 2008-09 crisis. Among other actions during that period, Bernanke dramatically expanded the Fed’s lending facilities to include mortgage brokers, money market funds and insurance companies. The Fed also began purchasing commercial paper directly in this period. For the present, the government needs to bring together an effective package of policies that will enable them to pull on the string, firmly and persistently.
This will entail both carrots and sticks. The carrots would be measures to substantially reduce the level of risk being faced by both borrowers and lenders. This can be done through the government’s existing loan guarantee program. In 2009, the total level of loans guaranteed by the Federal government was about $340 billion. The two largest categories were subsidized mortgage and student loans. About $50 billion went to business loans, through the Small Business Administration and the Export-Import Bank. In the current climate, the federal government should roughly double its overall loan guarantee program—that is, inject another $300 billion in guaranteed loans into the credit market, and shift the focus of the new guarantee programs to business. Overall guarantees would therefore be about $600 billion, a $300 billion increase from 2009. For this initiative to be effective at reducing risk and encouraging new investment, the terms will have to be generous—very large guarantees, in the range of 90 percent; low or no fees on the loans; and low interest rates for borrowers.
14

Pollin, “Austerity is not a Solution” Forthcoming in Challenge, November/December 2010 Page 15
The stick would be for the federal government to tax the excess reserves now held by banks. This should create a strong disincentive for banks to continue holding somewhere around $1 trillion in excess reserves. Recently, variations on the idea of an excess reserve tax have been endorsed widely, both in the U.S. and abroad, by, among others, Gregory Mankiw, who was Chair of the Council of Economic Advisors under George W. Bush, and Charles Goodhart, a former member of the Bank of England’s Monetary Policy committee. It is difficult to know in advance what the appropriate tax rate should be for this purpose—probably in the range of 1-2 percent. But the initiative should also allow Congress to operate with flexibility, to adjust the rate as needed for channeling excess reserves into job-generating investments. For starters, the Fed needs to stop paying interest on bank reserves. It is currently paying 0.25 percent on these accounts.
One crucial feature of this combination of policies is that its impact on the federal deficit would be negligible. Loan guarantees are contingent liabilities for the federal government. Expanding the existing level of guarantees would entail some modest increase in administrative costs. Beyond this, the government would incur costs only as a result of defaults on the guaranteed loans. If we assumed the default rate remained at roughly the 2007 level for the expanded program, this would add about $9 billion, or 0.3 percent, to the federal budget. Even if, implausibly, the default rate on the new loans doubled relative to the 2007 levels, this would still increase the federal budget by only 0.6 percent. A significant share of this budgetary expense could be covered by the revenues generated by the excess reserve tax.
Maintaining Fiscal Stimulus until the Recession is Over
Considered on their own, even well-executed measures to pull on the credit string will not succeed if the federal government retreats from its current expansionary fiscal stance. Indeed, we would end up with the mirror image of our current situation: expansionary credit policies with contractionary fiscal policies instead of expansionary fiscal policies but tight credit conditions.
Thus, until the recession is clearly behind us, it is crucial for the federal government to maintain a strong expansionary stance. This first entails protecting state and local governments from undergoing budget cuts that would be otherwise forced on them through declines in their tax revenues. For the 2011 fiscal year, this means approximately $100 billion in additional federal revenue-sharing support for state and local governments beyond the $40 billion already committed. The federal government must also continue to finance unemployment insurance, without the delays and political posturing that preceded the extensions last July. We cannot calculate how much this will cost until we know how successful other measures are at bringing down unemployment. But the government should be prepared for expenditures in the range of $30 billion, comparable to the July extension.
15
Pollin, “Austerity is not a Solution” Forthcoming in Challenge, November/December 2010 Page 16 The Obama stimulus program made a $100 billion commitment over two years for investment in traditional transportation, water and energy-related infrastructure projects, and this level of spending needs to be maintained, through the recession and beyond. Assessments of the long-term infrastructure investment needs for the U.S. economy are in the range of $70 - $130 billion per year over the next 20 years. Federal clean-energy spending also needs to continue, at least in the $50 billion per year range. In particular, the federal government should undertake a three-year $150 billion program to retrofit public buildings throughout the country. This will generate 800,000 new jobs per year. The investments will pay for themselves in 3-4 years through gains in energy efficiency. President Obama’s proposal this past Labor Day to invest $50 billion in new transportation and infrastructure is certainly in the spirit of these proposals, though the amount is still too small on its own to provide a sufficient booster.
Preventing a Fiscal Train Wreck
This deficit hawk position focuses on the claim that, for a long time, government spending commitments, especially in the areas of pensions and health care, have been badly out of balance with revenue inflows. The hawks see this problem as prevalent both in the United States and Europe. From this perspective, the current crisis has just exacerbated deep structural problems that will only worsen even after the recession ends, unless serious adjustments are made now both in terms of spending commitments and taxes.
Certainly the most persistent advocate for this view within the U.S. is Pete Peterson, a retired Wall Street investment banker and former Nixon Commerce Secretary. Peterson has been warning of a U.S. fiscal train wreck for a generation, through a steady stream of books, starting in 1993 with Facing Up: How to Rescue the Economy from Crushing Debt and Restore the American Dream. The fact that the actual train wreck resulted not from fiscal imbalances but rather Wall Street hyper-speculation has not deterred him. For the present, Peterson does say he advocates modest short-term stimulus measures such as extending unemployment benefits. But his overriding message even for today is that “we cannot continue to ignore our gargantuan longer-term structural deficits. These deficits will soar even after our economy is strong again, and they are the real threat to America’s future,” (Wall Street Journal, 7/24/10.).
The Harvard historian Niall Ferguson has also been very vocal and widely cited in sharing Peterson’s sense of alarm. Citing projections from the Bank of International Settlement, Ferguson claims that, without “radical change in fiscal policy,” the federal government debt in the U.S. will explode to 450 percent of GDP as of 2040, from 36 percent as recently as 2007 and 64 percent projected for 2010. Ferguson adds that the comparable projections for Britain were worse before the Cameron government imposed austerity policies immediately on taking office. Indeed, Ferguson claims that the U.S. and British long-term business-as-usual debt projections for the U.S. today and Britain prior to Cameron’s austerity program looked worse than those for Greece, Portugal, Ireland, Italy, Greece and Spain, the European basket-cases collectively known
16

Pollin, “Austerity is not a Solution” Forthcoming in Challenge, November/December 2010 Page 17 as PIIGS. That is, according to Ferguson, the U.S. actually is on the path of very quickly resembling Greece (2010, p. 7).
Martin Feldstein is the most forthright among the exponents of this view in supporting austerity measures now, especially for the PIIGS and other weak European economies. Under ideal circumstances, Feldstein would favor delaying major spending cuts and tax increases until after a recovery is clearly underway. But he says that once the recession has ended, the sense of urgency that is needed for politicians to undertake austerity policies will be gone. Thus, Feldstein says that the long-term fiscal adjustments must be made now, even if means throwing some weaker economies into a double-dip recession. He writes that
“Unfortunately, the front-loaded deficit reductions may push economically weak countries into recession for the next year or two. This is the cost of achieving the needed long-term deficit reduction in the current economic and political environment. The countries are nevertheless right to accept that bitter medicine in order to get on the right longer term path” (Financial Times, 7/22/10).
No Alternative to Bitter Medicine?
In evaluating this deficit hawk perspective, it is helpful to begin with a simple, and I would assume uncontroversial, point. That is, if the economy can manage to enter into a sustained recovery rather than being pushed into a double-dip recession, the growing economy will itself generate major reductions in the deficit. This is because when unemployment rises in a double-dip recession, the government is faced with huge extra spending burdens through unemployment insurance, food stamps, Medicaid, and related social safety net commitments. Conversely, when people are newly employed, they can support themselves and pay more taxes. Research on this issue by Blanchard and Perotti (2002, p. 1335) finds that for the U.S. economy, a one percent increase in GDP will produce a combined improvement in the government’s fiscal situation of about 2.1 percent, including both increases in tax revenues and reductions in government transfer payments. Let us assume for the moment that Blanchard and Perotti’s estimates hold up as a recovery is sustained, including to the point where unemployment has fallen significantly. Under such circumstances, it follows that, without any increases in tax rates or cuts in spending programs, the U.S. fiscal deficit could probably be cut by $500 – 600 billion, if unemployment could be driven down to around 4 percent. In other words, full employment could itself go very far in controlling any long-term fiscal imbalances.
I have argued elsewhere that, within a 3-year time period, reaching a goal of four percent unemployment is actually realistic as well as obviously desirable (Pollin 2010). Still, the economic landscape is too cluttered with landmines to count on the attainment of near-full employment to close the long-term deficit gap by itself. It is therefore useful to consider the deficit forecasts over the next decade developed by the Congressional Budget Office (CBO) as a less optimistic framework for addressing the long-run fiscal situation.
17

Pollin, “Austerity is not a Solution” Forthcoming in Challenge, November/December 2010 Page 18
In its March 2010 forecast based on the Obama Administration’s proposed 2011 budget, the CBO estimates the fiscal deficit will average 5.2 percent of GDP for 2011-2020. This is based on the budgets and tax levels projected by the Obama Administration for the decade, and an average growth rate of GDP of about 3 percent, (which is the also the average rate for the 40-year period 1970 – 2009). This is obviously a huge decline in the deficits of 9.9 and 10.3 percent of GDP, and it is only modestly above the average deficit level over the full eight years of Ronald Reagan’s presidency.
But deficits at 5 percent of GDP are still also well above the average figure of around 2 percent of GDP over the post World War II era, including the Reagan years. But are long-term deficits at roughly 5 percent of GDP necessarily a problem? To answer this, it will be useful to briefly review some basic distinctions between cyclical and structural deficits, i.e. deficits that emerge through recessions versus those that occur over the course of a full business cycle. It is also helpful to distinguish deficits used to finance the government’s ongoing operations versus those devoted to productivity-enhancing capital investments.
To begin with, if the economy is operating at or near full employment, there is no longer any need to finance current expenditures through deficit spending. Indeed, over the course of the business cycle, the government’s operating budget should be held in approximate balance. We taxpayers should be committed to funding the government’s ongoing operations at high quality; and this entails everyone, including the affluent, paying their fair share of taxes on April 15. Running large structural deficits on operating budgets will likely be regressive, with government interest payments, funded by tax revenues coming primarily from the middle class, operating as transfer payments to wealthy bondholders and institutional investors, whether they be in New York, Tokyo, London or Beijing.
In an approximate full employment economy, the legitimate basis for maintaining a fiscal deficit is to finance long-term projects that will enhance the economy’s long-run productivity—such as infrastructure projects or investments to build a clean-energy economy. The appropriate level of deficit spending of this type should roughly correspond to the economy’s growth rate of productivity (appropriately defined—i.e. investments than move the economy off of carbon-emitting fossil fuels raise economy’s net rate of production of goods). The productivity increases, and corresponding rise of per capita GDP, would then generate the revenue increases to cover the added interest expenses in the government’s budget. Based on this principle, we should aim to maintain a structural deficit in the range of 2-3 percent of GDP.
Now of course, we need to recognize major ambiguities lurking amid these simple principles. For one, do we include educational spending—a major component of combined federal, state, and local government budgets—as part of current operations or (human) capital investments? What about capital expenditures for the military or health care equipment? There is also the huge matter of when the economy is actually operating at full employment—not just the
18
Pollin, “Austerity is not a Solution” Forthcoming in Challenge, November/December 2010 Page 19 rate at which inflation is likely to accelerate given existing institutional arrangements (i.e. the non-accelerating inflation rate of unemployment [NAIRU])?
All that said, it is reasonable to set as a target structural deficits within the range of 2-3 percent of GDP. It is therefore also appropriate to consider how, into the immediate and longer-term future, the U.S. structural deficit can be maintained within that range, as opposed to the five percent range projected by the CBO for 2011-2020 based on the Obama 2011 budget.
This level of long-term deficit reduction could be achieved through a combination of three major steps: cuts for the health care industry and the military as well as a tax on Wall Street speculative trading. We consider them in turn.
Health Care. The U.S. government is projected to spend about $800 billion in 2010 on Medicare and Medicaid, which amounts to 5.5 percent of GDP. The CBO projects this figure to rise to nearly $1.5 trillion or 6.6 percent of GDP by 2020. As was noted regularly during the recently concluded health care debates, the U.S. spends in total—including private spending as well as Medicare and Medicaid—about twice as much per person as other highly developed countries such as Canada, Japan and those in Western Europe on health care. This is while these other countries deliver universal health care coverage, longer life expectancies and generally more healthy populations. The problem with the U.S. health care system is that we spend far beyond other countries for drugs, expensive procedures, and especially insurance and administration. We also devote less attention to prevention.
When the Obama health care reform bill passed last April —the Patient Protection and Affordable Care Act aimed at controlling these costs—‘bending the health care cost curve downward’ was the often-stated goal. The bill that become law does have several worthy features, including the expansion of Medicare as well as subsidies for private health insurance. But it is a matter of spirited debate whether it will succeed in bending the cost curve downward. The CBO projections, to which we are referring here as our basic reference point, are pessimistic. However, the 2010 Medicare Trustees Report offers a much more favorable assessment, concluding that “The financial outlook for the Medicare program is substantially improved as a result of the far-reaching changes in the Patient Protection and Affordable Care Act,” (2010 Medicare Trustees Report, p. 8).
As of 2020, the Medicare Trustees estimate that the health care reform bill will generate a reduction in savings amounting to about 0.6 percent of GDP—that is, nearly $90 billion a year in today’s economy. Projecting further into 2080, the Trustees estimate that Obama reforms will reduce Medicaid costs massively, by more than 40 percent relative to GDP.
This is obviously not the place to adjudicate between the CBO and Medicare Trustee forecasting models. But these differences do underscore the highly tentative nature of any such projections. The Medicare Trustee findings do also highlight another point—that transforming
19
Pollin, “Austerity is not a Solution” Forthcoming in Challenge, November/December 2010 Page 20 the U.S. health care system so that it comes more closely into line with the other advanced economies can, almost by itself, bring the federal government’s structural deficit close to its historical level of around 2 percent of GDP.
However, let’s allow that because of the power of the private health insurance and drug companies, the idea of bringing the U.S. health care system fully in line with other advanced economies is unrealistic. It should nevertheless be reasonable to expect that we could achieve at least half the level of available savings through health care reform measures. These would include the recent Obama measures and any additional initiatives aimed especially at establishing controls on the drug and insurance industries. It is reasonable to expect that such savings could reduce the government’s annual structural deficit by about $150 billion.
Military Budget. The U.S. military budget rose from 3 percent of GDP at the end of the Clinton presidency to 4.3 percent at the end of Bush. Under the Obama administration’s proposed budget for 2011, military spending will total $733 billion, which is 4.9 percent of projected GDP. If we returned to the 2000 level of military spending relative to GDP, that alone would yield $285 billion in budgetary savings—that is, more than half the amount needed to bring the structural deficit within the historic range of 2 percent of GDP. Of course, as with health care, it may not be politically realistic to achieve that level of savings within the military budget, even while, only 10 years ago, that was precisely the level at which the U.S. military operated. But even within the range of what Washington insiders consider realistic, the Pentagon should be able to target around $140 billion in annual savings. This would still maintain a military budget at nearly $600 billion, or 4 percent of GDP. The administration has budgeted $160 billion for spending in Iraq and Afghanistan alone in 2011. But we should allow for major military savings there if Obama fulfills his pledge to end combat operations in both places by the end of 2011.
Financial trading tax. This would be a small sales tax on all financial transactions. The point of the tax would be to raise costs for short-term speculative traders while having a negligible impact on longer time-horizon ‘trade and hold’ market participants. Variations of this proposal have floated through Congress for more than 20 years. After the 1987 Wall Street crash, the idea of such a tax was endorsed by then House Speaker Jim Wright, then Senate Minority Leader Bob Dole, and even the first President Bush. The most recent proposal was introduced by Sen. Tom Harkin in December 2009. House Speaker Nancy Pelosi has offered a general endorsement for the idea.
In 1987, Speaker Wright proposed a trading tax rate of 0.5 percent for all stock sales. A viable tax structure could begin from this figure, along with a sliding scale on all other financial transactions. For example, the tax on a 50-year bond would be set as equal to the 0.5 percent rate on stocks, with the tax rates falling proportionally on bonds of shorter maturity (e.g. the tax rate on a 40-year bond would be 0.4 percent). Working within this framework, Dean Baker and I,
20
Pollin, “Austerity is not a Solution” Forthcoming in Challenge, November/December 2010 Page 21 along with colleagues, have estimated that this tax would raise approximately $350 billion per year if speculative trading did not decline at all after the tax was imposed (Pollin, Baker, and Schaberg 2003, Baker, Pollin, McArthur and Sherman 2009). But even if trading declined by 50 percent as a result of the tax, the government would still raise about $175 billion annually. And it would do so through discouraging the type of hyper-speculation on Wall Street that created the crisis in the first place.
Overall then, if we take high-end figures for revenues for a financial transaction along with savings from health care and military spending cost controls, we can get well above the roughly $450 billion needed to bring the structural deficit within two percent of GDP. But we can still achieve around $450 billion in total deficit reduction through much more modest assumptions about the generating revenue from a financial transaction tax and cost savings for health care and the military.
Additional measures could also be beneficial. One would be to raise taxes on the most affluent households, beginning with the simple act of allowing the Bush tax cuts for the rich to lapse. After all, the richest one percent of households received fully 52 percent of the economy’s total income gains from 1993-2008. Another significant potential source of revenue would be a carbon tax, along with closing all existing loopholes for the fossil fuel industry. These measures also provide obvious environmental benefits. In addition, we need not assume that the structural deficit has to continue at its historic average of around 2 percent, even if this is achievable. If we instead set the structural deficit target at around 3 percent of GDP, the amount of adjustment needed through the financial transaction tax, military budget and health care and other supplemental measures would then fall by one-third, to about $300 billion.
Could these cuts in military and health care spending themselves create unemployment, just as the economy is rebounding from the recession? This is possible, if the recovery remains weak over the next 2-3 years. However, the most effective way to address this concern is not to maintain wasteful levels of military and health-care spending, but rather accelerate the transition to a clean-energy economy. Per dollar of spending, clean-energy investments generate about 50 percent more jobs in the U.S. than military spending and three times more jobs than spending within the fossil fuels industry. This includes employment opportunities across all job categories and levels of educational credentials.
Finally, we need to consider what would happen with the structural deficit if something like the measures I am proposing are not implemented. Would we then face a fiscal train wreck which we can avoid only through implementing sharp cuts in Social Security and other areas of social expenditure? That is, what would happen if we ran structural deficits at roughly the 4-5 percent of GDP level that was maintained under the full eight years of Ronald Reagan’s presidency?
21

Pollin, “Austerity is not a Solution” Forthcoming in Challenge, November/December 2010 Page 22
Certainly few Republicans recall the Reagan economy as a period of near fiscal ruin. But it is fair to recognize that maintaining structural deficits indefinitely at Reagan-era levels is moving us into uncharted territory. For that reason alone, maintaining structural deficits at this level could be destabilizing. But it is also more broadly true that the economy will likely encounter severe difficulties anyway if we do not undertake strong measures to control hyper-speculation on Wall Street, through strong regulatory controls, including a financial transaction tax; if we continue to squander hundreds of billions of dollars on unnecessary wars; and if we continue spending more than twice as much per capita on health care as other industrialized countries to achieve inferior health outcomes. Thus, how we manage the federal government’s structural deficit should properly be seen as only one issue within this broader set of fundamental long-term economic challenges.
Austerity is not a Solution
Amid the various deficit-hawk arguments that we have reviewed, perhaps the least controversial is that, over the short-run, imposing austerity policies will create significant hardships for ordinary people. By definition, in the short-run, austerity policies mean high unemployment and cuts in health care, education, pensions, public safety and other social benefits. If fresh evidence were needed to settle the matter, we can observe what is happening now in Britain and Greece as a result of their austerity programs. Taking these negative short-run effects as givens, the serious debates begin when we then ask two questions: first, whether there are any viable alternatives to austerity in the short-run; and second, whether these short-run sacrifices will deliver substantial long-run benefits.
We have seen that the deficit hawks have not answered either of these two questions in ways that justify austerity policies now. This is despite the fact that, as we have reviewed, there are actually four separate analytic approaches within the broad deficit-hawk camp, with only one of the four needing to be convincing in order to establish an analytic foundation in support of austerity.
It is therefore fair to conclude that that the agenda for building a successful recovery should stay focused on measures to expand the economy now, not on austerity. Of course, the expansionary policies attempted thus far both in the U.S. and Europe have not been uniformly well-designed and successful in achieving their stated aims. For the U.S. case in particular, we have reviewed the ways in which the 2009 stimulus program was inadequate to the crisis at hand. But now is the time for mid-course corrections, not abandoning the expansionary agenda altogether.
In continuing along an expansionary path, we do need to be concerned about the issue of business confidence emphasized by deficit hawks, in particular that continuing large budget deficits will discourage businesses from making new investments that will create jobs. But there
22
Pollin, “Austerity is not a Solution” Forthcoming in Challenge, November/December 2010 Page 23 is no justification for ignoring other factors influencing business confidence, in particular, as last August’s report from the Bank of England emphasized, that austerity policies produce weak market conditions and correspondingly diminished profit opportunities. We also need to be equally vigilant about factors affecting business confidence that are either neglected or dismissed by the deficit hawks, in particular those associated with deflation.
The primary task now is to firm up the positive recovery program. This first of all means advancing credit market policies capable of ‘pulling on a string’—i.e. combining carrot and stick policies for banks and non-financial businesses that can unlock credit markets. Ben Bernanke has shown some willingness to pursue such policies with his statements last August that he is prepared for the Fed to purchase securities to drive down long-term rates, and to stop paying interest on the $1.1 trillion in private banks reserves at the Fed. But more aggressive measures, such as those I have sketched here, will almost certainly be necessary.
We are, today, far from having exhausted the available policy tools for pulling the economy out of the ditch in which it remains stuck. Austerity measures will only push us deeper into the ditch. A second round of expansionary initiatives will of course provide many opportunities for blundering and outright failure. But the prospects for success—as well as the probabilities for avoiding wrenching social dislocations—remain far greater than is possible through any version of an austerity agenda advanced by deficit hawks.
References
Alesina, Alberto and Silvia Ardagna (2010) “Large Changes in Fiscal Policy: Taxes versus Spending,” manuscript prepared for Tax Policy and the Economy 2009, http://www.economics.harvard.edu/faculty/alesina/files/Large%2Bchanges%2Bin%2Bfis cal%2Bpolicy_October_2009.pdf Baker, Dean, Robert Pollin, Travis McArthur and Matt Sherman (2009) “The Potential Revenue from Financial Transaction Taxes,” Joint Working Paper of Center for Economic and Policy Research and Political Economy Research Institute, #212, http://www.peri.umass.edu/fileadmin/pdf/working_papers/working_papers_201- 250/WP212.pdf Barro, Robert (2009) “Demand Side Voodoo Economics,” Economists’ Voice, 6:2, http://www.bepress.com/ev/vol6/iss2/art5/ Blanchard, Oliver and Roberto Perotti (2002) "An Empirical Characterization of the
Dynamic Effects of Changes in Government Spending and Taxes on Output" Quarterly Journal of Economics 117(4): 1329-68.
Blinder, Alan and Mark Zandi (2010) “How the Great Recession was Brought to an End,” http://www.economy.com/mark-zandi/documents/End-of-Great-Recession.pdf
23

Pollin, “Austerity is not a Solution” Forthcoming in Challenge, November/December 2010 Page 24
24
Ferguson, Niall (2010) “Fiscal Crises and Imperial Collapses: Historical Perspective on Current Predicaments,” Niarchos Lecture, Peterson Institute for International Economics, May 13, http://www.iie.com/publications/papers/niarchos-ferguson-2010.pdf Hemming, Richard, Richard Kell and Selma Mahfouz (2002) “The Effectiveness of Fiscal Policy in Stimulating Economic Activity—A Review of the Literature,” IMF Working Paper 02/208, http://cartac.org/Userfiles/file/L-5.1.pdf Jayadev, Arjun and Mike Konczal (2010), “The Boom not the Slump: The Right Time for Austerity,” Roosevelt Institute, http://www.newdeal20.org/wp- content/uploads/2010/08/not_the_time_for_austerity.pdf Pollin, Robert (2010) “18 Million Jobs by 2012), The Nation, March 8, http://www.thenation.com/article/18-million-jobs-2012 Pollin, Robert, Dean Baker and Marc Schaberg (2003) “Securities Transaction Taxes for U.S. Financial Markets,” Eastern Economic Journal, Fall, pp. 527-59.