augustin k. fosu un university-wider helsinki, finland2).pdf · augustin k. fosu un...
TRANSCRIPT

Taking the African Growth Process Forward:
Avoiding Policy Syndromes
Augustin K. FOSU
UN University-WIDER
Helsinki, Finland
For presentation at the African Union as part of the OECD-
DAC/China Event, “Enterprise Development and Economic
Transformation: Creating the Enabling Environment”
Addis Ababa, Ethiopia
16-17 February 2011
2
Outline
Introduction
The historical growth record
The recent growth evidence – Who is who?
Has recent growth been poverty-reducing?
Accounting for the growth record
History: Role of government and the Policy Syndromes
Policy Syndromes and the growth record
Whither governance?
Conclusion

3
Introduction
A growth story; but why should we be
concerned about growth?
Development requires high sustained (and
inclusive) growth
For SSA at least, high sustained growth requires
Growth acceleration
Avoidance of growth collapse
„SF-regime‟ crucial for the enabling environment
4
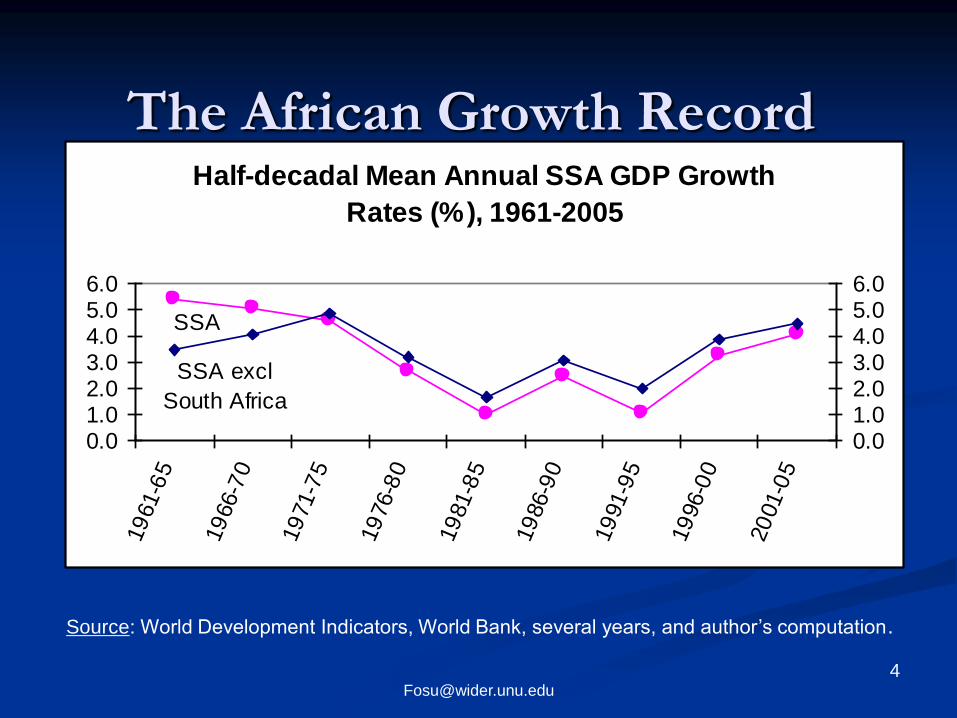
The African Growth Record
Source: World Development Indicators, World Bank, several years, and author’s computation.
Half-decadal Mean Annual SSA GDP Growth
Rates (%), 1961-2005
SSA
SSA excl
South Africa
0.01.02.03.04.05.06.0
19
61-6
5
19
66-7
0
19
71-7
5
19
76-8
0
19
81-8
5
19
86-9
0
19
91-9
5
19
96-0
0
20
01-0
5
0.01.02.03.04.05.06.0

5
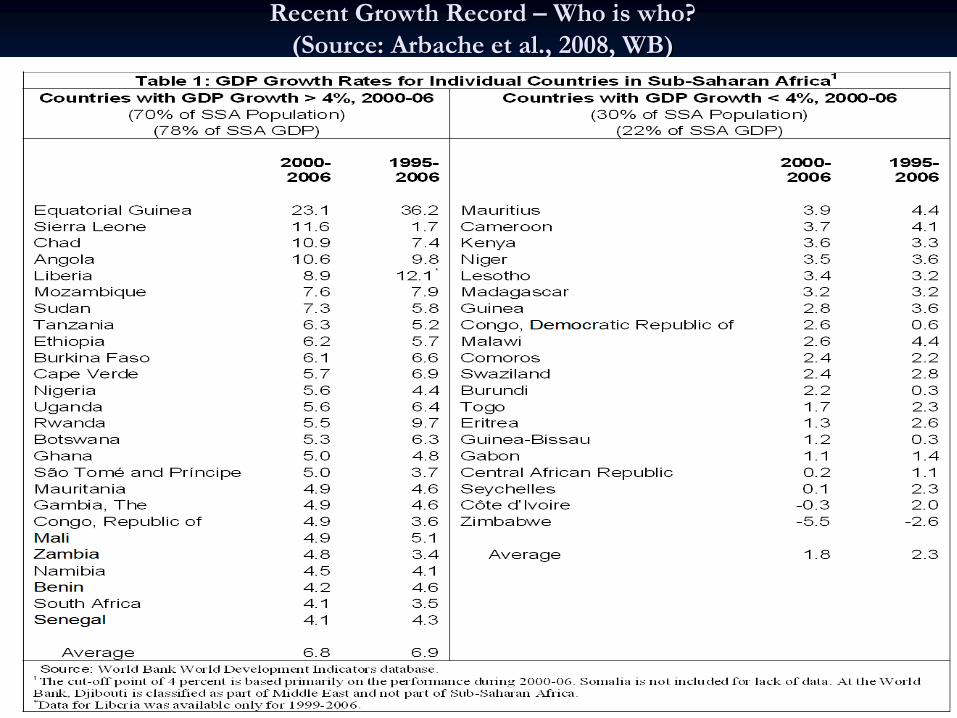
But there are country exceptions E.g., 1981-85 and 1991-95 (the really bad times!), there
were ‟good‟ performers (PC GDP growth ≥1.0 %):
1981-85 (12)
Benin; Botswana; Burkina Faso; Burundi; Cameroon;
Cape Verde; Chad; Comoros; Congo Republic; Guinea
Bissau; Mauritius; and Somalia.
Why? Exceptions due mainly to higher TOT
1991-95 (13)
Botswana; Burkina Faso; Cape Verde; Equatorial
Guinea; Eritrea; Ghana; Lesotho; Malawi; Mauritius;
Namibia; Seychelles; Sudan; and Uganda.
Why? High TOT for some but many under reforms (SAPs?)
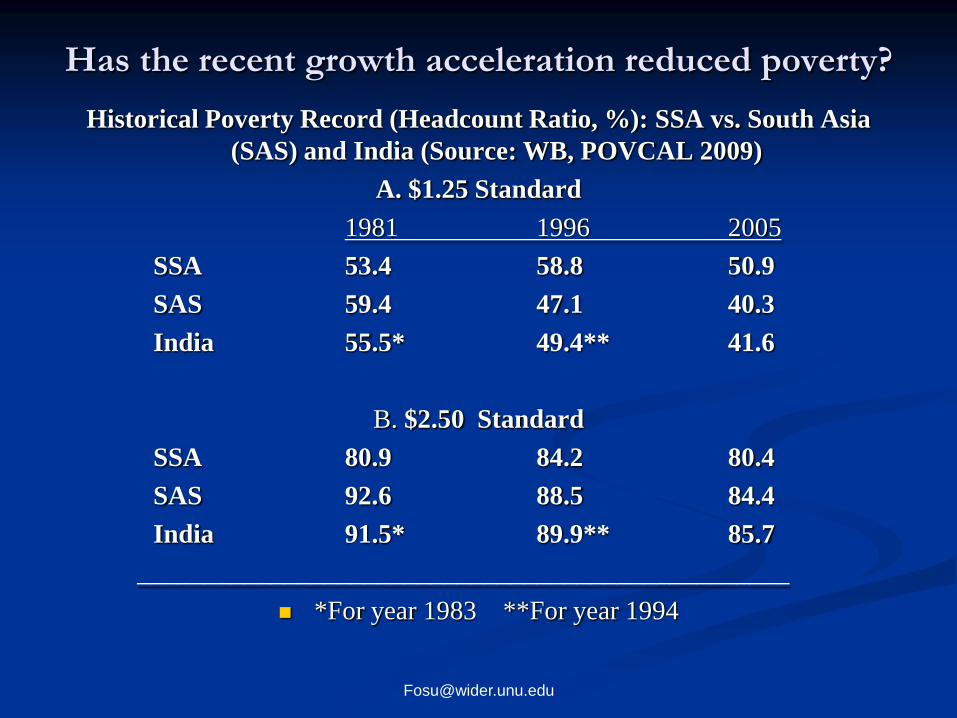
Has the recent growth acceleration reduced poverty?
Historical Poverty Record (Headcount Ratio, %): SSA vs. South Asia
(SAS) and India (Source: WB, POVCAL 2009)
A. $1.25 Standard
1981 1996 2005
SSA 53.4 58.8 50.9
SAS 59.4 47.1 40.3
India 55.5* 49.4** 41.6
B. $2.50 Standard
SSA 80.9 84.2 80.4
SAS 92.6 88.5 84.4
India 91.5* 89.9** 85.7
_________________________________________________
*For year 1983 **For year 1994

8
Accounting for Real GDP Growth per Worker
(%)Growth Contribution to Growth
Period Physical Capital Education Residual*
______
1960-64 1.33 0.53 0.12 0.68
1965-69 1.74 0.80 0.20 0.75
1970-74 2.33 1.05 0.22 1.06
1975-79 0.19 0.74 0.24 -0.79
1980-84 -1.70 0.16 0.29 -2.16
1985-89 0.45 -0.22 0.34 0.33
1990-94 -1.74 -0.08 0.30 -1.95
1995-00 1.51 -0.12 0.26 1.37
Total 0.51 0.36 0.25 -0.09
* Used as measure of (growth in) total factor productivity (TFP)
9
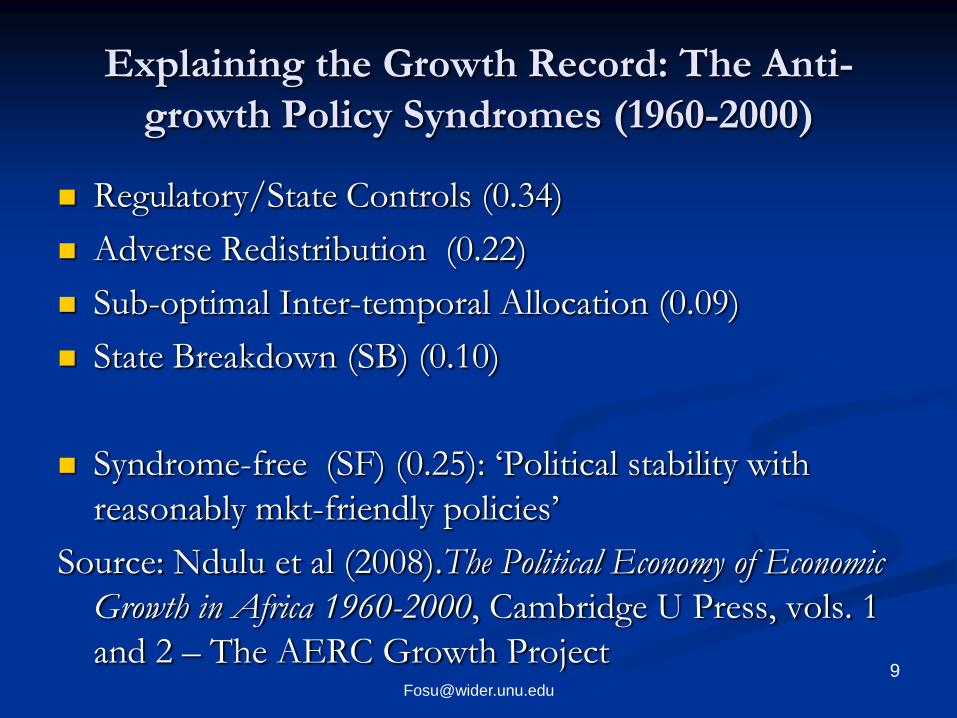
Explaining the Growth Record: The Anti-
growth Policy Syndromes (1960-2000)
Regulatory/State Controls (0.34)
Adverse Redistribution (0.22)
Sub-optimal Inter-temporal Allocation (0.09)
State Breakdown (SB) (0.10)
Syndrome-free (SF) (0.25): „Political stability with
reasonably mkt-friendly policies‟
Source: Ndulu et al (2008).The Political Economy of Economic
Growth in Africa 1960-2000, Cambridge U Press, vols. 1
and 2 – The AERC Growth Project
10
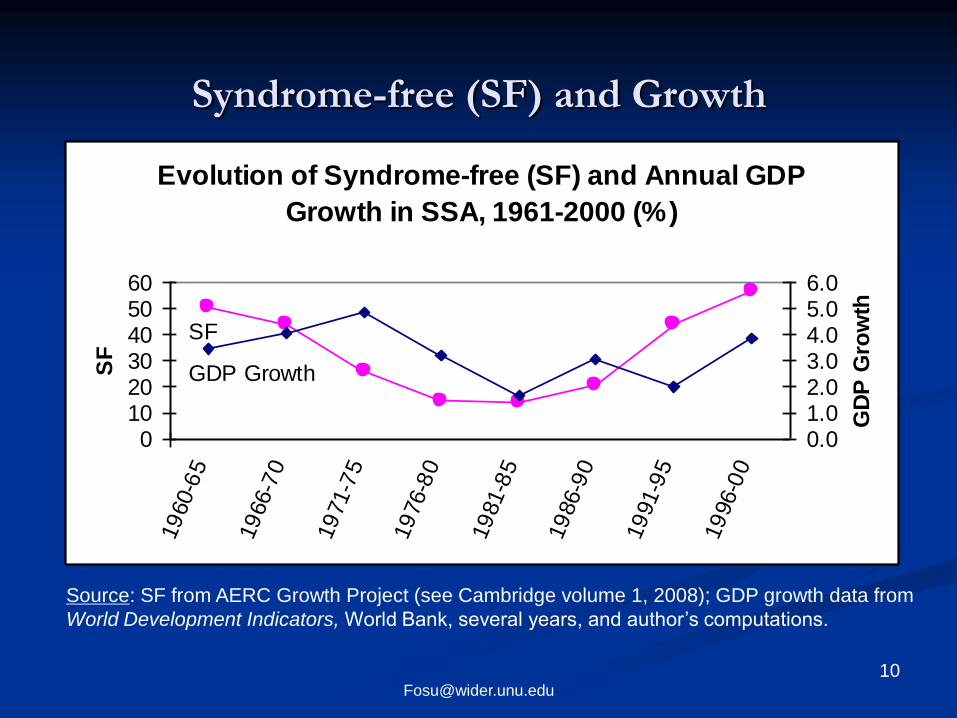
Syndrome-free (SF) and Growth
Source: SF from AERC Growth Project (see Cambridge volume 1, 2008); GDP growth data from
World Development Indicators, World Bank, several years, and author’s computations.
Evolution of Syndrome-free (SF) and Annual GDP
Growth in SSA, 1961-2000 (%)
SF
GDP Growth
0102030405060
19
60-6
5
19
66-7
0
19
71-7
5
19
76-8
0
19
81-8
5
19
86-9
0
19
91-9
5
19
96-0
0
SF
0.01.02.03.04.05.06.0
GD
P G
row
th
11
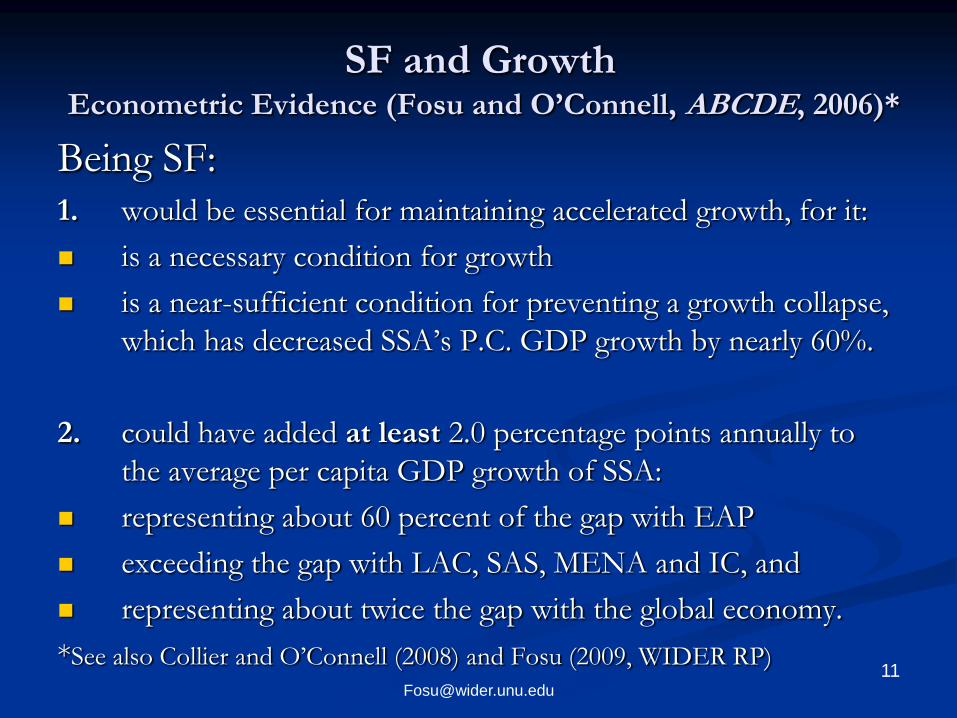
SF and GrowthEconometric Evidence (Fosu and O’Connell, ABCDE, 2006)*
Being SF:
1. would be essential for maintaining accelerated growth, for it:
is a necessary condition for growth
is a near-sufficient condition for preventing a growth collapse,
which has decreased SSA‟s P.C. GDP growth by nearly 60%.
2. could have added at least 2.0 percentage points annually to
the average per capita GDP growth of SSA:
representing about 60 percent of the gap with EAP
exceeding the gap with LAC, SAS, MENA and IC, and
representing about twice the gap with the global economy.
*See also Collier and O‟Connell (2008) and Fosu (2009, WIDER RP)
12
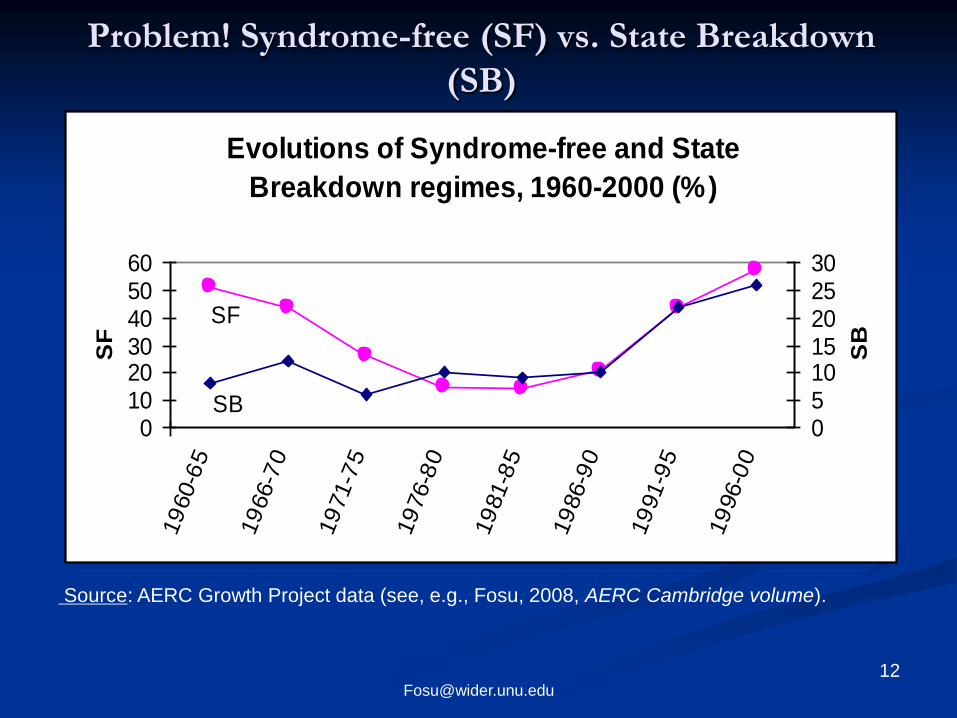
Problem! Syndrome-free (SF) vs. State Breakdown
(SB)
Source: AERC Growth Project data (see, e.g., Fosu, 2008, AERC Cambridge volume).
Evolutions of Syndrome-free and State
Breakdown regimes, 1960-2000 (%)
SF
SB0
102030405060
19
60-6
5
19
66-7
0
19
71-7
5
19
76-8
0
19
81-8
5
19
86-9
0
19
91-9
5
19
96-0
0
SF
051015202530
SB
13
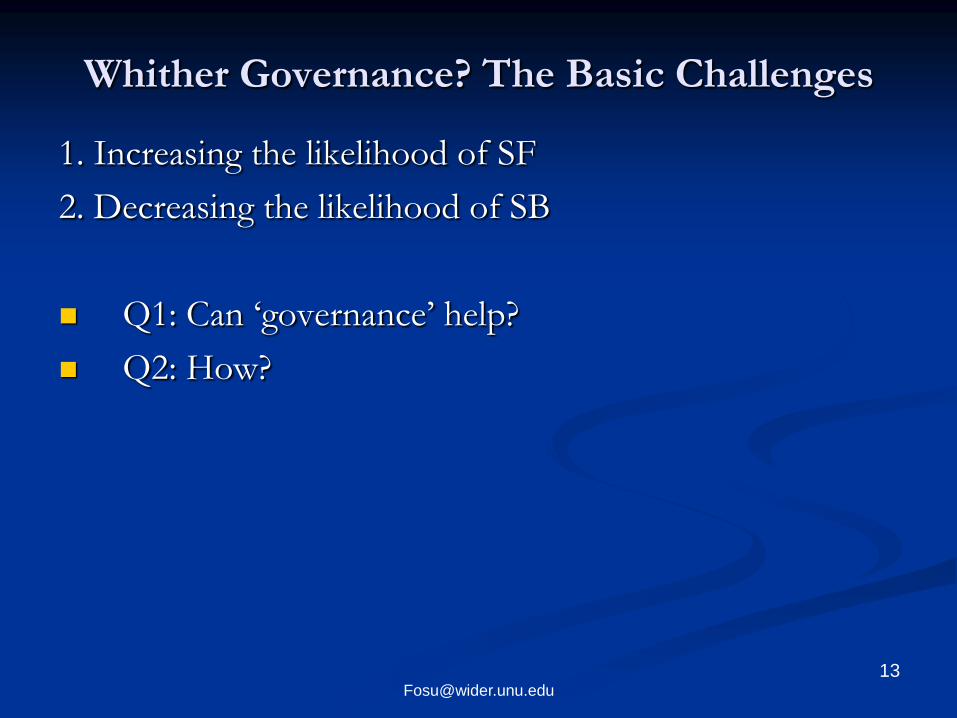
Whither Governance? The Basic Challenges
1. Increasing the likelihood of SF
2. Decreasing the likelihood of SB
Q1: Can „governance‟ help?
Q2: How?

14
Q1: Can Governance help?
(e.g., XCONST is more positively
correlated with SF than with growth)
Evolutions of Syndrome-free (SF) and Executive
Constraints (XC), 1960-2004
SFSF
XCXC
0102030405060
1960
-65
1966
-70
1971
-75
1976
-80
1981
-85
1986
-90
1991
-95
1996
-00
2001
-04
SF
(%
)
1.0
2.0
3.0
4.0
XC

15
Q2: How can Governance help?1. A Principal-Agent Problem
2. Solving the Problem
Accountability
3. Political contestability an appropriate mechanism for
accountability? Yes, via corruption↓, but XCONST most
critical for ‟developmental governance‟ (Alence, JMAS, 2004)
4. XCONST can increase SF independently or via mitigating the
negative effect of ethnicity on SF (Fosu, 2009, CSAE)
5. Democracy and growth in Africa
Good and Bad news: Increasing index of electoral
competitiveness has a U-shape relationship with GDP growth
in Africa (Fosu, Economics Letters, 2008)
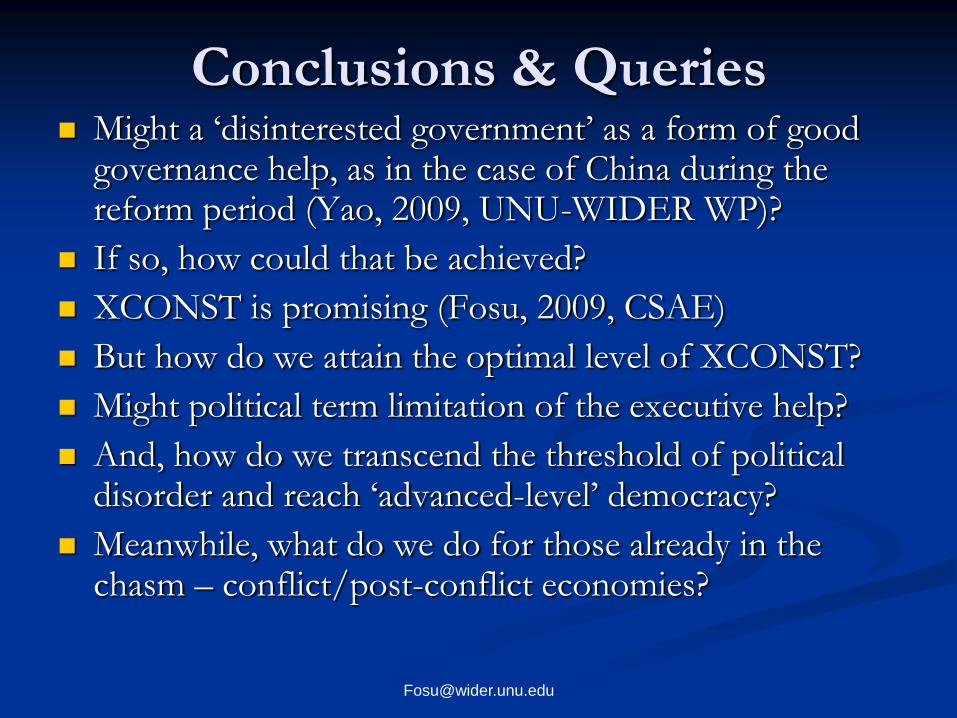
Conclusions & Queries Might a „disinterested government‟ as a form of good
governance help, as in the case of China during the reform period (Yao, 2009, UNU-WIDER WP)?
If so, how could that be achieved?
XCONST is promising (Fosu, 2009, CSAE)
But how do we attain the optimal level of XCONST?
Might political term limitation of the executive help?
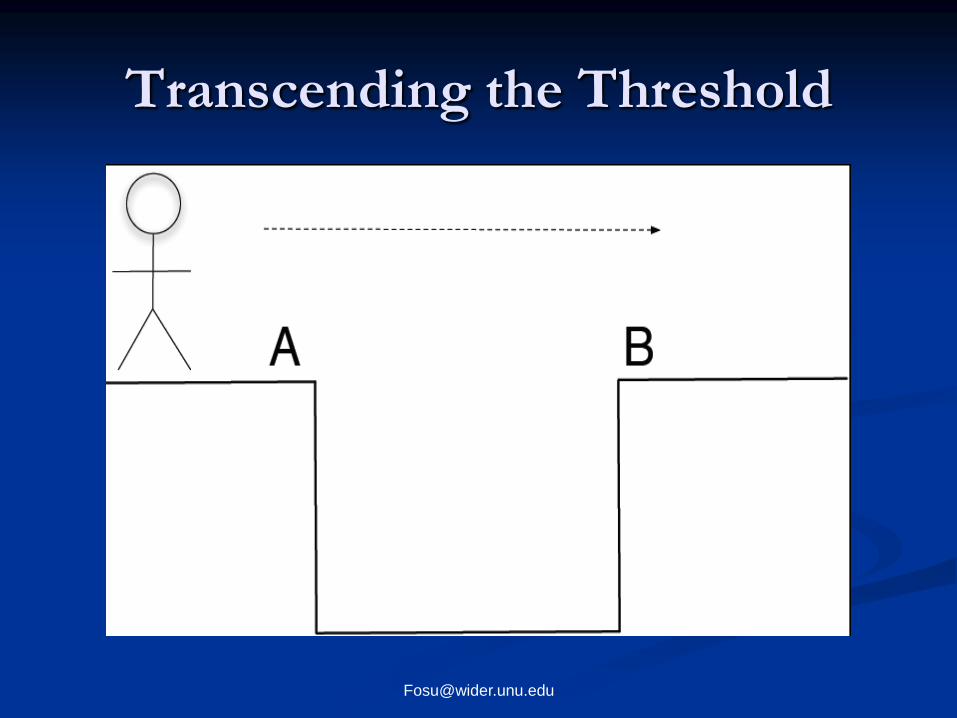
And, how do we transcend the threshold of political disorder and reach „advanced-level‟ democracy?
Meanwhile, what do we do for those already in the chasm – conflict/post-conflict economies?