aug 18 - 22, 2014
TRANSCRIPT
8/9/2019 AUG 18 - 22, 2014
http://slidepdf.com/reader/full/aug-18-22-2014 1/17
WEEKLY TECHNICAL NOTE
AUGUST 18 - 22, 2014
CONSOLIDATIONS ON THE DAILY CHARTS
____________________________________________________________
Consolidations have been the most common patterns seen across the Currency Market
in recent months this year. This has reflected the low liquidity and volatility that has
been largely attributed to the low interest policies of the major Central Banks. What
this means is that trading opportunities based on nice, clear and long trends have been
few and far between. It is therefore important that we keep an eye out for these
Consolidations, spot them early, analyze them accurately and then trade them based
on our trading rules.
This Technical Note will assist you in trading them by focusing on 4 aspects of
Consolidations;
I. WHERE CONSOLIDATIONS ARE FORMED
II. IDENTIFYING THE START OF CONSOLIDATIONS
III. THE MAJOR CANDLESTICK ENTRY SIGNALS
IV. DETERMINING WHETHER THE DAILY OR 4H CHART IS
CONTROLS THE CONSOLIDATION
8/9/2019 AUG 18 - 22, 2014
http://slidepdf.com/reader/full/aug-18-22-2014 2/17
I. WHERE CONSOLIDATIONS ARE FORMED
NORMAL CONSOLIDATIONS
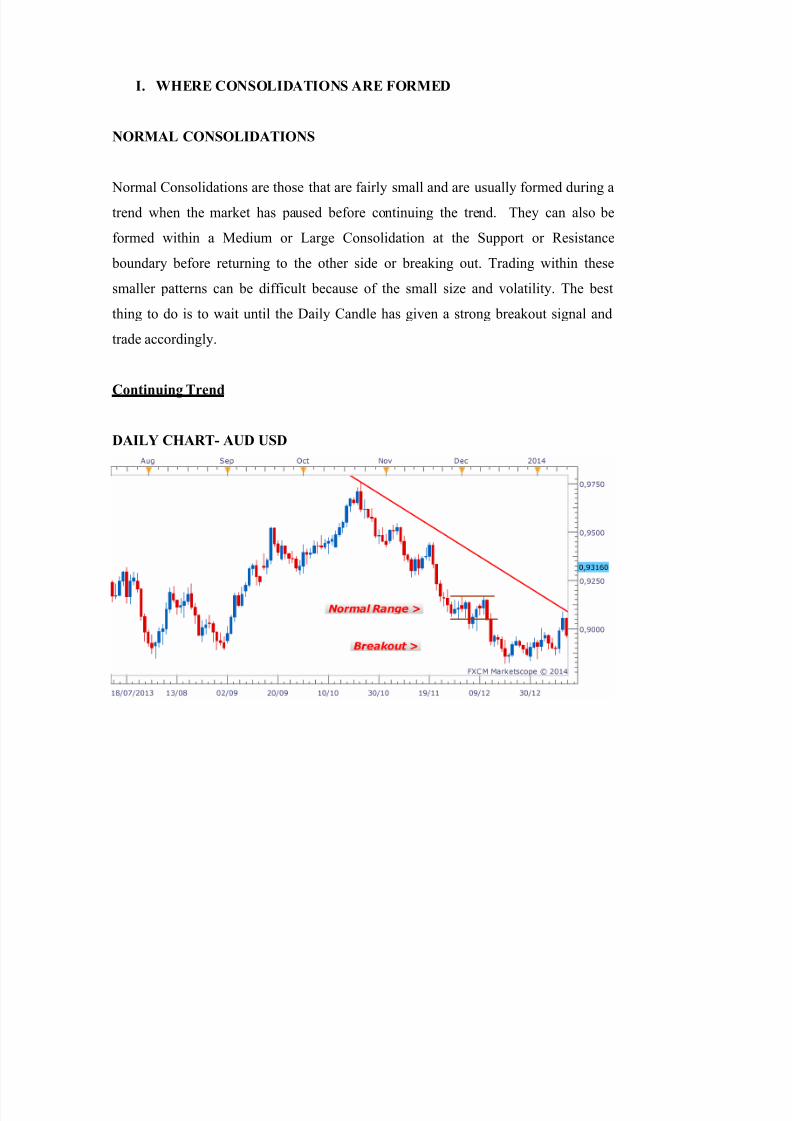
Normal Consolidations are those that are fairly small and are usually formed during a
trend when the market has paused before continuing the trend. They can also be
formed within a Medium or Large Consolidation at the Support or Resistance
boundary before returning to the other side or breaking out. Trading within these
smaller patterns can be difficult because of the small size and volatility. The best
thing to do is to wait until the Daily Candle has given a strong breakout signal and
trade accordingly.
Continuing Trend
DAILY CHART- AUD USD
8/9/2019 AUG 18 - 22, 2014
http://slidepdf.com/reader/full/aug-18-22-2014 3/17
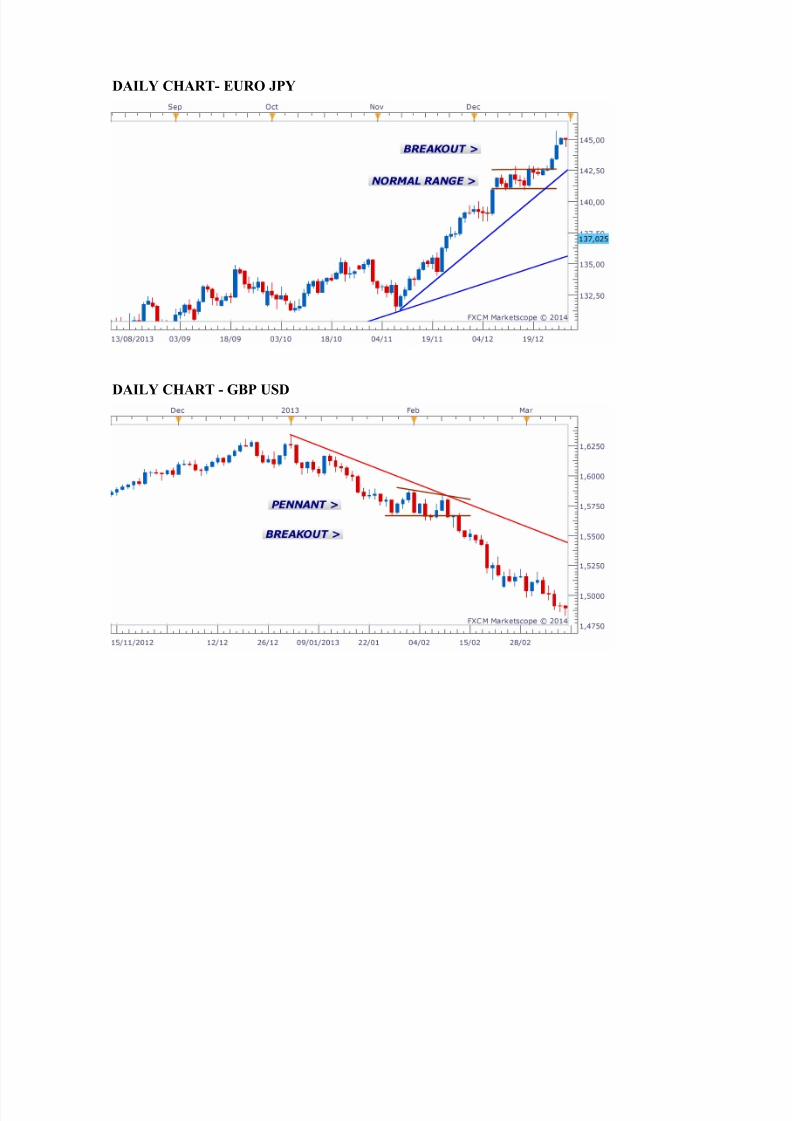
DAILY CHART- EURO JPY
DAILY CHART - GBP USD
8/9/2019 AUG 18 - 22, 2014
http://slidepdf.com/reader/full/aug-18-22-2014 4/17
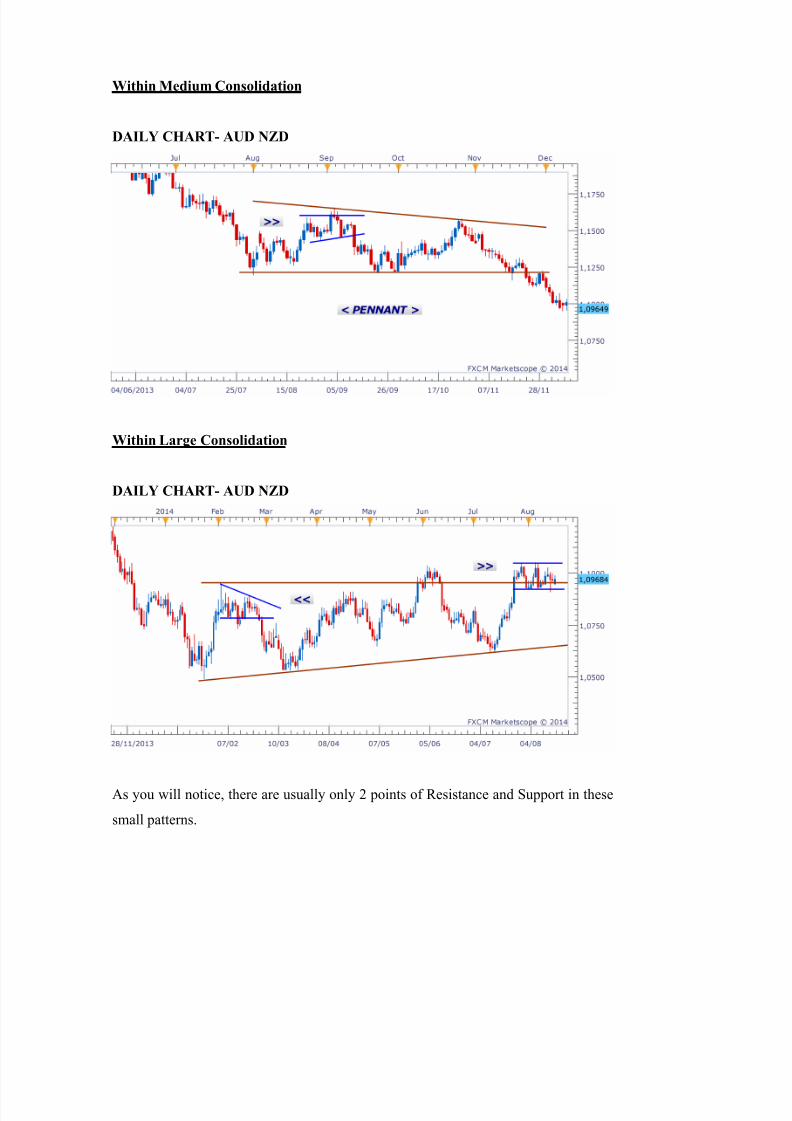
Within Medium Consolidation
DAILY CHART- AUD NZD
Within Large Consolidation
DAILY CHART- AUD NZD
As you will notice, there are usually only 2 points of Resistance and Support in these
small patterns.
8/9/2019 AUG 18 - 22, 2014
http://slidepdf.com/reader/full/aug-18-22-2014 5/17
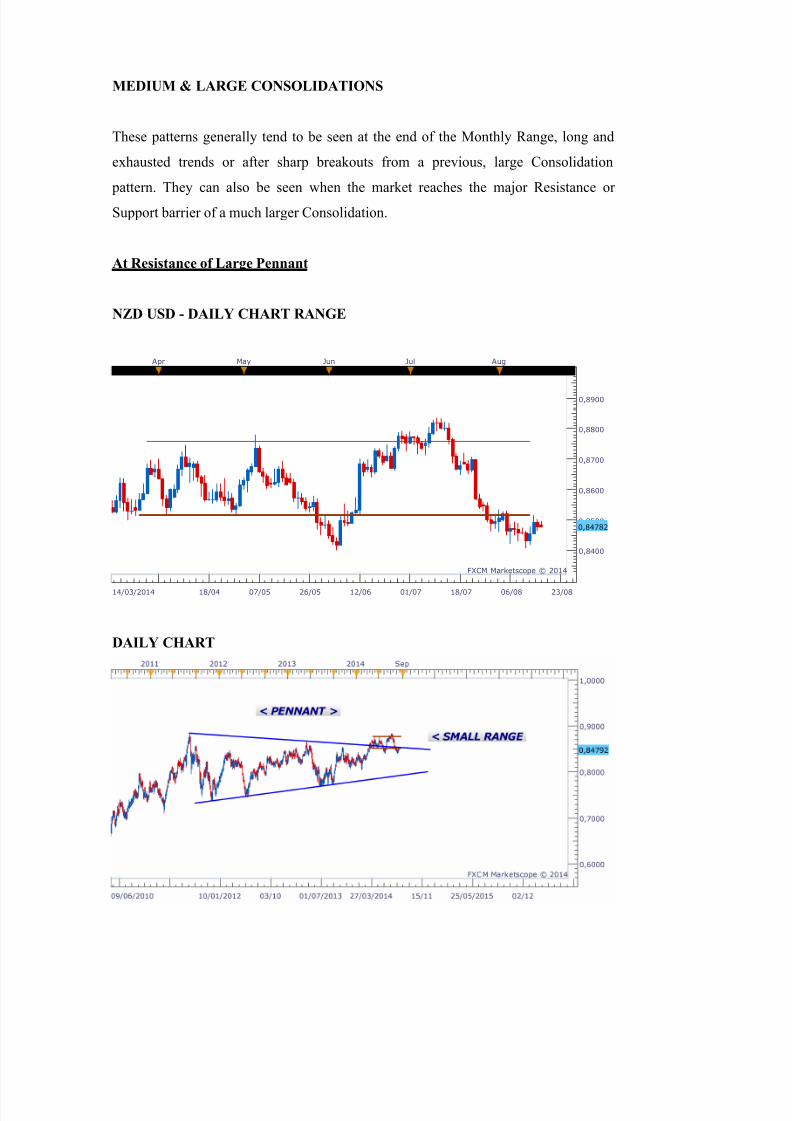
MEDIUM & LARGE CONSOLIDATIONS
These patterns generally tend to be seen at the end of the Monthly Range, long and
exhausted trends or after sharp breakouts from a previous, large Consolidation
pattern. They can also be seen when the market reaches the major Resistance or
Support barrier of a much larger Consolidation.
At Resistance of Large Pennant
NZD USD - DAILY CHART RANGE
0,8400
0,8500
0,8600
0,8700
0,8800
0,8900
14/03/2014 18/04 07/05 26/05 12/06 01/07 18/07 06/08 23/08
Apr May Jun Jul Aug
FXCM Marketscope © 2014
0,84782
DAILY CHART
8/9/2019 AUG 18 - 22, 2014
http://slidepdf.com/reader/full/aug-18-22-2014 6/17
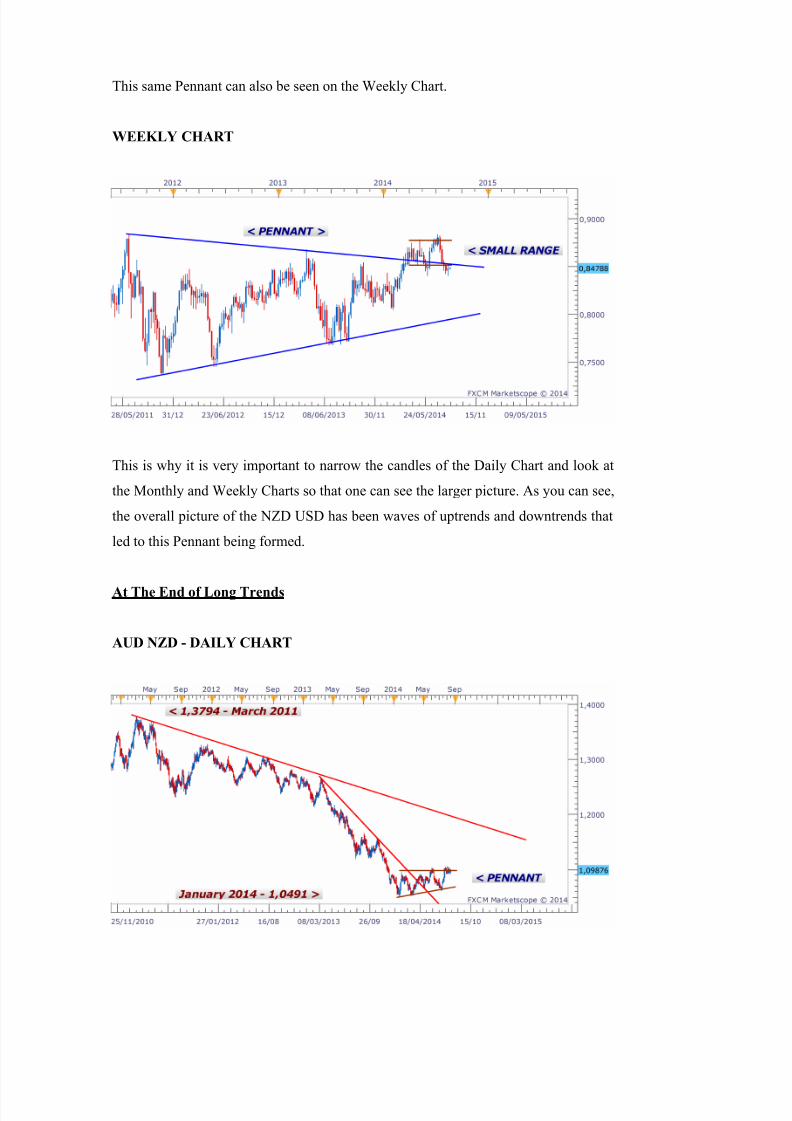
This same Pennant can also be seen on the Weekly Chart.
WEEKLY CHART
This is why it is very important to narrow the candles of the Daily Chart and look at
the Monthly and Weekly Charts so that one can see the larger picture. As you can see,
the overall picture of the NZD USD has been waves of uptrends and downtrends that
led to this Pennant being formed.
At The End of Long Trends
AUD NZD - DAILY CHART
8/9/2019 AUG 18 - 22, 2014
http://slidepdf.com/reader/full/aug-18-22-2014 7/17
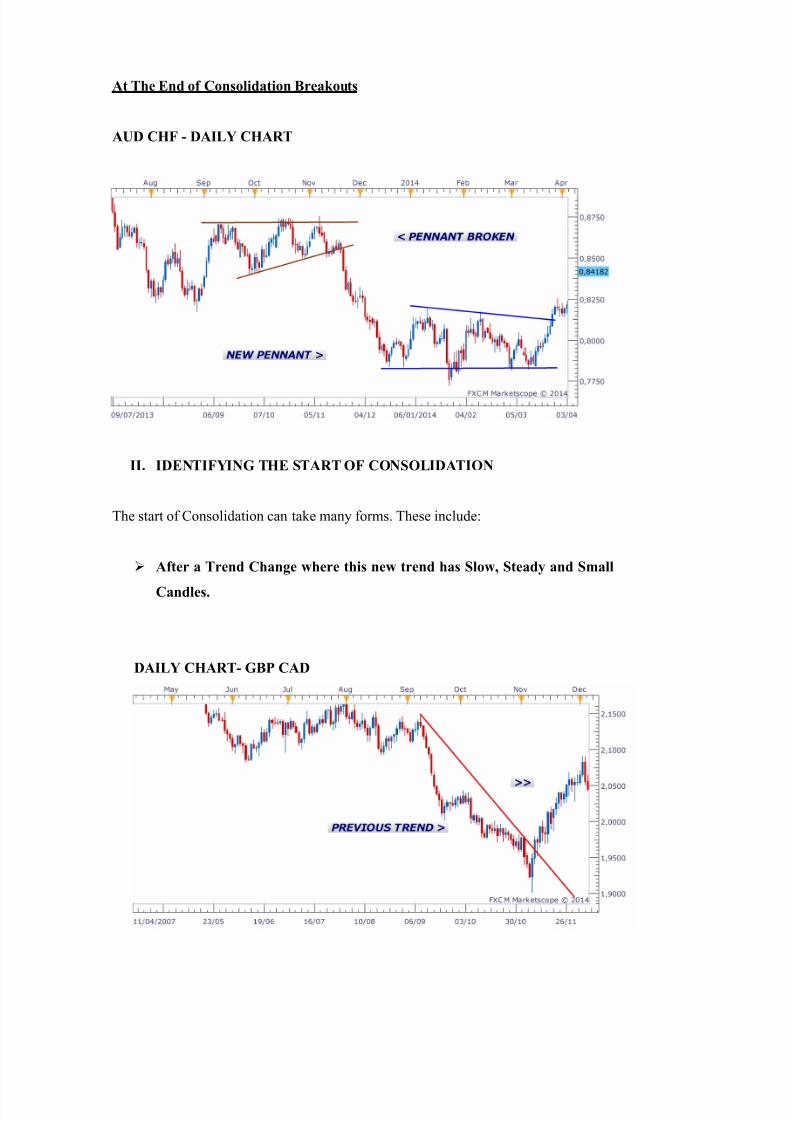
At The End of Consolidation Breakouts
AUD CHF - DAILY CHART
II. IDENTIFYING THE START OF CONSOLIDATION
The start of Consolidation can take many forms. These include:
After a Trend Change where this new trend has Slow, Steady and Small
Candles.
DAILY CHART- GBP CAD
8/9/2019 AUG 18 - 22, 2014
http://slidepdf.com/reader/full/aug-18-22-2014 8/17
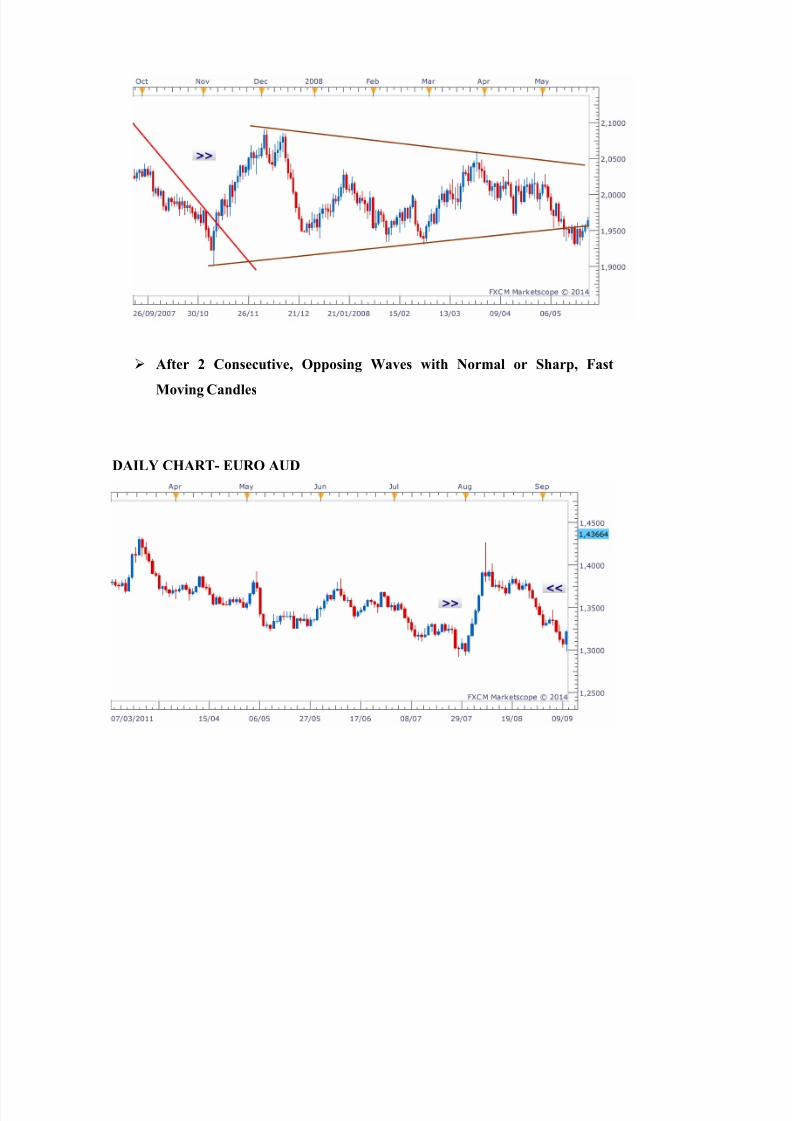
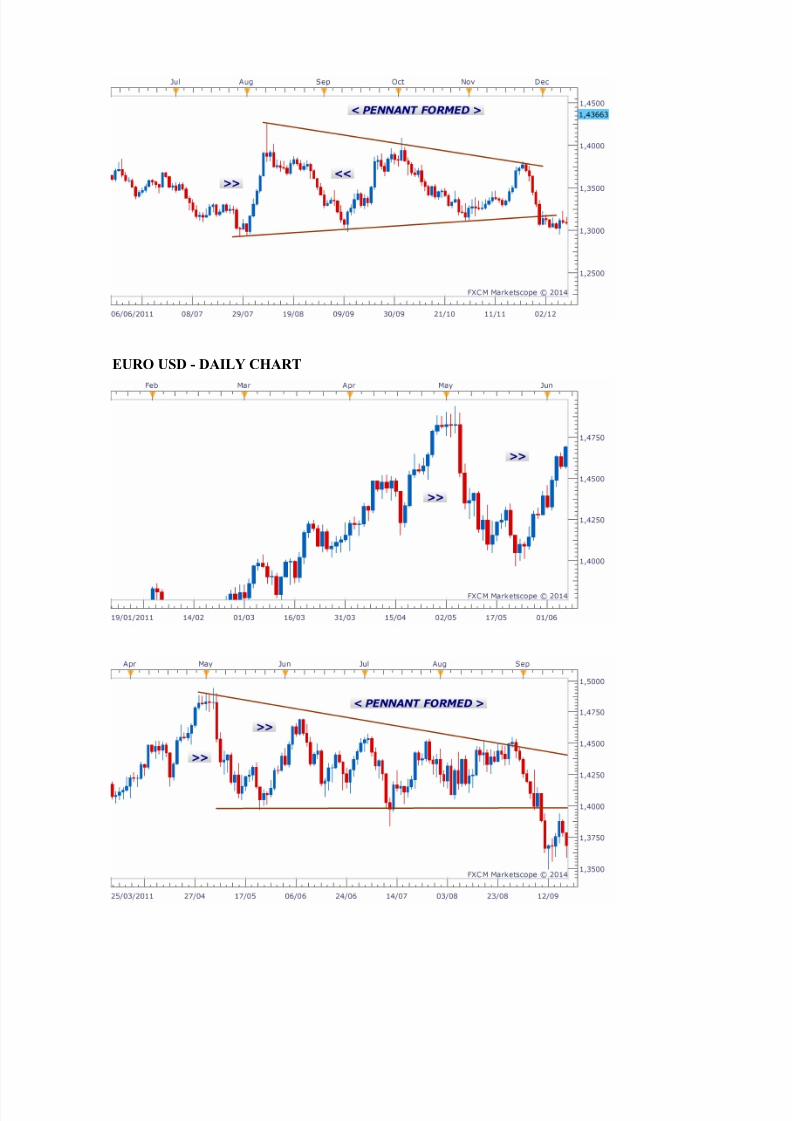
After 2 Consecutive, Opposing Waves with Normal or Sharp, Fast
Moving Candles
DAILY CHART- EURO AUD
8/9/2019 AUG 18 - 22, 2014
http://slidepdf.com/reader/full/aug-18-22-2014 9/17
EURO USD - DAILY CHART
8/9/2019 AUG 18 - 22, 2014
http://slidepdf.com/reader/full/aug-18-22-2014 10/17
In most of these situations, the length of each wave is close to the Weekly Range of
the Currency Pair. You will also notice on some of these waves, the movement to the
other side is smooth, with consecutive candles while others are more volatile with
spikes. Usually the ones that have smooth, normal candles have the best setups and
signals.
V. THE MAJOR CANDLESTICK ENTRY SIGNALS
After identifying these Consolidations, we will then have to be able to spot the strong
signals that allow us to trade within these patterns from profit. The main signals that
you will see on both the Daily and 4 Hour Charts are;
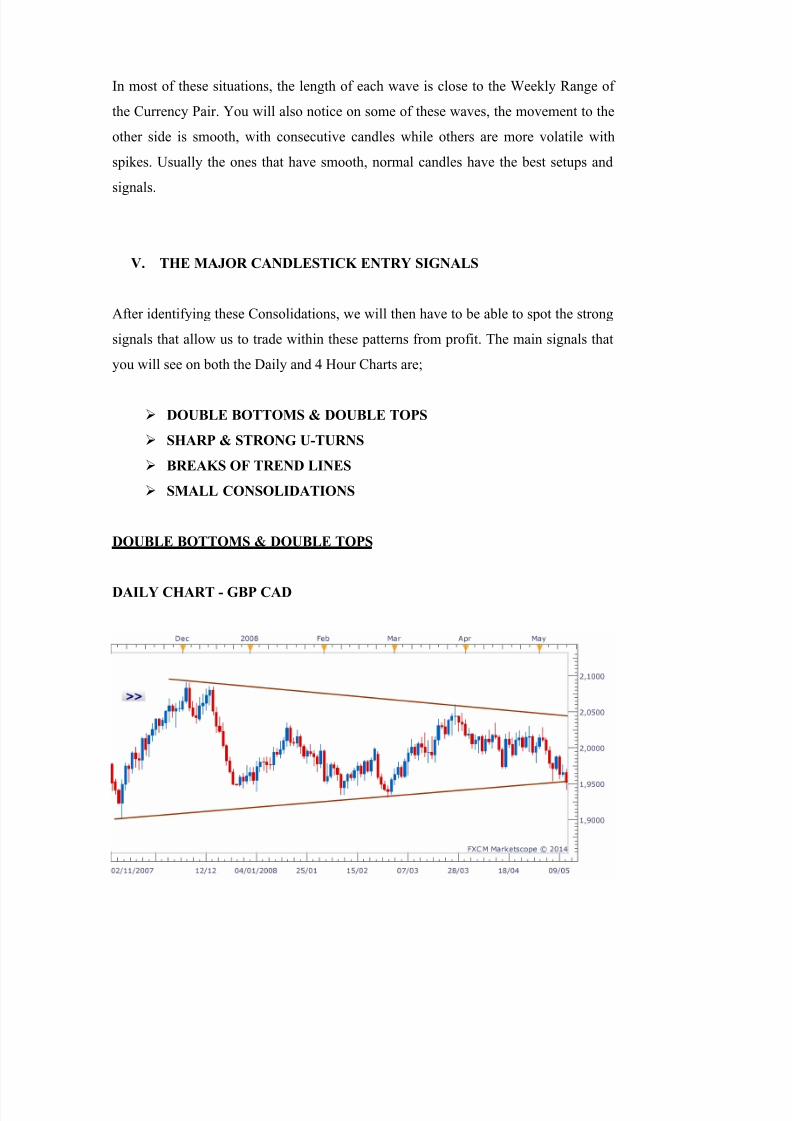
DOUBLE BOTTOMS & DOUBLE TOPS
SHARP & STRONG U-TURNS
BREAKS OF TREND LINES
SMALL CONSOLIDATIONS
DOUBLE BOTTOMS & DOUBLE TOPS
DAILY CHART - GBP CAD

8/9/2019 AUG 18 - 22, 2014
http://slidepdf.com/reader/full/aug-18-22-2014 11/17
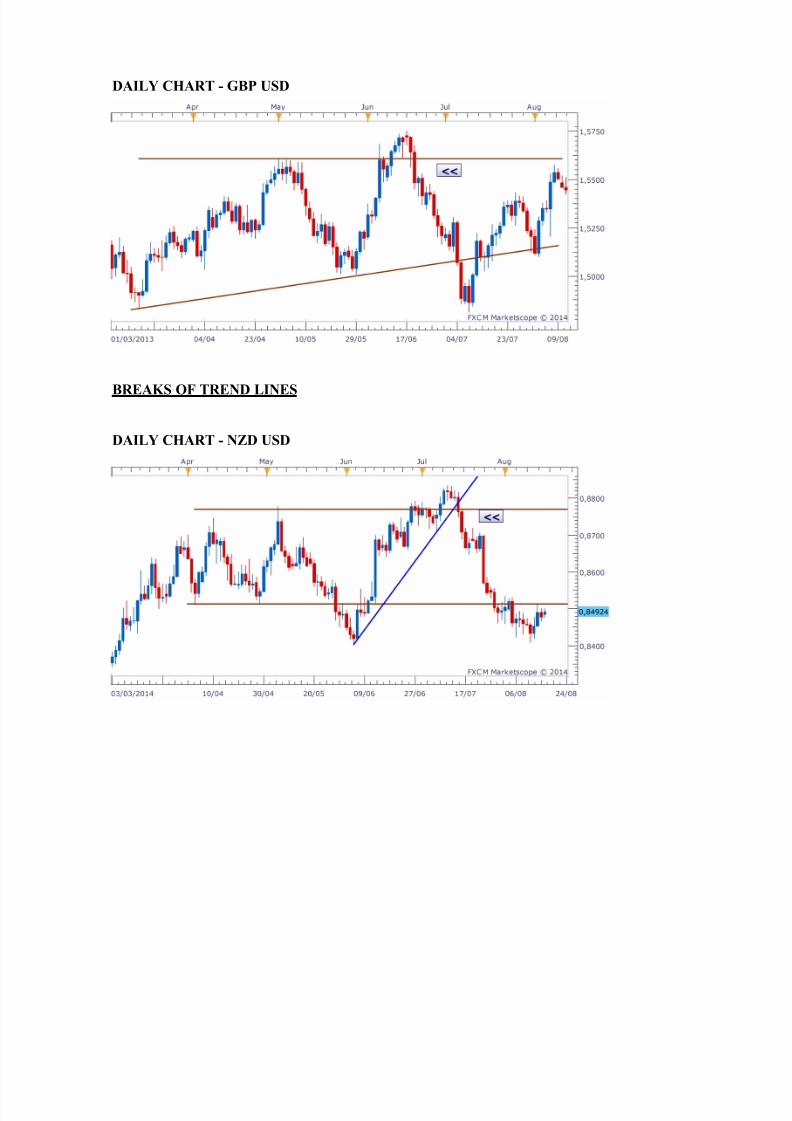
DAILY CHART - GBP USD
SHARP & STRONG U-TURNS
DAILY CHART - EURO AUD
8/9/2019 AUG 18 - 22, 2014
http://slidepdf.com/reader/full/aug-18-22-2014 12/17
DAILY CHART - GBP USD
BREAKS OF TREND LINES
DAILY CHART - NZD USD
8/9/2019 AUG 18 - 22, 2014
http://slidepdf.com/reader/full/aug-18-22-2014 13/17
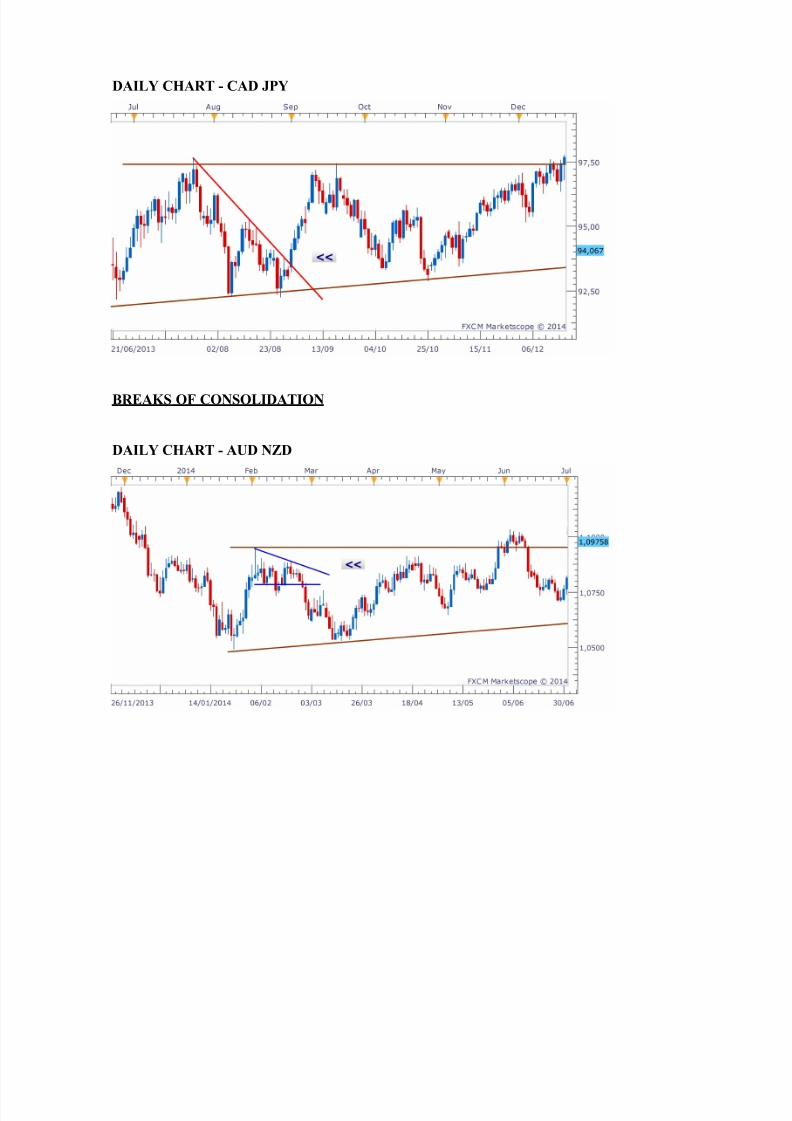
DAILY CHART - CAD JPY
BREAKS OF CONSOLIDATION
DAILY CHART - AUD NZD
8/9/2019 AUG 18 - 22, 2014
http://slidepdf.com/reader/full/aug-18-22-2014 14/17
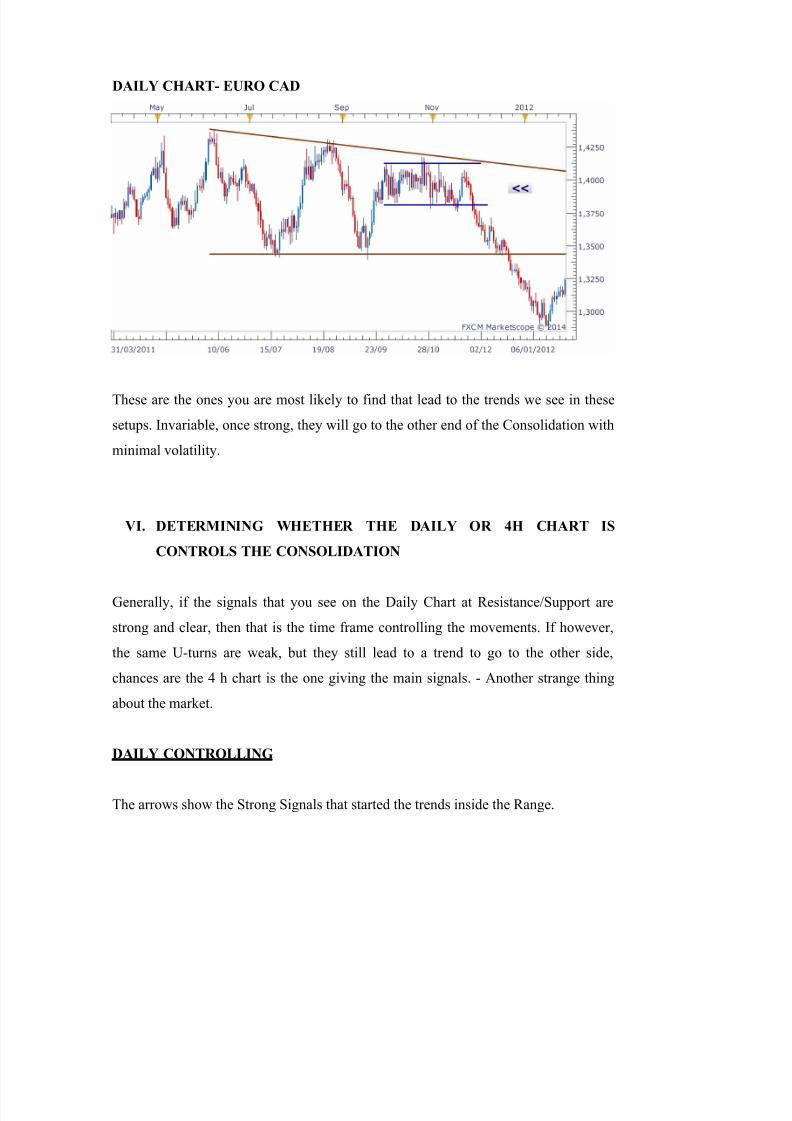
DAILY CHART- EURO CAD
These are the ones you are most likely to find that lead to the trends we see in these
setups. Invariable, once strong, they will go to the other end of the Consolidation with
minimal volatility.
VI. DETERMINING WHETHER THE DAILY OR 4H CHART IS
CONTROLS THE CONSOLIDATION
Generally, if the signals that you see on the Daily Chart at Resistance/Support are
strong and clear, then that is the time frame controlling the movements. If however,
the same U-turns are weak, but they still lead to a trend to go to the other side,
chances are the 4 h chart is the one giving the main signals. - Another strange thing
about the market.
DAILY CONTROLLING
The arrows show the Strong Signals that started the trends inside the Range.
8/9/2019 AUG 18 - 22, 2014
http://slidepdf.com/reader/full/aug-18-22-2014 15/17
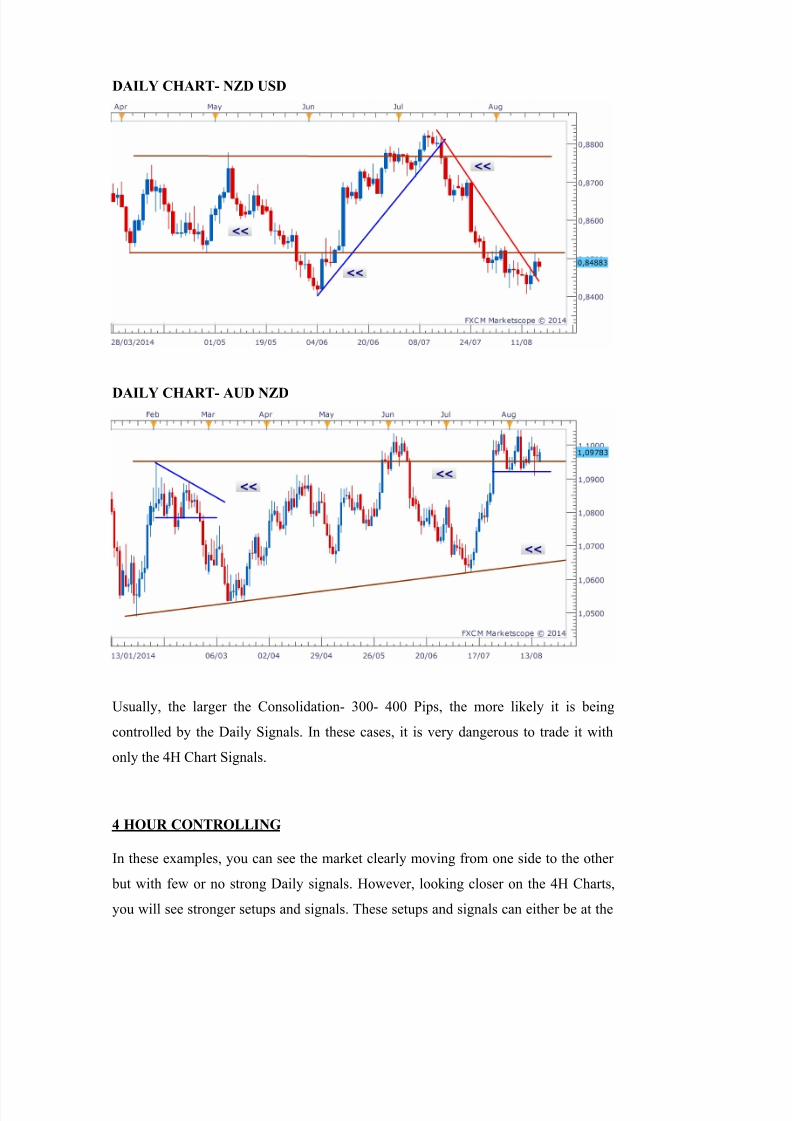
DAILY CHART- NZD USD
DAILY CHART- AUD NZD
Usually, the larger the Consolidation- 300- 400 Pips, the more likely it is being
controlled by the Daily Signals. In these cases, it is very dangerous to trade it with
only the 4H Chart Signals.
4 HOUR CONTROLLING
In these examples, you can see the market clearly moving from one side to the other
but with few or no strong Daily signals. However, looking closer on the 4H Charts,
you will see stronger setups and signals. These setups and signals can either be at the

8/9/2019 AUG 18 - 22, 2014
http://slidepdf.com/reader/full/aug-18-22-2014 16/17
start or mid-way the Range/Pennant. Usually it is sufficient for the Daily Chart to
have started a U-turn without necessarily giving a strong signal.
DAILY CHART- EURO NZD
1,5500
1,5750
1,6000
1,6250
1,6500
15/01/2014 05/02 21/02 11/03 27/03 14/04 30/04 16/05 03/06
Feb Mar Apr May Jun
FXCM Marketscope © 2014
1,57778
4 HOUR CHART
8/9/2019 AUG 18 - 22, 2014
http://slidepdf.com/reader/full/aug-18-22-2014 17/17
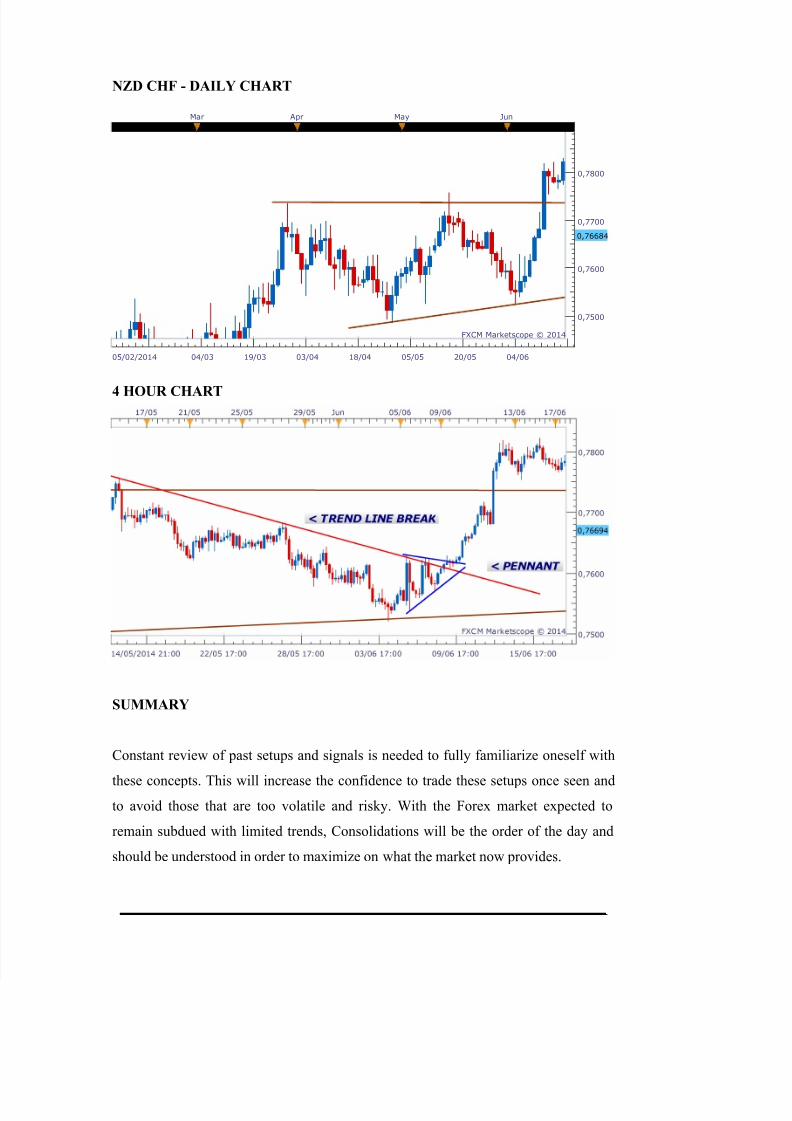
NZD CHF - DAILY CHART
0,7500
0,7600
0,7700
0,7800
05/02/2014 04/03 19/03 03/04 18/04 05/05 20/05 04/06
Mar Apr May Jun
FXCM Marketscope © 2014
0,76684
4 HOUR CHART
SUMMARY
Constant review of past setups and signals is needed to fully familiarize oneself with
these concepts. This will increase the confidence to trade these setups once seen andto avoid those that are too volatile and risky. With the Forex market expected to
remain subdued with limited trends, Consolidations will be the order of the day and
should be understood in order to maximize on what the market now provides.
___________________________________________________________________