audit of usaid’s financial
TRANSCRIPT

Office of Inspector General, U.S. Agency for International Development
OFFICE OF INSPECTOR GENERAL U.S. Agency for International Development
Audit of USAID’s Financial Statements for Fiscal Years 2018 and 2017
AUDIT REPORT 0-000-19-001-C DECEMBER 17, 2018
1300 Pennsylvania Avenue NW • Washington, DC 20523 https://oig.usaid.gov 202-712-1150

Office of Inspector General, U.S. Agency for International Development
The Office of Inspector General provides independent oversight that promotes the efficiency, effectiveness, and integrity of foreign assistance provided through the entities under OIG’s jurisdiction: the U.S. Agency for International Development, U.S. African Development Foundation, Inter-American Foundation, Millennium Challenge Corporation, and Overseas Private Investment Corporation.
Report waste, fraud, and abuse USAID OIG Hotline Email: [email protected] Complaint form: https://oig.usaid.gov/complainant-select Phone: 202-712-1023 or 800-230-6539 Mail: USAID OIG Hotline, P.O. Box 657, Washington, DC 20044-0657

Office of Inspector General, U.S. Agency for International Development Washington, DC https://oig.usaid.gov
MEMORANDUM
DATE: December 17, 2018
TO: USAID, Chief Financial Officer, Reginald W. Mitchell.
FROM: Assistant Inspector General for Audit, Thomas E. Yatsco /s/ .
SUBJECT: Audit of USAID’s Financial Statements for Fiscal Years 2018 and 2017 (0-000-19-001-C)
This memorandum transmits the final report on our audit of USAID’s financial statements for fiscal years 2018 and 2017. The Government Management Reform Act of 1994, Public Law 103–356, requires USAID to prepare consolidated financial statements for each fiscal year. Office of Management and Budget (OMB) Circular A–136, “Financial Reporting Requirements,” requires USAID to submit a Performance and Accountability Report or an Agency Financial Report, including audited financial statements, to OMB, Congress, and the Government Accountability Office. USAID has prepared an Agency Financial Report with an agency head message, management’s discussion and analysis, an “other information” section, and a financial section. OIG is responsible for auditing the Agency’s financial statements and preparing the independent auditor’s report, which appears in the financial section.
OIG has issued unmodified opinions on each of USAID’s principal financial statements for fiscal years 2018 and 2017.
With respect to internal control, we identified one deficiency that we consider a material weakness and three deficiencies that we consider significant deficiencies. The material weakness pertains to USAID’s process for reconciling its Fund Balance With Treasury account with the U.S. Department of the Treasury. The significant deficiencies pertain to USAID’s processes for (1) reconciling intragovernmental transactions, (2) maintaining adequate records of property, plant, and equipment, and (3) complying with Federal accounting standards for reimbursable agreements.
Regarding compliance, in doing tests required under section 803(a) of the Federal Financial Management Improvement Act of 1996 (FFMIA), Public Law 104-208, we found no instances of substantial noncompliance with Federal financial management system requirements, but one

instance that did not comply with Federal accounting standards and the U.S. Standard General Ledger at the transaction level.
The report contains two recommendations to improve USAID’s internal control. After reviewing information you provided in response to the draft report, we consider the recommendations resolved but open pending completion of planned activities.
For these recommendations please provide evidence of final action to the Audit Performance and Compliance Division.
We appreciate the assistance you and your staff extended to us during this audit.

Office of Inspector General, U.S. Agency for International Development
CONTENTS INTRODUCTION .............................................................................................................................. 1
SUMMARY ............................................................................................................................................ 1
BACKGROUND ................................................................................................................................. 1
INDEPENDENT AUDITOR’S REPORT ........................................................................................ 2
Report on the Financial Statements ........................................................................................... 2
Management’s Responsibility for the Financial Statements ................................................... 2
Auditor’s Responsibility ................................................................................................................ 2
Opinion ............................................................................................................................................. 3
Other Matters ................................................................................................................................. 3
REPORT ON INTERNAL CONTROL .......................................................................................... 5
Internal Control Over Financial Reporting ............................................................................... 5
Material Weakness ......................................................................................................................... 6
Significant Deficiencies ................................................................................................................... 7
The Agency’s Response to Audit Findings ............................................................................. 11
Purpose of This Report .............................................................................................................. 12
REPORT ON COMPLIANCE WITH APPLICABLE PROVISIONS OF LAWS, REGULATIONS, CONTRACTS, AND GRANT AGREEMENTS. ....................................... 13
Compliance With the Federal Financial Management Improvement Act of 1996 ........ 13
Purpose of This Report .............................................................................................................. 14
OIG RESPONSE TO AGENCY COMMENTS. ......................................................................... 15
APPENDIX A. SCOPE AND METHODOLOGY ..................................................................... 16
APPENDIX B. AGENCY COMMENTS ...................................................................................... 18
APPENDIX C. STATUS OF PRIOR-YEAR FINDINGS AND RECOMMENDATIONS .. 20
Status of 2017 Findings and Recommendations.................................................................... 20
Status of 2016 Findings and Recommendations.................................................................... 20
Status of 2014 Findings and Recommendations.................................................................... 20
Status of 2012 Findings and Recommendations.................................................................... 21
APPENDIX D. FINANCIAL STATEMENTS .............................................................................. 22
APPENDIX E. MAJOR CONTRIBUTORS TO THIS REPORT ............................................. 23

Office of Inspector General, U.S. Agency for International Development 1
INTRODUCTION The financial statements of USAID reflect and evaluate the Agency’s execution of its mission—promoting U.S. foreign policy interests in expanding democracy, growing free markets, and extending a helping hand to those working to improve their lives or to recover from disasters. USAID receives most of its funding from general Government funds administered by the U.S. Department of the Treasury and appropriated by Congress. For the fiscal year ended September 30, 2018, USAID reported total budgetary resources of approximately $31 billion.
The Office of Inspector General (OIG) performed this audit to determine whether USAID’s principal financial statements presented fairly the assets, liabilities, net position, net costs, changes in net position, and budgetary resources for fiscal years 2018 and 2017.
SUMMARY USAID’s consolidated balance sheets, consolidated statements of net cost, consolidated statements of changes in net position, and combined statements of budgetary resources present fairly, in all material respects, the financial position of USAID as of September 30, 2018 and 2017, and its net cost, net position, and budgetary resources for the years then ended, in conformity with accounting principles generally accepted in the United States of America. We identified one deficiency in internal control that we consider a material weakness, related to USAID’s process for reconciling its Fund Balance With Treasury account with the U.S. Department of the Treasury, and three significant deficiencies in internal control related to USAID’s processes for (1) reconciling intragovernmental transactions, (2) maintaining adequate records of property, plant, and equipment, and (3) complying with Federal accounting standards for reimbursable agreements. We identified no instances of substantial noncompliance with Federal financial management system requirements, but one instance that did not comply with Federal accounting standards and the U.S. Standard General Ledger (USSGL) at the transaction level.
We make two recommendations to improve USAID’s internal control.
BACKGROUND The Government Management Reform Act of 1994, Public Law 103-356, requires USAID to submit audited financial statements to the Office of Management and Budget (OMB) annually. Accordingly, for fiscal year 2018, USAID has prepared the following:
• Consolidated Balance Sheet
• Consolidated Statement of Net Cost
• Consolidated Statement of Changes in Net Position
• Combined Statement of Budgetary Resources

Office of Inspector General, U.S. Agency for International Development 2
• Notes to the Principal Financial Statements
• Required Supplementary Information
In our opinion, the financial statements referred to above present fairly, in all material respects and in conformity with accounting principles generally accepted in the United States of America, USAID’s assets, liabilities, net position, net costs, changes in net position, and budgetary resources as of September 30, 2018 and 2017, and for the years then ended.
In accordance with Government Auditing Standards,1 OIG has also issued reports, dated December 17, 2018, on its consideration of USAID’s internal control over financial reporting and on its tests of USAID’s compliance with certain provisions of laws, regulations, contracts and grant agreements. These reports are an integral part of an overall audit conducted in accordance with Government Auditing Standards and should be read in conjunction with the independent auditor’s report.
INDEPENDENT AUDITOR’S REPORT
Report on the Financial Statements
We have audited the accompanying consolidated financial statements of USAID, which comprise the consolidated balance sheets as of September 30, 2018 and 2017, and the related consolidated statements of net cost, consolidated statements of changes in net position, and combined statements of budgetary resources for the years then ended, and the related notes to the financial statements.
Management’s Responsibility for the Financial Statements
Management is responsible for the preparation and fair presentation of these financial statements in accordance with accounting principles generally accepted in the United States of America; this includes the design, implementation, and maintenance of internal control relevant to the preparation and fair presentation of consolidated financial statements that are free from material misstatement, whether due to fraud or error.
Auditor’s Responsibility
Our responsibility is to express an opinion on these consolidated financial statements based on our audits. We conducted our audits in accordance with auditing standards generally accepted in the United States of America; generally accepted government auditing standards issued by the Comptroller General of the United States; and OMB Bulletin 19-01, “Audit Requirements for Federal Financial Statements.” Those standards and OMB Bulletin No. 19-01 require that we plan and perform the audit to obtain
1 U.S. Government Accountability Office (GAO-12-331G), December 2011 revision.

Office of Inspector General, U.S. Agency for International Development 3
reasonable assurance about whether the consolidated financial statements are free from material misstatement.
An audit involves performing procedures to obtain audit evidence about the amounts and disclosures in the consolidated financial statements. The procedures selected depend on the auditor’s judgment, including the assessment of the risk of material misstatement of the consolidated financial statements, whether due to fraud or error. In making those risk assessments, the auditor considers internal control relevant to the agency’s preparation and fair presentation of the consolidated financial statements in order to design audit procedures that are appropriate in the circumstances, but not for the purpose of expressing an opinion on the effectiveness of the agency’s internal control. Accordingly, we express no such opinion. An audit also includes evaluating the appropriateness of accounting policies used and the reasonableness of significant accounting estimates made by management, as well as evaluating the overall presentation of the consolidated financial statements.
We believe that the audit evidence we have obtained is sufficient and appropriate to provide a basis for our audit opinion.
Opinion
In our opinion, the consolidated financial statements referred to above present fairly, in all material respects, the financial position of USAID as of September 30, 2018 and 2017, and its net costs, changes in net position, and budgetary resources for the years then ended in accordance with U.S. generally accepted accounting principles.
Other Matters
Required Supplementary Information
U.S. generally accepted accounting principles issued by the Federal Accounting Standards Advisory Board (FASAB) require that the Required Supplementary Information (RSI) be presented to supplement the financial statements. Although the RSI is not a part of the financial statements, FASAB considers this information to be an essential part of financial reporting for placing the financial statements in appropriate operational, economic, or historical context. We have applied certain limited procedures to the RSI in accordance with U.S. generally accepted government auditing standards, which consisted of inquiries of management about the methods of preparing the RSI and comparing the information for consistency with management’s responses to the auditor’s inquiries, the financial statements, and other knowledge we obtained during the audit of the financial statements, in order to report omissions or material departures from FASAB guidelines, if any, identified by these limited procedures. We did not audit and we do not express an opinion or provide any assurance on the RSI because the limited procedures we applied do not provide sufficient evidence to express an opinion or provide any assurance.

Office of Inspector General, U.S. Agency for International Development 4
Other Information
Our audits were conducted to form an opinion on the basic consolidated financial statements as a whole. The information in the About This Report section, the USAID At A Glance section, the Message from the Administrator, the Message from the Chief Financial Officer, the Other Information section, and the appendixes in the Agency Financial Report is presented for the purpose of additional analysis and is not a required part of the basic consolidated financial statements. This information was not subjected to the auditing procedures applied in the audit of the basic consolidated financial statements; accordingly, we do not express an opinion or provide any assurance on it.
Other Reporting Required by Government Auditing Standards.
In accordance with Government Auditing Standards, we have also issued reports dated December 17, 2018, on our consideration of USAID’s internal control over financial reporting and our tests of its compliance with certain provisions of laws, regulations, contracts, and grant agreements. These reports are an integral part of an audit performed in accordance with Government Auditing Standards and should be read in conjunction with this report.
USAID Office of Inspector General /s/ December 17, 2018

Office of Inspector General, U.S. Agency for International Development 5
REPORT ON INTERNAL CONTROL
We have audited the accompanying consolidated financial statements of USAID, which comprise the consolidated balance sheets as of September 30, 2018 and 2017, and the related consolidated statements of net cost, consolidated statements of changes in net position, and combined statements of budgetary resources for the years then ended, and the related notes to the financial statements, and have issued our report thereon, dated December 17, 2018.
Internal Control Over Financial Reporting
In planning and performing our audits of USAID’s financial statements for the fiscal years ended September 30, 2018 and 2017, we considered USAID’s internal control over financial reporting by obtaining an understanding of USAID’s system of internal control, determining whether internal controls had been placed in operation, assessing control risk, and testing controls to determine which auditing procedures to use for expressing our opinion on the financial statements. We limited our internal control testing to those controls necessary to achieve the objectives described in OMB Bulletin 19-01. We did not test all internal controls relevant to operating objectives as broadly defined by the Federal Managers’ Financial Integrity Act of 1982 (FMFIA), Public Law 97-255, such as those controls relevant to ensuring efficient operations. The objective of our audit was not to provide an opinion on internal control. Accordingly, we do not express an opinion on it.
Our consideration of internal control was for the limited purpose described in the preceding paragraph and was not designed to identify all deficiencies in internal control that might be material weaknesses or significant deficiencies. Therefore, material weaknesses and significant deficiencies may exist that were not identified.
A deficiency in internal control exists when the design or operation of a control does not allow management or employees, in the normal course of performing their assigned functions, to prevent, or detect and correct, misstatements on a timely basis. A material weakness is a deficiency or a combination of deficiencies in internal control that presents a reasonable possibility that a material misstatement of the entity’s financial statements will not be prevented, or detected and corrected, on a timely basis. We identified one deficiency in internal control that we consider a material weakness, as defined above, relating to USAID’s reconciliation of its Fund Balance With Treasury account.
A significant deficiency is a deficiency or a combination of deficiencies in internal control that is less severe than a material weakness, yet important enough to merit attention by those charged with governance. We identified three significant deficiencies in internal control related to three of USAID’s financial management processes:
• Reconciling intragovernmental transactions.
• Maintaining adequate records of property, plant, and equipment.

Office of Inspector General, U.S. Agency for International Development 6
• Complying with Federal accounting standards for reimbursable agreements.
We also noted other matters involving internal control over financial reporting, which were not significant deficiencies that we will communicate to USAID’s management.
Material Weakness
USAID Did Not Reconcile Its Fund Balance With Treasury Account With the U.S. Department of the Treasury and Resolve Unreconciled Items in a Timely Manner (Repeat Finding) USAID has made significant efforts to reconcile its Fund Balance With Treasury (FBWT) account with the fund balance reported by the U.S. Department of the Treasury (Treasury) as required by Federal guidance.1 However, the Agency still has large unreconciled differences. As of September 30, 2018, these differences totaled approximately $232.5 million. Of the $232.5 million, $101.5 million was due to explained outstanding items and $131 million could not be explained (as shown in the figure below).
Composition of USAID’s FY 2018 FBWT Difference ($ millions)
These differences persist because USAID has not reconciled the FBWT account with Treasury’s fund balance each month and researched and resolved differences promptly. The following table illustrates the differences for the past seven fiscal years.
1 Treasury Financial Manual, Chapter 5100, Section 5125, “Fund Balance With Treasury Accounts,” states, “Agencies must reconcile the corresponding [U.S. Standard General Ledger] account 101000 balance for each Treasury Account Symbol reported, as shown on the [Governmentwide Accounting] Statement.”
Unexplained Difference
$131
Explained difference less than 90 days
old, $100
Explained difference
more than 90 days old, $1.5

Office of Inspector General, U.S. Agency for International Development 7
USAID’s FBWT Differences ($ millions)
Fiscal Year Net Difference Absolute Value 2012 114 127
2013 121 1,915
2014 154 2,011
2015 198 528
2016 195 356
2017 214 263
2018 232 303
In FY 2018, USAID management consulted with Treasury and the Office of Management and Budget (OMB) to resolve the unexplained difference and submitted a plan to them for their approval. OMB recommended the Agency consider seeking congressional approval to resolve this difference. Management is working closely with Treasury and the OMB to pursue this course of action.
Because we reported a similar finding in previous audits and acknowledge USAID’s efforts to address the problem, we are not making a new recommendation, but we will continue to monitor USAID’s progress in fiscal year 2019.
Significant Deficiencies
Intragovernmental Transactions Remain Unreconciled (Repeat Finding)
As of September 30, 2018, USAID had $468 million in unreconciled intragovernmental transactions, according to Treasury’s Intragovernmental Differences by Trading Partner Report. Of that amount, USAID was required to reconcile, resolve, and confirm $455 million, but did not resolve the differences.2
When a Federal Government agency buys goods or services from another agency, the two engage in an intragovernmental transaction and are referred to as trading partners. Differences arise in Governmentwide financial reporting when agencies record such transactions in different periods or make accounting errors. Treasury’s “Intragovernmental Transactions Guide” suggests that agencies work together to reconcile any differences and prevent them by eliminating long-term accounting policy differences.
In fiscal year 2013, Treasury developed scorecards to track and correct these differences. The scorecards rank each agency by its contribution to Governmentwide differences. At the end of fiscal year 2017, USAID had differences amounting to $336 million and ranked as the 19th largest contributor out of 140. According to the
2 OMB Circular A-136, “Financial Reporting Requirements,” July 30, 2018, and Treasury’s “Intragovernmental Transactions Guide.”

Office of Inspector General, U.S. Agency for International Development 8
scorecard for the end of the third quarter of fiscal year 2018,3 USAID’s differences had increased by 1 percent to $376 million, but the Agency remained the 19th largest contributor.
Although we acknowledge that USAID has processes to resolve unreconciled differences and has made efforts to do so, it could do more. Despite creating corrective action plans in fiscal year 2015, the plans have not been fully implemented and significant differences remain. One reason is that USAID has communicated with only a few trading partners, narrowing the scope for difference resolution.
We reported a similar finding in previous audits and recognize that resolution of these differences requires more coordination with other Federal agencies.4 Therefore, we recommend that the Office of the Chief Financial Officer:
Recommendation 1. Establish an Agency working group comprising personnel of the Office of the Chief Financial Officer and the bureaus to research and address the $455 million differences between USAID and its trading partners that were reported in the fiscal year 2018 Agency Financial Report.
USAID Did Not Maintain Adequate Records of Property, Plant, and Equipment (Repeat Finding) USAID’s controls to ensure correct and on-time recording of the acquisition and disposal of depreciable assets—property, plant, and equipment (PP&E)—were not effective. Specifically, missions did not follow established procedures for the acquisition and disposition of vehicles and other equipment.
Correctly tracking PP&E is a multistep process. To record vehicle transactions, USAID’s overseas missions are expected to use the vehicle management information system (VMIS).5 When an overseas mission acquires or disposes of a vehicle, the mission must make an entry in VMIS within 5 days and send supporting documentation to the Overseas Management Division (OMD) of the Bureau for Management’s Office of Management Services in Washington, DC.6 To record all other PP&E transactions, missions are expected to provide and certify complete, accurate information in response to quarterly data calls by USAID’s Office of the Chief Financial Officer (CFO) for changes to PP&E.
However, the OMD and CFO records we reviewed showed that missions did not fully comply with these requirements, as the following examples illustrate:
3 Treasury does not publish fourth quarter scorecards because they do not reflect the final differences that agencies have eliminated for the fiscal year. 4 “Audit of USAID’s Financial Statements for Fiscal Years 2017 and 2016” (0-000-18-004-C), November 5, 2017. 5 VMIS was decommissioned on September 30, 2018. The Department of State and USAID now use the Fleet Management Information System. 6 Department of State, “Foreign Affairs Manual,” 14 FAM 437.1b, "Accountability, Use, and Maintenance Records," August 3, 2015.

Office of Inspector General, U.S. Agency for International Development 9
• Missions disposed of 12 vehicles that cost $575,812 in VMIS in fiscal year 2018, but did not record the vehicles in the PP&E subledger disposal list.
• In the fourth quarter of fiscal year 2018, CFO personnel recorded an adjusting journal entry for $368,332 to update the general ledger for vehicles and equipment acquired between 2003 and 2016 that missions never accounted for.
• Fifteen vehicles with net book value of $463,585 were never recorded in VMIS.
• Although the missions certified the data call, 38 vehicles with total cost of $2,473,386 were recorded twice as disposed of in the cumulative disposal list because of similar serial and VIN numbers. Similarly, 42 vehicles recorded as disposals in the cumulative disposal list had the same serial numbers but different amounts and descriptions.
• CFO personnel recorded an adjusting journal entry for $1,333,341 to write down nine vehicles that were overstated in prior periods.
• Seven missions responded to the fourth quarter data call without certifying their responses.
Moreover, reviews of data provided by CFO and of inventory records at six selected missions showed that missions sent CFO inaccurate PP&E data not limited to vehicles:
• An x-ray machine that cost $56,800 was not included in data call information for 12 quarters after purchase.
• Three vehicles that cost $168,027 were not recorded in VMIS; another four vehicles that cost $206,677 were recorded in VMIS with a $0 acquisition cost. One of the vehicles was disposed of in April 2018, but not removed from VMIS.
• A mission inaccurately recorded the costs of 3 of 10 vehicles in responding to the CFO’s quarterly data call, leading the net cost of the vehicles to be overstated by $101,944.
• Five pieces of equipment listed in inventory as being worth approximately $513,862 were not in use and were kept in a server room storage closet.
• The VMIS report included four vehicles, three of which were worth more than $25,000 apiece, that were used and maintained by the U.S. Embassy. Documentation needed to formalize the transfer was missing.
Mission personnel are neglecting to adhere to guidance. They are not verifying information before approving and reporting it to the CFO. Reasons for noncompliance include a misunderstanding of the State Department’s role—it runs motor pools and manages the vehicles for selected missions, but the assets remain on USAID’s books—and mission-specific, sometimes outdated ways of recording transactions for assets other than vehicles.
For their part, CFO staff do not reconcile the PP&E subsidiary ledger with VMIS to ensure the accuracy of their records and resolve any differences between the CFO’s capital asset records and OMD’s equipment records.

Office of Inspector General, U.S. Agency for International Development 10
“Standards for Internal Control in the Federal Government” states that management should design control activities so that all transactions are completely and accurately recorded. Not verifying the accuracy of information on assets increases the risk that account misstatements will not be detected. In the above cases, not verifying data caused the vehicle inventory report and the capitalized asset depreciation report to be inaccurate, which could cause the financial statements to be misstated.
We reported a similar finding in previous audits and are aware that USAID implemented a quality assurance program (QAP) on June 19, 2018. However, coming so late in the fiscal year, the QAP had not been fully implemented at the time of our audit and did not prevent the issues we identified during fiscal year 2018. Because the QAP is still new, we are not making a recommendation, but we will continue to monitor USAID’s progress in fiscal year 2019.
USAID Did Not Comply With Federal Standards in Accounting for Reimbursable Agreements (Repeat Finding)
USAID continues to have difficulty accounting for reimbursable agreements in accordance with U.S. generally accepted accounting principles7—in particular, with the following standard:8
Federal entities may receive advances and prepayments from other entities for goods to be delivered or services to be performed. Before revenues are earned, the current portion of the advances and prepayments should be recorded as other current liabilities. After the revenue is earned . . . the entity should record the appropriate amount as revenue or financing source and should reduce the liability accordingly.
In prior years, before implementation of the project cost accounting system (PCAS), we reported that the way USAID accounted for transactions under reimbursable agreements did not comply with U.S. generally accepted accounting principles in three respects:
1. USAID received cash advances from agencies with which it has reimbursable agreements (“trading partners”) and recorded them as receipts of cash and earned revenue although the revenue had not yet been earned.
2. USAID recorded all reimbursable agreements as unfilled customer orders without advances even though it received cash advances for most agreements.
7 Reimbursable agreements are contracts between two agencies that allow one to do work for the other and be reimbursed. For example, the State Department might contract with USAID to implement a vaccination campaign. USAID would run the campaign, and the State Department would reimburse USAID for the drugs and the costs of administering them. 8 Statement of Federal Financial Accounting Standards No. 1, “Accounting for Selected Assets and Liabilities,” paragraph 85.

Office of Inspector General, U.S. Agency for International Development 11
3. USAID did not track incurred expenses or recognized revenue to specific reimbursable agreements because, according to Agency officials, its accounting system did not have this functionality.
In response to the deficiencies reported above, beginning in fiscal year (FY) 2018 USAID activated PCAS, a subsystem of its financial accounting system. According to USAID’s management, PCAS allows USAID to track the status of agreements including amounts available, collected, and expended, making it possible for USAID to recognize revenue and receivables under the agreements.
However, the system as implemented does not substantially comply with U.S. generally accepted accounting principles or the U.S. Standard General Ledger in these respects:
• The system did not process agreements which were entered into before October 1, 2017, and management must calculate and post a manual adjustment to account for these agreements in accordance with U.S. generally accepted accounting principles. For FY 2018, USAID recorded adjustments of approximately $441 million to properly recognize revenue that was earned in FY 2018. However, USAID recognized revenue of $63 million for services that had not been rendered instead of reclassifying the amount as a liability. This noncompliance occurred because USAID did not use the complete inventory of reimbursable agreements as a basis for the adjustments.
• USAID did not record Anticipated Reimbursements and Other Income to recognize reimbursable agreements that were expected in FY 2018. Recording anticipated reimbursements conforms to Treasury guidance.
• For Reimbursable Agreements Without Advance in FY 2018, USAID recorded accounts receivable in Phoenix—the Agency’s accounting system—only in quarter 4 although PCAS recognizes accounts receivable quarterly. According to USAID, the delay in posting these receivables was the result of an intense effort to enter agreement data into Phoenix for the Agency’s second largest category of reimbursable agreements.
We recommend that the Office of the Chief Financial Officer:
Recommendation 2. Review and revise, if necessary, the business process to account for reimbursable agreements so that all transactions are recorded in accordance with U.S. generally accepted accounting principles and the U.S. Standard General Ledger.
The Agency’s Response to Audit Findings
The Agency’s responses to our findings and recommendations appear in appendix B. The Agency’s responses were not subjected to the procedures applied in the audit of the consolidated financial statements; accordingly, we express no opinion on the responses.

Office of Inspector General, U.S. Agency for International Development 12
Purpose of This Report
The purpose of this report is solely to describe the scope of our testing of internal control over financial reporting and the results of that testing, and not to provide an opinion on the effectiveness of USAID’s internal control over financial reporting. Accordingly, this report is not suitable for any other purpose.
USAID Office of Inspector General /s/ December 17, 2018

Office of Inspector General, U.S. Agency for International Development 13
REPORT ON COMPLIANCE WITH APPLICABLE PROVISIONS OF LAWS, REGULATIONS, CONTRACTS, AND GRANT AGREEMENTS. We have audited the accompanying consolidated financial statements of USAID, which comprise the consolidated balance sheets as of September 30, 2018 and 2017, and the related consolidated statements of net cost, consolidated statements of changes in net position, and combined statements of budgetary resources for the years then ended, and the related notes to the financial statements, and have issued our report thereon, dated December 17, 2018.
The management of USAID is responsible for complying with laws, regulations, contracts, and grant agreements applicable to USAID. As part of obtaining reasonable assurance about whether USAID’s financial statements are free of material misstatement, we performed tests of USAID’s compliance with certain provisions of laws and regulations, noncompliance with which could have a direct and material effect on the determination of financial statement amounts and with certain other laws and regulations specified in OMB Bulletin 19-01, including the requirements referred to in section 803(a) of the Federal Financial Management Improvement Act of 1996 (FFMIA). We limited our tests of compliance to these provisions and did not test compliance with all laws and regulations applicable to USAID.
Our tests did not disclose instances of noncompliance that were reportable under Government Auditing Standards and OMB Bulletin 19-01. Our objective was not to provide an opinion on compliance with laws, regulations, contracts, and grant agreements; accordingly, we do not express such an opinion.
Compliance With the Federal Financial Management Improvement Act of 1996
Under FFMIA, we are required to report on whether USAID’s financial management systems substantially comply with 1) Federal financial management system requirements, 2) applicable Federal accounting standards, and 3) the USSGL at the transaction level. To meet this requirement, we performed tests of compliance with each of these three FFMIA section 803(a) (31 U.S.C. 3512 note) requirements, Public Law 104-208, Title VIII. We noted noncompliance in accounting for reimbursable agreements, which deviated from the Statement of Federal Financial Accounting Standards No. 1, “Accounting for Selected Assets and Liabilities,” and the USSGL at the transaction level.
As planned, USAID activated the Project Cost Accounting System (PCAS), a subsystem of its financial accounting system. According to USAID’s management, which is responsible for the noncompliance, PCAS allows USAID to track elements of reimbursable agreements to recognize revenue and receivables. However, as reported in the Internal Control Report, the system did not process agreements which were entered into before October 1, 2017. As a result, USAID recognized revenue of $63 million for services that had not been rendered instead of reclassifying the amount

Office of Inspector General, U.S. Agency for International Development 14
as a liability. This noncompliance occurred because USAID did not use the complete inventory of reimbursable agreements as a basis for the adjustments.
Purpose of This Report
The purpose of this report is solely to describe the scope of our testing of compliance with applicable provisions of laws, regulations, contracts, and grant agreements and the results of that testing, and not to provide an opinion on the effectiveness of USAID’s compliance with applicable provisions of laws, regulations, contracts, and grant agreements. Accordingly, this report is not suitable for any other purpose.
USAID Office of Inspector General /s/ December 17, 2018

Office of Inspector General, U.S. Agency for International Development 15
OIG RESPONSE TO AGENCY COMMENTS. We provided our draft to USAID on December 7, 2018, and on December 14, 2018, received its response, which is included as appendix B. Management commented on the findings, agreed with the two recommendations in our draft report, and described the activities it is undertaking to implement them. We acknowledge management decisions on both recommendations and consider them resolved but open pending completion of the planned activities. We appreciate the Agency’s attention to our recommendations and will continue to monitor its actions in implementing them and any other related developments. The comments on the material weakness and significant deficiencies identified in our audits were not subjected to the auditing procedures applied in the audit of the consolidated financial statements; accordingly, we express no opinion on them.

Office of Inspector General, U.S. Agency for International Development 16
APPENDIX A. SCOPE AND METHODOLOGY USAID’s management is responsible for (1) preparing the financial statements in accordance with U.S. generally accepted accounting principles; (2) establishing, maintaining, and assessing internal control to provide reasonable assurance that the broad control objectives of FMFIA are met; (3) ensuring that USAID’s financial management systems substantially comply with the requirements of FFMIA section 803(a); and (4) complying with other applicable laws and regulations.
OIG is responsible for obtaining reasonable assurance about whether the financial statements are presented fairly, in all material respects, in conformity with accounting principles generally accepted in the United States of America. OIG is also responsible for (1) obtaining a sufficient understanding of internal control over financial reporting and compliance to plan the audit, (2) testing and reporting whether USAID’s financial management systems substantially comply with FFMIA section 803(a) requirements, (3) testing compliance with selected provisions of laws and regulations that have a direct and material effect on the financial statements, and laws for which OMB audit guidance requires testing, and (4) performing limited procedures with respect to certain other information appearing in the Agency Financial Report.
To fulfill these responsibilities, OIG:
• Obtained an understanding of USAID’s design of internal control components related to financial reporting and compliance with laws and regulations (including execution of transactions in accordance with budget authority).
• Tested relevant internal controls over financial reporting and compliance, and evaluated the design and operating effectiveness of these internal controls.
• Statistically and judgmentally selected transactions, including, advances, accrued expenditures, disbursements, payroll, accounts receivable, direct loans and loan guarantees, and obligations.
• Examined, on a test basis, evidence supporting the amounts and disclosures in the financial statements.
• Assessed the accounting principles used and significant estimates made by management.
• Evaluated the overall presentation of the financial statements.
• Considered the process for evaluating and reporting on internal control and financial management systems under FMFIA.
• Tested USAID’s compliance with FFMIA section 803(a) requirements.
We also tested USAID’s compliance with selected provisions of the following:
• Anti-Deficiency Act, July 12, 1870 (codified at 31 U.S.C. 1341(a)(1)(A),(B) and (C) and 1517(a)

Office of Inspector General, U.S. Agency for International Development 17
• Improper Payments Elimination and Recovery Act, Public Law 112-248, sections 5 (a)(1) and (b)(4)
• Prompt Payment Act, Public Law 97-177 ) (codified at 31 U.S.C. 3901(a)(4)(A); 3903(a)(1)(A) and (B), 3902 (a),(b), and (f) ; and 3904)
• Debt Collection Improvement Act of 1996, Public Law 104-134
• Federal Credit Reform Act of 1990, Public Law 93-344
• OMB Circular A–136
• OMB Circular A–123
• Federal Financial Management Improvement Act of 1996, Public Law 104-208
• Pay and Allowance System for Civilian Employees
We did not evaluate all internal controls relevant to operating objectives as broadly defined by FMFIA, such as those controls relevant to preparing statistical reports and ensuring efficient operations. We limited our internal control testing to controls over financial reporting and compliance. Because of inherent limitations in internal control, misstatements due to error, fraud, losses, or noncompliance may occur and may not be detected. We also caution that projecting our evaluation to future periods is subject to the risk that controls may become inadequate because of changes in conditions, or that the degree of compliance with controls may deteriorate. In addition, we caution that our internal control testing may not be sufficient for other purposes.
We did not test compliance with all laws and regulations applicable to USAID. We limited our tests of compliance to those laws and regulations required by OMB audit guidance that we deemed applicable to the financial statements for the fiscal years ended September 30, 2018 and 2017. We caution that noncompliance may occur and may not be detected by these tests, and that such testing may not be sufficient for other purposes.
We conducted our work from May 2018 through December 2018 in accordance with generally accepted government auditing standards. Those standards require that we plan and perform the audit to obtain sufficient, appropriate evidence to provide a reasonable basis for our findings and conclusions based on our audit objectives. We believe that the evidence obtained provides a reasonable basis for our findings and conclusions based on our audit objectives.
We assessed whether USAID was substantially compliant with section 803(a) of the FFMIA, which requires agencies to implement and maintain financial management systems that substantially comply with (1) Federal financial management system requirements, (2) applicable Federal accounting standards, and (3) USSGL at the transaction level. We evaluated USAID’s financial transactions recorded in USAID’s financial management system to determine whether they were compatible with Federal accounting standards and USSGL at the transaction level.

Office of Inspector General, U.S. Agency for International Development 18
APPENDIX B. AGENCY COMMENTS
Chief Financial Officer
December 14, 2018
MEMORANDUM
TO: Thomas E. Yatsco, Assistant Inspector General for Audit
FROM: Reginald W. Mitchell /s/
SUBJECT: Management Response to Draft Independent Auditor’s Report on USAID’s Financial Statements for Fiscal Years 2018 and 2017 (0-000-19-00X-C)
Thank you for your draft report on the Audit of USAID’s Financial Statements for Fiscal Years 2018 and 2017 and for the professionalism exhibited by your staff throughout this process.
Fiscal Year (FY) 2018 was a significant year for federal financial management at USAID. We are pleased that the USAID Inspector General will issue an unmodified opinion on the Agency’s principal financial statements. The acknowledgments of the Agency’s improvements in financial systems and processes throughout the report are appreciated.
The following are management’s comments regarding the audit findings:
Material Weakness: USAID Did Not Reconcile Its Fund Balance With Treasury Account With the Department of the Treasury and Resolve Unreconciled Items in a Timely Manner (Repeat Finding)
Management acknowledges this finding. Notwithstanding, the Agency maintains since it implemented updated reconciliation procedures in FY 2018, reconciliations are being performed on a monthly basis consistent with standard accounting principles. It is important to note that the $232 million difference is composed of two components.
The first component is the difference of $101 million. This difference is explained, as mentioned by OIG, and is fully identified at the detail transaction level. This amount is dynamic and will fluctuate on a monthly basis. This difference changes based on new items received with existing items resolved every month. As stated by the OIG, of the $101 million, $1.5 million remained unresolved over 90 days.

Office of Inspector General, U.S. Agency for International Development 19
The second component of $131 million difference represents the legacy unexplained difference which occurred in the past due to various historical factors. These historical factors have now been fully addressed through several major system enhancements and business processes. These enhancements included augmenting the Agency’s general ledger-based financial system with a web-based cash reconciliation tool to identify, monitor, and track open reconciling items at the mission and agency levels. Management will continue to work with the Office of Management and Budget and Treasury to seek authorization to resolve the legacy $131 balance.
Target Completion Date for resolving the legacy difference: September 30, 2019
Significant Deficiency: Intragovernmental Transactions Remain Unreconciled (Repeat Finding)
Recommendation 1: Establish an Agency working group comprised of personnel of the CFO’s office and the bureaus to research and address the $455 million differences between USAID and its trading partners that were reported in the FY 2018 Agency Financial Report.
Management Decision: Management accepts this recommendation.
Target Completion Date: September 30, 2019
Significant Deficiency: USAID Did Not Maintain Adequate Records of Property, Plant and Equipment (Repeat Finding)
Management acknowledges this finding. As reported by OIG, Management implemented a Quality Assurance Program (QAP) during the fourth quarter of FY 2018. Based on Management’s progress to date, we anticipate the QAP will fully address the issues identified during the OIG’s FY 2018 audit.
Significant Deficiency: USAID Did Not Comply with Federal Standards in Accounting for Reimbursable Agreements (Repeat Finding)
Recommendation 2: Review and revise, if necessary, the business process to account for reimbursable agreements to ensure that all transactions are recorded in accordance with generally accepted accounting principles and USSGL.
Management Decision: Management accepts this recommendation. Management understands that this recommendation is associated with those reimbursement agreements in PCAS and requires the appropriate associated documentation.
Target Completion Date: September 30, 2019

Office of Inspector General, U.S. Agency for International Development 20
APPENDIX C. STATUS OF PRIOR-YEAR FINDINGS AND RECOMMENDATIONS OMB Circular A–50, “Audit Follow-up,” states that a management decision on audit recommendations shall be made within 6 months after a final report is issued. Corrective action should proceed as rapidly as possible.
Status of 2017 Findings and Recommendations
Recommendation 1. The Office of the Chief Financial Officer continue to investigate the $83 million differences between the Agency’s Fund Balance With Treasury Account and Treasury fund balance to identify the root cause and, if appropriate, modify its business process to mitigate future occurrences.
Status: The target completion date is April 1, 2019.
Recommendation 2. The Office of the Chief Financial Officer enhance its policies and procedures to ensure the subsidiary and general ledgers are completely reconciled and the causes of the differences are corrected.
Status: Closure request submitted February 6, 2018. It has not been closed, as it is related to a finding made this year.
Recommendation 3. The Office of the Chief Financial Officer implement a quality assurance program to validate the quarterly information that missions submit, and ensure that there are no differences between vehicle management information system and the Chief Financial Officer’s records.
Status: Closure request submitted April 4, 2018. It has not been closed, as it is related to a finding made this year.
Status of 2016 Findings and Recommendations
Recommendation1. We recommend that the Office of the Chief Financial Officer resolve all unexplained differences between USAID’s Fund Balance With Treasury account and the Department of the Treasury by December 31, 2016, and institutionalize the monthly reconciliation of the Fund Balance With Treasury account.
Status: The target completion date is April 1, 2019.
Status of 2014 Findings and Recommendations
Recommendation 2. We recommend that USAID’s Office of the Chief Financial Officer consult with the U.S. Treasury to obtain advice and approval for resolving unreconciled funds.
Status: The target completion date is April 1, 2019.

Office of Inspector General, U.S. Agency for International Development 21
Recommendation 7. We recommend that USAID’s Office of the Chief Financial Officer reconfigure its financial management system to account for reimbursable agreements in accordance with Federal Generally Accepted Accounting Principles, and in consultation with appropriate stakeholders, develop and implement improved processes to account for reimbursable agreements.
Status: This recommendation was closed on December 29, 2017.
Status of 2012 Findings and Recommendations
Recommendation 1. We recommend that the Chief Financial Officer verify that all differences between USAID and the Department of the Treasury are researched and resolved in a timely manner in accordance with Treasury financial manual reconciliation procedures.
Status: The target completion date is April 1, 2019.

Office of Inspector General, U.S. Agency for International Development 22
APPENDIX D. FINANCIAL STATEMENTS

83USAID FY 2018 AGENCY FINANCIAL REPORT | FINANCIAL SECTION
CONSOLIDATED BALANCE SHEETAs of September 30, 2018 and 2017(In Thousands)
2018 2017
ASSETS:
Intragovernmental: Fund Balance with Treasury (Note 2) $ 35,482,587 $ 34,226,053 Accounts Receivable (Note 3) 6,855 118
Other Assets (Note 4) 15,862 84,179
Total Intragovernmental 35,505,304 34,310,350
Cash and Other Monetary Assets (Note 5) 210,917 204,959 Accounts Receivable, Net (Note 3) 102,410 40,619 Direct Loans and Loan Guarantees, Net (Note 6) 936,618 1,266,621 Inventory and Related Property, Net (Note 7) 26,584 25,171 General Property, Plant, and Equipment, Net (Note 8) 81,370 87,864 Other Assets (Note 4) 829,064 645,255
Total Assets $ 37,692,267 $ 36,580,839
LIABILITIES: Intragovernmental: Accounts Payable $ 81,531 $ 70,557 Debt (Note 11) 36,686 36,704 Liability for Capital Transfers to the General Fund of the Treasury (Note 11) 1,157,007 1,465,210 Other Liabilities (Notes 10 and 12) 751,593 761,377
Total Intragovernmental 2,026,817 2,333,848
Accounts Payable 2,407,953 1,841,552 Loan Guarantee Liability (Note 6) 3,726,199 3,620,039 Federal Employee and Veteran’s Benefits (Note 13) 23,469 26,938 Other Liabilities (Notes 10 and 12) 433,519 426,739
Total Liabilities 8,617,957 8,249,116
Commitments and Contingencies (Note 14)
NET POSITION: Unexpended Appropriations 28,803,928 28,126,624 Cumulative Results of Operations 270,382 205,099
Total Net Position 29,074,310 28,331,723
Total Liabilities and Net Position $ 37,692,267 $ 36,580,839
The accompanying notes are an integral part of these statements.
FINANCIAL STATEMENTS

84 USAID FY 2018 AGENCY FINANCIAL REPORT | FINANCIAL SECTION
CONSOLIDATED STATEMENT OF NET COSTFor the Years Ended September 30, 2018 and 2017(In Thousands)
Categories 2018 2017
DR–Democracy, Human Rights and Governance
Gross Costs $ 1,701,494 $ 1,355,379
Less: Earned Revenue (7,348) (10,010)
Net Program Costs 1,694,146 1,345,369
EG–Economic Growth
Gross Costs 3,588,058 4,471,125
Less: Earned Revenue (153,659) (689,352)
Net Program Costs 3,434,399 3,781,773
ES–Education and Social Services
Gross Costs 1,186,630 1,335,348
Less: Earned Revenue (7,780) (7,474)
Net Program Costs 1,178,850 1,327,874
HA–Humanitarian Assistance
Gross Costs 3,808,222 3,023,343
Less: Earned Revenue (7,854) (19,961)
Net Program Costs 3,800,368 3,003,382
HL–Health
Gross Costs 1,875,981 1,989,992
Less: Earned Revenue (625,227) (46,859)
Net Program Costs 1,250,754 1,943,133
PO–Program Development and Oversight
Gross Costs 1,078,908 1,059,728
Less: Earned Revenue (8,099) (8,508)
Net Program Costs 1,070,809 1,051,220
PS–Peace and Security
Gross Costs 592,571 608,474
Less: Earned Revenue (2,079) (2,729)
Net Program Costs 590,492 605,745
Net Cost of Operations (Notes 15 and 16) $ 13,019,818 $ 13,058,496
The accompanying notes are an integral part of these statements.
Note: In FY 2017, USAID implemented the new U.S. Department of State’s (State) Office of U.S. Foreign Assistance Resources (F) Standardized Program Structure and Definition (SPSD).

85USAID FY 2018 AGENCY FINANCIAL REPORT | FINANCIAL SECTION
CONSOLIDATED STATEMENT OF CHANGES IN NET POSITIONFor the Years Ended September 30, 2018 and 2017(In Thousands)
2018 2017
Unexpended Appropriations:
Beginning Balance $ 28,126,624 $ 26,603,696
Budgetary Financing Sources:
Appropriations Received 14,110,845 15,041,056
Appropriations Transferred in/out (112,966) (305,647)
Other Adjustments (164,588) (105,573)
Appropriations Used (13,155,987) (13,106,908)
Total Budgetary Financing Sources 677,304 1,522,928
Total Unexpended Appropriations 28,803,928 28,126,624
Cumulative Results of Operations:
Beginning Balance $ 205,099 $ 338,339
Budgetary Financing Sources:
Appropriations Used 13,155,987 13,106,908
Nonexchange Revenue (30) 19
Donations and Forfeitures of Cash and Cash Equivalents 109,539 38,583
Transfers-in/out Without Reimbursement – 76
Other Financing Sources (Non-Exchange):
Donations and Forfeitures of Property 20,829 18,470
Imputed Financing 36,541 31,361
Other (237,765) (270,161)
Total Financing Sources 13,085,101 12,925,256
Net Cost of Operations (Notes 15 and 16) (13,019,818) (13,058,496)
Net Change 65,283 (133,240)
Cumulative Results of Operations 270,382 205,099
Net Position $ 29,074,310 $ 28,331,723
The accompanying notes are an integral part of these statements.

86 USAID FY 2018 AGENCY FINANCIAL REPORT | FINANCIAL SECTION
COMBINED STATEMENT OF BUDGETARY RESOURCESFor the Years Ended September 30, 2018 and 2017(In Thousands)
2018 2017
Budgetary
Non-Budgetary Credit Reform
Financing Accounts Budgetary
Non-Budgetary Credit Reform
Financing Accounts
Budgetary Resources:
Unobligated Balance from Prior Year Budget Authority, Net $ 11,654,602 $ 3,489,262 $ 10,638,356 $ 2,938,532 Appropriations (Discretionary and Mandatory) 13,918,947 4 14,792,117 (29) Borrowing Authority (Discretionary and Mandatory) (Note 11) – 40 – – Spending Authority from Offsetting Collections (Discretionary and Mandatory) 1,079,850 559,833 386,852 707,247
Total Budgetary Resources $ 26,653,399 $ 4,049,139 $ 25,817,325 $ 3,645,750
Status of Budgetary Resources: New Obligations and Upward Adjustments (Total) (Note 17) $ 15,501,459 $ 282,592 $ 14,837,837 $ 157,153 Unobligated Balance, End of Year:
Apportioned, Unexpired Accounts (Note 2) 5,903,112 262,199 10,466,436 315,025 Exempt from Apportionment, Unexpired Accounts (Note 2) (4) – (4) – Unapportioned, Unexpired Accounts (Note 2) 4,996,796 3,504,348 256,253 3,173,572
Unexpired Unobligated Balance, End of Year 10,899,904 3,766,547 10,722,685 3,488,597
Expired Unobligated Balance, End of Year 252,036 – 256,803 –
Total Unobligated Balance, End of Year 11,151,940 3,766,547 10,979,488 3,488,597
Total Budgetary Resources $ 26,653,399 $ 4,049,139 $ 25,817,325 $ 3,645,750
Outlays, Net:Outlays, Net (Total) (Discretionary and Mandatory) $ 12,703,861 $ (279,039) $ 12,928,059 $ (551,057)Distributed Offsetting Receipts (-) (396,088) – (240,024) –
Agency Outlays, Net (Discretionary and Mandatory) $ 12,307,773 $ (279,039) $ 12,688,035 $ (551,057)
The accompanying notes are an integral part of these statements.

87USAID FY 2018 AGENCY FINANCIAL REPORT | FINANCIAL SECTION
NOTES TO THE FINANCIAL STATEMENTS
NOTE 1. SUMMARY OF SIGNIFICANT ACCOUNTING POLICIES
PROGRAMS
The principal statements present the financial activity of various programs and accounts managed by USAID. The programs include Assistance for Europe, Eurasia, and Central Asia; Civilian Stabilization Initiative; Economic Support Fund; Development Assistance; International Disaster Assistance; Global Health and Child Survival; and Direct and Guaranteed Loan Programs. This classification is consistent with the budget of the United States.
Assistance for Europe, Eurasia, and Central Asia
Funds appropriated under this heading are considered to be economic assistance under the Foreign Assistance Act of 1961.
This account provides funds for a program of assis-tance to the independent states that emerged from the former Soviet Union. These funds support the U.S. foreign policy goals of consolidating improved U.S. security; building a lasting partnership with the new independent states; and providing mutual access to markets, resources, and expertise.
Funds appropriated in prior years under “Assistance for the Independent States of the Former Soviet Union” and “Assistance for Eastern Europe” shall be available under this heading Assistance for Europe, Eurasia, and Central Asia.
Civilian Stabilization Initiative
This fund provides support for the necessary expenses needed to establish, support, maintain, mobilize, and deploy a civilian response corps in
A. BASIS OF PRESENTATION
The accompanying principal financial statements report USAID’s financial position and results of operations. They have been prepared using USAID’s books and records in accordance with Agency accounting policies, the most signifi-cant of which are summarized in this note. The statements are presented in accordance with the guidance and requirements of the Office of Management and Budget (OMB) Circular A-136, Financial Reporting Requirements.
USAID accounting policies follow generally accepted accounting principles for the Federal Government, as established by the Federal Accounting Standards Advisory Board (FASAB). The FASAB has been recognized by the American Institute of Certified Public Accountants (AICPA) as the official accounting standard setting authority for the Federal Government. These standards have been agreed to by the Director of the OMB, the Secretary of the Treasury, and the Comptroller General.
Accounting standards require all reporting entities to disclose that accounting standards allow certain presentations and disclosures to be modified, if needed, to prevent the disclosure of classified information.
B. REPORTING ENTITY
Established in 1961 by President John F. Kennedy, USAID is the independent U.S. Government Agency that provides economic development and humanitarian assistance to advance United States economic and political interests overseas.

88 USAID FY 2018 AGENCY FINANCIAL REPORT | FINANCIAL SECTION
coordination with the USAID. This fund is also used for related reconstruction and stabilization assistance to prevent or respond to conflict or civil strife in foreign countries or regions, or to enable transition from such unstable conditions.
Economic Support Fund
The Economic Support Fund (ESF) supports U. S. foreign policy objectives by providing economic assistance to allies and countries in transition to democracy. Programs funded through this account promote stability and U.S. security interests in strategic regions of the world.
Development Assistance
This program provides economic resources to developing countries with the aim of bringing the benefits of development to the poor. The program promotes broad-based, self-sustaining economic growth and opportunity, and supports initiatives intended to stabilize population growth, protect the environment and foster increased democratic participation in developing countries. The program is concentrated in those areas in which the United States has special expertise and which promise the greatest opportunity for the poor to better their lives.
International Disaster Assistance
Funds for the International Disaster Assistance Program provide relief, rehabilitation, and reconstruction assistance to foreign countries struck by disasters such as famines, floods, hurricanes and earthquakes. The program also provides assistance in disaster preparedness, prevention and mitigation; and providing emergency commodities and services for immediate healthcare and nutrition. Additionally, this fund supports the capability to provide timely emergency response to disasters worldwide.
Global Health and Child Survival
This fund provides economic resources to developing countries in support of programs to improve infant and child nutrition, with the aim of reducing infant and child mortality rates; to reduce HIV transmission and the impact of the HIV/AIDS pandemic in developing countries; to reduce the threat of infectious diseases of major public health importance
such as polio, malaria or tuberculosis; and to expand access to quality basic education for girls and women.
Direct and Guaranteed Loans
• Direct Loan Program
These loans are authorized under the Foreign Assistance Act of 1961, various predecessor Agency programs, and other foreign assistance legislation. Direct Loans are issued in both U.S. dollars and the currency of the borrower. Foreign currency loans made “with maintenance of value” places the risk of currency devaluation on the borrower, and are recorded in equivalent U.S. dollars. Loans made “without mainte-nance of value” place the risk of devaluation on the U.S. Government, and are recorded in the foreign currency of the borrower.
• Urban and Environmental Program
The Urban and Environmental (UE) Program extends guaranties to U.S. private investors who make loans to developing countries, to assist them in formulating and executing sound housing and community development policies that meet the needs of lower income groups.
• Micro and Small Enterprise Development Program
The Micro and Small Enterprise Development (MSED) Program was established to support private sector activities in developing countries by providing direct loans and loan guarantees to local micro and small enterprises. Although the MSED program is still active, most of USAID’s new loan guarantee activity is managed through the Development Credit Authority (DCA) Program.
• Development Credit Authority
The first obligations for USAID’s Development Credit Authority were made in FY 1999. The DCA allows Missions and other offices to use loans and loan guarantees to achieve their development objectives when it can be shown that (1) the project generates enough revenue to cover the debt service including USAID fees, (2) there is at least 50 percent risk-sharing by

89USAID FY 2018 AGENCY FINANCIAL REPORT | FINANCIAL SECTION
a private-sector institution, and (3) the DCA guarantee addresses a financial market failure in-country and does not “crowd-out” private sector lending. The DCA can be used in any sector and by any USAID Operating Unit whose project meets the DCA criteria. DCA projects are approved by the Agency Credit Review Board and the Chief Financial Officer.
• Israel Loan Guarantee Program
Congress authorized the Israel Loan Guarantee Program in Section 226 of the Foreign Assistance Act to support the costs for immigrants resettling to Israel from the former Soviet Union, Ethiopia, and other countries. Under the program, the U.S. Government guaranteed the repayment of up to $10.5 billion in notes issued.
• Loan Guarantees to Middle East Northern Africa (MENA) Program
The authority for the MENA Program was initially established under the Consolidated Appropriations Act, 2012 (Pub. L. No. 112-74), earmarked to provide support for the Republic of Tunisia. In FY 2014, this program was expanded to include Jordan and renamed the Middle East Northern Africa Loan Guarantee Program. In January 2017, pursuant to the Further Continuing and Security Assistance Appropriations Act, 2017 (Pub. L. No. 114-254), a new guarantee agreement with Iraq, was added to the MENA portfolio. These assistance programs aim to support these Sovereign governments in their respective economic transition and reform initiatives. Under this program, the U.S Government guarantees total repayment of $6.24 billion notes issued to date.
• Ukraine Loan Guarantee Program
The Loan Guarantee Program for Ukraine was established in accordance with Title III of the U.S. Department of State, Foreign Operations, and Related Programs Appro-priations Act, 2014 (division K of Pub. L. No. 113-76). The Ukraine Loan Program is intended to help Ukraine meet its near-term social spending needs and insulate vulnerable
Ukrainians from the impact of necessary economic adjustments. To date a total of $3 billion in notes have been issued.
FUND TYPES
The principal statements include the accounts of all funds under USAID’s control. Most of the fund accounts relate to general fund appropriations. USAID also has special funds, revolving funds, trust funds, deposit funds, a capital investment fund, receipt accounts, and budget clearing accounts.
General fund appropriations and the special funds are used to record financial transactions under Congressional appropriations or other authorization to spend general revenue.
Revolving funds are established by law to finance a continuing cycle of operations, with receipts derived from such operations usually available in their entirety for use by the fund without further action by Congress.
Trust funds are credited with receipts generated by the terms of the underlying trust agreement or statute. At the point of collection, these receipts may be available or unavailable, depending upon statutory spending authority.
Deposit funds are established for (1) amounts received for which USAID is acting as a fiscal agent or custodian, (2) unidentified remittances, (3) monies withheld from payments for goods or services received, and (4) monies held awaiting distribution on the basis of legal determination.
The capital investment fund contains no-year (non-expiring) funds to provide the Agency with greater flexibility to manage investments in technology systems and facility construction that’s allowed under the annual appropriation for operating expenses.
C. BASIS OF ACCOUNTING
Transactions are recorded on both an accrual and budgetary basis. Under the accrual basis, revenues are recognized when earned and expenses are recognized when a liability is incurred,

90 USAID FY 2018 AGENCY FINANCIAL REPORT | FINANCIAL SECTION
without regard to receipt or payment of cash. Budgetary accounting facilitates compliance with legal constraints on, and controls of, the use of Federal funds. The accompanying Balance Sheet, Statement of Net Cost, and Statement of Changes in Net Position have been prepared on an accrual basis. The Statement of Budgetary Resources has been prepared in accordance with budgetary accounting rules.
D. BUDGETS AND BUDGETARY ACCOUNTING
The components of USAID’s budgetary resources include current budgetary authority (that is, appropriations and borrowing authority) and unobligated balances remaining from multiyear and no-year budget authority received in prior years. Budget authority is the authorization provided by law to enter into financial obligations that result in immediate or future outlays of Federal funds. Budgetary resources also include reimbursement and other income (that is, spending authority from offsetting collections credited to an appropriation or fund account) and adjustments (that is, recoveries of prior year obligations).
Unobligated balances associated with appropria-tions that expire at the end of the Fiscal Year remain available for obligation adjustments, but not new obligations, for five years until that account is canceled. When accounts are canceled amounts are not available for obligations or expenditure for any purpose and are returned to Treasury.
The “Consolidated Appropriations Act” signed into law as Pub. L. No.112-74 provides to USAID extended authority to obligate funds. USAID’s appropriations have consistently provided essen-tially similar authority, commonly known as “7011” authority. Under this authority, funds shall remain available for obligation for an extended period if such funds are initially obligated within their initial period of availability.
E. REVENUES AND OTHER FINANCING SOURCES
USAID receives the majority of its funding through congressional appropriations—annual, multiyear, and no-year (non-expiring) appropriations—that may be used within statutory limits. Appropriations are recognized as a financing source (i.e., Appropriations used) on the Statement of Changes in Net Position at the time the related program or administrative expenses are incurred. Appropriations expended for capitalized property and equipment are not recognized as expenses. Appropriations are also recognized as financing sources when used to acquire capital and other assets. In addition to funds warranted directly to USAID, the Agency also receives allocation transfers from the U.S. Department of Agriculture (USDA) Commodity Credit Corporation, the Executive Office of the President, the U.S. Department of State, and Millennium Challenge Corporation (MCC).
Additional financing sources for USAID’s various credit programs and trust funds include amounts obtained through collection of guaranty fees, interest income on rescheduled loans, penalty interest on delinquent balances, permanent indefinite borrowing authority from the U.S. Treasury, proceeds from the sale of overseas real property acquired by USAID, and advances from foreign governments and international organizations.
Revenues are recognized as financing sources to the extent that they are received by USAID from other Agencies, other governments and the public. Imputed revenues are reported in the financial statements to offset imputed costs. Amounts received from other Federal Agencies under reimbursable agreements are recognized as revenue as related expenditures are incurred.
F. FUND BALANCE WITH TREASURY
Cash receipts and disbursements are processed by the U.S. Treasury. The fund balances with Treasury are primarily appropriated funds that are available to pay current liabilities and finance authorized purchase commitments, but they also include revolving, deposit, and trust funds.

91USAID FY 2018 AGENCY FINANCIAL REPORT | FINANCIAL SECTION
G. FOREIGN CURRENCY
The Direct Loan Program maintains foreign currency funds, which are used to disburse loans in certain countries. Those balances are reported at the U.S. dollar equivalents using the exchange rates prescribed by the U.S. Treasury. A gain or loss on currency conversion is recognized for any change in valuation of foreign currencies at year-end. Additionally, some USAID host countries contribute funds for the overhead operation of the host Mission and the execution of USAID programs. These funds are held in trust and reported in U.S. dollar equivalents on the Balance Sheet and Statement of Net Costs.
H. ACCOUNTS RECEIVABLE
Accounts receivable consist of amounts due mainly from foreign governments but also from other Federal Agencies and private organizations. USAID regards amounts due from other Federal Agencies as 100 percent collectible. The Agency establishes an allowance for uncollectible accounts receivable from the public for non-loan or revenue generating sources based on a historical analysis of collectability.
I. DIRECT LOANS AND LOAN GUARANTEES
Loans are accounted for as receivables after funds have been disbursed. For loans obligated before October 1, 1991 (pre-1992), loan principal, interest, and penalties receivable are reduced by an allowance for estimated uncollectible amounts. The allowance is estimated based on an allowance for loss method prescribed by OMB that takes into account country risk and projected cash flows.
The Federal Credit Reform Act of 1990 (FCRA) prescribes an alternative method of accounting for direct loans and guarantees obligated on or after October 1, 1991(post-1991); the loans receivable are reduced by an allowance equal to the net present value of the cost to the United States Government of making the loan. This cost, known as “subsidy”, takes into account all cash inflows and outflows associated with the loan, including the interest rate differential between the loans and Treasury borrowing, the estimated delinquencies and
defaults net of recoveries, and offsets from fees and other estimated cash flows. This allowance is reestimated when necessary and changes reflected in the operating statement.
Subsidy cost associated with direct loans and guarantees, is required by the FCRA to be recognized as an expense in the year in which the direct loan or guarantee is disbursed. Subsidy cost is calculated by Agency program offices prior to obligation using a model prescribed by the Office of Management and Budget (OMB). Subsidy relating to existing loans and guarantees is generally required to be reestimated on an annual basis to adjust for changes in risk and interest rate assumptions.
Loans have been made in both U.S. dollars and foreign currencies. Loans extended in foreign currencies can be with or without “Maintenance of Value” (MOV). Foreign currency exchange gain or loss is recognized on those loans extended without MOV, and reflected in the net credit programs receivable balance.
Credit program receivables also include origination and annual fees on outstanding guarantees, interest on rescheduled loans and late charges. Claims receivables (subrogated and rescheduled) are due from foreign governments as a result of defaults for pre-1992 guaranteed loans. Receivables are stated net of an allowance for uncollectible accounts that is determined using an OMB approved net present value default methodology.
While estimates of uncollectible loans and interest are made using methods prescribed by OMB, the final determination as to whether a loan is collectible is also affected by actions of other Federal Government Agencies.
Pre-1992 direct loan and loan guarantee repayments expected from the Borrowers are accounted for as a Liability for Capital Transfers since any unobligated balance from the collections are paid out to Treasury at the end of each Fiscal Year. In addition, any excess subsidy derived through the reestimate calculations on post-1991 loan guarantees is expected to be disbursed to Treasury and is also accounted for as a Liability for Capital Transfer.

92 USAID FY 2018 AGENCY FINANCIAL REPORT | FINANCIAL SECTION
J. ADVANCES
Funds disbursed before expenditures are incurred are recorded as advances. Most advances consist of funds disbursed under letters of credit to contrac-tors and grantees. The advances are liquidated and recorded as expenses upon receipt of expenditure reports from the recipients.
K. INVENTORY AND RELATED PROPERTY
USAID’s inventory and related property are comprised of life essential materials and supplies. The Agency has materials and supplies in reserve for foreign disaster assistance stored at strategic sites around the world. These include tents, disaster kits, field packs, and water purification units.
Agency supplies held in reserve for future use are items not readily available in the market, or for which there is more than a remote chance that the supplies will be needed, but not in the normal course of operations. Their valuation is based on cost and they are not considered “held for sale.” USAID has no supplies categorizable as excess, obsolete, or unserviceable operating materials and supplies.
L. PROPERTY, PLANT AND EQUIPMENT
USAID capitalizes all property, plant and equipment that have an acquisition cost of $25,000 or greater and a useful life of two years or more. Acquisitions that do not meet these criteria are recorded as operating expenses. Assets are capitalized at historical cost, depending on when the asset was put into production and depreciated using the straight-line method (mid-year and mid-quarter). Real property is depreciated over 20 years, nonexpendable personal property is depreciated over three to five years. The Agency uses land, buildings, and equipment that are provided by the General Services Administration. Internal use software that has development costs of $300,000 or greater is capitalized. Deferred maintenance amounts are immaterial with respect to the financial statements. In addition, certain USAID assets are held by Government Contractors. Under provisions
of the Federal Acquisition Regulation (FAR), the contractors are responsible for the control and accountability of the assets in their possession, which are immaterial to the financial statements. These Government-owned, contractor-held assets are included within the balances reported in USAID’s financial statements.
M. LIABILITIES
Liabilities represent the amount of monies or other resources that are likely to be paid by USAID as the result of transactions or events that have already occurred. However, no liability can be paid by the Agency without an appropriation or borrowing authority. Liabilities for which an appropriation has not been enacted are therefore classified as Liabilities Not Covered by Budgetary Resources (unfunded liabilities), and there is no certainty that the appropriations will be enacted. As a sovereign entity, the Federal Government can abrogate the payment of all liabilities other than for contracts.
N. LIABILITIES FOR LOAN GUARANTEES
The FCRA, which became effective on October 1, 1991, significantly changed the manner in which USAID finances the activities of loan programs. The main purpose of the FCRA was to more accurately measure the cost of Federal credit programs and to place the cost of such programs on a budgetary basis equivalent to other Federal spending. Consequently, commencing in FY 1992, USAID can only make new loans or guarantees with an appropriation available to fund the cost of making the loan or guarantee. This cost is known as “subsidy”.
For USAID’s loan guarantee programs, when guarantee commitments are made, an obligation for subsidy cost is recorded in the program account. This cost is based on the net present value of the estimated net cash outflows to be paid by the program as a result of the loan guarantees, except for administrative costs, less the net present value of all cash inflows to be generated from those guarantees. When the loans are disbursed, the subsidy cost is disbursed from the program account to a financing account.

93USAID FY 2018 AGENCY FINANCIAL REPORT | FINANCIAL SECTION
For pre-1992 loan guarantees, the liability for loan guarantees represents an unfunded liability. The amount of unfunded liabilities also represents a future funding requirement for USAID. The liability is calculated using a reserve methodology that is similar to the OMB- prescribed method for post-1991 loan guarantees.
O. ANNUAL, SICK, AND OTHER LEAVE
Annual leave is accrued as it is earned and the accrual is reduced as leave is taken. Each year, the balance in the accrued annual leave account is adjusted to reflect current pay rates. To the extent that current or prior year appropriations are not available to fund annual leave earned but not taken, funding will be obtained from future financing sources. Sick leave and other types of leave are expensed as taken.
P. RETIREMENT PLANS AND POST EMPLOYMENT BENEFITS
USAID recognizes its share of the cost of providing future pension benefits to eligible employees over the period of time the employees provide the related services. The pension expense recognized in the financial statements equals the current service cost for USAID employees for the accounting period less the amount contributed by the employees. The measurement of the service cost requires the use of an actuarial cost method and assumptions. The Office of Personnel Management (OPM) administers these benefits and provides the factors that USAID applies to calculate the cost. The excess of the pension expense over the amount contributed by USAID and employees represents the amount being financed directly through the Civil Service Retirement System and the Federal Employees Retirement System administered by OPM. This cost is considered imputed cost to USAID.
USAID recognizes a current period expense for the future cost of post retirement health benefits and life insurance for its employees while they are still working. USAID accounts for and reports this expense in its financial statements in a manner similar to that used for pensions, with the exception
that employees and USAID do not make contributions to fund these future benefits.
Q. COMMITMENTS AND CONTINGENCIES
A contingency is an existing condition, situation or set of circumstances involving uncertainty as to possible gain or loss to USAID. The uncertainty will ultimately be resolved when one or more future events occur or fail to occur. For pending, threatened or potential litigation, a liability is recognized when a past transaction or event has occurred, a future outflow or other sacrifice of resources is likely, and the related future outflow or sacrifice of resources is measurable. For other litigations, a contingent liability is recognized when similar events occur except that the future outflow or other sacrifice of resources is more likely than not.
R. NET POSITION
Net position is the residual difference between assets and liabilities. It is composed of unexpended appropriations and cumulative results of operations.
• Unexpended appropriations are the portion of the appropriations represented by undelivered orders and unobligated balances.
• Cumulative results of operations are also part of net position. This account reflects the net difference between expenses and losses and financing sources, including appropriations, revenues and gains, since the inception of the activity.
S. NON-ENTITY ASSETS
Non-entity fund balances are amounts in deposit fund accounts. These include such items as: funds received from outside sources where the Government acts as fiscal agent, monies the Government has withheld awaiting distribution based on legal determination, and unidentified remittances credited as suspense items outside the budget. For USAID, non-entity assets are minimal in amount, and are composed solely of accounts receivable, net of allowances.

94 USAID FY 2018 AGENCY FINANCIAL REPORT | FINANCIAL SECTION
T. AGENCY COSTS
USAID costs of operations are comprised of program and operating expenses. USAID/Washington program and Mission related expenses by objectives are obtained directly from Phoenix, the Agency general ledger. A cost allocation model is used to distribute operating expenses, including Management Bureau, Global Development Alliance, Trust Funds and Support Offices costs to specific goals. Expenses related to Credit Reform and Revolving Funds are directly applied to specific Agency goals based on their objectives.
U. PARENT/CHILD REPORTING
USAID is a party to allocation transfers with other Federal Agencies as both a transferring (parent) entity and receiving (child) entity. Allocation transfers are legal delegations by one Department of its ability to obligate budget authority and outlay funds to another Department. A separate fund account (allocation account) is created in the U.S. Treasury as a subset of the parent fund account for tracking and reporting purposes. All allocation transfers of balances are credited to this account, and subsequent obligations and outlays incurred by the child entity are also charged to this allocation account as they execute the delegated activity on behalf of the parent entity. Generally,
all financial activity related to these allocation transfers (e.g., budget authority, obligations, outlays) is reported in the financial statements of the parent entity, from which the underlying legislative authority, appropriations, and budget apportionments are derived. Per OMB guidance, child transfer activities are to be included and parent transfer activities are to be excluded in trial balances. Exceptions to this general rule affecting USAID include the Executive Office of the President, for whom USAID is the child in the allocation transfer but, per OMB guidance, will report all activity relative to these allocation transfers in USAID’s financial statements. In addition to these funds, USAID allocates funds as the parent to:
• U.S. Department of Agriculture, Forest Service
• U.S. Department of State.
USAID receives allocation transfers as the child from:
• U.S. Department of State
• Executive Office of the President
• Millennium Challenge Corporation
• U.S. Department of Agriculture, Commodity Credit Corporation.

95USAID FY 2018 AGENCY FINANCIAL REPORT | FINANCIAL SECTION
Fund Balance with Treasury (FBWT) is the aggregate amount of USAID’s accounts with Treasury for which the Agency is authorized to make payments. Other Funds include credit program and operating funds which are established to record amounts held for the loan guarantee and other operating funds.
As of September 30, 2018, the Agency’s records reflect a historical difference of $131 million after accounting for open reconciling items in its FBWT. M/CFO management is closely working with Treasury and OMB to resolve this difference, and anticipates to finalize this process in FY 2019.
Unobligated balances become available when apportioned by OMB for obligation in the current Fiscal Year. Obligated and other balances not yet disbursed (net) include balances for non-budgetary funds and unfilled customer orders without advances. The unobligated and obligated balances are reflected on the Combined Statement of Budgetary Resources. The total available unobligated balance includes expired funds which are available for upward adjustments, however they are not available to incur new obligations. In the Combined Statement of Budgetary Resources the expired fund balance is included in Unobligated Balance, Unapportioned. The obligated and other balances not yet disbursed include other liabilities without related budgetary obligations.
NOTE 2. FUND BALANCE WITH TREASURY
Fund Balance with Treasury as of September 30, 2018 and 2017 consisted of the following (in thousands):
Status of Fund Balance with Treasury 2018 2017
Unobligated Balance
Available $ 6,165,307 $ 10,781,461
Unavailable 8,753,181 3,686,625
Obligated and Other Balances Not Yet Disbursed (Net) 20,564,099 19,757,967
Total $ 35,482,587 $ 34,226,053

96 USAID FY 2018 AGENCY FINANCIAL REPORT | FINANCIAL SECTION
NOTE 3. ACCOUNTS RECEIVABLE, NET
The primary components of USAID’s Accounts Receivable, Net as of September 30, 2018 and 2017 are as follows (in thousands):
Receivable Gross
Allowance Accounts
Receivable Net 2018
Receivable Net 2017
Intragovernmental
Accounts Receivable from Federal Agencies $ 443,649 N/A $ 443,649 $ 619,878
Less: Intra-Agency Receivables (436,794) N/A (436,794) (619,760)
Total Intragovernmental Accounts Receivable 6,855 N/A 6,855 118
Accounts Receivable from the Public 116,967 (14,557) 102,410 40,619
Total Receivables $ 123,822 $ (14,557) $ 109,265 $ 40,737
Entity intragovernmental accounts receivable consist of amounts due from other U.S. Government Agencies. No allowance accounts have been established for the intragovernmental accounts receivable, which are considered to be 100 percent collectible.
All other entity accounts receivable consist of amounts managed by Missions or USAID/Washington. These receivables consist
of overdue advances, unrecovered advances, and audit findings. The allowance for uncollectable accounts related to these receivables is calculated based on a historical analysis of collectability. Accounts receivable from Missions are collected and recorded to the respective appropriation.
Interest receivable is calculated separately, and there is no interest included in the accounts receivable listed above.
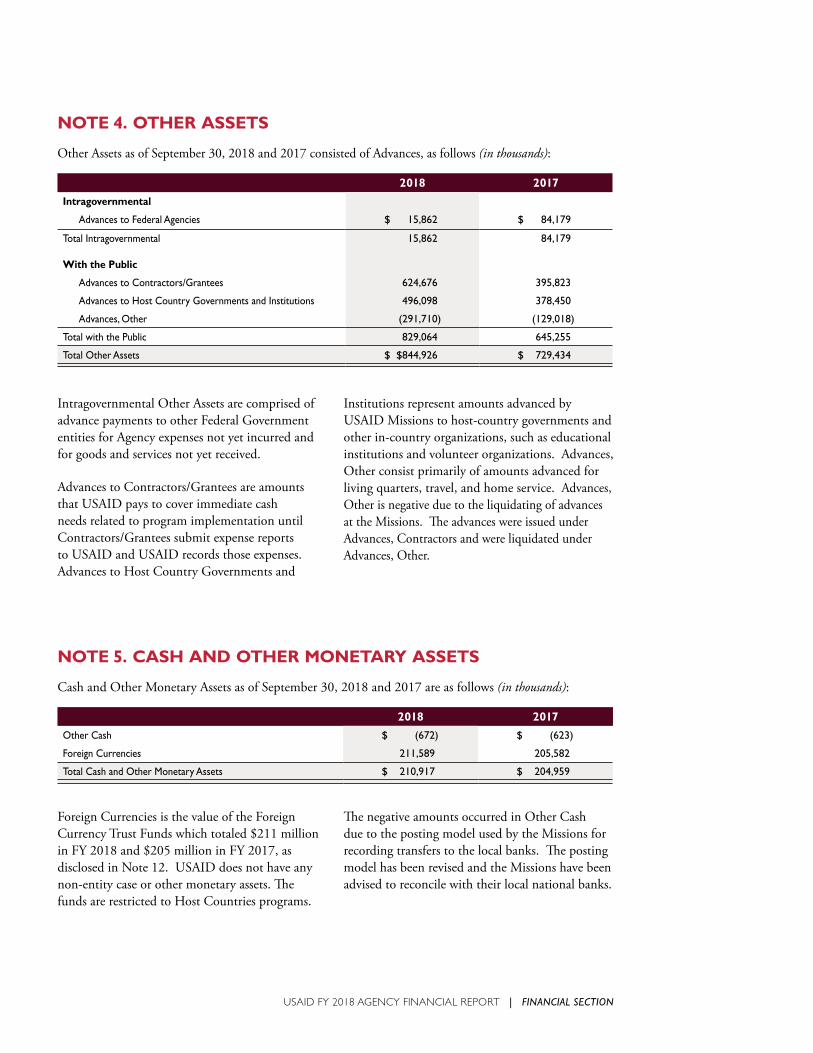
97USAID FY 2018 AGENCY FINANCIAL REPORT | FINANCIAL SECTION
Intragovernmental Other Assets are comprised of advance payments to other Federal Government entities for Agency expenses not yet incurred and for goods and services not yet received.
Advances to Contractors/Grantees are amounts that USAID pays to cover immediate cash needs related to program implementation until Contractors/Grantees submit expense reports to USAID and USAID records those expenses. Advances to Host Country Governments and
Institutions represent amounts advanced by USAID Missions to host-country governments and other in-country organizations, such as educational institutions and volunteer organizations. Advances, Other consist primarily of amounts advanced for living quarters, travel, and home service. Advances, Other is negative due to the liquidating of advances at the Missions. The advances were issued under Advances, Contractors and were liquidated under Advances, Other.
Foreign Currencies is the value of the Foreign Currency Trust Funds which totaled $211 million in FY 2018 and $205 million in FY 2017, as disclosed in Note 12. USAID does not have any non-entity case or other monetary assets. The funds are restricted to Host Countries programs.
The negative amounts occurred in Other Cash due to the posting model used by the Missions for recording transfers to the local banks. The posting model has been revised and the Missions have been advised to reconcile with their local national banks.
NOTE 4. OTHER ASSETS
Other Assets as of September 30, 2018 and 2017 consisted of Advances, as follows (in thousands):
2018 2017
Intragovernmental
Advances to Federal Agencies $ 15,862 $ 84,179
Total Intragovernmental 15,862 84,179
With the Public
Advances to Contractors/Grantees 624,676 395,823
Advances to Host Country Governments and Institutions 496,098 378,450
Advances, Other (291,710) (129,018)
Total with the Public 829,064 645,255
Total Other Assets $ $844,926 $ 729,434
NOTE 5. CASH AND OTHER MONETARY ASSETS
Cash and Other Monetary Assets as of September 30, 2018 and 2017 are as follows (in thousands):
2018 2017
Other Cash $ (672) $ (623)
Foreign Currencies 211,589 205,582
Total Cash and Other Monetary Assets $ 210,917 $ 204,959

98 USAID FY 2018 AGENCY FINANCIAL REPORT | FINANCIAL SECTION
NOTE 6. DIRECT LOANS AND LOAN GUARANTEES, NET
USAID operates the following loan and/or loan guarantee programs:
• Direct Loan Program (Direct Loan)
• Urban and Environmental Program (UE)
• Micro and Small Enterprise Development Program (MSED)
• Israel Loan Guarantee Program (Israel Loan)
• Development Credit Authority Program (DCA)
• Middle East North Africa (MENA) Loan Guarantee Program (comprised of Tunisia, Jordan, and Iraq Loan Guarantees)
• Ukraine Loan Guarantee Program
A description of these credit programs and the accounting for them is detailed in Note 1 of this report.
An analysis of loans receivable, loan guarantees, liability for loan guarantees, and the nature and amounts of the subsidy costs associated with the loans and loan guarantees are provided in the following sections. The following net loan receivable amounts are not the same as the proceeds that USAID would expect to receive from selling its loans. Actual proceeds may be higher or lower depending on the borrower and the status of the loan.
Summary of Loans Receivables, Net as of September 30, 2018 and 2017 are as follows (in thousands):
2018 2017
Net Direct Loans Obligated Prior to FY 1992 (Allowance for Loss Method) $ 836,456 $ 1,099,625
Net Direct Loans Obligated After FY 1991 (Present Value Method) (83,913) (23,717)
Defaulted Guaranteed Loans from Pre-1992 (Allowance for Loss Method) 71,920 84,429
Defaulted Guaranteed Loans Post-1991 (Present Value) 112,155 106,284
Total Loans Receivable, Net as reported on the Balance Sheet $ 936,618 $ 1,266,621

99USAID FY 2018 AGENCY FINANCIAL REPORT | FINANCIAL SECTION
DIRECT LOANS
Direct Loan amounts for loans obligated prior to 1992 and after 1991 as of September 30, 2018 and 2017 are as follows (in thousands):
Loan Programs
Loans Receivable
GrossInterest
ReceivableAllowance for Loan Losses
Value of Assets Related to Direct
Loans, Net
Direct Loans Obligated Prior to 1992 (Allowance for Loss Method) as of September 30, 2018:
Direct Loans $ 1,047,908 $ 354,864 $ (566,316) $ 836,456
MSED 29 5 (34) –
Total $ 1,047,937 $ 354,869 $ (566,350) $ 836,456
Direct Loans Obligated Prior to 1992 (Allowance for Loss Method) as of September 30, 2017:
Direct Loans $ 1,305,079 $ 339,219 $ (544,673) $ 1,099,625
MSED 29 5 (34) –
Total $ 1,305,108 $ 339,224 $ (544,707) $ 1,099,625
Loan Programs
Loans Receivable
GrossInterest
ReceivableAllowance for Subsidy Cost
Value of Assets Related to Direct
Loans, Net
Direct Loans Obligated After 1991 (Present Value) as of September 30, 2018:
Direct Loans $ 708,928 $ 6,526 $ (799,367) $ (83,913)
Total $ 708,928 $ 6,526 $ (799,367) $ (83,913)
Direct Loans Obligated After 1991 (Present Value) as of September 30, 2017:
Direct Loans $ 744,512 $ 8,808 $ (777,037) $ (23,717)
Total $ 744,512 $ 8,808 $ (777,037) $ (23,717)
Total Amount of Direct Loans Disbursed as of September 30, 2018 and 2017 are as follows (in thousands):
Direct Loan Programs 2018 2017
Direct Loans $ 1,756,836 $ 2,049,591
MSED 29 29
Total $ 1,756,865 $ 2,049,620

100 USAID FY 2018 AGENCY FINANCIAL REPORT | FINANCIAL SECTION
Schedule for Reconciling Subsidy Cost Allowance Balances (Post-1991 Direct Loans) as of September 30, 2018 and 2017 are as follows (in thousands):
2018 2017
Direct Loan
UE (Subrogated
Claims) TotalDirect Loan
UE (Subrogated
Claims) Total
Beginning Balance of the Subsidy Cost Allowance $ 777,037 $ (1,896) $ 775,141 $741,888 $ 6 $ 741,894
Add: Subsidy Expense for Direct Loans Disbursed During the Reporting Years by Component:
(A) Interest Rate Differential Costs – – – – – –
(B) Default Costs (Net of Recoveries) – – – – – –
(C) Fees and Other Collections – – – – – –
(D) Other Subsidy Costs – – – – – –
Total of the Above Subsidy Expense Components – – – – – –
Adjustments:
(A) Loan Modifications – – – – – –
(B) Fees Received – – – – – –
(C) Foreclosed Property Acquired – – – – – –
(D) Loans Written Off – – – – – –
(E) Subsidy Allowance Amortization 19,843 – 19,843 20,797 – 20,797
(F) Other 2,487 1,896 4,383 14,352 (1,902) 12,450
Ending Balance of the Subsidy Cost Allowance Before Reestimates $ 799,367 $ – $ 799,367 $ 777,037 $ (1,896) $ 775,141
Add or Subtract Subsidy Reestimates by Component:
(A) Interest Rate Reestimate – – – – – –
(B) Technical/Default Reestimate – – – – – –
Total of the Above Reestimate Components – – – – – –
Ending Balance of the Subsidy Cost Allowance $799,367 $ – $ 799,367 $ 777,037 $ (1,896) $775,141
DEFAULTED GUARANTEED LOANS FROM PRE-1992 GUARANTEES
Defaulted Guaranteed Loans from Pre-1992 Guarantees (Allowance for Loss Method) as of September 30, 2018 and 2017 are as follows (in thousands):
Loan Guarantee Programs
Defaulted Guaranteed
Loans Receivable,Gross
InterestReceivable
AllowanceFor Loan
Losses
Value of Assets Related to DefaultedGuaranteed Loans
Receivable, Net
Defaulted Guaranteed Loans from Pre-1992 Guarantees (Allowance for Loss Method): 2018
UE $ 108,457 $ 7,737 $ (44,274) $ 71,920
Total $ 108,457 $ 7,737 $ (44,274) $ 71,920
Defaulted Guaranteed Loans from Pre-1992 Guarantees (Allowance for Loss Method): 2017
UE $ 122,263 $ 7,164 $ (44,998) $ 84,429
Total $ 122,263 $ 7,164 $ (44,998) $ 84,429
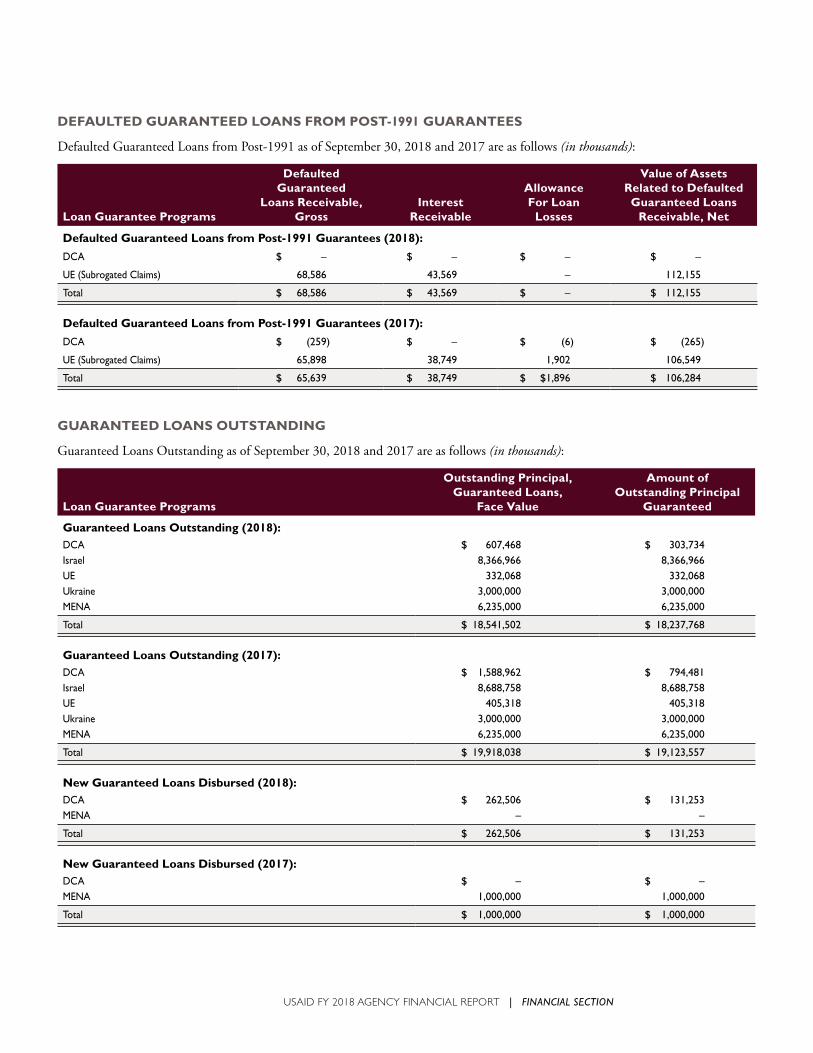
101USAID FY 2018 AGENCY FINANCIAL REPORT | FINANCIAL SECTION
DEFAULTED GUARANTEED LOANS FROM POST-1991 GUARANTEES
Defaulted Guaranteed Loans from Post-1991 as of September 30, 2018 and 2017 are as follows (in thousands):
Loan Guarantee Programs
Defaulted Guaranteed
Loans Receivable,Gross
InterestReceivable
AllowanceFor Loan
Losses
Value of Assets Related to DefaultedGuaranteed Loans
Receivable, Net
Defaulted Guaranteed Loans from Post-1991 Guarantees (2018):
DCA $ – $ – $ – $ –
UE (Subrogated Claims) 68,586 43,569 – 112,155
Total $ 68,586 $ 43,569 $ – $ 112,155
Defaulted Guaranteed Loans from Post-1991 Guarantees (2017):
DCA $ (259) $ – $ (6) $ (265)
UE (Subrogated Claims) 65,898 38,749 1,902 106,549
Total $ 65,639 $ 38,749 $ $1,896 $ 106,284
GUARANTEED LOANS OUTSTANDING
Guaranteed Loans Outstanding as of September 30, 2018 and 2017 are as follows (in thousands):
Loan Guarantee Programs
Outstanding Principal,Guaranteed Loans,
Face Value
Amount of Outstanding Principal
Guaranteed
Guaranteed Loans Outstanding (2018):DCA $ 607,468 $ 303,734Israel 8,366,966 8,366,966UE 332,068 332,068Ukraine 3,000,000 3,000,000MENA 6,235,000 6,235,000
Total $ 18,541,502 $ 18,237,768
Guaranteed Loans Outstanding (2017):DCA $ 1,588,962 $ 794,481 Israel 8,688,758 8,688,758 UE 405,318 405,318 Ukraine 3,000,000 3,000,000 MENA 6,235,000 6,235,000
Total $ 19,918,038 $ 19,123,557
New Guaranteed Loans Disbursed (2018):DCA $ 262,506 $ 131,253MENA – –
Total $ 262,506 $ 131,253
New Guaranteed Loans Disbursed (2017):DCA $ – $ –MENA 1,000,000 1,000,000
Total $ 1,000,000 $ 1,000,000

102 USAID FY 2018 AGENCY FINANCIAL REPORT | FINANCIAL SECTION
Liability for Loan Guarantees as of September 30, 2018 and 2017 are as follows (in thousands):
Loan Guarantee Programs
Liabilities for Losses on Pre-1992Guarantees,
Estimated Future Default Claims
Liabilities for Post-1991
GuaranteesLoan Guarantee
Liabilities
Liability for Loan Guarantees as of September 30, 2018:
UE $ 176 $ 155,072 $ 155,248
MSED – 1 1
Israel – 1,101,548 1,101,548
DCA – 92,209 92,209
Ukraine – 1,182,907 1,182,907
MENA – 1,194,286 1,194,286
Total $ 176 $ 3,726,023 $ 3,726,199
Liability for Loan Guarantees as of September 30, 2017:
UE $ 176 $ 156,953 $ 157,129
MSED – 1 1
Israel – 1,173,872 1,173,872
DCA – 81,357 81,357
Ukraine – 1,121,642 1,121,642
MENA – 1,086,038 1,086,038
Total $ 176 $ 3,619,863 $ 3,620,039
SUBSIDY EXPENSE FOR LOAN GUARANTEES BY PROGRAM AND COMPONENT
Subsidy Expense for Loan Guarantees by Program and Component as of September 30, 2018 and 2017 are as follows (in thousands):
Loan Guarantee ProgramsInterest
Supplements DefaultsFees and Other
Collections Other Total
Subsidy Expense for New Loan Guarantees (2018):
DCA $ – $9,953 $(1,670) $ – $8,283
MENA – – – – –
Total $ – $9,953 $(1,670) $ – $8,283
Subsidy Expense for New Loan Guarantees (2017):
DCA $ – $ 15,268 $ (3,198) $ – $ 12,070
MENA – 255,312 – – 255,312
Total $ – $ 270,580 $ (3,198) $ – $ 267,382
(continued on next page)

103USAID FY 2018 AGENCY FINANCIAL REPORT | FINANCIAL SECTION
(continued)
Loan Guarantee ProgramsTotal
ModificationsInterest Rate Reestimates
Technical Reestimates
Total Reestimates
Modifications and Reestimates (2018):
UE $ – $ – $ (8,876) $ (8,876)
Israel – – (151,948) (151,948)
DCA 4 – (1,227) (1,223)
Ukraine – – 33,740 33,740
MENA – – 89,681 89,681
Total $ 4 $ – $ (38,630) $ (38,626)
Modifications and Reestimates (2017):
UE $ – $ – $ – $ –
Israel – – – –
DCA – 506 6,331 6,837
Ukraine – 2,176 40,000 42,176
MENA – 24,295 276,434 300,729
Total $ – $ 26,977 $ 322,765 $ 349,742
Total Loan Guarantee Subsidy Expense as of September 30, 2018 and 2017 are as follows (in thousands):
Loan Guarantee Programs 2018 2017
UE $ (8,876) $ –
Israel (151,948) –
DCA 7,060 18,907
Ukraine 33,740 42,176
MENA 89,681 556,041
Total $ (30,343) $ 617,124
SUBSIDY RATES FOR LOAN GUARANTEES BY PROGRAM AND COMPONENT
Budget Subsidy Rates for Loan Guarantees for the Current Year’s Cohorts are as follows (percent):
Loan Guarantee Programs
Interest Supplements
(%) Defaults (%)
Fees and Other
Collections (%) Other (%) Total (%)
DCA – 8.78% -4.59% – 4.19%

104 USAID FY 2018 AGENCY FINANCIAL REPORT | FINANCIAL SECTION
Schedule for Reconciling Loan Guarantee Liability Balances (Post-1991 Loan Guarantees) as of September 30, 2018 and 2017 are as follows (in thousands):
2018: Post-1991 Loan Guarantees
DCA MSED UE Israel Ukraine MENA Total
Beginning Balance of the Loan Guarantee Liability $ 81,357 $ 1 $ 156,953 $ 1,173,872 $ 1,121,642 $ 1,086,038 $ 3,619,863Add: Subsidy Expense for Guaranteed Loans Disbursed
During the Reporting Years by Component: (A) Interest Supplement Costs – – – – – – – (B) Default Costs (Net of Recoveries) 9,953 – – – – – 9,953 (C) Fees and Other Collections 1,670 – – – – – 1,670 (D) Other Subsidy Costs – – – – – – –
Total of the Above Subsidy Expense Components $ 11,623 $ – $ – $ – $ – $ – $ 11,623Adjustments: (A) Loan Guarantee Modifications – – – – – – – (B) Fees Received 2,730 – 711 – – – 3,441 (C) Interest Supplements Paid – – – – – – – (D) Foreclosed Property and Loans Acquired – – – – – – – (E) Claim Payments to Lenders (5,390) – – – – – (5,390) (F) Interest Accumulation on the Liability Balance 3,116 – 3,225 79,624 27,525 18,567 132,057 (G) Other – – 3,059 – – – 3,059
Ending Balance of the Loan Guarantee Liability Before Reestimates $ 93,436 $ 1 $ 163,948 $ 1,253,496 $ 1,149,167 $ 1,104,605 $ 3,764,653Add or Subtract Subsidy Reestimates by Component: (A) Interest Rate Reestimate – – – – – – – (B) Technical/Default Reestimate (1,227) – (8,876) (151,948) 33,740 89,681 (38,630)
Total of the Above Reestimate Components (1,227) – (8,876) (151,948) 33,740 89,681 (38,630)
Ending Balance of the Loan Guarantee Liability $ 92,209 $ 1 $ 155,072 $ 1,101,548 $ 1,182,907 $ 1,194,286 $ 3,726,023
2017: Post-1991 Loan Guarantees
DCA MSED UE Israel Ukraine MENA Total
Beginning Balance of the Loan Guarantee Liability $ 91,175 $ 1 $ 150,444 $ 1,210,343 $ 1,141,061 $ 552,553 $ 3,145,577 Add: Subsidy Expense for Guaranteed Loans Disbursed
During the Reporting Years by Component: (A) Interest Supplement Costs – – – – – – – (B) Default Costs (Net of Recoveries) – – – – – – – (C) Fees and Other Collections – – – – – – – (D) Other Subsidy Costs – – – – – – –
Total of the Above Subsidy Expense Components $ – $ – $ – $ – $ – $ – $ –Adjustments: (A) Loan Guarantee Modifications – – – – – – – (B) Fees Received 3,444 – 1,908 – – – 5,352 (C) Interest Supplements Paid – – – – – – – (D) Foreclosed Property and Loans Acquired – – – – – – – (E) Claim Payments to Lenders (12,569) – (9,864) – – – (22,433) (F) Interest Accumulation on the Liability Balance 3,085 – 2,962 82,454 24,956 17,384 130,841 (G) Other (17,314) – 7,276 – 1 255,312 245,275
Ending Balance of the Loan Guarantee Liability Before Reestimates $ 67,821 $ 1 $ 152,726 $ 1,292,797 $ 1,166,018 $ 825,249 $ 3,504,612 Add or Subtract Subsidy Reestimates by Component: (A) Interest Rate Reestimate – – – – – – – (B) Technical/Default Reestimate 13,536 – 4,227 (118,925) (44,376) 260,789 115,251
Total of the Above Reestimate Components 13,536 – 4,227 (118,925) (44,376) 260,789 115,251
Ending Balance of the Loan Guarantee Liability $ 81,357 $ 1 $ 156,953 $ 1,173,872 $ 1,121,642 $ 1,086,038 $ 3,619,863

105USAID FY 2018 AGENCY FINANCIAL REPORT | FINANCIAL SECTION
Administrative Expense as of September 30, 2018 and 2017 are as follows (in thousands):
Loan Guarantee Programs 2018 2017
DCA $ 9,408 $ 28,498
Total $ 9,408 $ 28,498
OTHER INFORMATION
1. Allowance for loss for pre-1992 receivables have been calculated in accordance with OMB guidance using an allowance for loss method which assigns risk ratings to receivables based upon the country of debtor. No country is in violation of Section 620q of the Foreign Assistance Act, that is more than six months delinquent. Five countries are in violation of the Brooke-Alexander Amendment to the Foreign Operations Export Financing and Related Programs Appropriations Act, owing $519.7 million that is more than one year delinquent.
2. Reestimate amounts calculated during the year are subject to approval by OMB, and any adjustments, if necessary, will be made in FY 2019. In 2018, the DCA portfolio had two guarantees that extended the coverage expiration date of the agreements which subsequently resulted in a $4 thousand modification in the subsidy cost for these guarantees.
3. The subsidy rates disclosed pertain only to the current year’s cohorts. These rates cannot be applied to the guarantees of loans disbursed during the current reporting year to yield the subsidy expense. The subsidy expense for new loan guarantees reported in the current year could result from disbursements of loans from both current year cohorts and prior year(s) cohorts. The subsidy expense reported in the current year also includes modifications and reestimates.
4. New guaranteed loans disbursed under the DCA guarantee program are maintained within USAID’s Central Management System.
5. The $(83.9) million asset reported for post-1991 direct loans is attributed to the increase in the allowance for subsidy over the years. Financing account interest is calculated at the end of each Fiscal Year per Treasury and OMB guidelines. This accumulated interest income and expense has gradually created an abnormal balance for the direct loan financing account since the offset of the cash receipts/disbursements on the interest is in the allowance for subsidy account. There have been no new direct loans in recent years and these historical loans continue to draw down as borrowers repay. The abnormal balance will clear when USAID returns the funds to Treasury.

106 USAID FY 2018 AGENCY FINANCIAL REPORT | FINANCIAL SECTION
NOTE 7. INVENTORY AND RELATED PROPERTY, NET
USAID’s Inventory and Related Property, Net is comprised of Operating Materials and Supplies. Operating Materials and Supplies as of September 30, 2018 and 2017 are as follows (in thousands):
2018 2017
Items Held for Use
Office Supplies $ 4,006 $ 2,364
Items Held in Reserve for Future Use
Disaster Assistance Materials and Supplies 8,560 6,666
Birth Control Supplies 14,018 16,141
Total Inventory and Related Property $ 26,584 $ 25,171
Operating Materials and Supplies are considered tangible properties that are consumed in the normal course of business and not held for sale. The valuations are based on historical acquisition
costs. There are no obsolete or unserviceable items, and no restrictions on their use. Items costing less than $25,000 are expensed as incurred.
NOTE 8. GENERAL PROPERTY, PLANT AND EQUIPMENT, NET
The components of Property, Plant and Equipment (PP&E), Net as of September 30, 2018 and 2017 are as follows (in thousands):
2018 Useful Life Cost
Accumulated Depreciation/ Amortization
Net BookValue
Classes of Fixed Assets:
Equipment 3 to 5 years $ 58,862 $ (48,829) $ 10,033
Buildings, Improvements, and Renovations 5 to 20 years 111,757 (54,818) 56,939
Land and Land Rights N/A 7,203 N/A 7,203
Construction in Progress N/A 3 – 3
Internal Use Software 3 to 5 years 128,717 (121,525) 7,192
Total PP&E $ 306,542 $ (225,172) $ 81,370
2017 Useful Life Cost
Accumulated Depreciation/ Amortization
Net BookValue
Classes of Fixed Assets:
Equipment 3 to 5 years $ 59,757 $ (47,300) $ 12,457
Buildings, Improvements, and Renovations 5 to 20 years 115,133 (53,258) 61,875
Land and Land Rights N/A 7,203 N/A 7,203
Construction in Progress N/A 5 – 5
Internal Use Software 3 to 5 years 124,625 (118,301) 6,324
Total PP&E $ 306,723 $ (218,859) $ 87,864
(continued on next page)

107USAID FY 2018 AGENCY FINANCIAL REPORT | FINANCIAL SECTION
NOTE 9. LEASES
As of September 30, 2018, Future Lease Payments consisted of the following (in thousands):
Operating Leases:
Future Payments Due: 2018 Fiscal Year Future Costs
2019 $ 115,6982020 101,5072021 33,7202022 22,2762023 11,7952024 and Beyond 6,254
Total Future Lease Payments $ 291,250
Future operating lease payments total $291 million in future lease payments, of which $151 million is for the USAID headquarters in Washington, D.C., and the remainder is for the Missions. The current lease agreements are for approximately 893,888 sq. feet for the headquarters. The expiration dates for
headquarters leases are from FY 2019 through FY 2022 and the expiration dates for the Missions’ leases are from FY 2019 through FY 2028. All the leases are non-cancelable and the lessor for headquarters is General Services Administration (GSA), which charges commercial rates for USAID’s occupancy.
Equipment consists primarily of electric generators, Automatic Data Processing (ADP) hardware, vehicles, and copiers located at the overseas field Missions.
Buildings, Improvements, and Renovations, in addition to Land and Land Rights include USAID-owned office buildings and residences at foreign Missions, including the land on
which these structures reside. These structures are used and maintained by the field Missions. USAID generally does not separately report the cost of the building and the land on which the building resides.
Land consists of property owned by USAID in foreign countries. Land is generally procured with the intent of constructing buildings.

108 USAID FY 2018 AGENCY FINANCIAL REPORT | FINANCIAL SECTION
NOTE 10. LIABILITIES NOT COVERED BY BUDGETARY RESOURCES
As of September 30, 2018 and 2017 Liabilities Not Covered by Budgetary Resources were as follows (in thousands):
2018 2017
Liabilities Not Covered by Budgetary Resources:
Intragovernmental:Unfunded FECA Liability (Note 13) $ 5,164 $ 8,205Other Unfunded Employment Related Liability 55 296Other Liabilities (Note 12) 2,302 1,722
Total Intragovernmental $ 7,521 $ 10,223Accrued Annual Leave 54,215 55,539Future Workers’ Compensation Benefits (Note 13) 23,469 26,938Debt – Contingent Liabilities for Loan Guarantees (Note 6) 176 176
Total Liabilities Not Covered by Budgetary Resources 85,381 92,876Total Liabilities Covered by Budgetary Resources 8,532,576 8,156,240
Total Liabilities $ 8,617,957 $ 8,249,116
USAID records liabilities for amounts that are likely to be paid as the direct result of events that have already occurred. USAID considers the Intragovernmental accounts payable as liabilities covered under budgetary resources. These accounts payable are those payable to other Federal Agencies and consist mainly of unliquidated obligation balances related to interagency agreements between USAID and other Federal Agencies. The accounts payable with the public represent liabilities to non-Federal entities.
Liabilities not covered by budgetary resources include accrued unfunded annual leave and
separation pay. Although future appropriations to fund these liabilities are probable and anticipated, Congressional action is needed before budgetary resources can be provided. Accrued unfunded annual leave, workers’ compensation benefits, and separation pay represent future liabilities not currently funded by budgetary resources, but will be funded as it becomes due with future resources. The Contingent Liabilities for Loan Guarantees is in the pre-Credit Reform Urban and Environmental (UE) Housing Loan Guarantee liquidating fund. As such, it represents the estimated liability to lenders for future loan guarantee defaults in that program.

109USAID FY 2018 AGENCY FINANCIAL REPORT | FINANCIAL SECTION
NOTE 11. INTRAGOVERNMENTAL DEBT
USAID Intragovernmental Debt as of September 30, 2018 and 2017 consisted of the following borrowings from Treasury for post-1991 loan programs, which is classified as other debt (in thousands):
Debt Due to Treasury
2017 Beginning Balance
NetBorrowing
2017 EndingBalance
NetBorrowing
2018 EndingBalance
Direct Loans $ 409,825 $ (373,749) $ 36,076 $ – $ 36,076
DCA 3,095 (2,467) 628 (18) 610
Total Treasury Debt $ 412,920 $ (376,216) $ 36,704 $ (18) $ 36,686
Pursuant to the Federal Credit Reform Act of 1990, Agencies with credit programs have permanent indefinite authority to borrow funds from the Treasury. These funds are used to fund the unsubsidized portion of direct loans and, in certain situations, to cover credit program costs.
The above disclosed debt is principal payable to Treasury, which represents Financing account borrowings from Treasury. During the year, the DCA program borrowed $57 thousand and repaid $39 thousand. The interest paid to Treasury’s Bureau of the Fiscal Service on the outstanding debt was $1.8 million in total.
Pre-1992 loan equity reported in the Liquidating account in the amount of $919 million is required to be recorded as Liability for Capital Transfers to the General Fund of the Treasury. As of September 30, 2018, $290 million in excess funds from the Liquidating account were transferred to Treasury. In addition, $238 million in Liability for Capital Transfers from downward reestimates is anticipated to be paid to Treasury next year. All debt shown is intragovernmental debt.

110 USAID FY 2018 AGENCY FINANCIAL REPORT | FINANCIAL SECTION
NOTE 12. OTHER LIABILITIES
As of September 30, 2018 and 2017 Other Current Liabilities consisted of the following (in thousands):
2018 2017
Intragovernmental
IPAC Suspense $ 4,770 $ 5,896
Unfunded FECA Liability (Note 13) 5,164 8,205
Custodial Liability 7,575 4,570
Employer Contributions & Payroll Taxes Payable 7,144 5,083
Other Unfunded Employment Related Liability 55 296
Liability for Advances and Prepayments 724,583 735,605
Other Liabilities 2,302 1,722
Total Intragovernmental $ 751,593 $ 761,377
With the Public
Accrued Funded Payroll and Leave 9,656 20,808
Accrued Unfunded Annual Leave and Separation Pay (Note 10) 54,215 55,539
Advances From Others 51,600 61,466
Foreign Currency Trust Fund 211,589 205,582
Other Liabilities 106,459 83,344
Total Liabilities With the Public $ 433,519 $ 426,739
Total Other Liabilities $ 1,185,112 $ 1,188,116
Intragovernmental Liabilities represent amounts due to other Federal Agencies. All remaining Other Liabilities are liabilities to non-Federal entities.

111USAID FY 2018 AGENCY FINANCIAL REPORT | FINANCIAL SECTION
NOTE 13. FEDERAL EMPLOYEES AND VETERAN’S BENEFITS
The provision for workers’ compensation benefits payable, as of September 30, 2018 and 2017 are indicated in the table below (in thousands):
Unfunded Workers’ Compensation Benefits 2018 2017
Liabilities Not Covered by Budgetary Resources
Future Workers’ Compensation Benefits $ 23,469 $ 26,938
Accrued Unfunded FECA Liability 5,164 8,205
Total Unfunded Workers’ Compensation Benefits $ 28,633 $ 35,143
The Federal Employees’ Compensation Act (FECA) provides income and medical cost protection to covered Federal civilian employees injured on the job and to beneficiaries of employees whose deaths are attributable to job-related injury or disease. The FECA program is administered by the U.S. Department of Labor (DOL). DOL initially pays valid FECA claims for all Federal Government Agencies and seeks reimbursement two Fiscal Years later from the Federal Agencies employing the claimants.
For FY 2018, USAID’s total FECA liability was $28.6 million, comprised of unpaid FECA billings for $5.2 million and estimated future FECA costs of $23.5 million.
The actuarial estimate for the FECA unfunded liability is determined by the DOL using a method which uses historical benefit payment patterns. The projected annual benefit payments are discounted to present value using economic assumption for 10-year Treasury notes and bonds and the amount is further adjusted for inflation.
NOTE 14. COMMITMENTS AND CONTINGENCIES
An estimate of the amount or range of potential loss is $1 million. The possibility of an unfavor-able outcome is reasonably possible.
• The second case is an assessed fine on private security companies for exceeding employment quota, "pattern of assignments" claim. USAID will contest the case vigorously. An estimate of the amount or range of potential loss is $1 million. The possibility of an unfavorable outcome is reasonably possible.
• The third case is a complaint to obtain class certification to challenge the USAID/State Department Policies and Practices regarding medical clearances in the hiring of Foreign Service Limited/Term Foreign Service position. USAID will contest the case vigorously. An estimate of the amount or range of potential loss is $4 million. The possibility of an unfavorable outcome is reasonably possible.
USAID is involved in certain claims, suits, and complaints that have been filed or are pending. These matters are in the ordinary course of the Agency’s operations and are not expected to have a material adverse effect on the Agency’s financial operations.
As of September 30, 2018 one out of two cases open was dismissed for lack of Jurisdiction, with one case ("first case" below) pending with no change in status between FY 2017 fourth quarter ending September 30, 2017 and FY 2018 fourth quarter ending September 30, 2018. There were two new cases added to the pending case as of September 30, 2018 and another one opened on November 7, 2018. The following are the details regarding the four pending cases:
• The first case is an employment discrimination, non-selection and retaliations claim. USAID is involved in settlement negotiations at this time.
(continued on next page)

112 USAID FY 2018 AGENCY FINANCIAL REPORT | FINANCIAL SECTION
NOTE 15. SCHEDULE OF COSTS AND EARNED REVENUE
The Consolidated Statement of Net Cost reports the Agency’s gross costs less earned revenues to arrive at net cost of operations by Program Categories and Responsibility Segments, as of September 30, 2018. These categories are consistent with the new State-USAID Standardized Program Structure and Definition (SPSD).
The format of the Consolidated Statement of Net Cost is also consistent with OMB Circular A-136 guidance.
Note 15 shows the value of exchange transactions between USAID and other Federal entities as well as non-Federal entities. These are also categorized within the Agency by Program Categories, Responsibility Segments, and Program Areas are defined in Note 16.
Intragovernmental Costs and Earned Revenue sources relate to transactions between USAID and other Federal entities. Public costs and earned revenues on the other hand relate to transactions between USAID and non-Federal entities. Program Costs and Earned Revenue by Responsibility Segment for the years ended September 30, 2018 and 2017 are indicated in the table on the following pages (in thousands):
• The fourth case is a Contract Disputes Act claim for additional amounts allegedly owed for performance of two USAID contracts. USAID will contest the case vigorously. An estimate of the amount or range of potential loss is $0 to $8.8 million. The possibility of an unfavorable outcome is reasonably possible.
USAID’s normal course of business involves the execution of project agreements with foreign governments that are a type of treaty. All of these agreements give rise to obligations that are fully reported on USAID’s financial statements, and none of which are contingent. It is not USAID’s normal business practice to enter into other types of agreements or treaties with foreign governments that create contingent liabilities.

113USAID FY 2018 AGENCY FINANCIAL REPORT | FINANCIAL SECTION
Cat
ego
ries
Afr
ica
Asi
a D
CH
AE
3
Eu
rop
e &
E
ura
sia
Glo
bal
Hea
lth
IDE
A
&
LA
B
Lat
in
Am
eric
a &
Car
ibbe
anM
idd
le
Eas
tO
AP
A
2018
C
onso
lidat
edTo
tal
2017
C
onso
lidat
edTo
tal
DR
–Dem
ocra
cy, H
uman
Rig
hts
and
Gov
erna
nce
Intr
agov
ernm
enta
l Cos
ts$
8,41
8$
6,84
5$
1,63
3$
15,7
31$
11,5
80$
–$
13$
21,0
02$
7,04
1$
17,5
52$
89,8
15$
68,4
48
Publ
ic C
osts
196,
651
108,
906
20,0
4551
,787
167,
903
–
326
331,
170
162,
443
572,
448
1,61
1,67
91,
286,
931
Tota
l Pro
gram
Cos
ts20
5,06
911
5,75
121
,678
67,5
1817
9,48
3
–33
935
2,17
216
9,48
459
0,00
01,
701,
494
1,35
5,37
9In
trag
over
nmen
tal E
arne
d Re
venu
e(6
23)
(562
)
(128
)(1
,204
)(9
21)
–
(1)
(1,6
18)
(527
)(1
,292
)(6
,876
)(5
,320
)
Publ
ic E
arne
d Re
venu
e(2
5)(2
2)
(5)
(48)
(37)
–
–
(65)
(218
)(5
2)(4
72)
(4,6
90)
Tota
l Ear
ned
Reve
nue
(648
)(5
84)
(1
33)
(1,2
52)
(958
)
–(1
)(1
,683
)(7
45)
(1,3
44)
(7,3
48)
(10,
010)
Net
Pro
gram
Cos
ts20
4,42
111
5,16
721
,545
66,2
6617
8,52
5
–33
835
0,48
916
8,73
958
8,65
61,
694,
146
1,34
5,36
9
EG–E
cono
mic
Gro
wth
Intr
agov
ernm
enta
l Cos
ts56
,050
28,5
0336
37,2
4311
,737
–
45,2
8229
,431
48,8
1326
,419
283,
514
349,
064
Publ
ic C
osts
708,
111
340,
862
885
636,
863
116,
908
–
167,
660
223,
654
828,
168
281,
433
3,30
4,54
44,
122,
061
Tota
l Pro
gram
Cos
ts76
4,16
136
9,36
592
167
4,10
612
8,64
5
–21
2,94
225
3,08
587
6,98
130
7,85
23,
588,
058
4,47
1,12
5In
trag
over
nmen
tal E
arne
d Re
venu
e(2
,304
)(1
,871
)
(3)
(136
,584
)(6
69)
–
(3,6
59)
(1,1
63)
(3,7
44)
(1,1
59)
(151
,156
)(6
44,3
20)
Publ
ic E
arne
d Re
venu
e(8
9)(7
5)
–(1
,925
)(2
7)
–(1
46)
(46)
(149
)(4
6)(2
,503
)(4
5,03
2)To
tal E
arne
d Re
venu
e(2
,393
)(1
,946
)
(3)
(138
,509
)(6
96)
–
(3,8
05)
(1,2
09)
(3,8
93)
(1,2
05)
(153
,659
)(6
89,3
52)
Net
Pro
gram
Cos
ts76
1,76
836
7,41
991
853
5,59
712
7,94
9
–20
9,13
725
1,87
687
3,08
830
6,64
73,
434,
399
3,78
1,77
3
ES–E
duca
tion
and
Soc
ial S
ervi
ces
Intr
agov
ernm
enta
l Cos
ts15
,284
7,12
31,
290
5,29
252
840
360
7,09
826
,143
7,59
970
,757
52,8
38Pu
blic
Cos
ts37
0,57
210
3,76
741
,636
86,1
976,
492
907,
799
120,
749
216,
181
162,
390
1,11
5,87
31,
282,
510
Tota
l Pro
gram
Cos
ts38
5,85
611
0,89
042
,926
91,4
897,
020
130
8,15
912
7,84
724
2,32
416
9,98
91,
186,
630
1,33
5,34
8In
trag
over
nmen
tal E
arne
d Re
venu
e(1
,201
)(5
58)
(1
06)
(3,6
60)
(49)
(3)
(30)
(574
)(8
01)
(624
)(7
,606
)(6
,897
)
Publ
ic E
arne
d Re
venu
e(4
8)(2
2)
(4)
(17)
(2)
–
(1)
(23)
(32)
(25)
(174
)(5
77)
Tota
l Ear
ned
Reve
nue
(1,2
49)
(580
)
(110
)(3
,677
)(5
1)(3
)(3
1)(5
97)
(833
)(6
49)
(7,7
80)
(7,4
74)
Net
Pro
gram
Cos
ts38
4,60
711
0,31
042
,816
87,8
126,
969
127
8,12
812
7,25
024
1,49
116
9,34
01,
178,
850
1,32
7,87
4
HA
–Hum
anit
aria
n A
ssis
tanc
eIn
trag
over
nmen
tal C
osts
–
1,20
313
1,09
9
–26
2
–78
41,
677
209
135,
000
132,
714
Publ
ic C
osts
–
9,83
13,
601,
803
–
216
911
–
15,0
7443
,083
2,30
43,
673,
222
2,89
0,62
9To
tal P
rogr
am C
osts
–
11,0
343,
732,
902
–
242
913
–
15,8
5844
,760
2,51
33,
808,
222
3,02
3,34
3In
trag
over
nmen
tal E
arne
d Re
venu
e
–(6
5)
(7,2
66)
–
(2)
–
–
(64)
(138
)(1
7)(7
,552
)(1
,875
)
Publ
ic E
arne
d Re
venu
e
–(3
)
(290
)
–
–
–
–(3
)(5
)(1
)(3
02)
(18,
086)
Tota
l Ear
ned
Reve
nue
–
(68)
(7
,556
)
–(2
)
–
–(6
7)(1
43)
(18)
(7,8
54)
(19,
961)
Net
Pro
gram
Cos
ts
–10
,966
3,72
5,34
6
–24
091
3
–15
,791
44,6
172,
495
3,80
0,36
83,
003,
382
(con
tinue
d on
nex
t pag
e)

114 USAID FY 2018 AGENCY FINANCIAL REPORT | FINANCIAL SECTION
(con
tinue
d)
Cat
ego
ries
Afr
ica
Asi
a D
CH
AE
3
Eu
rop
e &
E
ura
sia
Glo
bal
Hea
lth
IDE
A
&
LA
B
Lat
in
Am
eric
a &
Car
ibbe
anM
idd
le
Eas
tO
AP
A
2018
C
onso
lidat
edTo
tal
2017
C
onso
lidat
edTo
tal
HL–
Hea
lth
Intr
agov
ernm
enta
l Cos
ts10
9,10
625
,368
724,
369
1,75
972
,394
–
7,43
37,
571
6,56
923
4,64
124
3,55
0
Publ
ic C
osts
383,
140
72,5
484,
307
23,9
594,
809
838,
250
–
44,4
2915
9,50
211
0,39
61,
641,
340
1,74
6,44
2
Tota
l Pro
gram
Cos
ts49
2,24
697
,916
4,37
928
,328
6,56
891
0,64
4
–51
,862
167,
073
116,
965
1,87
5,98
11,
989,
992
Intr
agov
ernm
enta
l Ear
ned
Reve
nue
(8,8
91)
(1,9
76)
(6)
(360
)(1
44)
(608
,952
)
–(6
10)
(540
)(5
21)
(622
,000
)(1
4,16
8)
Publ
ic E
arne
d Re
venu
e(3
55)
(79)
–
(15)
(6)
(2,6
99)
–
(24)
(22)
(27)
(3,2
27)
(32,
691)
Tota
l Ear
ned
Reve
nue
(9,2
46)
(2,0
55)
(6)
(375
)(1
50)
(611
,651
)
–(6
34)
(562
)(5
48)
(625
,227
)(4
6,85
9)
Net
Pro
gram
Cos
ts48
3,00
095
,861
4,37
327
,953
6,41
829
8,99
3
–51
,228
166,
511
116,
417
1,25
0,75
41,
943,
133
PO
–Pro
gram
Dev
elop
men
t an
d O
vers
ight
In
trag
over
nmen
tal C
osts
36,8
5512
,429
38,5
2190
,366
6,10
2
–8,
405
13,0
028,
762
45,6
8326
0,12
521
2,31
5
Publ
ic C
osts
157,
875
58,6
8513
5,70
219
8,91
125
,322
–
27,0
6579
,953
53,2
5982
,011
818,
783
847,
413
Tota
l Pro
gram
Cos
ts19
4,73
071
,114
174,
223
289,
277
31,4
24
–35
,470
92,9
5562
,021
127,
694
1,07
8,90
81,
059,
728
Intr
agov
ernm
enta
l Ear
ned
Reve
nue
(858
)(4
92)
(323
)(4
,825
)(1
62)
–
(103
)(4
76)
(194
)(3
56)
(7,7
89)
(6,8
94)
Publ
ic E
arne
d Re
venu
e(3
4)(2
0)(1
3)(1
92)
(6)
–
(4)
(19)
(8)
(14)
(310
)(1
,614
)
Tota
l Ear
ned
Reve
nue
(892
)(5
12)
(336
)(5
,017
)(1
68)
–
(107
)(4
95)
(202
)(3
70)
(8,0
99)
(8,5
08)
Net
Pro
gram
Cos
ts19
3,83
870
,602
173,
887
284,
260
31,2
56
–35
,363
92,4
6061
,819
127,
324
1,07
0,80
91,
051,
220
PS–
Peac
e an
d Se
curi
ty
Intr
agov
ernm
enta
l Cos
ts3,
012
1,41
33,
518
–
4,70
3
–7,
698
4,26
64,
655
29,2
6529
,682
Publ
ic C
osts
72,0
4123
,431
161,
226
–
83,9
23
–10
2,96
655
,414
64,3
0556
3,30
657
8,79
2
Tota
l Pro
gram
Cos
ts75
,053
24,8
4416
4,74
4
–88
,626
–
–
110,
664
59,6
8068
,960
592,
571
608,
474
Intr
agov
ernm
enta
l Ear
ned
Reve
nue
(229
)(1
16)
(289
)
–(3
90)
–
(554
)(1
35)
(286
)(1
,999
)(1
,862
)
Publ
ic E
arne
d Re
venu
e(9
)(5
)(1
2)
–(1
6)
–(2
2)(5
)(1
1)(8
0)(8
67)
Tota
l Ear
ned
Reve
nue
(238
)(1
21)
(301
)
–(4
06)
–
–
(576
)(1
40)
(297
)(2
,079
)(2
,729
)
Net
Pro
gram
Cos
ts74
,815
24,7
2316
4,44
3
–88
,220
–
–
110,
088
59,5
4068
,663
590,
492
605,
745
Net
Cos
t of O
pera
tions
$ 2,1
02,4
49$
795,
048
$ 4,
133,
328
$ 1,0
01,8
88$
439,
577
$ 30
0,03
3$
252,
966
$ 99
9,18
2$
1,61
5,80
5$ 1
,379
,542
$ 13,
019,
818
$ 13,
058,
496

115USAID FY 2018 AGENCY FINANCIAL REPORT | FINANCIAL SECTION
NOTE 16. SCHEDULE OF COST BY STANDARDIZED PROGRAM STRUCTURE AND DEFINITION (SPSD)
The Schedule of Costs by Responsibility Segment categorizes costs and revenues by Program Categories, Program Areas, which is consistent with the new State-USAID SPSD, and Responsibility Segment.
A responsibility segment is the component that carries out a mission or major line of activity, and whose managers report directly to top manage-ment. The geographic and technical bureaus of USAID (on the pages following) meet the criteria for responsibility segments. These bureaus directly support the Agency goals while the remaining bureaus and offices support the operations of these bureaus. To report the full cost of program outputs, the cost of support bureaus and offices are allocated to the outputs of the geographic and technical bureaus. Intra-agency eliminations are allocated to Program Areas to reflect total costs.
In the FY 2018 Consolidated Statement of Net Cost, major responsibility segments are (i) the Geographic Bureaus and (ii) the Technical Bureaus. The six Geographic Bureaus are: Africa; Asia; Europe and Eurasia; Latin America and the Caribbean; the Middle East; and the Office of Afghanistan and Pakistan Affairs (OAPA). The four Technical Bureaus are: Democracy, Conflict and Humanitarian Assistance (DCHA); Economic Growth, Education and the Environment (E3); Global Health; and Innovation and Development Alliances (IDEA) & U.S. Global Development Lab (LAB). Note that receiving organizations IDEA and LAB have been merged as IDEA & LAB for Statement of Net Cost reporting purposes.
Schedule of Costs by SPSD for the years ended September 30, 2018 and 2017 are indicated in the table on the following pages (in thousands):

116 USAID FY 2018 AGENCY FINANCIAL REPORT | FINANCIAL SECTION
Cat
egor
ies
Afr
ica
Asi
a D
CH
AE3
Euro
pe
&
Eura
sia
Glo
bal
Hea
lth
IDEA
&
LA
B
Latin
A
mer
ica
&C
arib
bean
Mid
dle
Ea
stO
AP
A
2018
C
onso
lidat
edTo
tal
2017
C
onso
lidat
edTo
tal
DR
–Dem
ocra
cy, H
uman
Rig
hts
and
Gov
erna
nce
D
R.1–
Rule
of L
aw (R
OL)
Gro
ss C
osts
$ 18
,653
$ 26
,497
$ 2,
666
$ 7,
317
$ 25
,685
$ –
$ 26
5$
87,9
76$
21,9
36$
9,90
5$
200,
900
$ 20
8,26
8
Le
ss:
Earn
ed R
even
ue
(59)
(1
41)
(2
8)
–
(142
)
–
(1)
(4
31)
(7
3)
(38)
(9
13)
(9
84)
Net
Pro
gram
Cos
ts18
,594
26,3
562,
638
7,31
725
,543
–
264
87,5
4521
,863
9,86
719
9,98
720
7,28
4D
R.2–
Goo
d G
over
nanc
e
G
ross
Cos
ts74
,664
40,6
049,
692
51,2
4166
,989
–
–
194,
499
90,5
0853
0,50
81,
058,
705
693,
134
Less
: Ea
rned
Rev
enue
(2
18)
(1
99)
(9
)
(1,2
52)
(3
65)
–
–
(9
25)
(2
87)
(1
,100
)
(4,3
55)
(7
,042
)
N
et P
rogr
am C
osts
74,4
4640
,405
9,68
349
,989
66,6
24
–
–19
3,57
490
,221
529,
408
1,05
4,35
068
6,09
2D
R.3–
Polit
ical
Com
petit
ion
and
Con
sens
us-B
uild
ing
Gro
ss C
osts
56,5
8311
,410
4,19
449
18,6
84
–
–8,
281
13,9
6323
,150
136,
314
145,
751
Less
: Ea
rned
Rev
enue
(1
93)
(5
4)
(51)
–
(1
07)
–
–
(3
4)
(163
)
(82)
(6
84)
(7
13)
Net
Pro
gram
Cos
ts56
,390
11,3
564,
143
4918
,577
–
–
8,24
713
,800
23,0
6813
5,63
014
5,03
8D
R.4–
Civ
il So
ciet
y
G
ross
Cos
ts49
,173
30,3
474,
034
6,87
653
,321
–
–
35,0
1739
,426
23,6
8324
1,87
724
9,98
2
Le
ss:
Earn
ed R
even
ue
(160
)
(156
)
(36)
–
(2
77)
–
–
(1
69)
(2
08)
(1
14)
(1
,120
)
(996
)
N
et P
rogr
am C
osts
49,0
1330
,191
3,99
86,
876
53,0
44
–
–34
,848
39,2
1823
,569
240,
757
248,
986
DR.
5–In
depe
nden
t Med
ia a
nd F
ree
Flow
of
Info
rmat
ion
Gro
ss C
osts
131
1,71
5
–
–8,
811
–
–
1,90
4
–
–12
,561
326
Less
: Ea
rned
Rev
enue
–
(4
)
–
–
(32)
–
–
(6
)
–
–
(42)
(1
)
N
et P
rogr
am C
osts
131
1,71
1
–
–8,
779
–
–
1,89
8
–
–12
,519
325
DR.
6–H
uman
Rig
hts
Gro
ss C
osts
5,86
45,
178
1,09
22,
035
5,99
3
–74
24,4
963,
651
2,75
451
,137
57,9
18
Le
ss:
Earn
ed R
even
ue
(17)
(3
0)
(9)
–
(3
5)
–
–
(119
)
(14)
(1
0)
(234
)
(274
)
N
et P
rogr
am C
osts
5,84
75,
148
1,08
32,
035
5,95
8
–74
24,3
773,
637
2,74
450
,903
57,6
44To
tal D
emoc
racy
, Hum
an R
ight
s an
d G
over
nanc
e20
4,42
111
5,16
721
,545
66,2
6617
8,52
5
–33
835
0,48
916
8,73
958
8,65
61,
694,
146
1,34
5,36
9
EG–E
cono
mic
Gro
wth
EG.1
–Mac
roec
onom
ic F
ound
atio
n fo
r G
row
th
G
ross
Cos
ts2,
452
3,36
6
–14
9,42
41,
302
–
–
8,71
460
9,81
33,
548
778,
619
1,15
0,67
1
Le
ss:
Earn
ed R
even
ue
–
(4)
–
(5
5,55
1)
–
–
–
(31)
(3
,069
)
(23)
(5
8,67
8)
(87,
219)
Net
Pro
gram
Cos
ts2,
452
3,36
2
–93
,873
1,30
2
–
–8,
683
606,
744
3,52
571
9,94
11,
063,
452
EG.2
–Tra
de a
nd In
vest
men
t
G
ross
Cos
ts39
,620
13,3
20
–24
,087
6,64
0
–
–10
,922
2,03
413
,510
110,
133
170,
725
Less
: Ea
rned
Rev
enue
(1
24)
(6
8)
–
(466
)
(31)
–
–
(5
4)
(6)
(6
1)
(810
)
(1,1
51)
Net
Pro
gram
Cos
ts39
,496
13,2
52
–23
,621
6,60
9
–
–10
,868
2,02
813
,449
109,
323
169,
574
EG.3
–Agr
icul
ture
Gro
ss C
osts
402,
217
103,
866
–
260,
121
1,27
4
–
–60
,230
9,76
387
,661
925,
132
1,10
6,52
2
Le
ss:
Earn
ed R
even
ue
(1,2
99)
(5
11)
–
(2
57)
(8
)
–
–
(313
)
(32)
(3
31)
(2
,751
)
(13,
994)
Net
Pro
gram
Cos
ts40
0,91
810
3,35
5
–25
9,86
41,
266
–
–
59,9
179,
731
87,3
3092
2,38
11,
092,
528
EG.4
–Fin
anci
al S
ecto
r
G
ross
Cos
ts73
23,
967
–
96,7
709,
383
–
–
1,62
010
7,85
89,
567
229,
897
144,
487
Less
: Ea
rned
Rev
enue
(1
)
(23)
–
(8
0,00
3)
(51)
–
–
(1
0)
(315
)
(22)
(8
0,42
5)
(82,
652)
Net
Pro
gram
Cos
ts73
13,
944
–
16,7
679,
332
–
–
1,61
010
7,54
39,
545
149,
472
61,8
35
(con
tinue
d on
nex
t pag
e)

117USAID FY 2018 AGENCY FINANCIAL REPORT | FINANCIAL SECTION
NOT UPDATED
(con
tinue
d)
Cat
egor
ies
Afr
ica
Asi
a D
CH
AE3
Euro
pe
&
Eura
sia
Glo
bal
Hea
lth
IDEA
&
LA
B
Latin
A
mer
ica
&C
arib
bean
Mid
dle
Ea
stO
AP
A
2018
C
onso
lidat
edTo
tal
2017
C
onso
lidat
edTo
tal
EG.5
–Priv
ate
Sect
or P
rodu
ctiv
ity
G
ross
Cos
ts20
,397
40,1
9917
68,
171
69,1
04
–20
9,95
439
,323
104,
209
33,3
0052
4,83
357
6,94
6
Le
ss:
Earn
ed R
even
ue
(56)
(2
11)
–
(5
)
(382
)
–
(3,7
99)
(1
64)
(3
33)
(1
40)
(5
,090
)
(355
,419
)
N
et P
rogr
am C
osts
20,3
4139
,988
176
8,16
668
,722
–
206,
155
39,1
5910
3,87
633
,160
519,
743
221,
527
EG.6
–Wor
kfor
ce D
evel
opm
ent
Gro
ss C
osts
3,32
59,
069
–
369
13,4
91
–2,
554
8,91
817
,369
7,60
362
,698
76,3
30
Le
ss:
Earn
ed R
even
ue
(8)
(4
6)
–
(5)
(7
7)
–
(6)
(3
7)
(56)
(3
1)
(266
)
(104
,842
)
N
et P
rogr
am C
osts
3,31
79,
023
–
364
13,4
14
–2,
548
8,88
117
,313
7,57
262
,432
(2
8,51
2)EG
.7–M
oder
n En
ergy
Ser
vice
s
G
ross
Cos
ts80
,667
12,1
31
–2,
498
13,4
83
–28
27,
036
14,1
4798
,216
228,
460
281,
370
Less
: Ea
rned
Rev
enue
(2
47)
(4
2)
–
(54)
(6
8)
–
–
(38)
(4
6)
(385
)
(880
)
(11,
149)
Net
Pro
gram
Cos
ts80
,420
12,0
89
–2,
444
13,4
15
–28
26,
998
14,1
0197
,831
227,
580
270,
221
EG.8
–Inf
orm
atio
n an
d C
omm
unic
atio
ns Te
chno
logy
Ser
vice
s
Gro
ss C
osts
1,41
684
–
4121
0
–5
129
261
1,81
53,
961
5,19
9
Le
ss:
Earn
ed R
even
ue
(4)
–
–
(1
)
(1)
–
–
(1
)
(1)
(7
)
(15)
(2
06)
Net
Pro
gram
Cos
ts1,
412
84
–40
209
–
512
826
01,
808
3,94
64,
993
EG.9
–Tra
nspo
rt S
ervi
ces
Gro
ss C
osts
39,9
012,
377
–
1,21
65,
918
–
147
3,64
97,
368
51,1
5211
1,72
814
6,54
3
Le
ss:
Earn
ed R
even
ue
(126
)
(13)
–
(2
8)
(32)
–
–
(2
0)
(24)
(2
00)
(4
43)
(5
,807
)
N
et P
rogr
am C
osts
39,7
752,
364
–
1,18
85,
886
–
147
3,62
97,
344
50,9
5211
1,28
514
0,73
6EG
.10–
Envi
ronm
ent
Gro
ss C
osts
171,
312
176,
425
745
126,
264
7,84
0
–
–11
0,14
64,
160
1,48
159
8,37
381
2,33
2
Le
ss:
Earn
ed R
even
ue
(525
)
(1,0
17)
(3
)
(2,1
38)
(4
6)
–
–
(533
)
(12)
(6
)
(4,2
80)
(2
6,91
3)
N
et P
rogr
am C
osts
170,
787
175,
408
742
124,
126
7,79
4
–
–10
9,61
34,
148
1,47
559
4,09
378
5,41
9EG
.11-
Clim
ate
Cha
nge
- Ada
ptat
ion
Gro
ss C
osts
–
–
–
492
–
–
–
430
–
–
922
–
Less
: Ea
rned
Rev
enue
–
–
–
–
–
–
(1
)
–
–
(1)
–
Net
Pro
gram
Cos
ts
–
–
–49
2
–
–
–42
9
–
–92
1
–EG
.12-
Clim
ate
Cha
nge
- Cle
an E
nerg
y
G
ross
Cos
ts
–
–
–12
7
–
–
–59
0
–
–71
7
–
Le
ss:
Earn
ed R
even
ue
–
–
–
–
–
–
(2)
–
–
(2
)
–
N
et P
rogr
am C
osts
–
–
–
127
–
–
–
588
–
–
715
–
EG.1
3-C
limat
e C
hang
e - S
usta
inab
le L
ands
cape
s
G
ross
Cos
ts2,
122
4,56
2
–4,
525
–
–
–
1,37
6
–
–12
,585
–
Less
: Ea
rned
Rev
enue
(3
)
(12)
–
–
–
–
(3
)
–
–
(18)
–
Net
Pro
gram
Cos
ts2,
119
4,55
0
–4,
525
–
–
–
1,37
3
–
–12
,567
–
Tota
l Eco
nom
ic G
row
th76
1,76
836
7,41
991
853
5,59
712
7,94
9
–20
9,13
725
1,87
687
3,08
830
6,64
73,
434,
399
3,78
1,77
3
ES–E
duca
tion
and
Soc
ial S
ervi
ces
ES.1
–Bas
ic E
duca
tion
Gro
ss C
osts
381,
286
95,0
168,
769
91,3
754,
922
–
5,41
977
,752
198,
729
162,
356
1,02
5,62
41,
082,
805
Less
: Ea
rned
Rev
enue
(1
,246
)
(500
)
(14)
(3
,677
)
(38)
–
(2
5)
(366
)
(687
)
(615
)
(7,1
68)
(3
,550
)
N
et P
rogr
am C
osts
380,
040
94,5
168,
755
87,6
984,
884
–
5,39
477
,386
198,
042
161,
741
1,01
8,45
61,
079,
255
(con
tinue
d on
nex
t pag
e)

118 USAID FY 2018 AGENCY FINANCIAL REPORT | FINANCIAL SECTION
(con
tinue
d)
Cat
egor
ies
Afr
ica
Asi
a D
CH
AE3
Euro
pe
&
Eura
sia
Glo
bal
Hea
lth
IDEA
&
LA
B
Latin
A
mer
ica
&C
arib
bean
Mid
dle
Ea
stO
AP
A
2018
C
onso
lidat
edTo
tal
2017
C
onso
lidat
edTo
tal
ES.2
–Hig
her
Educ
atio
n
G
ross
Cos
ts3,
398
2,49
2
–11
440
92,
740
124
135
–
9,41
244
Less
: Ea
rned
Rev
enue
(4
)
(5)
–
–
(1
)
(6)
–
(1
)
–
(17)
–
Net
Pro
gram
Cos
ts3,
394
2,48
7
–11
440
8
–2,
734
124
134
–
9,39
544
ES.3
–Soc
ial P
olic
ies,
Regu
latio
ns, a
nd S
yste
ms
Gro
ss C
osts
112
1,15
32,
696
–
149
12
–4,
633
4,05
872
613
,539
24,0
22
Le
ss:
Earn
ed R
even
ue
–
(7)
(8
)
–
(1)
–
–
(2
2)
(14)
(3
)
(55)
(3
73)
Net
Pro
gram
Cos
ts11
21,
146
2,68
8
–14
812
–
4,61
14,
044
723
13,4
8423
,649
ES.4
–Soc
ial S
ervi
ces
Gro
ss C
osts
372
5,11
114
,812
–
619
43
–16
,728
14,3
392,
422
54,4
4680
,119
Less
: Ea
rned
Rev
enue
–
(2
5)
(37)
–
(4
)
(1)
–
(7
5)
(47)
(1
1)
(200
)
(1,2
47)
Net
Pro
gram
Cos
ts37
25,
086
14,7
75
–61
542
–
16,6
5314
,292
2,41
154
,246
78,8
72ES
.5–S
ocia
l Ass
istan
ce
G
ross
Cos
ts68
97,
118
16,6
49
–92
075
–
28,6
1025
,063
4,48
583
,609
148,
358
Less
: Ea
rned
Rev
enue
–
(4
3)
(51)
–
(6
)
(2)
–
(1
34)
(8
4)
(20)
(3
40)
(2
,304
)
N
et P
rogr
am C
osts
689
7,07
516
,598
–
914
73
–28
,476
24,9
794,
465
83,2
6914
6,05
4To
tal E
duca
tion
and
Soc
ial S
ervi
ce38
4,60
711
0,31
042
,816
87,8
126,
969
127
8,12
812
7,25
024
1,49
116
9,34
01,
178,
850
1,32
7,87
4
HA
–Hum
anit
aria
n A
ssis
tanc
eH
A.1
–Pro
tect
ion,
Ass
istan
ce a
nd S
olut
ions
Gro
ss C
osts
–
8,81
33,
713,
393
–
242
913
–
15,5
3144
,760
1,28
03,
784,
932
3,00
1,76
8
Le
ss:
Earn
ed R
even
ue
–
(58)
(7
,259
)
–
(2)
–
–
(6
5)
(143
)
(10)
(7
,537
)
(19,
497)
Net
Pro
gram
Cos
ts
–8,
755
3,70
6,13
4
–24
091
3
–15
,466
44,6
171,
270
3,77
7,39
52,
982,
271
HA
.2–D
isast
er R
eadi
ness
Gro
ss C
osts
–
2,22
119
,509
–
–
–
–
218
–
1,23
423
,182
21,5
75
Le
ss:
Earn
ed R
even
ue
–
(10)
(2
97)
–
–
–
–
(1
)
–
(9)
(3
17)
(4
64)
Net
Pro
gram
Cos
ts
–2,
211
19,2
12
–
–
–
–21
7
–1,
225
22,8
6521
,111
HA
.3–M
igra
tion
Man
agem
ent
Gro
ss C
osts
–
–
–
–
–
–
–
108
–
–
108
–
Less
: Ea
rned
Rev
enue
–
–
–
–
–
–
–
–
–
–
–
–
Net
Pro
gram
Cos
ts
–
–
–
–
–
–
–10
8
–
–10
8
–To
tal H
uman
itar
ian
Ass
ista
nce
–
10,9
663,
725,
346
–
240
913
–
15,7
9144
,617
2,49
53,
800,
368
3,00
3,38
2
HL–
Hea
lth
HL.
1–H
IV/A
IDS
Gro
ss C
osts
250,
463
45,1
552,
146
12,2
964,
461
800,
174
–
26,3
4378
,897
57,6
941,
277,
629
1,14
1,56
2
Le
ss:
Earn
ed R
even
ue
(4,9
62)
(9
37)
(4
)
(185
)
(108
) (
610,
839)
–
(3
34)
(2
68)
(2
72)
(6
17,9
09)
(2
3,16
2)
N
et P
rogr
am C
osts
245,
501
44,2
182,
142
12,1
114,
353
189,
335
–
26,0
0978
,629
57,4
2265
9,72
01,
118,
400
HL.
2–Tu
berc
ulos
is
G
ross
Cos
ts3,
216
3,55
016
9327
896
9
–17
959
443
59,
330
6,22
0
Le
ss:
Earn
ed R
even
ue
(72)
(9
1)
–
(1)
(7
)
(10)
–
(2
)
(2)
(2
)
(187
)
(174
)
N
et P
rogr
am C
osts
3,14
43,
459
1692
271
959
–
177
592
433
9,14
36,
046
(con
tinue
d on
nex
t pag
e)

119USAID FY 2018 AGENCY FINANCIAL REPORT | FINANCIAL SECTION
(con
tinue
d)
Cat
egor
ies
Afr
ica
Asi
a D
CH
AE3
Euro
pe
&
Eura
sia
Glo
bal
Hea
lth
IDEA
&
LA
B
Latin
A
mer
ica
&C
arib
bean
Mid
dle
Ea
stO
AP
A
2018
C
onso
lidat
edTo
tal
2017
C
onso
lidat
edTo
tal
HL.
3–M
alar
ia
G
ross
Cos
ts32
,813
2,09
077
444
653,
535
–
1,01
42,
848
2,08
344
,969
29,8
11
Le
ss:
Earn
ed R
even
ue
(801
)
(46)
–
(7
)
(1)
(2
0)
–
(14)
(1
0)
(10)
(9
09)
(8
33)
Net
Pro
gram
Cos
ts32
,012
2,04
477
437
643,
515
–
1,00
02,
838
2,07
344
,060
28,9
78H
L.4–
Pand
emic
Influ
enza
and
Oth
er E
mer
ging
Thr
eats
(PIO
ET)
Gro
ss C
osts
9,47
02,
213
113
645
946,
016
–
1,24
94,
142
3,02
926
,971
43,3
77
Le
ss:
Earn
ed R
even
ue
(164
)
(45)
–
(1
0)
(2)
(5
1)
–
(14)
(1
4)
(14)
(3
14)
(1
,212
)
N
et P
rogr
am C
osts
9,30
62,
168
113
635
925,
965
–
1,23
54,
128
3,01
526
,657
42,1
65H
L.5–
Oth
er P
ublic
Hea
lth T
hrea
ts
G
ross
Cos
ts13
,981
3,63
119
495
313
97,
934
–
1,84
46,
839
4,47
139
,986
64,0
37
Le
ss:
Earn
ed R
even
ue
(242
)
(67)
–
(1
4)
(3)
(5
1)
–
(21)
(2
2)
(21)
(4
41)
(1
,788
)
N
et P
rogr
am C
osts
13,7
393,
564
194
939
136
7,88
3
–1,
823
6,81
74,
450
39,5
4562
,249
HL.
6–M
ater
nal a
nd C
hild
Hea
lth
G
ross
Cos
ts55
,267
14,0
1558
93,
375
493
38,9
14
–6,
704
22,5
7815
,837
157,
772
226,
673
Less
: Ea
rned
Rev
enue
(1
,009
)
(299
)
(1)
(5
1)
(10)
(4
63)
–
(7
8)
(76)
(7
4)
(2,0
61)
(6
,330
)
N
et P
rogr
am C
osts
54,2
5813
,716
588
3,32
448
338
,451
–
6,62
622
,502
15,7
6315
5,71
122
0,34
3H
L.7–
Fam
ily P
lann
ing
and
Repr
oduc
tive
Hea
lth
G
ross
Cos
ts26
,814
6,97
926
41,
511
221
12,3
41
–3,
305
10,6
297,
089
69,1
5310
1,46
9
Le
ss:
Earn
ed R
even
ue
(506
)
(152
)
–
(23)
(4
)
(74)
–
(4
3)
(35)
(3
3)
(870
)
(2,8
35)
Net
Pro
gram
Cos
ts26
,308
6,82
726
41,
488
217
12,2
67
–3,
262
10,5
947,
056
68,2
8398
,634
HL.
8–W
ater
Sup
ply
and
Sani
tatio
n
G
ross
Cos
ts95
,553
18,5
7094
48,
805
789
39,2
04
–10
,680
39,2
2225
,362
239,
129
363,
006
Less
: Ea
rned
Rev
enue
(1
,394
)
(377
)
(1)
(8
1)
(16)
(1
36)
–
(1
19)
(1
28)
(1
19)
(2
,371
)
(10,
139)
Net
Pro
gram
Cos
ts94
,159
18,1
9394
38,
724
773
39,0
68
–10
,561
39,0
9425
,243
236,
758
352,
867
HL.
9–N
utrit
ion
Gro
ss C
osts
4,66
81,
713
3620
630
1,55
7
–54
31,
322
967
11,0
4213
,837
Less
: Ea
rned
Rev
enue
(9
5)
(41)
–
(3
)
(1)
(7
)
–
(8)
(5
)
(5)
(1
65)
(3
86)
Net
Pro
gram
Cos
ts4,
573
1,67
236
203
291,
550
–
535
1,31
796
210
,877
13,4
51To
tal H
ealt
h48
3,00
095
,861
4,37
327
,953
6,41
829
8,99
3
–51
,228
166,
511
116,
417
1,25
0,75
41,
943,
133
PO
–Pro
gram
Dev
elop
men
t an
d O
vers
ight
PO.1
–Pro
gram
Des
ign
and
Lear
ning
Gro
ss C
osts
83,9
0814
,322
22,7
5323
0,57
36,
409
–
6,77
432
,911
24,4
2034
,324
456,
394
390,
225
Less
: Ea
rned
Rev
enue
(3
31)
(1
22)
(4
9)
(4,9
43)
(3
4)
–
(20)
(1
75)
(8
0)
(129
)
(5,8
83)
(3
,906
)
N
et P
rogr
am C
osts
83,5
7714
,200
22,7
0422
5,63
06,
375
–
6,75
432
,736
24,3
4034
,195
450,
511
386,
319
PO.2
–Adm
inist
ratio
n an
d O
vers
ight
Gro
ss C
osts
110,
061
55,8
9215
0,88
558
,429
24,1
57
–28
,609
59,3
2936
,805
93,3
7061
7,53
766
8,83
5
Le
ss:
Earn
ed R
even
ue
(560
)
(387
)
(286
)
(74)
(1
31)
–
(8
8)
(318
)
(119
)
(241
)
(2,2
04)
(4
,600
)
N
et P
rogr
am C
osts
109,
501
55,5
0515
0,59
958
,355
24,0
26
–28
,521
59,0
1136
,686
93,1
2961
5,33
366
4,23
5PO
.3–E
valu
atio
n
G
ross
Cos
ts76
190
058
527
585
8
–88
715
795
–
4,97
766
8
Le
ss:
Earn
ed R
even
ue
(1)
(3
)
(1)
–
(3
)
–
–
(2)
(2
)
–
(12)
(2
)
N
et P
rogr
am C
osts
760
897
584
275
855
–
8871
379
3
–4,
965
666
Tota
l Pro
gram
Dev
elop
men
t an
d O
vers
ight
193,
838
70,6
0217
3,88
728
4,26
031
,256
–
35,3
6392
,460
61,8
1912
7,32
41,
070,
809
1,05
1,22
0
(con
tinue
d on
nex
t pag
e)

120 USAID FY 2018 AGENCY FINANCIAL REPORT | FINANCIAL SECTION
(con
tinue
d)
Cat
egor
ies
Afr
ica
Asi
a D
CH
AE3
Euro
pe
&
Eura
sia
Glo
bal
Hea
lth
IDEA
&
LA
B
Latin
A
mer
ica
&C
arib
bean
Mid
dle
Ea
stO
AP
A
2018
C
onso
lidat
edTo
tal
2017
C
onso
lidat
edTo
tal
PS–
Peac
e an
d Se
curi
tyPS
.1–C
ount
erte
rror
ism
G
ross
Cos
ts23
,083
5,57
120
,974
–
122
–
–
–
3,64
7
–53
,397
41,2
80
Le
ss:
Earn
ed R
even
ue
(79)
(1
7)
(34)
–
–
–
–
–
(1
1)
–
(141
)
(126
)
N
et P
rogr
am C
osts
23,0
045,
554
20,9
40
–12
2
–
–
–3,
636
–
53,2
5641
,154
PS.2
–Com
batin
g Wea
pons
of M
ass
Des
truc
tion
(WM
D)
Gro
ss C
osts
–
–
–
–
75,4
71
–
–
–
–
–75
,471
23,1
36
Le
ss:
Earn
ed R
even
ue
–
–
–
–
(336
)
–
–
–
–
–
(336
)
(101
)
N
et P
rogr
am C
osts
–
–
–
–
75,1
35
–
–
–
–
–75
,135
23,0
35PS
.3–C
ount
erna
rcot
ics
Gro
ss C
osts
–
–
–
–
–
–
–
87,0
51
–16
,299
103,
350
137,
643
Less
: Ea
rned
Rev
enue
–
–
–
–
–
–
–
(4
55)
–
(6
4)
(519
)
(611
)
N
et P
rogr
am C
osts
–
–
–
–
–
–
–
86,5
96
–16
,235
102,
831
137,
032
PS.4
-Tra
nsna
tiona
l Thr
eats
and
Crim
e
G
ross
Cos
ts
–
–
–
–1,
011
–
–
–
–
–
1,01
1
–
Le
ss:
Earn
ed R
even
ue
–
–
–
–
(2)
–
–
–
–
–
(2
)
–
N
et P
rogr
am C
osts
–
–
–
–
1,00
9
–
–
–
–
–1,
009
–
PS.5
–Tra
ffick
ing
in P
erso
ns
G
ross
Cos
ts29
317
,095
658
–
2,06
8
–
–2,
967
–
3,50
926
,590
16,8
17
Le
ss:
Earn
ed R
even
ue
(1)
(1
00)
(1
)
–
(12)
–
–
(1
2)
–
(17)
(1
43)
(6
4)
N
et P
rogr
am C
osts
292
16,9
9565
7
–2,
056
–
–
2,95
5
–3,
492
26,4
4716
,753
PS.6
–Con
flict
Miti
gatio
n an
d St
abili
zatio
n
G
ross
Cos
ts51
,678
2,17
814
3,11
2
–9,
393
–
–
20,1
4856
,033
49,1
5333
1,69
538
4,34
6
Le
ss:
Earn
ed R
even
ue
(159
)
(4)
(2
66)
–
(5
2)
–
–
(108
)
(129
)
(217
)
(935
)
(1,8
03)
Net
Pro
gram
Cos
ts51
,519
2,17
414
2,84
6
–9,
341
–
–
20,0
4055
,904
48,9
3633
0,76
038
2,54
3PS
.7–C
onve
ntio
nal W
eapo
ns S
ecur
ity a
nd E
xplo
sive
Rem
nant
s of
War
(ERW
)
G
ross
Cos
ts
–
–
–
–14
6
–
–52
–
–
198
1,37
4
Le
ss:
Earn
ed R
even
ue
–
–
–
–
(1)
–
–
–
–
–
(1
)
(6)
Net
Pro
gram
Cos
ts
–
–
–
–14
5
–
–52
–
–
197
1,36
8PS
.8–S
tren
gthe
ning
Mili
tary
Par
tner
ship
s an
d C
apab
ilitie
s
G
ross
Cos
ts
–
–
–
–92
–
–
32
–
–12
486
1
Le
ss:
Earn
ed R
even
ue
–
–
–
–
–
–
–
–
–
–
–
(4)
Net
Pro
gram
Cos
ts
–
–
–
–92
–
–
32
–
–12
485
7PS
.9–C
itize
n Se
curit
y an
d La
w E
nfor
cem
ent
Gro
ss C
osts
–
–
–
–
321
–
–
414
–
–
735
3,01
7
Le
ss:
Earn
ed R
even
ue
–
–
–
–
(1)
–
–
(1
)
–
–
(2)
(1
4)
N
et P
rogr
am C
osts
–
–
–
–
320
–
–
413
–
–
733
3,00
3To
tal P
eace
and
Sec
urit
y74
,815
24,7
2316
4,44
3
–88
,220
–
–
110,
088
59,5
4068
,663
590,
492
605,
745
Net
Cos
t of
Ope
rati
ons
$ 2,1
02,4
49$
795,
048
$ 4,1
33,3
28$ 1
,001
,888
$ 43
9,57
7$ 3
00,0
33$ 2
52,9
66$
999,
182
$ 1,
615,
805
$ 1,3
79,5
42$
13,0
19,8
18$
13,0
58,4
96

121USAID FY 2018 AGENCY FINANCIAL REPORT | FINANCIAL SECTION
NOTE 17. COMBINED STATEMENT OF BUDGETARY RESOURCES
The Combined Statement of Budgetary Resources presents information about total budgetary resources available to USAID and the status of those resources, as of September 30, 2018 and 2017. USAID’s total budgetary resources were $30.7 billion and $29.5 billion as of September 30, 2018 and 2017, respectively.
The following schedule details the amount of the direct and reimbursable new obligations and upward adjustments against the apportionment categories.
A. APPORTIONMENT CATEGORIES OF OBLIGATIONS INCURRED (in thousands):
2018 2017
Category A, Direct $ 1,538,392 $ 1,507,128
Category B, Direct 13,490,282 12,885,091
Category A, Reimbursable 52,107 51,703
Category B, Reimbursable 703,270 551,068
Total $ 15,784,051 $ 14,994,990
B. BORROWING AUTHORITY, END OF PERIOD AND TERMS OF BORROWING AUTHORITY USED:
The Agency had $40 thousand and $0 in borrowing authority in FY 2018 and FY 2017, respectively. Borrowing authority is indefinite and authorized under the Federal Credit Reform Act of 1990 (Title XIII, Subtitle B, Pub. L. No. 101- 508), and is used to finance obligations during the current year, as needed.
C. PERMANENT INDEFINITE APPROPRIATIONS:
USAID has permanent indefinite appropria-tions relating to specific Federal Credit Reform Program and Liquidating appropriations. USAID is authorized permanent indefinite authority for Federal Credit Reform Program appropriations for subsidy reestimates and Federal Credit Reform Act of 1990. At year-end FY 2018, there is $3.6 billion in availability related to Federal Credit Reform Program and Liquidating appropriations.
D. LEGAL ARRANGEMENTS AFFECTING THE USE OF UNOBLIGATED BALANCES:
The “Consolidated Appropriations Act” signed into law as Pub. L. No. 112-74 provides to USAID extended authority to obligate funds. USAID’s appropriations have consistently provided essentially similar authority, known as “7011” authority. Under this authority funds shall remain available for obligation for an extended period if such funds are obligated within their initial period of availability. Any subsequent recoveries (deobligations) of these funds become unobligated balances that are available for reprogramming by USAID (subject to OMB approval through the apportionment process).

122 USAID FY 2018 AGENCY FINANCIAL REPORT | FINANCIAL SECTION
E. UNDELIVERED ORDERS AT THE END OF THE YEAR:
Budgetary Resources obligated for Undelivered Orders as of September 30, 2018 and 2017, were $19 billion and $18.5 billion, respectively.
2018 2017
Federal
Obligations Paid $ 27,700 $ 92,996
Obligations Unpaid 824,059 789,833
Total Federal 851,759 882,829
Non-Federal
Obligations Paid 800,663 567,709
Obligations Unpaid 17,362,979 17,061,256
Total Non-Federal 18,163,642 17,628,965
Total Undelivered Orders at End of Year $ 19,015,401 $ 18,511,794
F. DIFFERENCE BETWEEN THE COMBINED STATEMENT OF BUDGETARY RESOURCES AND THE BUDGET OF THE U.S. GOVERNMENT (in thousands):
The reconciliation between the Statement of Budgetary Resources (SBR) and the Budget of the U.S. Government (Budget) is presented below. This reconciliation is as of September 30, 2017 because submission of the Budget for FY 2019, which presents the execution of the FY 2018 Budget, occurs after publication of these financial statements. The USAID Budget Appendix can be found on the OMB website (http://www.whitehouse.gov/omb/budget) and will be available in early February 2019.
Differences between the SBR and Budget of the U.S. Government are caused mainly by the fact that certain funds are reported in the SBR
but not included in the USAID section of the “Department of State and Other International Programs” Appendix of the Budget of the U.S. Government. This is largely reflected in the Economic Support Fund, which is approximately $9.7 billion. This fact is corroborated by the State Department Budget Office, which confirms the aforementioned funds being warranted/allocated to State, and included in State’s section of the Presi-dent’s budget as a transfer of funds to USAID.
The amounts in the line “Other Differences” in the table below cannot be further defined because appropriation level detail is not provided in the Budget of the U.S. Government.
2017Budgetary Resources
New Obligations & Upward
Adjustments (Total)
Distributed Offsetting Receipts Net Outlays
Combined Statement of Budgetary Resources $ 29,463,075 $ 14,994,990 $ (240,024) $ 12,377,002
Funds Reported in SBR, Not Attributed to USAID in the President’s Budget (9,741,000) (4,817,000) – (5,850,000)
Other Differences (2,053,075) 73,010 240,024 532,998
Budget of the U.S. Government $ 17,669,000 $ 10,251,000 $ – $ 7,060,000

123USAID FY 2018 AGENCY FINANCIAL REPORT | FINANCIAL SECTION
G. SCHEDULE OF CHANGE IN UNOBLIGATED BALANCE BROUGHT FORWARD, BEGINNING OF YEAR 2018 (in thousands):
Unobligated balances at end of Fiscal Year should equal Unobligated balances brought forward to beginning of the following Fiscal Year, October 1. In FY 2018, OMB Circular A-136 streamlined the reporting of the SBR to reflect requirements
of FASAB standards. Due to this, there is a difference of $675 million between Unobligated Balance, End of Year 2017 and Unobligated Balance Brought Forward, October 1.
Schedule of Change in Unobligated Balance Brought Forward, Beginning of Year 2018
Budgetary Non- Budgetary Credit Reform
Unobligated Balance, Beginning of Year 2018 $ 11,654,602.00 $ 3,489,262.00
Change in Unobligated Balance, Beginning of Year 2018:
Actual Repayment of Debt, Prior Year Balances – (57.00)
Actual Capital Transfers to the General Fund of the U.S. Government, Prior-Year Balances (8,408.00) –
Transfers – Prior-Year Balances (108,136.00) –
Balance Transfers – Extension of Avail Other Than Reappropriation (15,602.00) –
Cancelled Authority (138,110.00) –
Downward Adjustments of Prior-Year Unpaid Undelivered Orders – Obligations, Recoveries 818,087.00 722.00
Downward Adjustments of Prior-Year Unpaid Delivered Orders – Obligations, Recoveries 8,972.00 –
Downward Adjustments of Prior-Year Paid Expended Authority Refunds 118,311.00 –
Total Change in Unobligated Balance, Beginning of Year 675,114.00 665.00
Unobligated Balance, End of Year 2017 $ 10,979,488.00 $ 3,488,597.00

124 USAID FY 2018 AGENCY FINANCIAL REPORT | FINANCIAL SECTION
NOTE 18. RECONCILIATION OF NET COST OF OPERATIONS TO BUDGET
USAID presents the Consolidated Statement of Net Cost using the accrual basis of accounting. This differs from the obligation-based measurement of total resources supplied, both budgetary and from other sources, on the Combined Statement of Budgetary Resources. The Federal Financial Accounting Standard No. 7 requires “a reconciliation of proprietary and budgetary information in a way that helps users relate
the two.” The focus of this presentation is to reconcile budgetary net obligations to the net cost of operations. The objective of this information is to categorize the differences between budgetary and financial (proprietary) accounting. Reconciliation of Obligations Incurred to Net Cost of Operations for the years ended September 30, 2018 and 2017 are indicated in the table below (in thousands):
2018 2017
Resources Used to Finance Activities:
Budgetary Resources Obligated
Obligations Incurred $ 15,784,051 $ 14,994,990
Spending Authority From Offsetting Collections (1,639,683) (1,094,099)
Downward Adjustments of Obligations (827,781) (673,444)
Offsetting Receipts (396,088) (240,024)
Net Obligations 12,920,499 12,987,423
Other Resources
Imputed Financing 36,541 31,361
Resources Used to Finance Activities 12,957,040 13,018,784
Resources Used to Finance Items Not Part of Net Cost of Operations 371,123 324,888
Total Resources Used to Finance Net Cost of Operations 13,328,163 13,343,672
Components of the Net Cost of Operations:
Components of Net Cost of Operations That Will Require or Generate Resources in Future Periods (83,173) (66,317)
Components of Net Cost of Operations That Will Not Require or Generate Resources (225,172) (218,859)
Net Cost of Operations (Notes 15 and 16) $ 13,019,818 $ 13,058,496

FINANCIAL SECTION
REQUIRED SUPPLEMENTARY INFORMATION

(Preceding page) USAID provides expertise on domestic resource mobilization to more than 15 countries, so they can strengthen their tax systems to pay for programs and services for their citizens. In Georgia, Darejan Berdzenishvili started her dried fruit business with a grant from a Georgian Government economic development program. PHOTO: THOMAS CRISTOFOLETTI FOR USAID
(Above) In Luxor, Egypt, osteologist Afaf Wahba works on centuries-old mummies found in a tomb, one of several that USAID grantee American Research Center in Egypt helped restore for tourism. Through this support, USAID provides employment and training to Egyptians while safeguarding Egypt’s cultural heritage and contributing to its tourism industry. PHOTO: THOMAS CRISTOFOLETTI FOR USAID

127USAID FY 2018 AGENCY FINANCIAL REPORT | FINANCIAL SECTION
STATEMENT OF BUDGETARY RESOURCES
REQUIRED SUPPLEMENTARY INFORMATION: COMBINING SCHEDULE OF BUDGETARY RESOURCESFor the Year Ended September 30, 2018(in thousands)
Operating
Civilian Stabilization
Initiative
Assistance for Europe, Eurasia and Central Asia
Assistance for Eastern
EuropeDevelopment
Assistance
International Disaster
Assistance
Economic Support
Fund
Assistance for the
Independent States of
the former Soviet Union
Global Health and Child Survival
Credit Financing Other Parent Fund Combined Total
1000 0305 0306 1010 1021 1035 1037 1093 1095
Budgetary Resources:
Unobligated Balance from Prior Year Budget Authority, Net (Discretionary and Mandatory) $ 345,200 $ 1,929 $ 602,804 $ 3,577 $ 3,243,729 $ 1,489,240 $ 4,259,226 $ 5,671 $ 38,430 $ 3,489,262 $ 624,815 $ 1,039,981 $ 15,143,864
Appropriations (Discretionary and Mandatory) 1,347,676 – 750,334 – 2,976,234 4,285,312 3,968,853 – – 4 590,538 – 13,918,951
Borrowing Authority (Discretionary and Mandatory) (Note 11) – – – – – – – – – 40 – – 40
Spending Authority from Offsetting Collections (Discretionary and Mandatory) 49,827 – (2,804) – 919 3,525 (14,013) – – 559,833 1,012,693 29,703 1,639,683
Total Budgetary Resources $ 1,742,703 $ 1,929 $ 1,350,334 $ 3,577 $ 6,220,882 $ 5,778,077 $ 8,214,066 $ 5,671 $ 38,430 $ 4,049,139 $ 2,228,046 $ 1,069,684 $ 30,702,538
Status of Budgetary Resources:
New Obligations and Upward Adjustments (Total): 1,510,171 590 585,227 (31) 3,099,021 3,698,709 4,098,602 (573) 453 282,592 1,504,124 1,005,166 $15,784,051
Unobligated Balance, End of Year:
Apportioned, Unexpired Accounts 91,480 1,360 748,149 3,608 392,519 2,072,404 2,283,020 6,032 32,192 262,199 253,584 18,764 6,165,311
Exempt from Apportionment, Unexpired Accounts – – – – (3) – (1) – – – – – (4)
Unapportioned, Unexpired Accounts 21,174 (21) 10,013 – 2,703,496 46 1,803,451 1 5,785 3,504,348 448,983 3,868 8,501,144
Unexpired Unobligated Balance, End of Year 112,654 1,339 758,162 3,608 3,096,012 2,072,450 4,086,470 6,033 37,977 3,766,547 702,567 22,632 14,666,451
Expired Unobligated Balance, End of Year 119,878 – 6,945 – 25,849 6,918 28,994 211 – – 21,355 41,886 252,036
Total Unobligated Balance, End of Year 232,532 1,339 765,107 3,608 3,121,861 2,079,368 4,115,464 6,244 37,977 3,766,547 723,922 64,518 14,918,487
Total Budgetary Resources $ 1,742,703 $ 1,929 $ 1,350,334 $ 3,577 $ 6,220,882 $ 5,778,077 $ 8,214,066 $ 5,671 $ 38,430 $ 4,049,139 $ 2,228,046 $ 1,069,684 $ 30,702,538
Outlays, Net:
Outlays, Net (Total) (Discretionary and Mandatory) 1,216,301 889 332,611 260 2,454,029 3,466,986 3,846,002 628 (452) (279,039) 705,633 680,974 12,424,822
Distributed Offsetting Receipts (-) – – – – – – – – – – (396,088) – (396,088)
Agency Outlays, Net (Discretionary and Mandatory) $ 1,216,301 $ 889 $ 332,611 $ 260 $ 2,454,029 $ 3,466,986 $ 3,846,002 $ 628 $ (452) $ (279,039) $ 309,545 $ 680,974 $ 12,028,734

128 USAID FY 2018 AGENCY FINANCIAL REPORT | FINANCIAL SECTION
MAJOR FUNDS
Operating Funds
1000 Operating Expenses of USAID
Program Funds
1010 Assistance for Eastern Europe
1021 Development Assistance
1035 International Disaster Assistance
1037 Economic Support Fund
1093 Assistance for the Independent States of the Former Soviet Union
1095 Child Survival and Disease Programs Funds
CREDIT FINANCING FUNDS
4119 Israel Guarantee Financing Fund
4137 Direct Loan Financing Fund
4266 DCA Financing Fund
4343 MSED Guarantee Financing Fund
4344 UE Financing Fund
4345 Ukraine Guarantees Financing Fund
4493 Loan Guarantees to Middle East Northern Africa (MENA) – Financing Account
CREDIT PROGRAM FUNDS
0301 Israel Program Fund
0304 Egypt Program Fund
0400 MSED Program Fund
0401 UE Program Fund
0402 Ukraine Program Fund
0409 Loan Guarantees to Middle East Northern Africa (MENA) – Program Account
1264 DCA Program Fund
5318 Israel Program Fund – Administrative Expense
CREDIT LIQUIDATING FUNDS
4103 Economic Assistance Loans – Liquidating Fund
4340 UE Guarantee Liquidating Fund
4341 MSED Direct Loan Liquidating Fund
OTHER FUNDS
Operating Funds
0300 Capital Investment Fund (CIF)
0306 Assistance for Europe, Eurasia, and Central Asia
1007 Operating Expenses of USAID Inspector General
1036 Foreign Service Retirement and Disability Fund
1099 Fines, Penalties and Forfeitures – Not Otherwise Classified
1435 Miscellaneous Interest Collections
3220 Miscellaneous Recoveries
OTHER FUNDS (continued)
Program Funds
0305 Civilian Stabilization Initiative
1012 Sahel Development Program
1014 Development Fund for Africa
1015 Complex Crisis Fund
1023 Food and Nutrition Development Assistance
1024 Population Planning and Health, Development Assistance
1025 Education and Human Resources, Development Assistance
1027 Transition Initiatives
1028 Global Fund to Fight HIV/AIDS
1029 Tsunami Relief and Reconstruction Fund
1033 HIV/AIDS Working Capital
1038 Central American Reconciliation Assistance
1040 Sub-Saharan Africa Disaster Assistance
1096 Iraq Relief Fund
1500 Demobilization and Transition Fund
Trust Funds
8342 Foreign National Employees Separation Liability Fund
8502 Technical Assistance – U.S. Dollars Advance from Foreign Governments
8824 Gifts and Donations
Revolving Funds
4175 Property Management Fund
4513 Working Capital Fund
4590 Acquisition of Property, Revolving Fund
ALLOCATIONS TO OTHER AGENCIES
1010 Assistance for Eastern Europe
1021 Development Assistance
1035 International Disaster Assistance
1037 Economic Support Fund
1093 Assistance for the Independent States of the Former Soviet Union
1095 Child Survival and Disease Program Funds
ALLOCATIONS FROM OTHER AGENCIES
0113 Diplomatic and Consular Programs, State
1030 Global HIV/AIDS Initiative – Carryover
1031 Global Health/Child Survival and HIV/AIDS
1121 Democracy Fund
1154 Andean Counterdrug Initiative (ACI)
2278 Commodity Credit Corporation
2750 Millennium Challenge Corporation
4336 Commodity Credit Corporation
Office of Inspector General, U.S. Agency for International Development 23
APPENDIX E. MAJOR CONTRIBUTORS TO THIS REPORT The following made major contributions to this report: Rohit Chowbay, Financial Audits Division director; Mark Norman, Information Technology Audits Division director; Lisa Banks, Information Technology Audits Division assistant director; La Quinthia Carroll, Financial Audits Division assistant director; Amy Markel, Financial Audits Division assistant director; Damian Wilson, Financial Audits Division assistant director; Sayed Baqiree, auditor; Abiodun Bello, auditor; Robyn Blount, auditor; Abbas Busari, auditor; Guilloux Cayo, auditor; Michelle Diouf, auditor; Fred Jones, auditor; Stella Kgabo, auditor; John Kiruri, auditor; Mary Llacer-Salcedo, auditor; Ivan Magana, auditor; Keith Manley, auditor; Chinwe Mbanefo, auditor; Waheed Nasser, auditor; Steven Ramonas, auditor; Donna Rosa, auditor; Samneiliza Soriano, auditor; Allison Tarmann, writer-editor; Catherine Trujillo, auditor; Eunice Valentin-Rivera, auditor; John Vernon, auditor; and Eric Zuber, auditor.