audio-visual integration: generalization across talkers a senior
TRANSCRIPT

1
Audio-Visual Integration: Generalization Across Talkers
A Senior Honors Thesis
Presented in Partial Fulfillment of the Requirements for graduation with research
distinction in Speech and Hearing Science in the undergraduate colleges of The Ohio
State University
By
Courtney Matthews
The Ohio State University
June 2012
Project Advisor: Dr. Janet M. Weisenberger, Department of Speech and Hearing
Science

2
Abstract
Maximizing a hearing impaired individual’s speech perception performance
involves training in both auditory and visual sensory modalities. In addition, some
researchers have advocated training in audio-visual speech integration, arguing that it is
an independent process (e.g., Grant and Seitz, 1998). Some recent training studies
(James, 2009; Gariety, 2009; DiStefano, 2010; Ranta, 2010) have found that skills
trained in auditory-only conditions do not generalize to audio-visual conditions, or vice
versa, supporting the idea of an independent integration process, but suggesting limited
generalizability of training. However, the question remains whether training can
generalize in other ways, for example across different talkers. In the present study, five
listeners received ten training sessions in auditory, visual, and audio-visual perception
of degraded speech syllables spoken by three talkers, and were tested for
improvements with an additional two talkers. A comparison of pre-test and post-test
results showed that listeners improved with training across all modalities, with both the
training talkers and the testing talkers, indicating that across-talker generalization can
indeed be achieved. Results for stimuli designed to elicit McGurk-type audio-visual
integration also suggested increases in integration after training, whereas other
measures did not. Results are discussed in terms of the value of different measures of
integration performance, as well as for implications for the design of improved aural
rehabilitation programs for hearing-impaired persons.

3
Acknowledgments
I would like to thank my project advisor, Dr. Janet Weisenberger, for all of her
guidance and support throughout my honors thesis process. Because of her I was able
to expand my knowledge more than I could have ever expected. I am extremely
grateful for her time, assistance and patience. I would also like to thank my subjects for
their flexibility, time and effort.
This project was supported by an ASC Undergraduate Scholarship and an SBS
Undergraduate Research grant.

4
Table of Contents
Abstract...………………………………………………………………………………………..2
Acknowledgments………………………………………………………………………….…...3
Table of Contents……………………………………………………………………………….4
Chapter 1: Introduction and Literature Review………………………………………………5
Chapter 2: Method…………………………………………………………………………….13
Chapter 3: Results and Discussion………………………………………………………….18
Chapter 4: Summary and Conclusions…………………….………………………….........23
Chapter 5: References………………………………………………………………….....….26
List of Figures……………………………………………………………………………….….28
Figures 1-13……………………………………………………………………………...……30

5
Chapter 1: Introduction and Literature Review
Effective aural rehabilitation programs provide hearing-impaired patients with
training that can be generalized to different situations. It is important that patients can
apply this training to everyday circumstances of speech perception. Maximizing an
individual’s speech perception performance involves training in both auditory and visual
sensory modalities. Although it has long been known that listeners will use both auditory
and visual sensory modalities in situations where the auditory signal is compromised in
some way (for example, listeners with hearing impairment), research has shown that
listeners will use both of these modalities even when the auditory signal is perfect.
McGurk and MacDonald (1976) found that when listeners were presented
simultaneously with a visual syllable /ga/ and an auditory syllable /ba/, they perceived
the sound /da/, a “fusion” response. Although the auditory /ba/ was in no way distorted,
the response occurs because the brain cannot ignore the visual stimulus. The resulting
perception integrates, or fuses, the auditory stimulus /ba/, which has a bilabial place of
articulation, and visual stimulus /ga/, which has a velar place of articulation, to form /da/,
which has an intermediate alveolar place of articulation. When the stimuli were
reversed, an auditory /ga/ presented with a visual /ba/, the most common response was
a “combination” response of /bga/. A “combination” response occurs because the visual
stimulus is too prominent to be ignored, so rather than fusing the stimuli the brain
combines the prominent visual stimuli with the auditory signal to create a new
perception. Subsequent studies have explored the limits of this audio-visual integration.
To understand the nature of this integration, it is important to consider the types of
auditory and visual cues that are available in the speech signal.

6
Auditory Cues for Speech Perception
In most situations the auditory cue alone is sufficient for listeners to understand
speech sounds. Within the auditory signal there are three main cues for identifying
speech: place of articulation, manner of articulation and voicing. Place of articulation
refers to the physical location within the oral cavity where the airstream is obstructed.
Included in this category are bilabials (/b,m,p/), labiodentals (/f,v/), interdentals (/t,θ/),
alveolars (/s,z/), palatal-alveolars (/Ӡ,ʃ/), palatals(/j,r/) and velars (/k,g,ŋ/). The manner of
articulation refers to the way in which the articulators move and come in contact with
each other during sound production. This includes stops (/p,b,t,d,k,g/) fricatives
(/f,v,t,s,z,h/), affricates (/tʃ, dӠ/), nasals (/m,n,ŋ/), liquids (/l,r/) and glides (/j/). Voicing
indicates whether or not the vocal folds vibrated during the production of the sound. If
they do vibrate the sound is referred to as a voiced sound
(/b,d,g,v,z,m,n,w,j,l,r,ð,ŋ,ӡ,dӡ/), and if they do not, the sound indicates a voiceless
sound (/p,t,k,f,s,f,θ,ʃ,tʃ/) (Ladefoged, 2006). Cues to place, manner and voicing are
present in the acoustic signal, in characteristics such as formant transitions, turbulence
and resonance, and voice onset time.
Visual Cues for Speech Perception
Although most of the information required for comprehending a speech signal
can be obtained from auditory cues, McGurk and MacDonald (1976) showed that visual
cues also play an important role in speech perception. Visual cues become especially
useful in situations where the auditory signal is compromised, but as their study
showed, even when the auditory signal is perfect visual cues are still used by listeners.

7
The sole characteristic of speech production that can be reliably visually detected is
place of articulation, but even the results of this observation are often ambiguous
(Jackson, 1988).
A primary reason that it is extremely difficult to identify speech sounds by visual
cues alone is the fact that many sounds look alike. These are referred to as viseme
groups, sets of phonemes that use the same place of articulation but vary in their
voicing characteristics and manner of articulation (Jackson, 1988). Since place of
articulation is the primary observable feature of speech sounds, it is extremely difficult to
differentiate among phonemes that use the same place. The phonemes /p,b,m/ are an
example of a viseme group; they all use a bilabial place of articulation, making them
visually indistinguishable. It is also important to note that talkers are not all identical and
that the clarity of visual speech cues can vary greatly. Jackson found in her study that it
was easier to speechread talkers who created more viseme categories versus those
talkers who created less. There are also other talker features that contribute to the
ability to speechread, including gestures, head and eye movements and even mouth
shape. All of these visual cues can aid a listener in any speaking situation but
especially those situations in which the auditory signal is compromised.
Speech Perception with Reduced Auditory and Visual Signals
Studies have shown that speech can still be intelligible in situations where the
auditory cues are compromised. This is due to the fact that speech signals are
somewhat “redundant,” meaning that they contain more than the minimum information
required for identifying the sounds. Shannon et al. (1995) performed a study with

8
speech signals modified to be similar to those produced by a cochlear implant. This
was achieved by removing the fine structure information of the speech signals and
replacing it with band-limited noise, while maintaining the temporal envelope of the
speech. In the study different numbers of noise-bands were used and it was discovered
that intelligibility of the sounds increased as the number of frequency bands increased.
However, high levels of speech recognition were reached with as few as three bands,
indicating that speech signals can still be identified even with a large amount of
information removed.
The study discussed above was expanded by Shannon et al. in 1998. There
were four manipulations done within the study: the location of the band division was
varied, the spectral distribution of the envelopes was warped, the frequencies of the
envelope cues were shifted and spectral smearing was done. The factors that most
negatively influenced intelligibility were found to be the warping of the spectral
distribution and shifting the tonotopic organization of the envelope. The exact frequency
cut offs and overlapping of the bands did not affect speech intelligibility as greatly.
Another study that examined the speech intelligibility of degraded auditory
signals was performed by Remez et al. (1981), who reduced speech sounds to three
sine waves that followed the three formants of the original auditory signal. Although it
was reported that the signals were unnatural-sounding, they were highly intelligible to
the listeners. This study further suggests that auditory cues are packed with more
information than absolutely needed for identification, and that even highly degraded
speech signals can still be understood.

9
Degraded visual cues can also still be useful signals in understanding speech.
Munhall et al. (1994) studied whether or not degraded visual cues affected speech
intelligibility. They employed visual images degraded through band-pass and low-pass
spatial filtering, which were presented to listeners along with auditory signals in noise.
High spatial frequency information was apparently not needed for speech perception
and it was concluded that compromised visual signals can nonetheless be accurately
identified (Munhall et al., 2004).
Audio-Visual Integration of Reduced Information Stimuli
Studying audio-visual integration processes with compromised auditory signals is
especially important because it simulates the experience of hearing impaired persons
and provides insights into what promotes optimal perception. Information learned from
these studies can then be used when designing aural rehabilitation programs for
hearing impaired individuals. For this reason, some researchers have advocated
specific training in audio-visual speech integration for aural rehabilitation programs.
Grant and Seitz (1998) offered evidence to support the idea that audio-visual integration
is a process separate from auditory-only or visual-only speech perception. In
experiments with hearing impaired persons, they found that audio-visual integration
could not be predicted from auditory-only or visual-only performance, leading them to
argue for independence of the integration process. Grant and Seitz thus suggested that
specific integration training should also be incorporated into successful aural
rehabilitation programs.
Effects of Training in Recent Studies

10
More recent studies have further explored the relative value of modality-specific
speech perception training. Many of these studies have employed normal-hearing
listeners who have been presented with some form of degraded auditory stimulus to
approximate situations encountered by hearing-impaired individuals. In our laboratory,
James (2009) and Gariety (2009) tested syllable perception with syllables that had been
degraded to mimic those generated by cochlear implants. To create their auditory
stimuli they used a method similar to that employed by Shannon et al. (1995), in which
the fine structure details of auditory stimuli were replaced with band-limited noise while
preserving the temporal envelope. James (2009) and Gariety (2009) showed that the
auditory-only component can be successfully trained. However, this training did not
generalize to the audio-visual condition and thus did not improve integration results,
leaving a question about whether integration is a skill that can benefit from training.
Ranta (2010) and DiStefano (2010) addressed the question of whether
integration ability can be trained. They employed stimuli similar to those used by James
(2009), but trained listeners only in the audio-visual condition. Results showed that
integration can be trained, but the skills did not generalize to the auditory-only or the
visual-only condition. The results of these studies suggest that skills do not generalize
across modalities, supporting the argument that integration is a process independent of
auditory-only or visual-only processing. However, because the value of aural
rehabilitation programs is highly dependent on skills generalization, the question still
remains whether this form of training can generalize in other ways, for example across
different talkers.

11
Some evidence suggests that this type of generalization is possible. For
example, Richie and Kewley-Port (2008) trained listeners to identify vowels using audio-
visual integration techniques. They found that training audio-visual integration was
successful and that the trained listeners showed improvement from pre-test to post-test
in both syllable recognition and sentence recognition, whereas the untrained listeners
did not. More importantly, a substantial degree of generalization across talkers was
observed. They suggest that audio-visual speech perception is a skill that, when done
appropriately, can be trained to produce benefits to speech perception for persons with
hearing impairment. They argued that implementing these techniques into aural
rehabilitation could provide an important and effective part of a successful program for
hearing impaired individuals.
Present Study
The results from Richie and Kewley-Port (2008) offer encouragement for the
possibility that across-talker generalization can be obtained. However, the question
remains whether similar talker generalization can be observed for the consonant-based
degraded stimuli used by Ranta (2010) and DiStefano (2010). The present study
addresses this question by providing training in audio-visual speech integration with one
set of talkers and testing for integration improvement with a different set of talkers. A
group of normal-hearing listeners received ten training sessions in audio-visual
perception of speech syllables produced by three talkers. The auditory component of
these syllables was degraded in a manner consistent with the signals produced by
multichannel cochlear implants (Shannon et al, 1995), similar to the methods used by
James (2009), DiStefano (2010), and Ranta (2010). Listeners were periodically tested

12
for improvement in auditory-only, visual-only and audio-visual perception with stimuli
produced by both the training talkers and two additional talkers who had not been used
in training. Consistent with the results of Richie and Kewley-Port, it was anticipated that
integration would improve substantially for the training talkers. A smaller but still
noticeable improvement was anticipated for the non-training talkers, reflecting some
degree of generalization. Regardless of the results, findings should provide new
insights to the limits of generalizability of audio-visual integration training, and how to
produce more effective designs for aural rehabilitation programs for hearing impaired
patients.

13
Chapter 2: Method
Participants
The present study included five listeners, two males and three females, ages 21-
23 years. All five had normal hearing as well as normal or corrected vision, by self-
report. Participants were compensated $150 for their participation. Materials previously
recorded from five adult talkers, two male and three female native Midwestern English
speakers, were used as the stimuli.
Stimuli Selection
A limited set of eight syllables were presented, all of which satisfied the following
conditions:
1. The pairs of stimuli were minimal pairs; the initial consonant was their only
difference
2. All stimuli contained the vowel /ae/, selected because of the lack of lip
rounding or lip extension, which can create speech reading difficulties
3. Each category of articulation, including place (bilabial, alveolar velar), manner
(stop, fricative, nasal), and voicing (voiced or voiceless), was represented
multiple times within the syllables.
4. All syllables were presented without a carrier phrase.
Stimuli
The same set of single-syllable stimuli was used for each of the conditions:
Bilabial: bat, mat, pat

14
Alveolar: sat, tat, zat
Velar: cat, gat
The degraded audio-visual conditions included the following four dual-syllable
(dubbed) stimuli. The first item in the pair represents the auditory stimulus while
the second indicates the visual stimulus.
bat-gat
gat-bat
pat-cat
cat-pat
Stimuli Recording and Editing
The stimuli used in this study were identical to those used in recent studies (e.g.,
James, 2009; DiStefano, 2010; and Ranta, 2010) in order to yield comparable results.
Speech samples from five talkers were degraded using a MATLAB script designed by
Delgutte (2003). The speech signal was filtered into two broad spectral bands. Then,
the fine structure of each band was replaced with band limited noise, while the temporal
envelope remained intact. The resulting stimulus was a 2-channel stimulus, similar to
those used by Shannon et al. (1998). Using a commercial video editing program, Video
Explosion Deluxe, the degraded auditory stimuli were dubbed onto the visual stimuli.
The final step involved burning the stimulus sets onto DVDs using Sonic MY
DVD. Four DVDs were created for each of the five talkers. Each of these DVDs

15
contained sixty stimuli arranged in random order to eliminate the possibility of
memorization from the participants.
Visual Presentation
All participants were initially pre-tested using degraded auditory, visual and
audio-visual conditions, and then received training in all three of these conditions. The
visual portion of the stimulus was presented using a 50 cm video monitor positioned
approximately 60 cm outside the window of a sound attenuating booth. The monitor was
eye level to the participants and positioned about 120 cm away from them. The stimuli
were presented using recorded DVDs on a DVD player. During auditory-only
presentation the monitor screen was darkened.
Degraded Auditory Presentation
The degraded auditory stimuli were presented from the headphone output of the
DVD player through 300-ohm TDH-39 headphones at a level of approximately 75 dB
SPL.
Testing Procedure
Testing was conducted in the Ohio State University’s Speech and Hearing
Department located in Pressey Hall. Participants were instructed to read over a set of
instructions explaining the procedure and listing a closed-set of response possibilities,
which included 14 possible responses. Included in the response set were the 8
presented stimuli along with 6 other possibilities, which reflected McGurk-type fusion

16
and combination responses for the discrepant stimuli. These additional responses
included syllables dat, nat, pcat, ptat, bgat and bdat.
Each participant was tested individually in a sound attenuating booth that faced
the video monitor located outside of the booth. Auditory stimuli were transmitted through
headphones inside the booth. The examiner recorded and scored the participant’s
verbal responses as heard via an intercom system. Each participant was initially
administered a pre-test including stimuli selected from a set of 15 DVDs, three for each
of the five talkers, each DVD containing 60 randomly ordered syllables. In the pre-test,
the listeners were presented with one DVD from each talker in each of the three
listening conditions (auditory-only, visual-only and audio-visual). Each DVD contained
30 congruent stimuli expected to elicit the correct response. The remaining 30 stimuli
were discrepant, designed to elicit McGurk-type responses. Participants were instructed
to listen to/watch each DVD and to verbally respond the syllable they perceived for each
stimulus. During the pre-test no feedback was provided.
The pre-test was followed by five training sessions in which participants received
audio-visual training on two DVDs for each of the three training talkers. When
presented with congruent stimuli, if the participant provided the correct response the
examiner visually reinforced the response with a head nod. If the response was
incorrect the examiner would provide the correct response via an intercom system. For
the discrepant stimuli the appropriate responses were as follows, with the first column
representing the visual stimulus, the second representing the auditory and the third
representing the expected McGurk-type response:
17
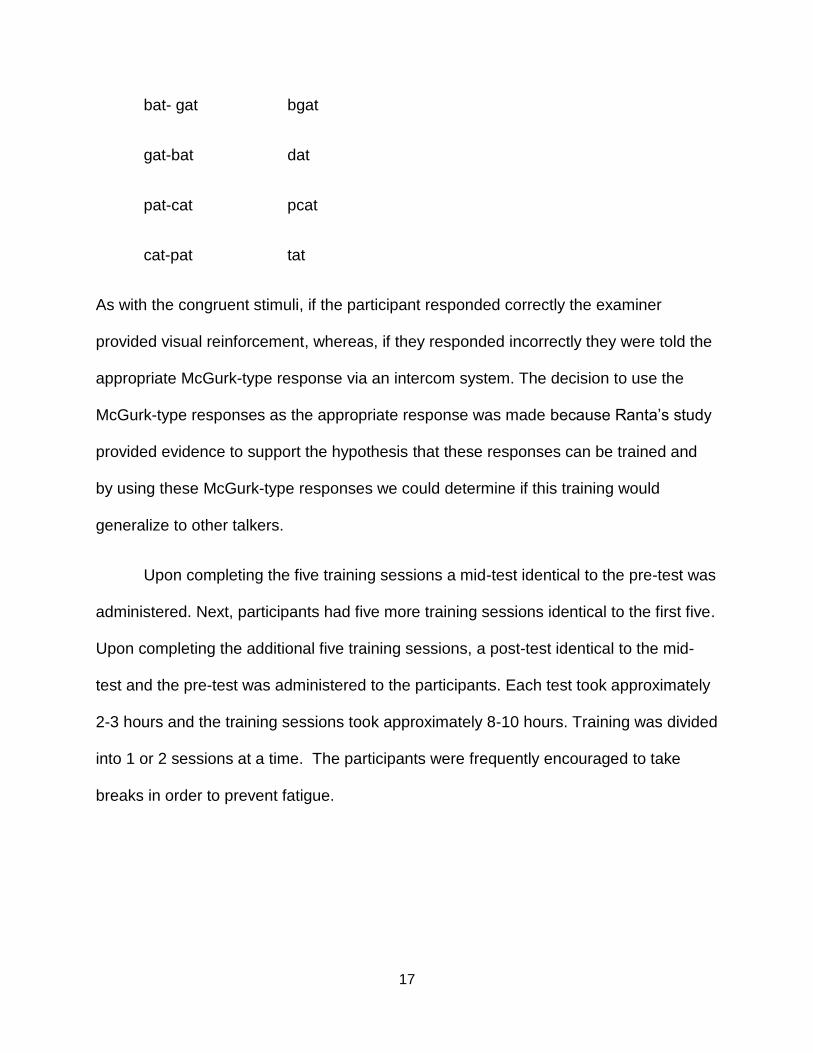
bat- gat bgat
gat-bat dat
pat-cat pcat
cat-pat tat
As with the congruent stimuli, if the participant responded correctly the examiner
provided visual reinforcement, whereas, if they responded incorrectly they were told the
appropriate McGurk-type response via an intercom system. The decision to use the
McGurk-type responses as the appropriate response was made because Ranta’s study
provided evidence to support the hypothesis that these responses can be trained and
by using these McGurk-type responses we could determine if this training would
generalize to other talkers.
Upon completing the five training sessions a mid-test identical to the pre-test was
administered. Next, participants had five more training sessions identical to the first five.
Upon completing the additional five training sessions, a post-test identical to the mid-
test and the pre-test was administered to the participants. Each test took approximately
2-3 hours and the training sessions took approximately 8-10 hours. Training was divided
into 1 or 2 sessions at a time. The participants were frequently encouraged to take
breaks in order to prevent fatigue.

18
Chapter 3: Results and Discussion
Results of the pre-test, mid-test and post-test were analyzed to determine
whether or not improvements were seen in all three modalities and whether or not these
improvements generalized from the training talkers to the testing talkers. Percent
correct performance data for the congruent stimuli are presented first, followed by the
percent response results for the discrepant stimuli.
Percent Correct Performance
Figure 1 displays the averaged results for overall percent correct intelligibility
performance in each modality for the auditory-only (A-only), visual-only (V-only) and
audio-visual (A+V) (congruent) conditions for each testing situation, pre-test, mid-test
and post-test. Results are shown for the stimuli produced by training talkers. Listeners
showed improvements from pre-test to post-test in all three modalities. A two-factor
repeated measures analysis of variance (ANOVA) was performed on arcsine-
transformed percentages to assess the improvements and evaluate whether differences
observed across testing sessions were statistically significant. ANOVA results indicated
a significant main effect of test (pre vs. post), F(1,4)=50.525, p=.002, as well as a
significant main effect of modality (A-only, V-only, A+V), F(2,8)=87.364, p<.001. There
was no significant interaction found between test and modality, F(2,8)=2.65, p=.13(ns).
Pairwise comparisons were also performed for these data. Results showed that there
was no significant difference between the means of A-only and V-only performance,
mean difference=.194, p=.015. A significant difference was found between A-only and

19
A+V, mean difference=.456, p=.001, and between V-only and A+V, mean
difference=.65, p<.001.
It is important to note that the significant improvement from pre-test to post-test in
all three modalities generalized to the testing talkers as well, as shown in Figure 2.
Figure 2 shows the results for overall percent correct intelligibility performance in each
of the listening conditions, A-only, V-only and A+V, for each testing situation, pre-test,
mid-test and post-test, for the talkers not used in the training sessions (i.e., the testing
talkers). ANOVA results for the testing talkers revealed a significant main effect of test
(pre vs. post), F(1,4)=45.499, p=.003 as well as a significant main effect of modality (A-
only, V-only, A+V), F(2,8)=115.052, p<.001. As with the training talkers, there was no
significant interaction found between test and modality, F(2,8)=1.431, p=.29 (ns).
Pairwise comparisons also revealed results similar to those of the training talkers. There
was no significant difference between A-only and V-only, mean difference=.027, p=.591.
A significant difference was seen between A-only and A+V, mean difference=.550,
p<.001, as well as between V-only and A+V, mean difference=.523, p<.001.
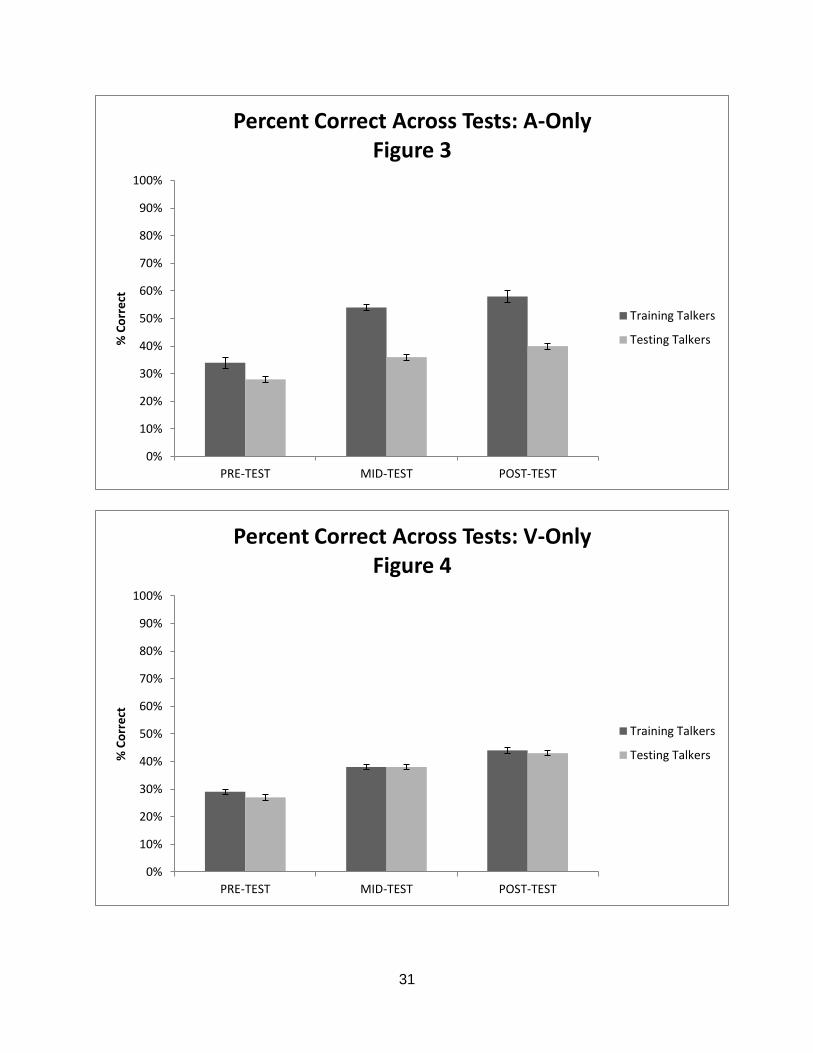
Figures 3-5 display these data in a format allowing easier comparison. In Figure
3 results are shown for percent correct performance in the A-only condition across tests
with training and testing talkers, for side-by-side comparison. This graph shows that the
listeners improved their performance from pre-test to post-test with both the training
talkers and the testing talkers. ANOVA results revealed that there was a significant main
effect of test (pre vs. post), F(1,4)=37.440, p=.004 as well as a significant main effect of
talker (training vs. testing), F(1,4)=252.066, p<.001. In Figure 4, results for the V-only
condition are displayed. ANOVA results for these data show a significant effect of test,

20
F(1,4)=141.307, p<.001, but no difference across talkers, F(1,4)=.385, p=ns, and no
significant interaction, F(1,6)=.234, p=ns. Figure 5 shows data for the A+V condition.
Here no significant effects were observed across tests, F(1,4)=4.550, p=.100, nor
across talkers, F(1,4)=4.369, p=.105. Again, no interaction was observed, F(1,4)=1.395,
p=.303.
Integration performance with the congruent stimuli across tests is shown in
Figure 6. The averages for training talkers and testing talkers are shown. Here
integration is defined as the difference between the percent correct in the A+V condition
and the best single modality performance (A-only or V-only). Using this measure, the
amount of integration actually declines slightly from pre-test to post-test for both the
training talkers and the testing talkers. A two-factor ANOVA revealed that there was no
significant main effect of test (pre vs. post), F(1,4)=3.642, p=.13. There was also no
significant main effect of talker (training vs. testing), F(1,4)=1.359, p=.30. This decrease
in integration could be attributed to the fact that the listeners showed greater
improvements in the A-only and V-only conditions as compared to the A+V condition.
Figure 7 examines the results for stimuli produced by individual talkers. The pre-
test and post-test percent correct responses in the A-only condition across listeners this
figure shows for the three training talkers as well as the two testing talkers. In this figure
it is important to note that training talkers JK and EA and the testing talkers KS and DA
all began with similar baseline percent correct intelligibility. However, training talker LG
started off with a percent correct intelligibility that was slightly higher than the others and
listeners showed a greater improvement in this modality with this talker.

21
The average percent correct responses for the pre-test and post-test for each of
the talkers in the V-only condition are displayed in Figure 8. Unlike in the A-only
condition, within this modality there was no particular talker who showed a baseline
average intelligibility notably higher than the rest. Again improvements were seen from
pre-test to post-test with the training talkers, and that this improvement appeared to
generalize to the testing talkers.
These results are similar to those found in Figure 9, which shows percent correct
responses for the pre-test and post-test for each of the talkers in the A+V condition.
Here we see that LG did have a higher baseline average intelligibility, but the difference
was not as great as that seen in the A-only condition. Two important features of these
data are that for each of the talkers, training and testing, we see an improvement in
performance from pre-test to post-test, indicating that generalization occurred. Also, in
this condition the pre-test average intelligibility for all talkers is higher than that in the
single modality conditions. Even at the post-test, there was still room for improvement,
ruling out a possible ceiling-effect. Thus, ceiling effects do not explain the decrease in
integration observed in Figure 6.
Integration of Discrepant Stimuli
The responses to discrepant stimuli in the A+V condition were categorized into
“auditory” (percent of time subject chose the auditory stimulus as the response), “visual”
(percent of time the subject chose a response reflecting the visual place of articulation),
or “other” (any other type of response). Figure 10 shows the percent response averaged
across listeners for the pre-test and post-test discrepant stimuli for the training talkers,

22
and Figure 11 shows the results for the testing talkers. While an increase in “other”
responses is seen, this increase was not statistically significant. ANOVA results
revealed there was no main effect of test (pre vs. post), F(1,4)=6.221, p=.067, just
missing the .05 alpha limit. There was also no significant main effect of talker (training
vs. testing), F(1,4)=.125, p=.74. The fact that the “other” responses increased from pre-
test to post-test for both the training talkers and the testing talkers shows a decrease on
reliance of the individual modalities and a possible increase in audio-visual integration.
To determine whether there had indeed been an increase in integration, the responses
in the “other” category were further analyzed. Figures 12 and 13 show the results.
In Figures 12 and 13 “fusion” and “combination” responses indicate McGurk-type
integration, whereas the “neither” category represents those responses that do not
show integration. For both the training talkers and the testing talkers we see an increase
in “fusion” and “combination” responses from pre-test to post-test and a corresponding
decrease in “neither” responses. This suggests that training facilitated integration for
the discrepant stimuli and this integration process appears to have generalized from the
training talkers to the testing talkers. However, ANOVA results revealed that the main
effect of test was not statistically significant, F(1,4) = 4.438, p=.103, although the main
effect of talker approached significance, F(1,4)=6.831, p=.059.

23
Chapter 4: Summary and Conclusion
Overall, the present results indicate that training in the A-only, V-only and A+V
conditions with one set of talkers does generalize to a different set of talkers. For both
sets of talkers, improvements in all testing modalities were observed from pre-test to
post-test. Further, results for discrepant stimuli suggest that audio-visual integration
increased from pre-test to post-test, as measured by an increase in McGurk-type fusion
and combination responses. In contrast, integration for congruent stimuli, measured as
the difference between A+V and the best single modality (A or V), appeared to decrease
after training, because the improvement in single-modality conditions was greater than
that for the A+V condition. This apparent inconsistency can be attributed to differences
in the way integration measured in the present study and argues for further investigation
into the utility of different measures of integration.
Grant (2002) critiqued and compared several models for predicting integration
efficiency. He focused specifically on two models the pre-labeling model of Braida and
the fuzzy logic model of Massaro and argues that the pre-labeling model is superior to
the fuzzy logic model. One primary difference of these two models is their assumption
about the time course of audio-visual integration. The pre-labeling model assumes that
integration occurs early in the cognitive process, prior to a response decision. The
fuzzy logic model, in contrast, assumes that integration is a later occurrence, after initial
response decisions for each individual modality have been made. Grant applied both
models to one data set and found conflicting results; the fuzzy logic model suggested
there were no significant signs of inefficient integrators, while the pre-labeling model
showed significant differences. Grant argued for the use of the pre-labeling model due

24
to the fact that the fuzzy logic model uses a formula designed to minimize the difference
between obtained and predicted scores. This creates a model that attempts to fit
obtained A+V scores rather than act as a tool to predict optimal audio-visual speech
perception performance. Rather than attempting to fit observed data, the pre-labeling
model estimates audio-visual performance based on single-modality information and
predicts performance based on the notion that there is no interference across
modalities. In situations where this model has been used, the predicted audio-visual
scores were always greater than or equal to actual performance whereas the
predictions made using the fuzzy-logic model were equally distributed as over-predicting
and under-predicting. Grant concluded that the pre-labeling model places a stronger
emphasis on individual differences and is therefore a better model for measuring
integration efficiency.
Tye-Murray et al. (2007) further analyzed the pre-labeling model. This model, as
well as a computationally simpler integration efficiency model, was used to compare
integration results for normal hearing and hearing-impaired subjects. Consistent with
Grant’s findings, the pre-labeling model predicted higher integration performance than
that observed for both hearing-impaired and normal hearing listeners. However, this
model found no significant difference between the two groups of listeners, suggesting
that while neither group achieved their maximum integration ability, their performances
were comparable. The integration efficiency model also did not find a significant
difference between the two groups. Unlike the pre-labeling model, the integration
efficiency model predicted scores for audio-visual performance that were consistently
lower than the actual scores. The integration efficiency model takes into account single-
25
modality performance for an individual listener. Tye-Murray et al. argued that this is
beneficial, because it allows for a deeper investigation into a listener’s skills that can
result in the most effective rehabilitation strategy. This model allows insight to a
listener’s strengths, weaknesses and integration ability and allows for the formation a
rehabilitation strategy that is customized for each hearing-impaired individual.
Recently, Altieri (2008) proposed a different type of model of audio-visual
integration, one that employs listener reaction time as an indicator of cognitive
processing complexity. While the present study did not collect reaction time data, future
work could add this measure to empirical studies to determine its potential usefulness
for aural rehabilitation.
Future work could use the present results to compare the measures used in the
present study to model-predictive measures (Grant & Seitz, 1998), simple measures of
integration efficiency (Tye-Murray et al., 2007), and processing capacity measures
(Altieri, 2008) to determine which, if any, of these measures can be used to develop
optimized aural rehabilitation strategies for hearing-impaired persons. Nonetheless,
these results support the generalizability of training in audio-visual speech perception
for aural rehabilitation programs, and argue strongly for inclusion of training in all
modalities (auditory, visual, and audio-visual) to achieve maximum benefits.

26
References
Altieri, N. (2008). Toward a unified theory of audiovisual integration. Boca-Raton, FL:
Dissertation.com
DiStefano, S. (2010). Can audio-visual integration improve with training, Senior Honors
Thesis, The Ohio State University.
Gariety, M. (2009). Effects of training on intelligibility and integration of sine-wave
speech. Senior Honors Thesis, The Ohio State University.
Grant, K.W. & Seitz, P.F. (1998). Measures of auditory-visual integration in nonsense
syllables and sentences. The Journal of the Acoustical Society of America, 104
(4), 2438-2450.
James, K. (2009). The effects of training on intelligibility of reduced information speech
stimuli. Senior Honors Thesis, The Ohio State University.
McGurk, H., & MacDonald, J (1976). Hearing lips and seeing voices. Nature 264, 746-
748.
Ranta, A. (2010). How does feedback impact training in audio-visual speech perception,
Senior Honors Thesis, The Ohio State University.
Richie, C. & Kewley-Port, D. (2008). The effects of auditory-visual vowel identification
training on speech recognition under difficult listening conditions. Journal of
Speech, Language, and Hearing Research, 51, 1607-1619.

27
Shannon, R.V., Zeng, F.G., Kamath, V., Wygonski, J., & Ekelid, M. (1995). Speech
recognition with primarily temporal cues. Science, 270, 303-304.
Tye-Murray, N., Sommers, M. S., & Spehar B. (2007). Audiovisual integration and
lipreading abilities of older adults with normal and impaired hearing. Ear &
Hearing 28, 656-658.

28
List of Figures
Figure1: Percent correct responses for tests, averaged across training talkers and
listeners
Figure 2: Percent correct responses for tests, averages across testing talkers and
listeners
Figure 3: Percent correct responses for A-only tests, averaged separately across
listeners for training talkers and testing talkers
Figure 4: Percent correct responses for V-only tests, averaged separately across
listeners for training talkers and testing talkers
Figure 5: Percent correct responses for A+V congruent stimuli tests, averaged
separately across listeners for training and testing talkers
Figure 6: Amount of integration by test, averaged across listeners separately for training
talkers and testing talkers
Figure 7: Percent correct responses for pre-test and post-test averaged by talker in the
A-only condition
Figure 8: Percent correct responses for pre-test and post-test averaged responses by
talker in the V-only condition
Figure 9: Percent correct responses for pre-test and post-test averaged by talker in the
A+V condition

29
Figure 10: Percent response for discrepant stimuli averaged for training talkers across
listeners, for pre-test and post-test
Figure 11: Percent response for discrepant stimuli averaged for testing talkers across
listeners, for pre-test and post-test
Figure 12: McGurk-type integration results for pre-test and post-test, averaged across
listeners for training talkers
Figure 13: McGurk-type integration results for pre-test and post-test, averaged across
listeners for testing talkers

30
0%
10%
20%
30%
40%
50%
60%
70%
80%
90%
100%
A-ONLY V-ONLY A+V
% C
orr
ect
Percent Correct by Modality
Training Talkers Figure 1
PRE-TEST
MID-TEST
POST-TEST
0%
10%
20%
30%
40%
50%
60%
70%
80%
90%
100%
A-ONLY V-ONLY A+V
% C
orr
ect
Percent Correct by Modality Testing Talkers
Figure 2
PRE-TEST
MID-TEST
POST-TEST
31
0%
10%
20%
30%
40%
50%
60%
70%
80%
90%
100%
PRE-TEST MID-TEST POST-TEST
% C
orr
ect
Percent Correct Across Tests: A-Only
Figure 3
Training Talkers
Testing Talkers
0%
10%
20%
30%
40%
50%
60%
70%
80%
90%
100%
PRE-TEST MID-TEST POST-TEST
% C
orr
ect
Percent Correct Across Tests: V-Only Figure 4
Training Talkers
Testing Talkers

32
0%
10%
20%
30%
40%
50%
60%
70%
80%
90%
100%
PRE-TEST MID-TEST POST-TEST
% C
orr
ect
Percent Correct Across Tests: A+V
Figure 5
Training Talkers
Testing Talkers
0%
10%
20%
30%
40%
50%
60%
70%
80%
90%
100%
PRE-TEST MID-TEST POST-TEST
Integration Across Tests Figure 6
Training Talkers
Testing Talkers

33
0%
10%
20%
30%
40%
50%
60%
70%
80%
90%
100%
JK EA LG KS DA
% C
orr
ect
Axis Title
Percent Correct by Talker: A-Only Figure 7
Pre-Test
Post-Test
0%
10%
20%
30%
40%
50%
60%
70%
80%
90%
100%
JK EA LG KS DA
% C
orr
ect
Percent Correct by Talker: V-Only Figure 8
Pre-Test
Post-Test
Training Talkers Testing Talkers
Training Talkers Testing Talkers

34
0%
10%
20%
30%
40%
50%
60%
70%
80%
90%
100%
JK EA LG KS DA
% C
orr
ect
Percent Correct by Talker: A+V
Figure 9
Pre-Test
Post-Test
Training Talkers Testing Talkers

35
0%
10%
20%
30%
40%
50%
60%
70%
80%
90%
100%
AUDITORY VISUAL OTHER
% R
esp
on
se
Training Talkers Figure 10
PRE-TEST
POST-TEST
0%
10%
20%
30%
40%
50%
60%
70%
80%
90%
100%
AUDITORY VISUAL OTHER
% R
esp
on
se
Testing Talkers Figure 11
PRE-TEST
POST-TEST

36
0%
10%
20%
30%
40%
50%
60%
70%
80%
90%
100%
FUSION COMBINATION NEITHER
% R
esp
on
se
"Other" Responses Across Tests: Training Talkers Figure 12
PRE-TEST
POST-TEST
0%
10%
20%
30%
40%
50%
60%
70%
80%
90%
100%
FUSION COMBINATION NEITHER
% R
esp
on
se
"Other" Responses Across Tests: Testing Talkers
Figure 13
PRE-TEST
POST-TEST