audience research powerpoint
TRANSCRIPT

Audience Research
Analysis

Q1. How old are you?
We have included this question in our questionnaire as
we wanted to find out the age range of our audience
that will watch our documentary so we can make is
suitable for them. This pie chart shows that the most
popular age range was under 18 which is 38.18% and
the second most popular age range was 36-45 years old
which is 20% of the people that filled in the
questionnaire. This tells us that these are the age ranges
that are interested the most in pets and would be
interested in watching a documentary about pets. This
means that we will have to aim our documentary at a
broad audience.
Q2. What is your gender?
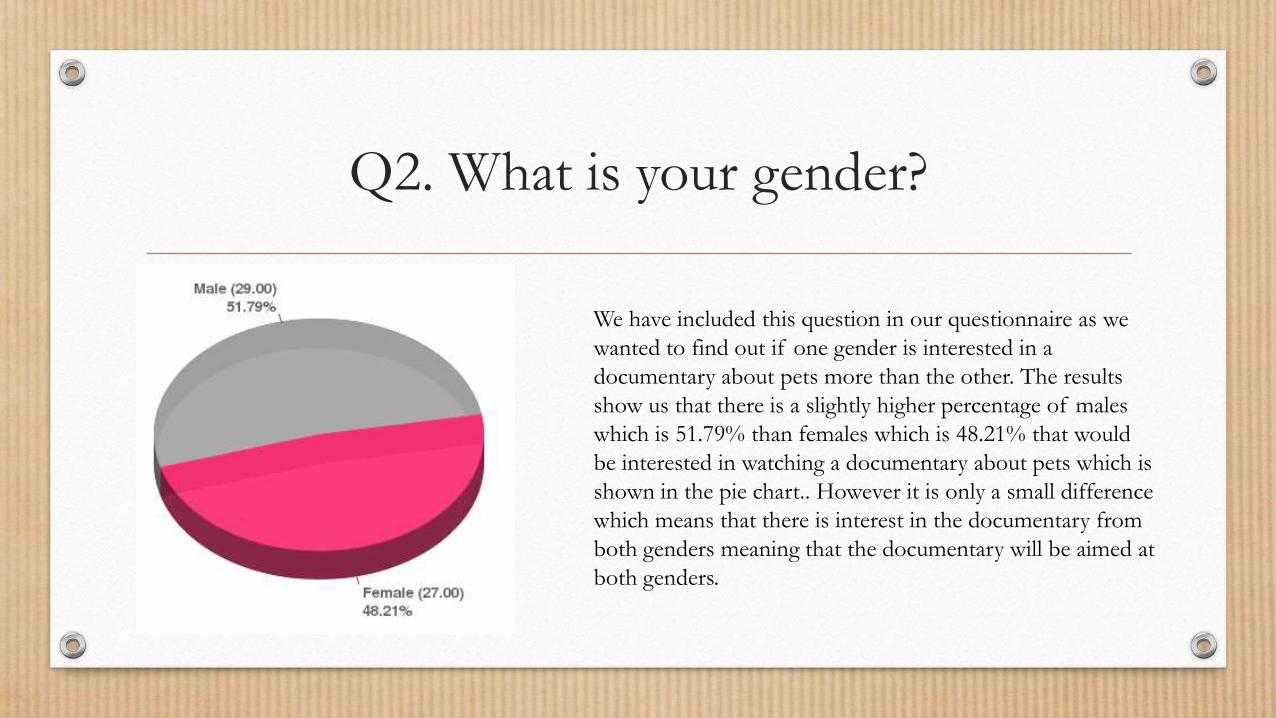
We have included this question in our questionnaire as we
wanted to find out if one gender is interested in a
documentary about pets more than the other. The results
show us that there is a slightly higher percentage of males
which is 51.79% than females which is 48.21% that would
be interested in watching a documentary about pets which is
shown in the pie chart.. However it is only a small difference
which means that there is interest in the documentary from
both genders meaning that the documentary will be aimed at
both genders.

Q3. How regularly do you watch
documentaries?
We have chosen to include this question in our
questionnaire as we wanted to find out how often people
in our target audience watch documentaries. This will
help us with planning the scheduling of our
documentary. Most of the people that have answered
our questionnaire have said that the watch
documentaries more than once a week which is 26.79%
however the second most popular answer was fortnightly
which was 25% and shown on the pie chart. This means
that the best time to schedule our documentary would be
once a week as it is in between the two most popular
answers.
Q4. What types of documentaries are you
interested in?
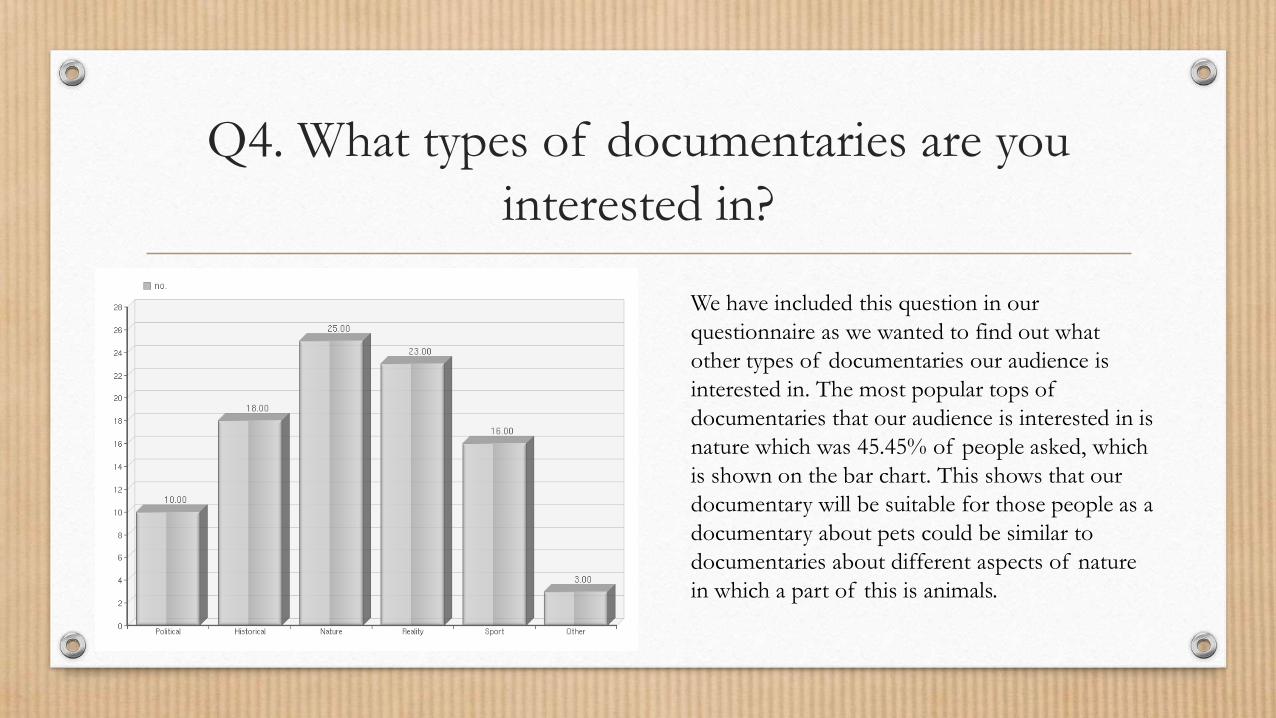
We have included this question in our
questionnaire as we wanted to find out what
other types of documentaries our audience is
interested in. The most popular tops of
documentaries that our audience is interested in is
nature which was 45.45% of people asked, which
is shown on the bar chart. This shows that our
documentary will be suitable for those people as a
documentary about pets could be similar to
documentaries about different aspects of nature
in which a part of this is animals.

Q5. What features do you like in a
documentary?
We have chosen to include this question in our
questionnaire as the answers will help us decide on
the features to include in our documentary that
would appeal to them. The graphs shows that the
most popular feature in a documentary that they
like was interviews which was 54.55% of people.
However 45.45% of people have said that the
feature that they like the most is archive footage.
This will help us with the planning of content of
our documentary as we will know to include lots of
interviews and archive footage to appeal to our
audience.

Q6. What time of the day do you most watch
TV?
We have included this question in our questionnaire
as we wanted to find out what time of the day the
majority of our target audience watches TV which
will help us with deciding the scheduling of our
documentary. The majority of our audience which
was 59.26% have said that the time that they watch
TV the most is in the evening. This means that we
will schedule our documentary in the evening time
so that it would be suitable for our target audience
and convenient for them to watch.

Q7. What channels do you predominantly
watch?
We have included this question in our
questionnaire as we wanted to find out which
channel is the most popular within our target
audience. The graph shows us that the most
popular channel is ITV which 72.73% people
have chosen and the second most popular was
BBC1 which was chosen by 43.64% of people.
This means that our documentary will most likely
be aired on ITV as it will be suitable for our target
audience.

Q8. What is your favourite colour?
We have chosen to include this question as the
results will then help us to decide on an
appropriate colour scheme for our documentary
that will appeal to our target audience. The pie
chart shows that the majority of the people have
said that their favourite colour was blue which was
25%. The second most popular favourite colour
was red which was chosen by 23.21% of people.
This shows us that if we incorporated these
colours in our colour scheme it would appeal to
our audience. The table on the side shows some
of the other colours that people have written
down in the other section.

Q9. What is your favourite type of music?
We have included this question to help us
to decide on the genre of music to play as
the background in our documentary. The
pie chart shows that the most popular
genre of music that our audience listens to
is pop which was chosen by 41.82% of
people. This means that the background
music for our documentary will be a pop
song that is suitable for the topic of our
documentary and will also appeal to our audience. The table on the
side shows the answers that have been picked for the other
category.

Q10. Why do you think people have pets?
We have chosen to include this question in our
questionnaire as we wanted to find out the reason
why people have pets to help us with deciding
with the content of our documentary. The
majority of people which is 89.9% of people
have said that they think people have pets for
company. And 40% of people have said for
entertainment which was the second most
popular answer. This gives us an idea of what
people think why other people have pets which
will help us with deciding on topic ideas in our
documentary.

Q11. Do you have a pet?
We have included this question in our
questionnaire as we wanted to find out how many
people in our target audience actually have pets
themselves. The majority of people in our target
audience have said that they do have a pet which
was 92.73% and only 7.27% of people have said
that they do not have a pet which is shown in the
pie chart. This shows us that people in our target
are interested in a documentary about pets as they
have a pet themselves which might be their
interest.
Q12. If so what pet do you have?
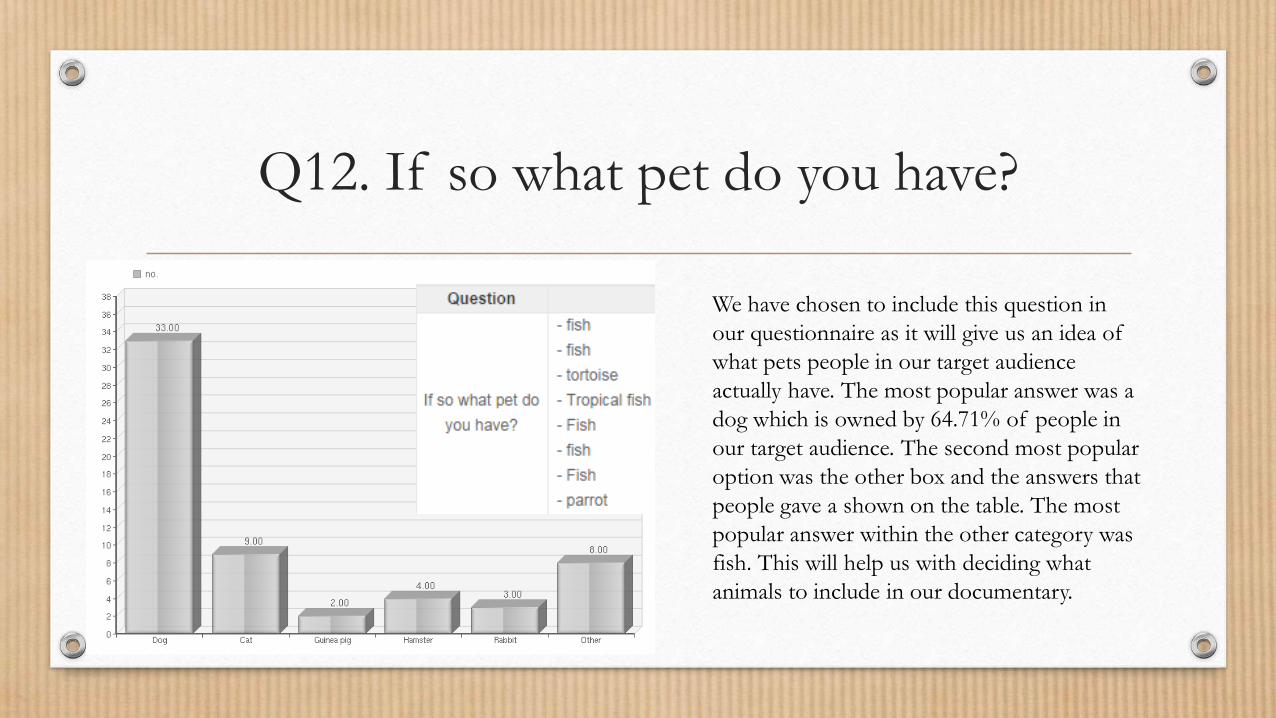
We have chosen to include this question in
our questionnaire as it will give us an idea of
what pets people in our target audience
actually have. The most popular answer was a
dog which is owned by 64.71% of people in
our target audience. The second most popular
option was the other box and the answers that
people gave a shown on the table. The most
popular answer within the other category was
fish. This will help us with deciding what
animals to include in our documentary.
Q13. Why did you choose this pet?
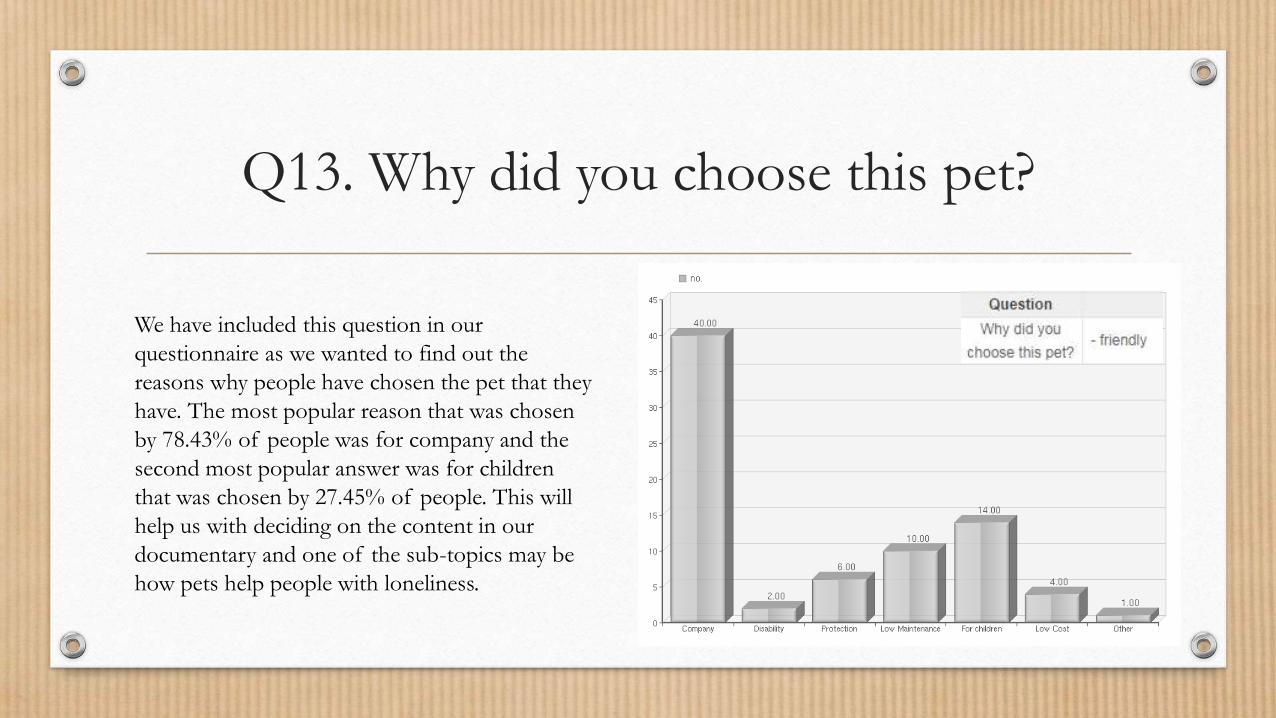
We have included this question in our
questionnaire as we wanted to find out the
reasons why people have chosen the pet that they
have. The most popular reason that was chosen
by 78.43% of people was for company and the
second most popular answer was for children
that was chosen by 27.45% of people. This will
help us with deciding on the content in our
documentary and one of the sub-topics may be
how pets help people with loneliness.

Q14. What do you like about your pet?
We have chosen to include this question in our
questionnaire as we wanted to find out what
people like about their pets. 56.86% of people
have said that the thing that they like about
their pet the most is companionship, and
43.14% of people have said that they find their
pet funny which means that their pet provides
entertainment. This again will help us with
deciding on the content in our documentary.
Some other answers are shown in the table and
on the bar chart.

Q15. How many pets do you currently have?
We have included this question in our
questionnaire as we wanted to find out
how many pets on average people have.
68.52% of people have said that they
only have one pet, and the second most
popular response was 2 which was
chosen by 11.11% of people. This
shows that on average most people that
own a pet only own one or two pets at
the most.
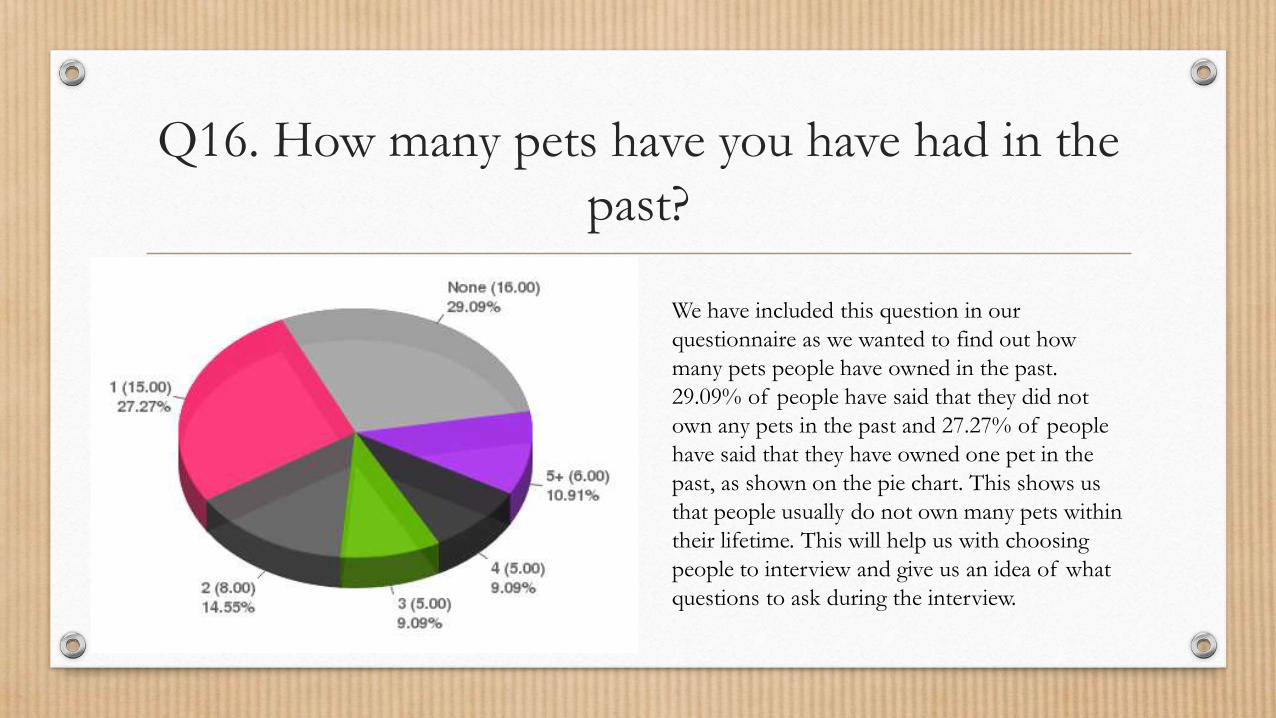
Q16. How many pets have you have had in the
past?
We have included this question in our
questionnaire as we wanted to find out how
many pets people have owned in the past.
29.09% of people have said that they did not
own any pets in the past and 27.27% of people
have said that they have owned one pet in the
past, as shown on the pie chart. This shows us
that people usually do not own many pets within
their lifetime. This will help us with choosing
people to interview and give us an idea of what
questions to ask during the interview.

Q17. Do you have any exotic pets?
We have chosen to include this question in
our questionnaire as we wanted to find out
if any people within our target audience
actually own any exotic pets. 90.91% of
people with in our target audience have
said that they do not own an exotic pet,
however 9.09% of people have said that
they do own an exotic pet, as shown on the
pie chart. This will help us with deciding
what content to include in our
documentary.

Q18. If so what exotic pet do you have?
We have included this question in our
questionnaire are we wanted to find out what
exotic pets people actually have the most popular
answer was a Lizard as 11.11% of people have
said that they have one. Most of the answers in
the other category said that people don’t have an
exotic animal so the question was not applicable
for them. The results from this question will help
us with deciding on what exotic animals to
include in our documentary as people that own
exotic animals would be interested in seeing them
in documentary.

Q19. How much money do you spend on your
pet in a month?
We have included this question in our
questionnaire as we wanted to find out how
much money people spend on their pets. 40%
of people have said that they spend £16-25 a
month on their pet, and 26% of people have
said that they spend £6-15 a month which was
the second most popular option. This shows
that different people spend different amount
of money on their pet and that different pets
may require more money to look after. This
will help us with deciding on the content for
our documentary.

Q20. Where did you get your pet from?
We have chosen to include this question in our
questionnaire as we wanted to find out where do
people get their pets from. The most popular
answer was from the Breeder which was picked
by 36% of people and the second most popular
answer was a Pet Shop which was picked by 30%
of people. This will help us with deciding on who
to interview in our documentary and the
relevance they will have in our documentary, that
will appeal to our audience. The small table on
the side shows what people have answered in the
other category.
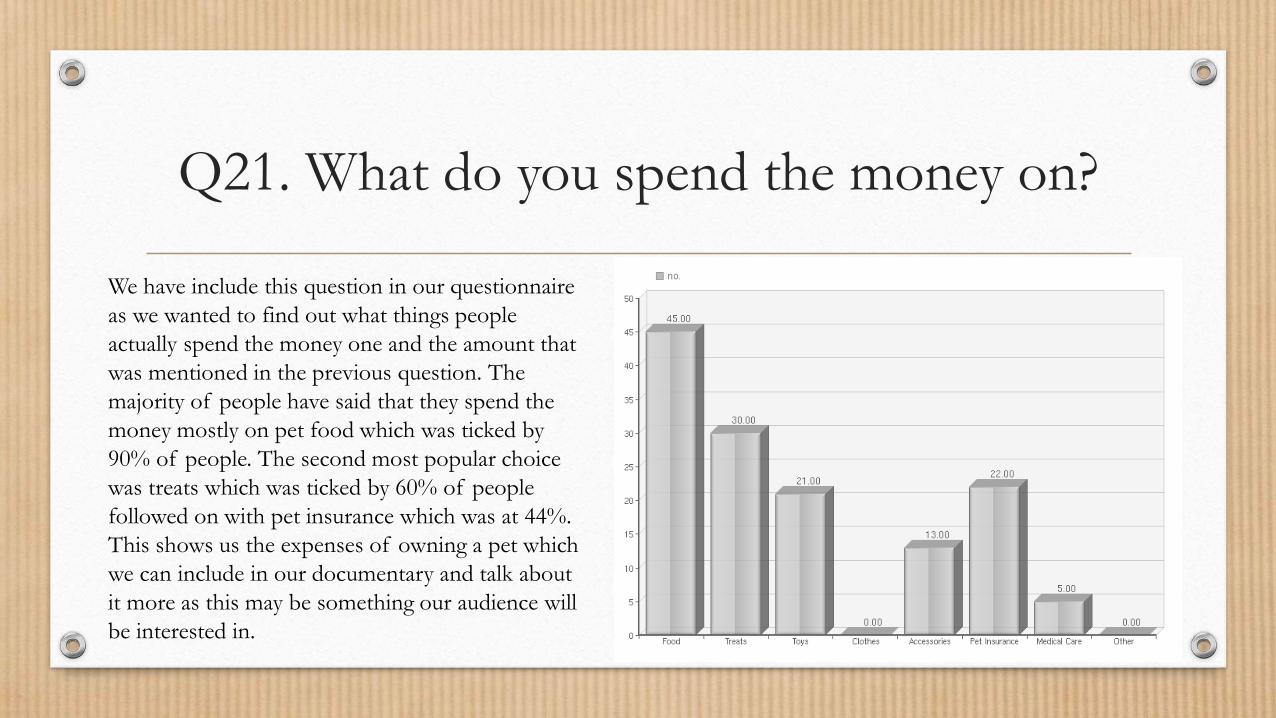
Q21. What do you spend the money on?
We have include this question in our questionnaire
as we wanted to find out what things people
actually spend the money one and the amount that
was mentioned in the previous question. The
majority of people have said that they spend the
money mostly on pet food which was ticked by
90% of people. The second most popular choice
was treats which was ticked by 60% of people
followed on with pet insurance which was at 44%.
This shows us the expenses of owning a pet which
we can include in our documentary and talk about
it more as this may be something our audience will
be interested in.
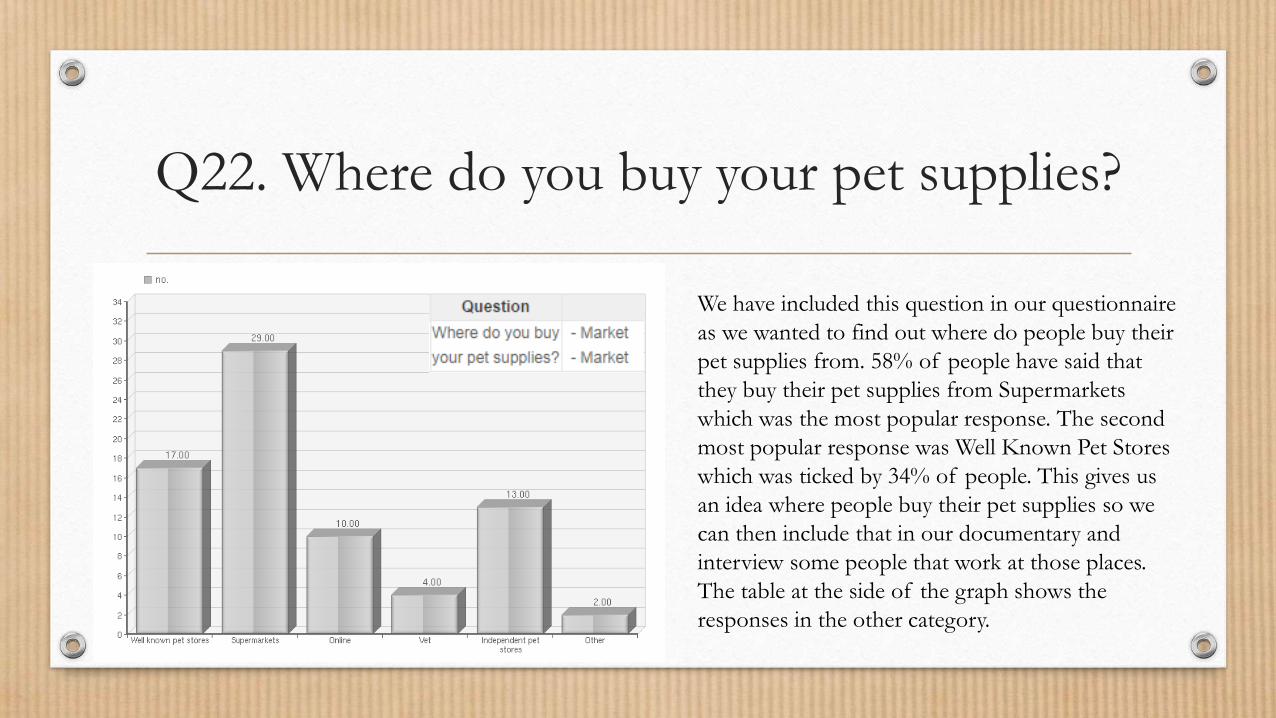
Q22. Where do you buy your pet supplies?
We have included this question in our questionnaire
as we wanted to find out where do people buy their
pet supplies from. 58% of people have said that
they buy their pet supplies from Supermarkets
which was the most popular response. The second
most popular response was Well Known Pet Stores
which was ticked by 34% of people. This gives us
an idea where people buy their pet supplies so we
can then include that in our documentary and
interview some people that work at those places.
The table at the side of the graph shows the
responses in the other category.

Q23. If you could have any pet
what would it be?
We have chosen to include this question in our
questionnaire as we wanted to find out what pets
would people actually have if they could have a
choice of having any pet in the world. The
responses are shown in the table. The responses
from this question will help us to decide what other
animals to include in our documentary that people
from our target audience will be interested in
seeing.

Q24. What would you like to see in a
documentary about pets?
We have chosen to include this as the last question in
our questionnaire as we wanted to find out what
people in our target audience would actually be
interested in seeing. 39.63% of people have said that
they would be interested in seeing How Pets are
Treated which was the most popular response
followed by domestic pets at 35.85%, Breeding at
33.96% and exotic pets at 30.19%. All the responses
were close in terms of people wanting to see it in a
documentary, so we are going to try to incorporate
all of it as much as we can so that the documentary
will appeal to our target audience.