audience research mysteries of the mind appendix
TRANSCRIPT
Appendix 6: Audience Research 1
Appendix 6
Audience Research
MA Museum Studies ARCLG 191: Exhibition Project 9th May 2016

Appendix 6: Audience Research 2
Table of Contents
1. Executive summary
1.1. Introduction
1.2. The purpose of evaluation
1.3. Context for the evaluation project and its target audience
1.4. Methodology
1.5. Summary of evaluation findings and project outcomes
2. Evaluation table
3. Learning theory, communication messages and learning outcomes
3.1 Executive summary
3.2 Crafting communication messages and learning outcomes
3.3 Implementing the theories, messages, and outcomes
3.4 Tools
4. Baseline Evaluation I
4.1. Executive summary
4.2. Methodology
4.3. Findings
4.4. Tools
5. Baseline Evaluation II
5.1. Executive summary
5.2. Methodology
5.3. Findings
5.4. Tools
6. Front-end Evaluation I
6.1. Executive summary
6.2. Methodology
6.3. Findings
6.4. Tools
7. Front-end Evaluation II
7.1. Executive summary
7.2. Methodology
7.3. Findings
7.4. Tools
8. Front-end Evaluation III
Appendix 6: Audience Research 3
8.1. Executive summary
8.2. Methodology
8.3. Findings
8.4. Tools
9. Front-end Evaluation IV
9.1. Executive summary
9.2. Methodology
9.3. Findings
9.4. Tools
10. Formative Evaluation I
10.1. Executive summary
10.2. Methodology
10.3. Findings
10.4. Tools
11. Front-end V
11.1. Executive summary
11.2. Methodology
11.3. Findings
11.4. Tools
12. Formative Evaluation II
12.1. Executive summary
12.2. Methodology
12.3. Findings
12.4. Tools
13. Formative Evaluation III
13.1. Executive summary
13.2. Methodology
13.3. Findings
13.4. Tools
14. Summative Evaluation I
14.1. Executive summary
14.2. Methodology
14.3. Findings
14.4. Tools

Appendix 6: Audience Research 4
1. Executive Summary
1.1. Introduction
Audience Research was continually utilised by the Exhibition Project Team
throughout the entire project for key audience-centred exhibition elements including:
evaluations, communication and learning theories, communication messages and
learning outcomes. The Audience Research Team worked collaboratively with the
other teams to present Collections, Content, Design, Digital and Late Event material
to the exhibition’s target audience for feedback. Evaluation findings and
recommendations were presented in reports and presentations that influenced the
Exhibition Team’s decisions when developing Mysteries of the Mind. Evaluations
were conducted between December 2015 and April 2016 to collect adequate visitor
information to inform the team’s recommendations.
1.2. The Purpose of Evaluation
The Audience Research Team engages with the target audience (see 1.3) and acts
as their representative throughout the development process. The aim of the team is
to continually provide the Exhibition Team with information and feedback to develop
an exhibition and Late Event catered to the needs of the exhibition’s target audience.
The baseline evaluation plan focused on the Leventis Gallery’s current visitor
patterns and the target audience. The front-end evaluations aimed to gather
audience prior knowledge, interest and preferences for the proposed exhibition. The
formative evaluation plan was designed to improve upon the developing exhibition
elements through audience feedback. The summative evaluation sought to assess
visitor satisfaction with the completed elements.
1.3. Context for the Evaluation Project and its Target Audience
The UCL MA Museum Studies Exhibition Project comprised two components: the re-
design of the temporary exhibition area of the Leventis Gallery within the Institute of
Archaeology and the development of a late event activity at one of the Science
Museum Lates. All members of the team participate in the execution of both project
elements.

Appendix 6: Audience Research 5
The temporary exhibition space provided to the students includes two cases for
object and label display, four light boxes for text or image presentation, two iPads
and one totem to include digital interactive elements. As per the original IoA project
brief, the theme of this exhibition project is ‘tools and the human mind’.
The Science Museum Late Event involves the design and conduction of an activity
related to the topic of the Late Event. The Science Museum provides assistance,
materials and space within the event for the activity. The title of this year’s Late Event
was Lost in Thought.
The target audiences for this project are:
● Students/staff from the Institute of Archaeology (IoA) at UCL
● Students/staff from other UCL departments
● Residents of the Bloomsbury area
● Non-specialist adults/young professionals (Late Event)
1.4. Methodology
The Exhibition Project’s use of social constructivism as the learning theory influenced
the decision to utilise a primarily qualitative evaluation method. Social constructivism
places social interaction at the centre of cognitive progress1. Prior knowledge informs
individual ‘sense-making’; however, the language of that prior knowledge is socially
constructed and filters new information when learning.2 By understanding and using
potential visitors’ language regarding the mind and the brain, the exhibition can
scaffold visitor learning to a higher degree.
Qualitative evaluation methods provided the team with a depth of data via open-
ended questions highlighting the participants’ own language use over the language of
this evaluation team or the exhibition.3 Qualitative data were supplemented with
quantitative data in order to provide the Exhibition Project team with the scale of the
findings.
1 Vygotsky, L. (1978) Mind in Society: The Development of Higher Psychological Processes.
Cambridge, MA: Harvard University Press. 2 Oldfather, P., J. West, J. White and J. Wilmarth (1999) Learning Through Children’s Eyes:
Social Constructivism and the Desire to Learn. American Psychological Association. 3 Diamond, J. (1999) Practical Evaluation Guide: Tools for Museums & Other Informal
Educational Settings. 2nd Ed. Lanham, Md.: AltaMira Press. p. 23.

Appendix 6: Audience Research 6
For the baseline evaluations, interviews and observations were utilised to gather
information on the prior knowledge, preferences and visiting patterns of potential
visitors. The front-end evaluation plan involved face-to-face interviews,
questionnaires and a poll; it aimed to inform the Exhibition Project Team’s decisions
by further investigating participants’ prior knowledge, language, preferences and
attitudes on the potential exhibition topic through. The focus of the formative
evaluations was participants’ social interaction, preferences, language and attitudes
to improve upon the proposed exhibition elements; face-to-face interviews, a mock-
up, and a focus group were implemented. Social interaction and visitor enjoyment
were identified as the key elements of the summative evaluation, evaluated through a
questionnaire and visitor observations.4
The data from these evaluations were analysed by identifying trends and patterns
through graphs, highlighting notable outliers, and coding the information based on
criteria unique to each evaluation. The findings were presented to the group in the
form of evaluation reports and presentations and subsequently pertinent teams were
informed the results and recommendations were uploaded to Trello for easy
reference.
2. Evaluation table
Evaluation Team(s) Focus Method Conducted
Baseline I Exhibition
Project Identifying gallery
use, types of visitor
behaviour and
target audience.
Observations;
visitor and non-
visitor
interviews
11-17th
December
2015
Baseline II Exhibition
Project Identifying patterns
of gallery use to
craft an evaluation
plan.
Leventis
Gallery visitor
scan-sampling
25-29th
January 2016
Front-end I Content Exhibition topics:
‘the brain’ and
‘mental illness’
Personal
meaning
mapping
16th
February
2016 and 8
March 2016
4 All tools and generated charts were created in US English, the evaluators’ native or learned
version of English.

Appendix 6: Audience Research 7
Front-end II Content Exhibition title Questionnaire 4th-5th
March 2016
Front-end III Design Colour scheme and
font Interviews 7th-8th
March 2016
Front-end IV Digital QR code use Online poll 6th-8th
March 2016
Formative I Collections
and Design Display of biological
specimen and
colour scheme
Interview 15th March
2016
Front-end V Content
and Late
Event
Exhibition title and
Late Event titles,
interest and prior
knowledge
Questionnaire 16th March
2016
Formative II Design,
Content,
Collections
and Digital
Display layout and
clarity Mock-up 4th April
2016
Formative III Digital Totem content Focus group 14th and
15th April
2016
Summative I Late Event Visitor enjoyment
and engagement Questionnaire
and
observations
27th April
2016
3. Learning Theory, Communication Messages and Learning Outcomes
3.1. Executive Summary
After the first panel meeting, the Audience Research Team took responsibility
of the exhibition’s learning and communication theories. After the third panel
meeting, the team included writing and editing communication messages and
learning outcomes in their responsibilities.
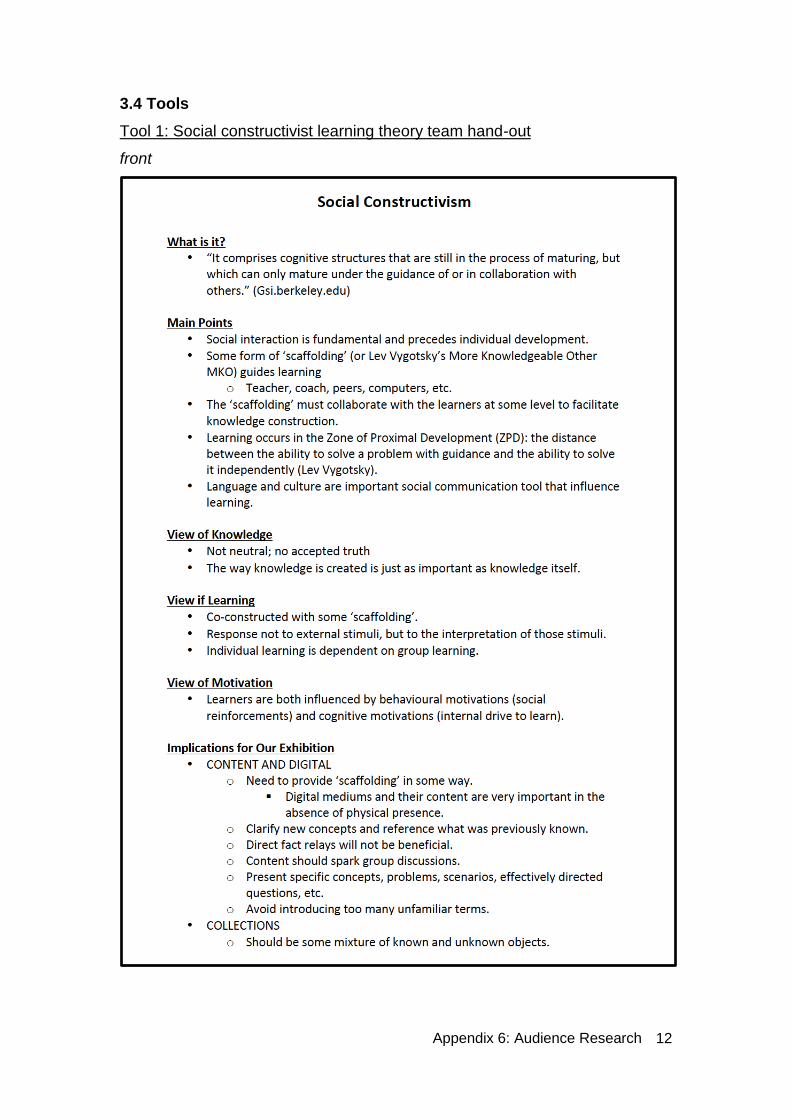
During reading week, the Audience Evaluation Team researched social
constructivism and developed a handout given to the entire team (see 3.4,

Appendix 6: Audience Research 8
Tool 1). It included the basic elements of the theory as well as detailed
suggestions for each area of the Exhibition Project.
The communication and learning theories adhered to in this project are
cultural-dialogic and social constructivism. The cultural-dialogic
communication theory posits that meaning is created through discussion,
between individuals and a scaffold, and is rooted in cultural knowledge.
Learning, within social constructivism, occurs through social interaction, is
filtered through individual prior knowledge, and is facilitated by a More
Knowledgeable Other (MKO).
The Audience Research Team collaborated continually with all other sub-
teams to provide guidance in understanding the communication and learning
theories, developing communication messages and learning outcomes, and
implementing those messages and outcomes into the exhibition development.
3.2. Crafting Communication Messages and Learning Outcomes
The Audience Research Team took over the writing of communication
messages and learning outcomes in order to lighten the Content Team’s
workload and ensure they were written with the target audience in mind.
The communication messages and learning outcomes were continually
updated throughout the development process in order to reflect the
exhibition’s progress and the refinement of the exhibition concept and display.
The messages and outcomes would be presented to the Exhibition Project
Team for feedback, before being subjected to a final edit by the Audience
Research Team and re-distributed to the entire project via Trello.
The Audience Research Team conducted a Learning Outcomes Writing
Workshop on 30th March in which the basic guidelines for crafting learning
outcomes were presented and examples of both effective and ineffective

Appendix 6: Audience Research 9
learning outcomes were provided. Afterwards, the Audience Research Team
representatives structured and facilitated a brainstorming session to rewrite
the Exhibition Project’s learning outcomes. Present at the workshop were
representatives from the Content Team, representatives from Project
Management and the Digital Team (see 3.4, Tool 2).
The Audience Research Team then made the PowerPoint available to the
entire Exhibition Project Team via Trello and liaised individually with the Late
Event Team in order to write their specific communication messages and
learning outcomes (see 3.4, Tool 3).
3.3 Implementing the Theories, Messages and Outcomes
The Audience Research Team collaborated with other teams in order to
ensure the exhibition elements reflected the appropriate theories, messages
and outcomes, especially after evaluations in order to ensure the
implementation of the evaluation findings within the framework of the cultural-
dialogic communication theory and the social constructivist learning theory.
Using the findings of Formative Evaluation II, a representative of the Audience
Research Team aided the Digital Team in writing interview questions for iPad
content.
After Formative Evaluation III, a representative also aided in developing the
optical illusion totem content, provided feedback from the focus group, and
reviewed the final text to help align the content to the learning theory. An
Audience Research Team representative also provided editing and feedback
for the iPad quiz to ensure it followed the social constructivist learning theory.
Throughout the course of the project, the team wrote and edited object
communication messages in collaboration with the Collections Team. After
Appendix 6: Audience Research 10
the mock-up evaluation, a representative from the team edited and revised
Content labels from the point of view of the target audience and
recommendations from Formative Evaluation II in a collaborative workshop
with Content, a representative from Late Event Team and a representative
from Project Management.
Following the fourth panel meeting, the Design Team had requested
additional help understanding and implementing theories, messages and
outcomes in certain design elements of the exhibition. A document was
created detailing suggestions for each component of the exhibition in
accordance with the theories, messages, outcomes, as well as evaluation
results (see 3.4, Tool 4).
Additionally, the Digital Team had a conceptual change regarding iPad 1 and
the panel suggested swapping the content of iPad 1 for iPad 2. To help the
team make this decision, a map of the gallery was created displaying the
distribution of the learning outcomes (see 3.4, Tool 5). According to the
distribution of the neuroscience heavy Enjoyment, Inspiration and Creativity
outcomes and the Knowledge and Understanding outcomes, the gallery would
be more balanced by placing the iPad with the interviews near Case 2 and the
iPad with the quiz near Charlotte's office. The quiz would balance out the
three light boxes, and the interviews would provide a different but
complementary perspective on the display on the other side of the gallery.
It was decided by the Exhibition Project Team that it would be beneficial to
provide audience accessibility guides for the exhibition, and the Audience
Evaluation Team volunteered to format the text. Since the Leventis Gallery
occasionally received visitors older than 50 who are more likely to have visual
impairments, a large print guide was made using Helvetica font in black on a
white background, with a minimum size of 16 pt. Font as per the guidelines
set out by Action for Blind People (see 3.4, Tool 6 and 8).

Appendix 6: Audience Research 11
Since Baseline Evaluation I demonstrated that most of the gallery’s visitors
are UCL affiliated students 18-25 and an individual with dyslexia participated
in Formative II, a second dyslexia friendly guide was made using a specially
designed font5 and the guidelines set out by the British Dyslexia Association
(see 3.4, Tool 7 and 8). Studies show that 2.6 to 4% of Higher Education
students in the UK have dyslexia.6
The Audience Research Team became aware that Lisa Daniel, the Graduate
Programmes Administrator, had recently attended a conference about
academic staff with dyslexia or other neuro-diverse conditions. A consultation
with Lisa revealed that a large number of archaeologists have dyslexia; 5
members of staff and about 30 students within the IoA have dyslexia. Lisa
suggested having two copies of dyslexia friendly guides in the gallery;
however, since she also indicated that many individuals with dyslexia are
accustomed to using large print guides in galleries, we decided that the large
print guide could double as a dyslexia friendly guide if needed.
The interview subtitles and the totem digital elements were included in both
guides; the quiz content was not included as we could not recreate the quiz
content adequately. The Audience Team also could not find any examples of
instances where museums or galleries provided the text content of interactive
screens.
Due to last minute changes, the Audience Research Team problem solved
the addition of another object and contextual image into the guides (see 3.4,
Tool 9).
5 Anon (2016) OpenDyslexic. [Online]. 2016. OpenDyslexic. Available from: http://opendyslexic.org/
[Accessed: 22 April 2016]. 6 Anon (n.d.) Dyslexia in Higher Education. [Online]. Supporting Students with Dyslexia. Available from:
http://www2.le.ac.uk/offices/accessability/staff/supporting-students-with-dyslexia/dyslexia_guidelines/dyslexia_he [Accessed: 22 April 2016].
Appendix 6: Audience Research 12
3.4 Tools
Tool 1: Social constructivist learning theory team hand-out
front

Appendix 6: Audience Research 13
Reverse

Appendix 6: Audience Research 14
Tool 2: Writing communication messages and learning outcomes workshop

Appendix 6: Audience Research 15
Tool 3: Late Event communication messages and learning outcomes
Front

Appendix 6: Audience Research 16
Reverse

Appendix 6: Audience Research 17
Tool 4: Suggestions to the Design Team
Page 1

Appendix 6: Audience Research 18
Page 2

Appendix 6: Audience Research 19
Page 3

Appendix 6: Audience Research 20
Tool 5: Learning outcome exhibition distribution

Appendix 6: Audience Research 21
Tool 6: First page of large print guide

Appendix 6: Audience Research 22
Tool 7: First page of dyslexia friendly guide

Appendix 6: Audience Research 23
Tool 8: Printed accessibility guides
Tool 9: Additions to the accessibility guide

Appendix 6: Audience Research 24
4. Baseline Evaluation I
4.1. Executive Summary
This evaluation aimed to compile preliminary data on visitor and non-visitor
general knowledge of the Leventis Gallery, interest in the exploratory
exhibition topic, as well as how the space is currently used to inform exhibition
development.
The evaluation had a total of 139 participants (66 observations groups, 33
visitor interviews and 40 non-visitor interviews). 66 groups were observed in
the gallery, 43 of which were alone and 49 were 18-25. 25 of the 33 interview
participants were students, who visit the building for studying, younger than
25 years old.
Findings
● The average visitors to the Leventis Gallery are young students who visit
the space frequently for UCL-related purposes, but not with intentions of
seeing the exhibitions.
● Visitors have largely seen at least one exhibition, but do not engage in-
depth.
● Large crowds gather during the classroom changes nearby G6.
● The space is primarily used as a corridor to IoA facilities.
● The general consensus is that there is poor distinction between the
permanent and temporary exhibitions.
● There is confusion over the content of We Need to Talk.
● The gallery is used primarily during IoA advertised opening hours (9am-
5pm Monday-Friday).
● Signage within and to the space has not been effective in getting visitors in
or engaging them with the exhibition.
● The brightest and most colourful object (the board game) received the
most attention.

Appendix 6: Audience Research 25
Recommendations
Content
● Include the development or progression of tools through a timeline;
including both stone and modern tools.
● Include objects relating to psychology, science or medicine.
● Connect the exhibition with the courses scheduled for lectures in room
G6.
Signage and display
● Signage should be simple and eye-catching to attract the interest of the
‘window shopper’ visitor and turn them into a ‘serious shopper’.
● Signage should be focused in and near the lobby as well as externally
to direct visitors into the exhibition space.
● A clear visual division between the two exhibitions should be
implemented.
● Include signage directing visitors to the iPads, totem and gallery map.
● The introductory text should clearly explain the exhibition.
● There should be less text in the object display cases with a clear visual
hierarchy of information.
Public relations
● Circulate and post material relating to the exhibition around
Bloomsbury, specifically the UCL campus to reach non-IoA students.
● Secure an inclusion in a UCL or University of London student email or
social media platform.
● Cross advertise with the Petrie or other UCL museums.
Use of space
● Account for large numbers of visitors merely walking through the
gallery.
● Account for large numbers of students waiting in front of the exhibition
cases for student-related purposes.
● Use Saturdays as opportunities for special events in the gallery.
● Both content and signage should be designed in a way to easily
engage visitors in the ways they already use the space (as a waiting,
studying and social area).

Appendix 6: Audience Research 26
4.2. Methodology
The evaluation consisted of face-to-face interviews of visitors and non-visitors
as well as focal individual visitor observations. The data were collected
between 11 and 17 December 2015. The visitor interviews were conducted
within the Leventis Gallery; non-visitor interviews were conducted in 7 various
locations surrounding the IoA in Bloomsbury. The visitor observations were
conducted within the Leventis Gallery at different times throughout the week,
according to evaluators’ availabilities.
Date Evaluator Group Time
11/12/15 Group 1 3:25-4:25pm
12/12/15 Group 1 2-3pm
12/12/15 Group 2 12-1pm
14/12/15 Group 1 11:30am-12:30pm
14/12/15 Group 2 1-2pm
14/12/15 Group 2 5-6pm
14/12/15 Group 2 6-7pm
15/12/15 Group 1 10:39-11:39am
16/12/15 Group 2 1-2pm
17/12/15 Group 1 11:45am-12:45pm
Interview questions were predetermined, maintaining consistency across
interviews. The questionnaire utilised a mix of open and closed questions (see
4.4, Tools 5 and 6). Participants were randomly selected as they entered the
Leventis Gallery or around Bloomsbury; individual evaluators determined his
or her own recruitment process. Evaluators observed either every person who

Appendix 6: Audience Research 27
entered the gallery space or every third (depending on visitor numbers at the
time). Observations were recorded on a map of the gallery (see 4.4, Tools 1
and 2).
Both interview and observation evaluators input their data into a spreadsheet
for individual statistical and qualitative analysis; recurring themes and
significant outliers were noted.
This method allows the evaluators to get both quantitative and qualitative data
from the project’s target audience. All three tools were first piloted. The visitor
and non-visitor tools were used unaltered. Observation group 1 altered the
tool in order to simplify the recording of data (see 4.4, Tool 3). Observation
group 2 created a tool in order to define the areas of the gallery space and
created a set of agreed upon tools for coding the data (see 4.4, Tool 4).
Evaluation questions
Observations
● Who uses the foyer space on the ground floor of the Institute?
● How is the space used?
● Are there different patterns of use at different times and dates?
● How long do people stay in the area?
● Are there any distinct modes of engagement in the exhibition space?
Visitor interviews
● Who uses the foyer space on the ground floor of the Institute?
● Why do people use the area?
● Do people realise that there are two different exhibitions in this area?
● What do people think We Need to Talk: Connecting through
Technology exhibition is about?
● What would visitors like to see in a future exhibition on tools and the
human mind?
Non-visitor interviews
● Do people in the local area (including passers-by, people who live
and/or work in the area, UCL students and staff) know of the IoA?

Appendix 6: Audience Research 28
○ If so, do they know where it is located?
○ How did they find out about it?
● Do people in the local area (including passers-by, people who live
and/or work in the area, UCL students and staff) know that the IoA is
part of UCL?
● Have they ever been there?
○ If yes, when/why/what for?
○ If no, why not?
○ What do they think they might find there (activities people carry
out in the building)?
● Specifically, are people in the local area aware of the exhibition space
on the ground floor of IoA?
○ If yes, have they ever been?
○ What did they do/see there?
● Would they like to visit the exhibitions? What type (or theme) of
exhibition would they like to see? And how does it relate to their
interests?
Research
Questions
Observations Visitor Interviews Non-visitor
Interviews
Dwell times ✓
Patterns of use ✓ ✓ ✓
Awareness of the
space/building
✓ ✓
Engagement with
exhibition space
✓ ✓
Interest in visiting
the exhibition
space
✓ ✓

Appendix 6: Audience Research 29
Interest in
upcoming
exhibition theme
✓ ✓
4.3. Findings
Observations
Audience use of space
The gallery is most often used as a corridor: 39 of the 66 visitors walked
through the space, entering through one door and leaving by another. Other
notable actions include sitting—on the benches (6 groups) or at the table (5
groups), meeting with or waiting for Charlotte Frearson (11 groups), whose
office is located off of the gallery and waiting for or access to the G6 lecture
hall (6 groups). People also use the space to eat (4 groups), take phone calls
(3 individuals) and do work (3 individuals).
A vast majority of the visitors entered and exited from the lobby, and the stairs
were a secondary avenue of exit (Figure 1). Since the G6 lecture hall is a
dead end room, anyone entering or exiting from that room was there for a
class or lecture.

Appendix 6: Audience Research 30
Figure 1: Visitor entrances and exits.
Audience dwell time
Average time spent in the space was 5 minutes (Figure 2). However, this data
is skewed since 34 out of 66 observed groups spent less than a minute in the
space, while a few outliers spent significantly longer.
Figure 2: Dwell time.

Appendix 6: Audience Research 31
Additionally, time spent in the space is not a sufficient indicator of level of
visitor engagement with the exhibitions. One individual spent 40 minutes in
the space, but only 30 seconds looking at the exhibition.
Audience engagement with exhibitions
18 visitors interacted with the exhibition in some way. Of those, 8 merely
glanced at the cases, not engaging with the display. 5 interacted with the
digital exhibits, but not for more than one minute. 1 discussed confusion over
the subject of the exhibition, indicating lack of adequate introductory panel. 2
groups discussed the Nokia phone; one individual took a photo of the display.
2 groups looked specifically at the board game.
Visitor interviews
Audience visiting history and clarity of space
All visitors had visited the Leventis Gallery before. More than half (19 people)
of them come to the gallery more than once per week, while nearly 1/3
interviewees (11 people) visit here weekly. Only 3 people are infrequent
visitors.
28 people have seen at least one exhibition in this gallery. More than half of
them (15 people) only glanced it instead of looking in detail. 21 people could
not distinguish the two exhibitions clearly.
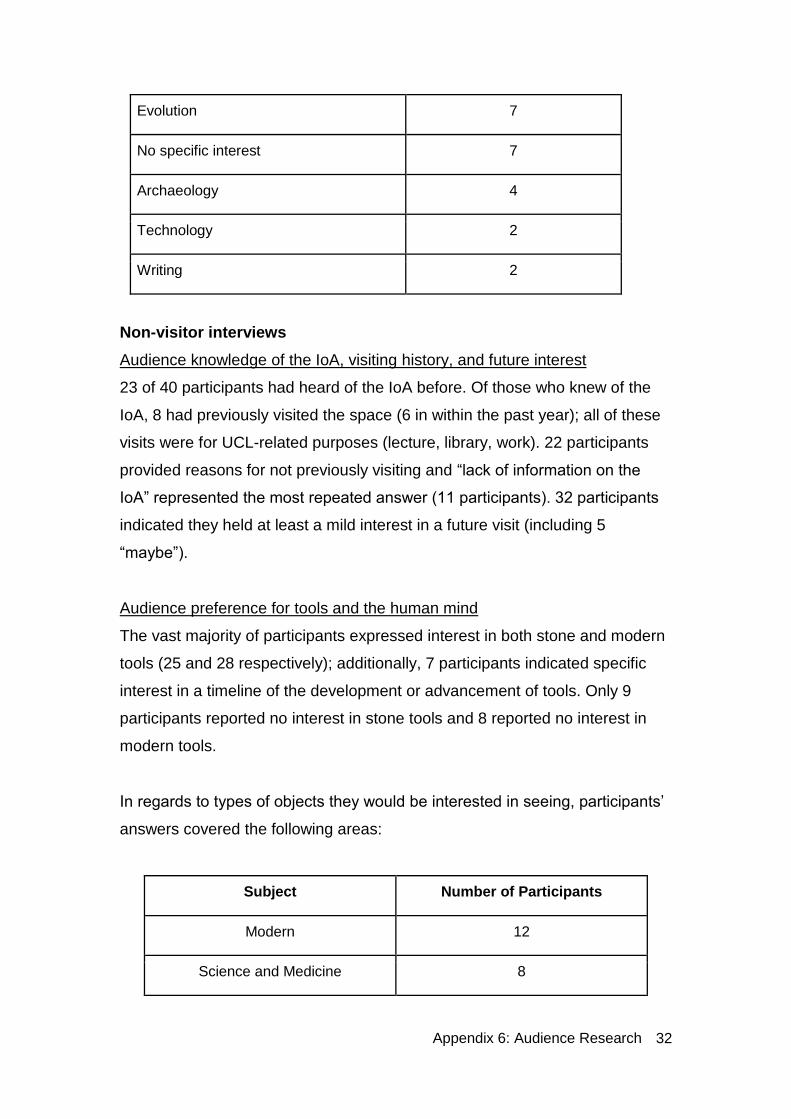
Audience preferences for tools and the human mind
The preference for stone tools and modern tools was equal (28). The
evolution of tools and combining tools with other parts of human history are
mentioned frequently. Medical tools received the highest level of interest (a
significant portion of those interviewed were psychology or medical students).
Object Preference Number of Participants
Medical 11
Appendix 6: Audience Research 32
Evolution 7
No specific interest 7
Archaeology 4
Technology 2
Writing 2
Non-visitor interviews
Audience knowledge of the IoA, visiting history, and future interest
23 of 40 participants had heard of the IoA before. Of those who knew of the
IoA, 8 had previously visited the space (6 in within the past year); all of these
visits were for UCL-related purposes (lecture, library, work). 22 participants
provided reasons for not previously visiting and “lack of information on the
IoA” represented the most repeated answer (11 participants). 32 participants
indicated they held at least a mild interest in a future visit (including 5
“maybe”).
Audience preference for tools and the human mind
The vast majority of participants expressed interest in both stone and modern
tools (25 and 28 respectively); additionally, 7 participants indicated specific
interest in a timeline of the development or advancement of tools. Only 9
participants reported no interest in stone tools and 8 reported no interest in
modern tools.
In regards to types of objects they would be interested in seeing, participants’
answers covered the following areas:
Subject Number of Participants
Modern 12
Science and Medicine 8

Appendix 6: Audience Research 33
History 7
Archaeology 6
Anthropology 5

Appendix 6: Audience Research 34
4.4. Tools
Tool 1: Observation sheet, group 1

Appendix 6: Audience Research 35
Tool 2: Observation sheet, Group 2

Appendix 6: Audience Research 36
Tool 3: Leventis Gallery map

Appendix 6: Audience Research 37
Tool 4: Observation code definitions

Appendix 6: Audience Research 38
Tool 5: Visitor interviews protocol
Front

Appendix 6: Audience Research 39
Reverse

Appendix 6: Audience Research 40
Tool 6: Non-visitor interview protocol
Front

Appendix 6: Audience Research 41
Reverse

Appendix 6: Audience Research 42
5. Baseline Evaluation II
5.1. Executive summary
This evaluation was conducted in order to provide the Audience Research
Team with the visiting pattern of the Leventis Gallery. Conducting evaluations
during the ideal time frame is essential for efficient audience research studies.
In total 112 visitors were observed during the evaluation. The personal
information was not recorded.
Findings
● Tuesday was the busiest day.
● Monday was the least busy day.
● The gallery sees most visitors between the hours of 10:30am and
1:30pm.
Recommendations
● Conduct future evaluations on Tuesday in the gallery.
● Avoid conducting evaluations on Monday and Friday; though Friday is
busy, two-thirds of the Audience Research Team and a significant
number of the Exhibition Project Team members are occupied with
their placements.
● Conduct evaluations lasting one day between 10am and 2pm.
● Avoid conducting lengthy evaluations during longer hours on a single
day; instead, conduct evaluations between 10am and 2pm on multiple
days.
5.2. Methodology
A scan sampling evaluation was conducted between 25 and 29 January 2016.
Evaluators entered the Leventis Gallery and observed the number of visitors

Appendix 6: Audience Research 43
present and a rudimentary description of their actions for a duration of 1 to 5
minutes. To avoid skewed data due to class changes in the G6 Lecture
Theatre, observations were conducted on the half hour. The observations
began at 9:30am and continued every hour, concluding at 4:30pm. Evaluators
input their data into a spreadsheet for individual statistical and qualitative
analysis; recurring themes and significant outliers were noted.
The Audience Research Team needed a comprehensive understanding of the
patterns of use in the Leventis Gallery during IoA open hours: 9am-5pm,
Monday to Friday. Due to having only a limited availability of evaluators and a
large time span, the less time intensive method of scan sampling was chosen
for this evaluation.
Evaluation questions
● What is/are the busiest day(s) in the Leventis Gallery?
● What are the busiest times of the day in the Leventis Gallery?
● What is/are the least busy day(s) in the Leventis Gallery?
● What are the least busy times of the day in the Leventis Gallery?
5.3. Findings
Monday, 25 January 2016
● The busiest time on Monday was between 10:30am and 12:30pm
(Figure 1).

Appendix 6: Audience Research 44
Figure 1: Monday gallery visits.
Tuesday, 26 January 2016
● The busiest time on Tuesday was between 12:30pm and 13:30pm
(Figure 2).
Figure 2: Tuesday gallery visits.
Wednesday, 27 January 2016
● The busiest time on Wednesday was between 10:30am and 11:30pm
(Figure 3).

Appendix 6: Audience Research 45
Figure 3: Wednesday gallery visits.
Thursday, 28 January 2016
● The busiest time on Thursday was between 11:30 and 1:30 (Figure 4).
Figure 4: Thursday gallery visits.
Friday, 29 January 2016
● The busiest time on Friday was at 1:30pm (Figure 5).

Appendix 6: Audience Research 46
Figure 5: Friday gallery visits.
The week of 25-29 January
● Monday was the least busy day (Figure 6).
● Tuesday was the busiest day (Figure 6).
Figure 6: Week of 25-29 gallery visits.
The findings of the evaluation are as follows:
● Visitor numbers are sporadic and fluctuate significantly throughout the
day and week.

Appendix 6: Audience Research 47
● Tuesday is the busiest day in the gallery, followed by Friday.
● Monday is the least busy day in the gallery.
● The gallery is busiest between the hours of 10:30 and 13:30.
5.4. Tools
A Google Drive Sheet was used to record data.
https://docs.google.com/spreadsheets/d/1LapGZyQOz8EQM_Z9TOH8E7lYs
Y1z9JWKKhAVR-ouFiA/edit?usp=sharing

Appendix 6: Audience Research 48
6. Front-end Evaluation I
6.1. Executive Summary
This study was designed to aid the Exhibition Project Team in developing and
finalising their exhibition concept by establishing the prior knowledge of the
target audience. The concept began focusing broadly on ‘the brain’, but
subsequently the Content Team refined to the topic to ‘mental illness’; the
evaluation was adapted to reflect this conceptual change.
In total, 20 participants were sampled, 10 for the keyword ‘the brain’ and 10
for the keyword ‘mental illness.’ The sample reflects the profile of the typical
Leventis Gallery visitor: 15 were students and 4 of the non-students had UCL
affiliated academic positions and 16 respondents were 18-29.
Findings
‘The brain’
● 9 participants expressed rudimentary knowledge of the complexity of
brain functioning, including the role of different parts of the brain in
different functions.
● 5 participants also displayed the opinion that the brain is the site of the
mind.
● 4 participants listed well-known mental illnesses.
‘Mental illness’
● A majority of the ‘Mental illness’ meaning maps contained either the
negative perceptions of mental illness or the negative emotions
surrounding the subject.
● 7 participants listed well-known mental illnesses.
● 7 participants talked about how ‘mental illness’ is a taboo subject that
isolates people.
● 6 participants mentioned that ‘mental illness’ is an issue common to
everyone.
Appendix 6: Audience Research 49
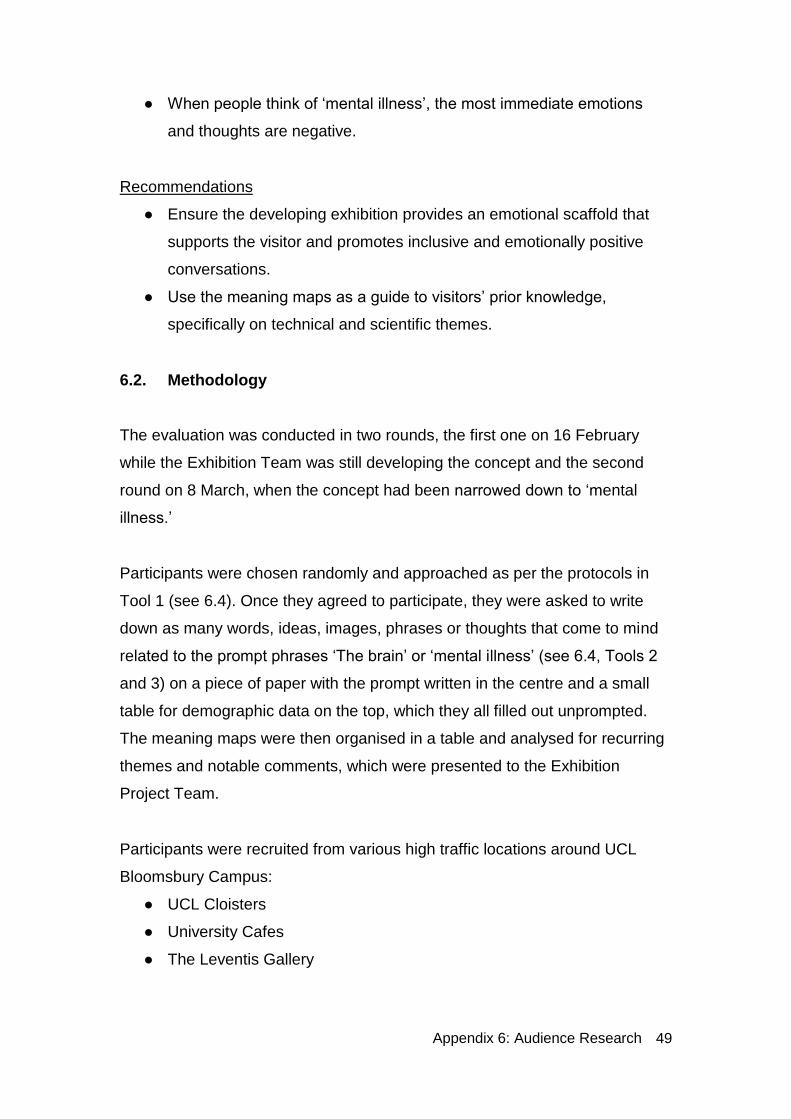
● When people think of ‘mental illness’, the most immediate emotions
and thoughts are negative.
Recommendations
● Ensure the developing exhibition provides an emotional scaffold that
supports the visitor and promotes inclusive and emotionally positive
conversations.
● Use the meaning maps as a guide to visitors’ prior knowledge,
specifically on technical and scientific themes.
6.2. Methodology
The evaluation was conducted in two rounds, the first one on 16 February
while the Exhibition Team was still developing the concept and the second
round on 8 March, when the concept had been narrowed down to ‘mental
illness.’
Participants were chosen randomly and approached as per the protocols in
Tool 1 (see 6.4). Once they agreed to participate, they were asked to write
down as many words, ideas, images, phrases or thoughts that come to mind
related to the prompt phrases ‘The brain’ or ‘mental illness’ (see 6.4, Tools 2
and 3) on a piece of paper with the prompt written in the centre and a small
table for demographic data on the top, which they all filled out unprompted.
The meaning maps were then organised in a table and analysed for recurring
themes and notable comments, which were presented to the Exhibition
Project Team.
Participants were recruited from various high traffic locations around UCL
Bloomsbury Campus:
● UCL Cloisters
● University Cafes
● The Leventis Gallery

Appendix 6: Audience Research 50
This methodology allowed the Exhibition Project Team to create a basic
understanding of the target audience’s prior knowledge. Since the exhibition is
utilising Social Constructivist Learning Theory, it is important to incorporate
and engage the visitors’ prior experiences and knowledge.
Significantly, 2 individuals who declined to participate in ‘the brain’ evaluation
stated it was because they felt they did not know enough about the topic to be
able to comment.
Evaluation questions
● What associations do people make with ‘the brain’?
● What associations do people make with ‘mental illness’?
6.3. Findings
‘The brain’
Audience thoughts on ‘the brain’
Participants’ unprompted responses revealed Personal Meaning Maps with a
range of 14 shared concepts:
1. Physical structure of the brain
2. Parts of the brain
3. Complexity of the brain
4. Brain as control centre
5. Hormonal control
6. Cognitive function
7. Memory
8. Perception
9. Thought
10. Mind/Soul
11. Mental health
12. Physical health
13. Ways of looking at the brain

Appendix 6: Audience Research 51
14. Ways of treating the brain
A majority of the participants expressed rudimentary knowledge of the
complexity of brain functioning, including the role of different parts of the brain
in different functions. Half of the respondents also displayed the opinion that
the brain is the site of the mind. The 2 refusals due to a lack of confidence in
their knowledge of the brain reflects the general attitude of many respondents
that they were unqualified to discuss the more scientific aspect of the subject.
Four of the respondents discussed mental illnesses, one sorting them under
“things that can go wrong.”
Other notable comments
● [There are] “misconceptions about how the brain works”
● “The most complex part of living organism”
● “Free will - consciousness (is our brain deterministic or do we have free
choice? This makes humans different from animals, so it’s an important
question)”
● “Perception and consciousness are linked, but neither require the
other. How does the brain integrate these?”
● It is the location of memory
● A distinction between “things that can go wrong” within the brain, and
things that can negatively affect the brain.
‘Mental illness’
Participants’ unprompted responses revealed Personal Meaning Maps with a
range of 10 shared concepts:
1. Awareness of well-known mental illnesses
2. Negative/misunderstood perceptions of mental illness
3. Mental illness as a taboo and isolating topic (7/10)
4. Negative emotions surrounding the subject
5. Mental illness as a universal issue (6/10)
6. Need for more research

Appendix 6: Audience Research 52
7. Need for more support
8. Family as a support system
9. Awareness of different treatment options
10. Need for the government specifically to provide more research/support
A majority of the meaning maps discussed either the negative perceptions of
mental illness or the negative emotions surrounding the subject. There were
two clear and contradicting themes: 7 of 10 respondents talked about how
‘mental illness’ is a taboo subject that isolates people, yet 6 respondents
mentioned that it is an issue common to everyone.
Audience thoughts on ‘mental illness’
● “Could affect anyone”
● Is a “very real” and “widespread” “big issue”
● Is a “hidden disease”
● Is a “taboo subject”
● Is “misunderstood within society”
● Is seen as “shameful” or “weak”
● Is seen as a “selfish illness”
● Makes a person “different”
Audience emotional responses to ‘mental illness’
● Loneliness
● Anger
● Misunderstanding
● Blame
● Fear
Other notable comments
● “When many people hear mental illness they think of ‘One Flew Over
the Cuckoo’s Nest’ or other ‘commercial’ examples that make mental
illness seem ‘other’ and extreme when really it’s more common and
less ‘entertaining’”
Appendix 6: Audience Research 53
● We need “more understanding about the mind and how it works” and
“need more research on the issue”
● “Not enough is done”
General prior knowledge the audience brings to the gallery
It is clear that much of the prior knowledge and preconceptions represented in
the personal meaning mapping align with the four themes that have been
designed for the exhibition:
Topic 1 in Case 1 in the exhibition will explore the link between the mind and
the consciousness and is labelled Where is the Mind?; the target audience
displays the following applicable prior knowledge:
● Concept that the mind/soul is in the brain
Topic 2 in Case 1 is labelled: How does the Mind Work? the target audience
displays an:
● Awareness that there are different parts of the brain
● Awareness that the brain control different physical function
● Awareness that the brain controls different cognitive functions
○ I.e. Perception and thought
● Awareness that the brain causes different mental/physical illnesses
Topic 1, in Case 2 is labelled How do we access the mind? Exploring physical
and psychological interventions of the brain. The target audience displays an:
● Awareness of different machines used to study the mind
● Awareness of different methods of treating the brain
Topic 2, in Case 2 of the exhibition, will detail current research and will be
labelled Will we ever understand the Mind? The target audience displays an:
● Awareness that there is a lot we don’t know about the brain
● Awareness that there is a current need for more research

Appendix 6: Audience Research 54
6.4. Tools
Tool 1: Instructions and protocol

Appendix 6: Audience Research 55
Tool 2: ‘The Brain’ personal meaning map

Appendix 6: Audience Research 56
Tool 3: ‘Mental Illness’ personal meaning map

Appendix 6: Audience Research 57
Tool 4: Example personal meaning map

Appendix 6: Audience Research 58
7. Front-end Evaluation II
7.1. Executive Summary
This evaluation intended to provide the team with audience feedback on their
proposed exhibition titles for an exhibition. Unprompted negative reactions to
the exhibition’s concept of ‘mental illness’, however, necessitated a
redevelopment of the evaluation tool and led the Audience Research Team to
encourage the Exhibition Project Team to amend their approach to the
concept and utilise less charged language.
50 participants in total (30 participants or tool 1, 20 participants for tool 2),
including 33 females and 17 males from UCL’s campus, were involved into
the evaluation. 40 participants were between 18-28 years old.
Findings
● Frame of Mind was the most appealing title (30/50).
● Under Control or Under Control? was identified as the most
representative title for the exhibition (27/50).
● A relatively high number of participants had unprompted, strongly
negative comments around ‘control’ in ‘mental illness’ (8/50).
Recommendations
● Frame of Mind: Managing Mental Illness should be the exhibition title
for the topic of ‘mental illness’.
● The Exhibition Project Team should develop content in accordance
with audience sensitivity to the topic.
7.2. Methodology
This evaluation, conducted on 4 and 5 March 2016, assessed the popularity
of the potential titles using a questionnaire that the participants completed in
the presence of an evaluator; any unprompted verbal comments provided by

Appendix 6: Audience Research 59
the participant were written down by the evaluator.
Three questions were included, two closed and one open-ended. Question 1
was concerned with participants’ initial title choice asking them to rank the
titles in order of preference, Question 2 with their impressions of their
preferred title and Question 3 asked participants to compare all titles to the
exhibition description provided. The questionnaire was divided into two parts:
Part 1 included Questions 1 and 2 on the front, while Part 2 was comprised of
Question 3 on the reverse.
Before completing Part 1, the participant was only informed that the
developing exhibition would be on the topic of ‘mental illness’. While
completing Part 2, the participant was presented with the exhibition
description. The two parts were separated to prevent participants from being
influenced by the exhibition description provided in Part 2.
Tool 1
The team created an A evaluation and a B evaluation form of Tool 1. Forms A
and B (see 7.4, Tool 1) presented the titles in different orders, so as to not
create a bias in the order of the titles. The exhibition description included in
Part 2 is as follows:
UCL’s Institute of Archaeology is developing an exhibition which
will explore the UK’s attempts to manage mental illness in the
last 200 years through the concept of control. Ultimately, we
hope to open a dialogue on the ethics surrounding mental
illness.
Tool 2
After 30 responses, the evaluator found that people have very strong
reactions to the word ‘control’, which appears in every title and is central the
exhibition's narrative. Additionally, a clear trend emerged that Restrained:
Controlling Mental Illness and Mind Controls: Managing Mental Illness were
Appendix 6: Audience Research 60
the least attractive to the participants.
The evaluation was thus adapted into Tool 2 (see 7.4, Tool 2) in collaboration
with a member of the Content Team: Restrained and Mind Controls were
eliminated from the evaluation and the main and subtitles were evaluated
separately allowing more freedom for the participants in their choices.
Additionally, to reduce the overall aggression of the word ‘control,’ three
changes were made:
● A question mark was added after Under Control
● Control in Mental Illness was included in the proposed subtitles.
● The words “and self-control” were included in the exhibition description
in Part 2, leaving the exhibition description to read as:
UCL’s Institute of Archaeology is developing an exhibition which
will explore the UK’s attempts to manage mental illness in the
last 200 years through the concepts of control and self-control.
Ultimately, we hope to open a dialogue on the ethics
surrounding mental illness.
Question 1 asked participants to rank the proposed 3 titles in order of
preference; Question 2 required the same for subtitles. As in Tool 1, Part 2
was included on the reverse and asked participants which title best
represented the updated exhibition description. Question 2 from Tool 1 was
removed from Tool 2 due to the evaluator’s findings. Evaluators input their
data into a spreadsheet for individual statistical and qualitative analysis;
recurring themes and significant outliers were noted.
The methodology for both evaluations was to invite every individual in various
locations around UCL’s campus (University of London Union, the Leventis
Gallery, and outside the Print Room Cafe and Science Library). Groups were
not invited to participate in this evaluation for two reasons:
● Group members may influence the preferences of other group

Appendix 6: Audience Research 61
members.
● It is essential that participants complete Questions 1 and 2 before
hearing or reading the exhibition description in Question 3.
Either of these situations compromises the collected data.
This method allows the Audience Research Team to compile both qualitative
and quantitative data.
Evaluation questions
● Which title sparks the most interest?
● What concepts are implied by the participant’s initial choice?
● After reading the exhibition description, which title best represents the
exhibition?
7.3. Findings
Tool 1
Audience’s initial favourite and least favourite titles
● 18 of the 30 participants identified Frame of Mind: Controlling Mental
Illness as their first or second choice based on initial impressions
(Figure 1).
● Restrained: Managing Mental Illness was identified by 17 participants
as their least favourite title for the exhibition (Figure 2).

Appendix 6: Audience Research 62
Figure 1: Form A and B combined favourite and second favourite titles.
Figure 2: Form A and B combined least favourite title.
Audience descriptions of preferred title
When participants were asked what they thought an exhibition with their
preferred title would be about in Question 2, almost all responded with an
answer somewhat consistent to the concept we are developing regardless of
their preferred title. Notable comments include:
● “The various ways to deal when living with a mental illness.” - Under

Appendix 6: Audience Research 63
Control
● “Perspectives on mental illness treatment and management.” - Frame
of Mind
● “Social responses to mental illness; how society views it.” - Restrained
● “Mind-set and behaviour.” - Mentalities
Audience opinion on the best representative title
● 13 participants indicated Under Control: Managing Mental Illness best
represented the exhibition upon reading the exhibition description,
followed by Frame of Mind: Controlling Mental Illness (6/30) (Figure 3).
● Mentalities: Controlling Mental Illness was only identified by 2
participants as the exhibition’s best representation (Figure 3).
Audience sensitivity to the word ‘control’
8 of the 30 participants, unprompted by the evaluation, expressed a strong
discomfort with the word ‘control’ including:
● “I don’t like the idea of controlling mental illness; it implies there
is a ‘correct’ mental state. It assumes a lack of freedom in the
mind; ‘managing’ is better and Frame of Mind is just
picturesque.”
● “Something about Under Control and the other ones makes
people feel uncomfortable.”
● “I don’t like the idea of ‘control’.”
Tool 2
Audience initial favourite and least favourite main titles
● Frame of Mind was chosen by 14 of the 20 participants as their initial
preferred title (Figure 4).
● 13 indicated Mentalities was their least preferred title (Figure 4).
Audience responses to the main title Under Control?
Under Control received a more favourable response in this evaluation (6/20
compared to 6/30 previously) when followed by a question mark (Under

Appendix 6: Audience Research 64
Control?):
● “The question mark makes it technically more accurate and less
intimidating.”
● “Under Control with a question mark makes it more positive.”
Figure 3: Favourite and least favourite main title.
Audience favourite and least favourite subtitles
● Managing Mental Illness was chosen by 12 people as their preferred
subtitle (Figure 4).
● Controlling Mental Illness and Control in Mental Illness were the least
favourite subtitle for 10 and 8 participants respectively (Figure 4).

Appendix 6: Audience Research 65
Figure 4: Favourite and least favourite subtitle.
Audience opinion on the best representative title
● Both Under Control? and Frame of Mind were each chosen by 14
participants as the title that best fits the updated exhibition description
(Figure 5).
● 12 participants identified Managing Mental Illness as the subtitle that
best represents the exhibition (Figure 6).
Figure 5: Best representative main title.

Appendix 6: Audience Research 66
Figure 6: Best representative subtitle.
Audience sensitivity to the word ‘control’
Managing Mental Illness, the only subtitle which does not contain the word
‘control’, was chosen by the audience as both their initial favourite and the
best representation of the exhibition (Figures 4 and 6). Participants’
comments regarding their discomfort with the word ‘control’ persisted:
● [Under Control] “is fitting to description, but I don’t like the word
‘control’. Aggressive.”

Appendix 6: Audience Research 67
7.4. Tools
Tool 1: Form A
Front
Reverse

Appendix 6: Audience Research 68
Tool 1: Form B
Front
Reverse

Appendix 6: Audience Research 69
Tool 2
Front
Reverse

Appendix 6: Audience Research 70
8. Front-end Evaluation III
8.1. Executive summary
This study was designed to gather audience feedback on the Design Team’s
five proposed colour schemes and font styles for the developing exhibition.
Participants were asked about their impressions, preferences and comments
on the colour schemes and the readability of the font styles.
50 participants were recruited within the Leventis Gallery; 32 females and 18
males, 42 of which were between the ages of 18 and 28.
Findings
● Colour Schemes 2, 4 and 5 were participants’ top choices for the
developing exhibition on mental health.
● Colour Scheme 1 was found to be the least appropriate for the topic.
● Helvetica (Font 2) was the most readable to participants.
● Georgia (Font 5) was the least readable to participants.
Recommendations
● Conduct a formative evaluation to further test Colour Schemes 2, 4 and
5.
● Use Helvetica (Font 2) for all exhibition texts.
8.2. Methodology
The evaluation was conducted on 7 and 8 March 2016 using face-to-face
interviews with two tools. Every individual who sat at the benches or seats or
had a dwell time of 30 seconds walking in the gallery were invited to
participate in this evaluation. These individuals are familiar with the gallery
and the current exhibition, potentially they are frequent users. Additionally,
visitors who spend time in the gallery are aware of its particular characteristics
that affect the exhibition design including lighting and surroundings.
Appendix 6: Audience Research 71
To easily differentiate the colour schemes and fonts from one another, they
were each coded 1-5. The evaluator provided the participants first with Tool 1
(see 8.4): a stapled book with one colour scheme on each page, allowing the
participants to focus on each colour scheme individually and to reduce the
influence other colour schemes would have considering their responses.
Participants were asked which colour scheme was most appropriate for an
exhibition on mental illness and which colour scheme seemed least
appropriate for the topic.
Tool 2 (see 8.4) was then handed to the participant: one page with the five
proposed font styles, allowing the participants to properly compare the
readability of all five. The participants were then asked which fonts had the
highest and lowest readability for exhibition labels and text panels. The
evaluator circled the number corresponding to the colour or font chosen for
each of the four questions. Evaluators input their data into a spreadsheet for
individual statistical and qualitative analysis; recurring themes and significant
outliers were noted.
This method allows the evaluators to get first-hand information from the target
audience and generate quantitative data that could be analysed quickly,
allowing the Audience Research Team to get their recommendations to the
Design Team quickly.
Redesign of Tool 2
The original document with the five font styles was compromised when the
Word document was transferred from the developer’s Mac to a UCL Windows
computer to print; fonts 1 and 3 were converted to two different fonts. Font 3
was converted to Helvetica, which was also font 2 in the evaluation.
This was not noticed until 29 evaluations had been conducted. To correct this
oversight, the original document was converted into a PDF before reprinted
for a subsequent 21 more evaluations.

Appendix 6: Audience Research 72
Evaluation questions
● Which colour scheme do visitors find the most and least appropriate for
an exhibition on mental health?
● Which font style do visitors find the most and least readable for
exhibition labels and text panels?
8.3. Findings
Colour schemes
Audience opinion on the most and least appropriate colour schemes
● Colour Schemes 2, 4 and 5 received the highest number of positive
responses (12, 12 & 17 respectively) (Figure 1).
● Participants found Colour Scheme 1 to be the least appropriate (19/50)
(Figure).
Figure 1: Most and least appropriate colour schemes.
Audience comments on colour scheme aesthetics
The evaluation did not include a question specifically asking participants
which colour scheme was the most aesthetically appealing; however, the
evaluators did write participants’ comments on their personal preferences.

Appendix 6: Audience Research 73
Colour Scheme 2 was repeatedly indicated as the most aesthetically pleasing
to the participants according to comments:
● “I like the beige” x2
● “Number two is my second favourite, but it is not appropriate for this
exhibition” x2
● “Brown/beige is nice.”
● “Especially the neutral colours.”
● “Beautiful.”
Audience opinions on font readability
The audience’s font preferences did not differ between the two versions of
Tool 2:
● Helvetica (Font 2) was identified as the font with the highest readability
(Figure 2).
● Georgia (Font 5) was identified as the font with the lowest readability
(Figure 2).
Figure 2: Most and least readable fonts.

Appendix 6: Audience Research 74
8.4. Tools
Tool 1: Colour schemes

Appendix 6: Audience Research 75
Tool 2: Font styles

Appendix 6: Audience Research 76
9. Front-end Evaluation IV
9.1. Executive Summary
This evaluation was conducted to gather audience interest in using QR codes
in an exhibition in order to inform the Digital Team’s decision in creating a QR
code for the developing exhibition.
110 of the possible 3589 group members participated in this evaluation.
Participant demographics are not able to be documented using this platform.
Findings
● Only 10 participants indicated they would use a QR code in an
exhibition.
● 54 of 110 participants stated they would not use a QR code.
● Notable comments indicate that audience’s reluctance to using QR
codes is due to:
○ The compatibility of their devices
○ The trouble of downloading scan APP
○ The effectiveness of the QR code
Recommendations
● The Digital Team should not spend resources on developing a QR
code for the exhibition.
9.2. Methodology
The evaluation was conducted using the polling function on Facebook. The
poll remained open for 48 hours, from 10pm on 6 March to 10pm on 8 March.
Considering people may have different behaviours when visiting different
exhibitions, the Audience Research Team began the poll with a very brief

Appendix 6: Audience Research 77
introduction and mentioned the topic of ‘mental illness’ (see 9.4). There was
only one closed question with three possible rationales including:
● YES: it’s quite useful to learn more about the object.
● NO: It will be difficult / incapable / time-wasted / useless for me.
● MAYBE: If the WIFI is ultra fast or I’m particularly interested.
Considering the social media users are active online and are more familiar
with and more possible to use a QR code, the Audience Research Team
invited members of UCL Facebook social groups, especially the groups
related to museums, whose members have more experience of visiting
museums.
The investigation was posted in the following 8 groups:
● UCL Institute of Archaeology, Graduate Admissions 2015/16 (225
members)
● UCL Institute of Archaeology, Graduate Admissions 2016/17 (113
members)
● UCL Postgraduate Students 2015 Entry (458 members)
● UCLU Museum Society (933 members)
● UCL SAMS (Society of Archaeological Masters Students) 2015-2016
(113 members)
● UCL Institute of Archaeology Alumni (837 members)
● SAMS UCL (Society for Archaeological Masters Students) (320
members)
● UCL Museum Studies (591 members)
The numbers in brackets after each groups indicate the number of members
in each group, meaning 3589 Facebook users in total had the possibility of
participating in the evaluation.
Appendix 6: Audience Research 78
This method allows the Audience Research Team to generate information
regarding the Digital elements in the gallery (iPad 1, iPad 2, and the totem)
from our target audience.
Evaluation questions
● Will visitors use QR codes to access web-based information on their
phones in an exhibition?
9.3. Findings
● 54 of 110 participants explicitly said ‘No’ to using QR codes (Figure 1).
● 46 participants think there is a possibility they would use it (Figure 1).
● Only 10 participants found a QR code in an exhibition useful for them
(Figure 1).
Participant reasons for disinterest in using a QR code in an exhibition included
concerns about the compatible devices, the trouble of downloading an APP
and the practical function of QR code. Notable comments include:
● “It will probably not work on my Windows phone.”
● “Some of us have very stupid phones.”
● “What’s the reasoning for using QR codes? Why not use short URL’s,
augmented reality or NFC?”
● “I think we have to download a special app, no?”
● “QR codes are problematic for real-world use. You need good Wi-Fi, a
reason why they will enhance the user’s experience, appropriate URL
encoded in the information and willing users. Usually this doesn’t
happen.”
● “It will happen anyway sooner or later. But digitisation in that case
undermines the physical (real) interaction with objects.”
● “I don’t really get QR codes – personally I find it’s easier/less effort to
just access a link provided via my phone browser directly.”

Appendix 6: Audience Research 79
Figure 1: Audience responses to: “Would you use a QR code in an
exhibition?”.

Appendix 6: Audience Research 80
9.4. Tools
Tool 1: Facebook poll

Appendix 6: Audience Research 81
10. Formative Evaluation I
10.1. Executive Summary
This evaluation was conducted following a concept change from ‘mental
illness’ to ‘the human mind’ in order to re-asses the colour schemes and
investigate the potential audience’s sensitivity to biological specimens on
display in the Leventis Gallery.
In total, 72 participants were interviewed, 33 visitors and 39 non-visitors, 50 of
them were our target audience, UCL Students. The participants were almost
evenly split in gender: 33 males; 39 females.
Findings
● Colour schemes 2, 4 and 5 were the potential audience preferences,
with a slightly higher number preferring colour scheme 5.
● A small portion of visitors would not like to see a human brain because
they find them too “gruesome,” but they were not concerned with
displaying human skulls or biological specimens.
● The human brain specimen or animal testing should only be displayed
or discussed if it is absolutely essential to the exhibition’s narrative.
● Animal testing is a sensitive subject for the audience for ethical
reasons.
Recommendations
● Include the human brain, skulls and human biological specimens if they
are essential to the Exhibition Project Team’s narrative.
● If used, the human brain should not be a key object in any case.
Design would need to mitigate the visual impact of the brain for visitors
who find it too gruesome.
● The exhibition designers must meet all university requirements
regarding the display of human remains: posting the Human Tissue
License and a warning at the entrance to the gallery.

Appendix 6: Audience Research 82
● The topic of animal testing should only be displayed, referenced or
discussed if it is absolutely essential to the Exhibition Project Team’s
narrative as the gallery is an unavoidable space for many UCL student
and staff visitors.
10.2. Methodology
The evaluation consisted of face-to-face interviews of both visitors and non-
visitors. The data was collected on 15 March. The visitor interviews were
conducted within the Leventis Gallery; non-visitor interviews were conducted
in various locations surrounding the IoA around the Bloomsbury campus.
Interview questions were predetermined, maintaining consistency across
interviews (see 10.4, Tools 6 and 7). Answers were recorded on a single table
held by the evaluator, rather than individual sheets per participant. The
questions were quantitative, although evaluators were instructed to encourage
participants to expand on their opinions. When asked about their comfort level
with brain specimens, participants were shown an image of the brain
specimen that will potentially be in the exhibition (see 10.4, Tool 5). In the
gallery, participants were also shown four potential colour schemes (see 10.4,
Tools 1, 2, 3, and 4). These were taped onto the plain space on the top of an
exhibition case and respondents were asked to indicate their “Most Favourite”
and “Least Favourite” considering the exhibition concept ‘the human mind.’
Visitor participants were recruited as they entered the Leventis Gallery,
approaching every visitor until the gallery became too crowded to conduct an
interview. Non-visitor participants were recruited around Bloomsbury;
individual evaluators determined her own recruitment process. Evaluators
input their data into a Google document for individual statistical and qualitative
analysis; recurring themes and significant outliers were noted.
This method allows evaluators to get first-hand information from the target
audience and generate quantitative and qualitative data.

Appendix 6: Audience Research 83
Evaluation questions
Visitor interviews
● Are visitors uncomfortable seeing a human brain, skull or other
biological specimens on display in this space?
● Are visitors uncomfortable seeing objects relating to animal testing on
display in this space?
● Which colour scheme is most fitting for an exhibition on ‘the human
brain and the mind’?
Non-visitor interviews
● Are individuals uncomfortable with UCL exhibition displaying a human
brain, skull or other biological specimens on campus?
● Are individuals uncomfortable with a UCL exhibition displaying objects
related to animal testing on campus?
10.3. Findings
Colour schemes
The Audience Evaluation Team evaluated the four most preferred colour
schemes from the previous evaluation. Visitor participants were given the
exhibition concept and then asked for their choice. There is a clear preference
for Colour Scheme 5: 14/33 respondents chose that scheme as their most
favourite, while only 2 chose it as their least favourite.

Appendix 6: Audience Research 84
Figure 1: Favourite and least favourite colour schemes.
Notable comments
● “Pink is an obvious choice.”
● “Bold colours are best.”
● [speaking about Colour Scheme 2] “The beige and white in 2 is more
‘brainy’ [when realised black and red are also in that colour scheme]
still that one.”
● [Black and red in # 2] ‘too demony’”
● “I don’t think the green goes.”
Note on nomenclature of colour schemes: for the purposes of interviewing the
visitors, the colour schemes were given consecutive numbers; however, in
this report the numbers were changed in order to allow direct comparison to
the previous evaluation (Front-end Evaluation III).
Objects and themes
Audience sensitivity to brain specimens, skulls and biological specimens
1 visitor expressed discomfort with the image of the brain; 3 were undecided
(Figure 2). While 1 respondent expressed an ethical concern regarding the
source of the brain specimen, the comments from respondents indicates that
largely any concern regarding the display of the brain specimen would be

Appendix 6: Audience Research 85
aesthetic in nature. No respondents expressed concern with the human skulls
or biological specimens.
Figure 2: Participants uncomfortable with brain specimens, skulls or biological
specimens.
Brain/Skull/Biological specimen notable uncomfortable comments
● Just the brain would make them uncomfortable, not the other two.
● [uncomfortable with the brain specimen, but the skull is] “okay for some
reason, I don’t know why.”
● “As long as we are explicit about where the bodies came from [(i.e.
gifted to science]”
● “I won’t look at the brain closely, the other two are fine.”
● “Not for me”
● “It’s okay, but not nice.”
● “It’s slightly weird.”
Brain/Skull/Biological specimen notable comfortable comments
● “If you go to an exhibition about that topic, that’s what you expect.”
● “Doesn’t bother me, everyone has one.”
● “It’s to learn.”

Appendix 6: Audience Research 86
● “It makes it interesting; exciting!”
● “It’s a conversation starter.”
● “I love it.”
● “I love brains.”
● “It makes me think it doesn’t make me uncomfortable as long as it is
ethically obtained.”
● “Not at all” x2
Audience sensitivity to animal testing
More participants expressed discomfort with displaying or discussing animal
testing in the exhibition: 16/72 said they would be uncomfortable, 6 visitors
and 10 non-visitors; 2 were undecided (Figure 3). Their justifications were
primarily regarding ethical issues.
Figure 3: Participants uncomfortable with objects related to animal testing.
Animal testing notable uncomfortable comments
● Concerns the display would be gruesome.
● “A little uncomfortable, it isn’t morally acceptable.”
● “The ethical concerns.”
● “It’s the worst.”

Appendix 6: Audience Research 87
● “Don’t do that.”
● “Don’t like it, it will be crude.”
● “No animal testing!”
● “I don’t want to see a rat with flappy [sic] ears.”
● “It makes me uncomfortable unless the purpose is to prohibit it.”
● “Depends if it is for scientific purposes; not objects retrieved in cruelty,
which I don’t know how you’d do.”
● “More uncomfortable, I probably wouldn’t walk there.”
Animal testing notable comfortable comments
● “If it’s something small, not too graphic.”
● “Why not if we’re [UCL] doing the experiments no (no point in not
discussing it)”
● “Shit, no?”
● “As long as it is contextualised.”
● “rather find out about it.”
● “would rather know about it.”
● “but it’s okay if it’s just rats.”
● “It won’t be uncomfortable, but a little sad. You need to explain why you
display them here.”
● “As little as possible.”
● “It’s okay if it’s for research.”
● “I’m fine, but maybe others.”
● “It’s not great, but that’s what happens, everybody knows that.”
● “I want to see animals transform.”
● “If it was describing a scientific purpose.”
● “Probably makes sense. People decide to go there. A sign would be
good to warn people.”
● “As long as there is a warning.”

Appendix 6: Audience Research 88
10.4. Tools
Tool 1: Colour Scheme 1
Tool 2: Colour Scheme 2

Appendix 6: Audience Research 89
Tool 3: Colour Scheme 4
Tool 4: Colour Scheme 5

Appendix 6: Audience Research 90
Tool 5: Image of the human brain from UCL Pathology Collection

Appendix 6: Audience Research 91
Tool 6: Visitor interview protocol

Appendix 6: Audience Research 92
Tool 7: Non-visitor interview protocol

Appendix 6: Audience Research 93
11. Front-end Evaluation V
11.1. Executive Summary
This evaluation was a developed in collaboration with the Content and Late
Event Teams. It was designed to gather audience feedback on the proposed
exhibition titles for the new exhibition concept and Science Museum Late.
Additionally, the Late Event Team sought to understand audience prior
knowledge on neuroscience and interest in the proposed activity.
A total of 31 participants took part into this evaluation including 16 females, 12
males and 3 participants declined to indicate their gender. 27 participants
were between the ages of 18 and 28, 2 between the ages of 29 and 39, 1
participant was over the age of 40 and 1 participant declined to indicate their
age.
Findings
Exhibition Project Team
● 21 participants initially preferred Mysteries of the Mind for an exhibition
on ‘the human mind’; 20 chose this title as the best representation after
reading the exhibition description.
Late Event Team
● 18 participants identified The Secret World of the Brain as their
preferred title for the proposed Late Event activity.
● Participants largely are interested in engaging with the proposed
activity in some way.
● The overwhelming majority of respondents have prior knowledge on
the subject of ‘neuroscience.’
● Respondents’ goals in attending a neuroscience late event fall into
three categories:
○ Intellectual Knowledge
○ Knowledge and Amusement
○ Personal

Appendix 6: Audience Research 94
Recommendations
Exhibition Project Team
● Mysteries of the Mind should be the exhibition title.
Late Event Team
● The Secret World of the Brain should be the Late Event activity title.
● Provide opportunities for visitors to participate in or observe the
activities.
● Develop activities that combine learning with amusement.
● Develop activities that are flexible to accommodate for visitor personal
desires.
11.2. Methodology
This evaluation, conducted on 16 March, mimicked Front-end Evaluation II in
the way it tested exhibition titles, but was extended in length to include front-
end questions on the Late Event. Two tools were utilised in this evaluation.
Tool 1
Tool 1 (see 11.4) was a one-page questionnaire the evaluators handed to
participants to complete. The questionnaire included both closed and open-
ended questions. In order to provide participants more information on the
developing exhibition and the Late Event, a second tool was handed to
participants when completing Questions 3:
● “Based on the description provided, which title best represents this
exhibition?” and Question 6:
● “Based on the description provided, would you like to: (tick all that
apply)”
Tool 2
Tool 2 (see 11.4) was not handed to the participant until he or she was
completing Question 3 so as to not influence answers to Questions 1 and 2:

Appendix 6: Audience Research 95
● Rank the following titles from 1 (most appealing) to 3 (least appealing)
for an exhibition on the human mind.
● What do you think an exhibition with this title would be about?
Reading the description of the Late Event before identifying preferred titles
was not a concern for the Evaluation Team because a full description of the
activity will appear underneath the activity title in the Science Museum Late
Event printed material.
Both evaluators were to invite every second individual who was seated at
various locations around campus to participate including:
● University of London Union
● University Cafes
● The Leventis Gallery
● The Bloomsbury Cafe
● UCL cloisters
Evaluators input their data into a Google document for individual statistical
and qualitative analysis; recurring themes and significant outliers were noted.
This method allows evaluators to get first-hand information from the target
audience and generate quantitative and qualitative data.
Evaluation questions
Exhibition Project Team
● Which title is initially the most and least appealing?
● What does the audience think an exhibition with their preferred title
would be about?
● Based on the exhibition description, which title best represents the
exhibition?
Late Event Team
● Has the audience been to a museum late event?
● Which title is initially the most and least appealing?

Appendix 6: Audience Research 96
● What would visitors like to do at a museum late event related to
neuroscience?
● What does the audience think neuroscience is?
● What would visitors like to gain from attending a museum late event
related to neuroscience?
11.3. Findings
Display
Audience favourite and least favourite exhibition titles
● 21 of the 31 participants indicated Mysteries of the Mind as their
preferred title for an exhibition on ‘the human mind’ (Figure 1).
● 15 participants identified Mind the Brain as their least favourite title for
an exhibition on ‘the human mind’ (Figure 1). One participant explicitly
stating:
○ “Hate this! DUMB.”
● 1 participant further explained his preference for either Mysteries of the
Mind or Frame of Mind due the confusion caused by Mind the Brain:
○ “[Mysteries of the Mind and Frame of Mind] “= about the mind.
[Mind the Brain] = about the brain. Which is it going to be?
‘brain=mind’ may put off some people (notably ‘human sciences’
ones) so if the exhibit is about the mind in the brain: I’ll go with
the first two titles and NOT point at the ‘brain’ in the title (since
he exhibition is about the mind right?)”

Appendix 6: Audience Research 97
Figure 1: Initial title preference.
Audience description of preferred title
Participants’ descriptions of both exhibitions titled: Mysteries of the Mind or
Frame of Mind aligned with the current exhibition concept:
● “What is the human mind? What do we know about it?” - Mysteries of
the Mind
● “Things about the mind that science still doesn’t understand.” -
Mysteries of the Mind
● “Things about the mind that I wouldn’t know about before.” - Frame of
Mind
● “How the brain works, things we didn’t realise the brain does.” - Frame
of Mind
Topic 1 in Case 1 in the exhibition will explore the link between the mind and
the consciousness; Frame of Mind led a participant to describe an exhibition
about:
● “Where consciousness comes from.”
The last topic, in Case 2 of the exhibition, will detail current research. A
participant who preferred Mysteries of the Mind described an exhibition
including:

Appendix 6: Audience Research 98
● “Cutting edge neurology.”
Topic 2 in Case 1 is labelled: How does the Mind Work? Both Mysteries of the
Mind and Frame of Mind provoked this description verbatim:
● “About how the mind works and what is currently known and unknown
about these processes.” - Mysteries of the Mind
● “How the mind works” - Frame of Mind
Audience opinion on the best representative title
After reading the exhibition description provided in Tool 2, a slightly smaller,
but still significant, portion of participants (20/31) identified Mysteries of the
Mind as the best representation of the exhibition (Figure 2).
Figure 2: Best representative title.

Appendix 6: Audience Research 99
Late Event
Audience previous Late Event experience
21 participants indicated they had never been to a late event before (Figure
3). Of the 10 participants who responded they had previously been a late
event, 8 had done so in London including:
● The Natural History Museum
● The National Portrait Gallery
● The Museum of London
● The Jewish Museum
Figure 3: Previous Late Event experience.
Audience favourite and least favourite Late Event activity titles
● 18 of the 31 participants identified choice B: The Secret World of the
Brain as their preferred title for the proposed Late Event Activity (Figure
4).
● 7 participants preferred choice A: Journey to the Centre of the Brain
(Figure 4).
● Passport to the Brain and Get Your Head in the Brain were identified
as the least preferred title for the activity by 10 and 9 participants
respectively (Figure 4).

Appendix 6: Audience Research 100
Figure 4: Favourite and least favourite titles.
Audience interest in the proposed activity
A significant portion of the evaluation sample indicated an interest in engaging
with the mini experiment in some way:
● 21 as participants (Figure 5).
● 19 as observers (Figure 5).
● 16 in interacting with the scientist involved (Figure 5).
Fewer respondents showed an interest in either giving feedback or using
social media:
● 20 participants were not interested in providing feedback on the mini-
experiment (Figure 5).
● 22 participants were not interested in engaging remotely via social
media (Figure 5).

Appendix 6: Audience Research 101
Figure 5: Interest in the proposed activity.
Audience prior knowledge of ‘Neuroscience’
Overwhelmingly (28/31) when asked in Question 7: “What do you think
‘neuroscience’ is?” participants associated ‘neuroscience’ with the brain:
● “Science/study of the brain.” X10
● “The study of how the brain works/what it does.” x6
3 participants compared ‘neurology’ to ‘psychology’, 1 noted:
● [Neuroscience is] “like psychology but more scientific.”
Only 1 participant responded that he did not know what ‘neuroscience’ means
and 3 participants declined to respond to this question.
Audience preferred visitor outcomes
Participant responses to Question 8: “What would you like to gain from
attending a museum late event activity on the neuroscience of how your brain
makes sense of the world?” fall into three main categories:
● Intellectual knowledge (17/31)
○ “I know very little about the brain - any information on how it
works or how it helps me to do everyday tasks.”

Appendix 6: Audience Research 102
○ “Knowledge on facts I’ve previously not known. Basically learn
something new.”
○ “An idea about research done on a topic.”
○ “An understanding of how the brain works, some sort of
personalised/individual feedback on my own brain, something
personalised to take away from it (whether info or object).”
● Knowledge and amusement (7/31)
○ “Have a fun time with drinks and music and have fun activities
related to ‘neuroscience’.”
○ “Perhaps fun knowledge gained from interactive activities.”
○ “Some new, interesting facts on the brain and a fun craft
experience.”
○ “Knowledge and fun.”
● Personal goals (4/31)
○ “Knowledge of myself.”
○ “A new perspective or influence.”
○ “Improved self-awareness.”
○ “A unique and insightful experience.”

Appendix 6: Audience Research 103
11.4. Tools
Tool 1: Questionnaire
Front

Appendix 6: Audience Research 104
Reverse
Tool 2: Exhibition and Late Event activity descriptions

Appendix 6: Audience Research 105
12. Formative Evaluation II
12.1. Executive Summary
This evaluation was conducted in order to test the elements of the exhibition
that are completed and/or in development in order to provide visitor feedback
on the design scheme, identify problem areas in the display objects and
content, and develop digital content.
There were 6 participants in total, 3 males and 3 females. The participants
were in our target audience age group and occupation bracket: 4 were in their
20s, 2 in their 30s, and all were enrolled in UCL – 4 listing “student,” 1 PhD
candidate and 1 “archaeologist/student”.
Findings
Design Team
● The design communicates the exhibition’s focus on the brain
processes and the contemporary science focus.
● Participants enjoyed the simplicity of the design and recognised the
design is inspired by neurons in the brain.
● Participants showed no clear aesthetic preference between the two text
panel colour schemes, but the white background was more readable.
Collections Team
There were no negative reactions to any objects presented in the
evaluation.
Content Team
● Participants appreciated the short and concise text.
● While the unknown is appreciated, participants wanted a bit more
structure in the form of what we do know.
● Participants appreciated when the text provides a reflexive critique.
● Participants frequently asked “why” and wanted more explanations.
● Participants wanted the introductory text to have a more mysterious
feel as well as more context and structure for the rest of the exhibition.

Appendix 6: Audience Research 106
● Comments indicate that participants are interested in the aspects of the
themes which provide a non-scientific approach.
● Participants like the role of the light box in providing further info about
the brain itself.
● In the text, phrenology appears as an accepted science, which is not
the correct communication message. The final sentence of the
Gateway Object text is particularly problematic.
● In section 4, the participants appreciated the acknowledgement of the
unknown; however, they wanted more structure and guidance from the
gateway object, and they were confused as to what role this object and
text provided in the case.
● Participants requested more acknowledgement of their prior knowledge
of the ECT machine in section 4.
● The Exhibition Team should follow the line edits provided by the
participants.
Digital Team
● Participants want a 5 question quiz.
● Participants want to know more about what the experts do, what they
think and more about the gateway objects.
Recommendations
Design Team
● The Exhibition Team should acknowledge that the design most directly
communicates that the mind is located within the brain.
● Design should use the light box panel to make a direct connection
between the design pattern and the neurons that inspired it.
Collections Team
The communication messages for the phrenology bust and the human
brain specimen need to be clarified.
Content Team
● All of the text needs to be clear about what has been debunked.
● Incorporate non-scientific and mysterious elements into the text.

Appendix 6: Audience Research 107
● Provide more explanations.
● The phrenology bust text needs to be re-written.
● The brain specimen gateway text needs to be rewritten with a clearer
communication message in mind.
● The Exhibition Project Team should debate whether to include
potentially controversial references to visitor prior knowledge.
Digital Team
● The iPad quiz should have 5 questions.
● The interview should provide further context for the objects.
● Digital should be a platform to make the science seem less daunting.
12.2. Methodology
An evaluation of a mock-up of the exhibition was held on 4 April 2016.
Participants were recruited as they walked through the Leventis Gallery, and
an advertisement was posted on the UCL Facebook pages in order to
encourage people to stop by. Since it was Easter break, the space was
guaranteed to be quiet, although this meant it was difficult to recruit a larger
number of participants.
The evaluator talked the participants through the exhibition using a script (see
7.1) describing the exhibition while showing them a binder with visual
representations of the exhibition: sketches, pictures of objects, text, designed
text panels/labels and mock-ups of the digital elements (see 7.3).
Two different design options were tested for each text panel. Sections 1 and 2
were represented by a collage of object images, the title and a brief
description based on the communication messages in the case. Sections 3
and 4 provided each level of the text hierarchy; with a focus on the gateway
objects could be potentially controversial. A mock-up of the home screen for
the iPad with interviews was also provided, showing images of each of the
experts along with the title of the section of the exhibition they represent.

Appendix 6: Audience Research 108
Visitor’s responses were recorded on a questionnaire sheet (see 7.2) that was
structured with qualitative open-ended questions written with supporting
prompt questions to encourage thoughtful visitor responses. The evaluator
input the data into an Excel sheet to analyse for patterns and trends in
participants’ comments.
This method allowed the Audience Research team to get first-hand
information from the target audience and generate qualitative data.
Evaluation questions
Design Team
● Does the design convey the theme/concept of the exhibition?
● Which colour scheme should the text panels be, based on aesthetic
preference and readability?
Collections Team
Should any of these objects be taken off the object list?
Content Team
● What does the visitor think of the tone and content of each level of the
text hierarchy?
● Does the introductory text provide a satisfactory introduction to the
exhibition?
● Do the section panels provide a satisfactory introduction to each
section?
● Is the text interesting while providing the right level of information?
● What information would the visitor want from the first two sections?
● While these sections were mostly provided in order to create a more
complete image of the exhibition for the visitor, the Audience Team
wanted to find out what information the visitor would want from the first
two sections.
● Of particular concern are the gateway objects for sections 3 and 4.
Phrenology is a potentially sensitive subject and some people in
Formative Evaluation I expressed discomfort with seeing a brain
specimen in the display, the Audience Team felt a need to test the
visitor’s responses to these objects and their contextualising text.

Appendix 6: Audience Research 109
Without being prompted, do the visitor responses the text or images of
the objects raise any issues or problems?
Digital Team
● How long of a quiz would visitors be willing to take on an iPad in the
gallery?
● What further information would visitors want from each of the experts to
be interviewed for the other iPad?
12.3. Findings
Design
Comments
The design communicated the exhibition’s focus on the brain processes and
the contemporary science focus. While the simple approach was appreciated,
the participants did not describe any sense of mystery from the overall design.
Figure 1: Gallery sketch.

Appendix 6: Audience Research 110
Figure 2: Case sketch.
Overall
design
● “It’s minimalist and modern with a sense of science.”
● “It’s simple and minimalist is better – clean concepts.”
● “Clean and legible.”
● Participant liked the floor logo and the definition of sections.
● Participant liked the design – it’s simple and minimalist is better. “It has
clean concepts.”
Logo ● Participant liked the logo, “it’s creative and imaginative.”
● The brain symbol “is like a network.”
Pattern ● “Highlights the connectivity and brain processes.”
● “If the design is meant to represent neurons, the lines should be more
wiggly and the dots blurry [indicates picture of neurons used as
background for the digital main menu] like that!”
● “The section panels are more design that text – is that a waste of
space?”
● Participant liked the design on the bottom of the section panels – it
would look good and consistent if it was on the bottom of the gateway
panels as well.
Text panel colour scheme
Participants did not have a clear preference for either the white or grey
background when asked which was more preferable (see Fig. 1). However, 4
of the 6 found the white background more readable and 2 commented that the
blue and green design “got lost” or was hard to see in the grey background.

Appendix 6: Audience Research 111
Figure 3: Text panel colour schemes.
Figure 4: Colour scheme preferences.
Colour
scheme
● “The design pops on the white but gets lost in the grey - as a dyslexic,
the grey is hard to read.”
● Participant was “not sold on the grey” but overall the colour scheme
was "better than pink" and participant liked that the colour scheme isn't
"male/female" and “non-binary.”
● Liked the way the green and blue goes with the grey - maybe some
purple on the white
● Participant felt the grey would look good lit up with the light box and
liked the design on the bottom of the section panel. Suggested we “do
that with the gateway object label [because] it would be consistent.”

Appendix 6: Audience Research 112
Collections
None of the objects presented to the participants prompted negative
reactions.
Content
Overall themes:
● Participants want more explanation of “why” a certain paradigm of the
mind was believed.
● Participants appreciated that the exhibition acknowledges what is
unknown and what is controversial.
● Participants appreciate the short and concise text.
● While the unknown is appreciated, participants wanted a bit more
structure in the form of what we do know.
Introductory panel text
Overall, the participants liked the introductory text; however, they pushed it for
more of a mysterious feel while providing more context and structure for the
rest of the exhibition.
Figure 5: Introductory text.
Positive
comments
● “Short and sweet.”
● Participant liked the chronology and said that it “sets up for an
interesting concept – We don’t know things!”

Appendix 6: Audience Research 113
● Participant liked that it comments on change throughout time and
different locations.
Push for
more and
suggested
changes
● Two participants would like the themes to be stated explicitly.
● “Could be a bit more mysterious/enticing.”
● Participant wanted more about what mysteries are being picked apart.
● Participant would like to know more from first and second paragraph.
● Participant wanted more of an archaeology component.
● Participant wanted more of a religion/supernatural component.
● “This kind of unsolved discussion shouldn't be in the main intro panel.”
Line edits ● “The ‘changed places’ sentence is a bit vague and confusing.”
● “The last sentence ‘the organ inside my head’ counters the idea that the
mind might not be in the brain.”
● Participant liked the first and second paragraph but felt the third part
seems misleading and contradicts the previous paragraphs.
● Participant liked the first and last paragraphs and the beginning of the
second paragraph; but felt the second part is too much. Also had “a
strange use of words“ [grammar and syntax].
Case 1: Section 1 and 2
Overall, the participants wanted less didactic information in these sections,
namely why people thought different paradigms rather than the fact that they
did. The comments also hint that participants are interested in the non-
scientific aspects of the themes, such as the Ancient Egyptian beliefs and the
alternative drugs.

Appendix 6: Audience Research 114
Figure 6: Section 1 image collage.
Figure 7: Section 2 image collage.

Appendix 6: Audience Research 115
Section 1:
Where is
the Mind?
● Two participants wanted to know more about WHY they thought the
mind was in the heart, or why they were trying to figure it out.
● ”How has this idea of the heart/mind helped science/adapted over
time?”
● “Some people still believe in the four humours. Like in astrology circles.”
● “It’s perfect – not overcrowded.”
Section 2:
How do we
access the
mind?
● “More about why we want to unlock the mind.”
● Wants a little more direction – a historical perspective like a chronology
to guide the visitor
● Liked that it acknowledges controversies
● Lewis Carroll component created confusion at first for one person – then
realised it was “an examination of access that’s not actual access.”
● “I like the LSD Trip from Alice in Wonderland”
● “There are too many drugs – what about different alternative drugs?
What about not taking anything? Sleep? Food? Meditation? These
things are represented in prehistoric art.”
Light box
The participants did not have many significant comments on the light box.
Only one person said they would like further information from the panel;
however, another commented that they would expect further information from
the planned fun fact book.
Pattern
/Design
● “Could this panel make a direct connection between neurons and the
pattern in the design?”
Existing info ● “There are the sort of things I talked about when I worked at a science
centre.”
More info ● “It’s not very explanatory. Maybe explain how the brain works? The
purpose is not as clear as the other sections - but it’s good to know
about physical substance [of the brain].”
● On the other hand, another participant said “Won’t the flip book have
further info?”
Line edits ● “First paragraph is missing a period at the end.”

Appendix 6: Audience Research 116
Section 3: How do we access the mind?
Most importantly, the discussion of phrenology in the section panel and
phenology bust text makes it seem like a currently accepted science and do
not acknowledge that it has been discredited. Participants also appreciate
when the text provides a reflexive critique, such as the acknowledgement of
controversy in the text for the inkblot.
Section
panel
● Participant liked the title because “it addresses the main question” -
“talking about different fields creates good context” and it’s “good to
acknowledge we don't know things.”
● “Should make it clear that you approach of the mind through the brain
[looked at the main intro again] never mind”
Critiques ● “Yeah - strange wording - ‘the search for answers has often led
people’ - maybe ‘has led’ instead?”
● “Phrenology? Is it actually scientific? It's fine if it's unknown.”
● “More like the last sentence of the first paragraph – [expand on the]
paranormal and supernatural”

Appendix 6: Audience Research 117
Figure 8: Section panel 3.
Gateway
object:
phrenology
bust
● Participant liked the title [Criminal minds] but pointed out that the text
never actually uses the word “mind”.
● Two participants asked to expand on why people made death masks
[one saying “as an archaeologist”] and how they were used; however,
another participant said that the text provided a good understanding
of why it was used.
● Participant liked the text: “who he was and why look at him - it's a
talking point.”
Critiques ● “The second sentence is unclear - seems like he decapitated his wife
and kid.”
● Participant pointed out that the text is missing that phrenology is

Appendix 6: Audience Research 118
thrown out as a science [“is a joke science”].
Figure 9: Gateway object Section 3: phrenology bust.
Figure 1: Text for phrenology bust.
Inkblot test ● Participant said, "Sweet" and that they liked the critique within the text
itself.
● Participant mentioned wanting to know how it’s been culturally

Appendix 6: Audience Research 119
adopted - such as the Watchmen comics.
● “Good but ends on a random break. Expand on the last sentence.”
Critiques ● Three people said they’d want more info on how they work, maybe
with examples, i.e. If you see this, it means that.
● Participants weren’t enthused about the title, but one pointed out that
the date shouldn’t be in the title, and in that in the text, the date range
should be shown - the participant wanted to know how long the tool
was used in general not when that specific one was made.
Figure 11: Inkblot tests.

Appendix 6: Audience Research 120
Figure 12: Text for inkblot tests.
Section 4: Will we ever understand the mind?
The participants appreciated the acknowledgement of the unknown in the final
section of the exhibition; however, they wanted more structure for the gateway
object. They felt that the text for the brain specimen did not provide any
information different than the section panel, and they were confused as to
what role this object and text provided in the case.
Section
panel
● “Good - sets up a lot of possible questions and possible answers in
the case.”
● Participant liked it and felt it was a good end to the exhibition. “But
still this kind of unsolved discussion shouldn't be in the main intro
panel.”
Critiques ● 2/6 people want more information from this panel
● “I don't wonder about dreams - these first mysteries are minor -
Wants more on how it might be possible to replicate human
intelligence - that is bigger than the other points - like Google trying to
make a computer respond like a human.”
● "For most the mind … physical brain" - is this explored in the future?
It brings up more questions.”

Appendix 6: Audience Research 121
Figure 13: Section panel 4.
Gateway
object: the
brain
Critiques
● Participant felt the title needs to be more self-explanatory - wants to
know "what I am getting into” and “Will you be able to see it’s grey? Is
it grey?”
● Participants were unclear what the “intention” and purpose of this text
was:
o “Explain what grey matter is - say we learnt more but what
have we learnt about the brain? It’s vague.”
o “Gross. Cool but a little basic. It could be more about what
grey matter is - definition like lobes and stuff.”
o “Include something we have learnt about the mind - why
grey."
o “What does it [the text] lead into?”
● Two participants critiqued the first sentence:
o [Laughs] "’Visually’ is subjective, someone might like it.”
Participant also liked the yellow fluid, as it’s “more vintage.”

Appendix 6: Audience Research 122
o "’Visually not attractive’ sentence - horrible - not grey in the
object image - I think of the brain more like ‘terracotta-y’ - the
last bit is good.”
● “Whose brain? I want to know more about it - is it male or female? If
it’s not known, it’s not the end of the world.”
● Participant asked if the spelling was learned/learnt? “The text is
vague - not really any information the intro panel doesn't have.”
Figure 14: Gateway object Section 4: the brain.
Figure 15: Text for the brain specimen.
ECT Machine ● 2 people brought up representations in pop culture:
o “How it has been represented inaccurately in the media.”
o “Brings to mind the movie one flew over the cuckoo’s nest.”
● “Was it always used for depression or just recently?”
● “Good that it nods to the controversy of the issue.”

Appendix 6: Audience Research 123
Critiques ● 4/6 people didn’t like the title: 2 said “shocking” should be in the title,
another said it was “too complicated” and the fourth said while it’s
self-explanatory, it doesn’t help because they don’t know what the
object is.
● Participant asked for more statistics. It “says 50% - what about
statistics about how much it’s still used.”
● “‘1930s and etc.’ sentence - grammar reads as off - content is fine,
maybe make that sentence two smaller ones.”
● “Second sentence grammar is off - wrong commas.”
Figure 16: ECT Machine.

Appendix 6: Audience Research 124
Figure 17: Text for ECT Machine.
Digital
Quiz length
5 of 6 preferred an iPad quiz with five questions, saying:
● 5 is better because you get more use out of it
● 3 or you’d get tired [participant didn’t have English as a first
language]
● “Too science-y” for a short one, 3 isn’t long enough to feel like you
learnt something
Interview questions/further information
Overall, three these arose:
● Like with the content earlier, participants want more explanation “Why”
a certain paradigm of the mind was believed.
● Participants seemed overwhelmed by Katherine Clark and Kate
Jeffery’s expertise. This possibly indicates that science can seem
scary, confusing or at least a little bit daunting.
● The two “history” experts, on the other hand, inspired very specific
questions. This indicates that people (or at least people in the IoA) are
more comfortable with a historical approach. One participant even
indicated a desire for a more chronological or at least linear approach.
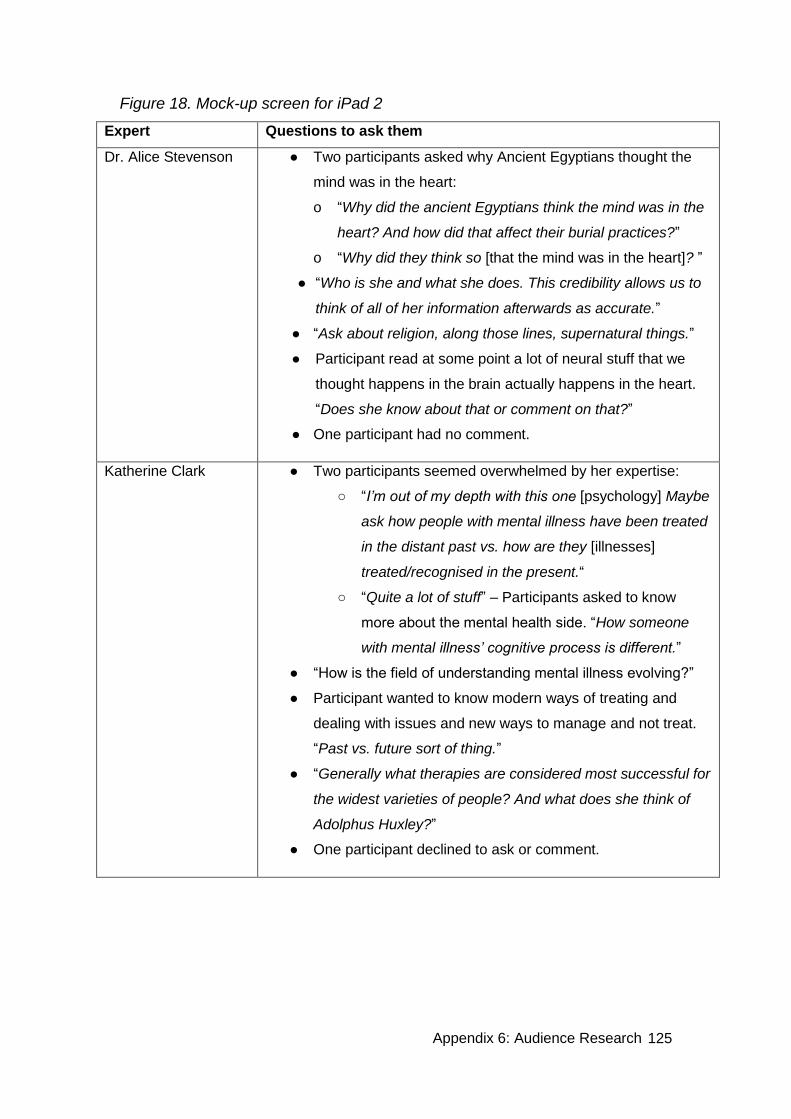
Appendix 6: Audience Research 125
Figure 18. Mock-up screen for iPad 2
Expert Questions to ask them
Dr. Alice Stevenson ● Two participants asked why Ancient Egyptians thought the
mind was in the heart:
o “Why did the ancient Egyptians think the mind was in the
heart? And how did that affect their burial practices?”
o “Why did they think so [that the mind was in the heart]? ”
● “Who is she and what she does. This credibility allows us to
think of all of her information afterwards as accurate.”
● “Ask about religion, along those lines, supernatural things.”
● Participant read at some point a lot of neural stuff that we
thought happens in the brain actually happens in the heart.
“Does she know about that or comment on that?”
● One participant had no comment.
Katherine Clark ● Two participants seemed overwhelmed by her expertise:
○ “I’m out of my depth with this one [psychology] Maybe
ask how people with mental illness have been treated
in the distant past vs. how are they [illnesses]
treated/recognised in the present.“
○ “Quite a lot of stuff” – Participants asked to know
more about the mental health side. “How someone
with mental illness’ cognitive process is different.”
● “How is the field of understanding mental illness evolving?”
● Participant wanted to know modern ways of treating and
dealing with issues and new ways to manage and not treat.
“Past vs. future sort of thing.”
● “Generally what therapies are considered most successful for
the widest varieties of people? And what does she think of
Adolphus Huxley?”
● One participant declined to ask or comment.

Appendix 6: Audience Research 126
Nick Booth ● “More about the history of phrenology and why people
thought it was legitimate.”
● “Just explain the objects better, elaborate because the points
that the objects are supposed to illustrate might not be
immediately understood. It would be nice to see them in the
case, see them in the interview, and then go back.”
● Participant wanted to know more about the development of
those objects, their history. “Why were these things
developed in that way?”
● “What was the first object used to learn more about the
mind? What about chemistry? Like brain chemistry, like what
do chemical signatures say about the brain?” [Wanted to
know if Nick knew anything about how brain chemistry has
been studied and what chemicals possibly mean.]
● “How does he think UCL has impacted concepts of the
mind?”
Professor Kate Jeffrey ● “For her to talk about what she is currently during and about how
we understand human consciousness both past and future.”
● “Just more about what she does.”
● “What does she find most interesting about the brain?”
● Participant wanted to know more about the abstract mind and
human evolution and more about how the mind came to be the
way it is today: “evolution of mind”.
● “Too many questions, interested in it all! But I guess how does
the mind expand into different states [states of being].”
● “What is the brain?”
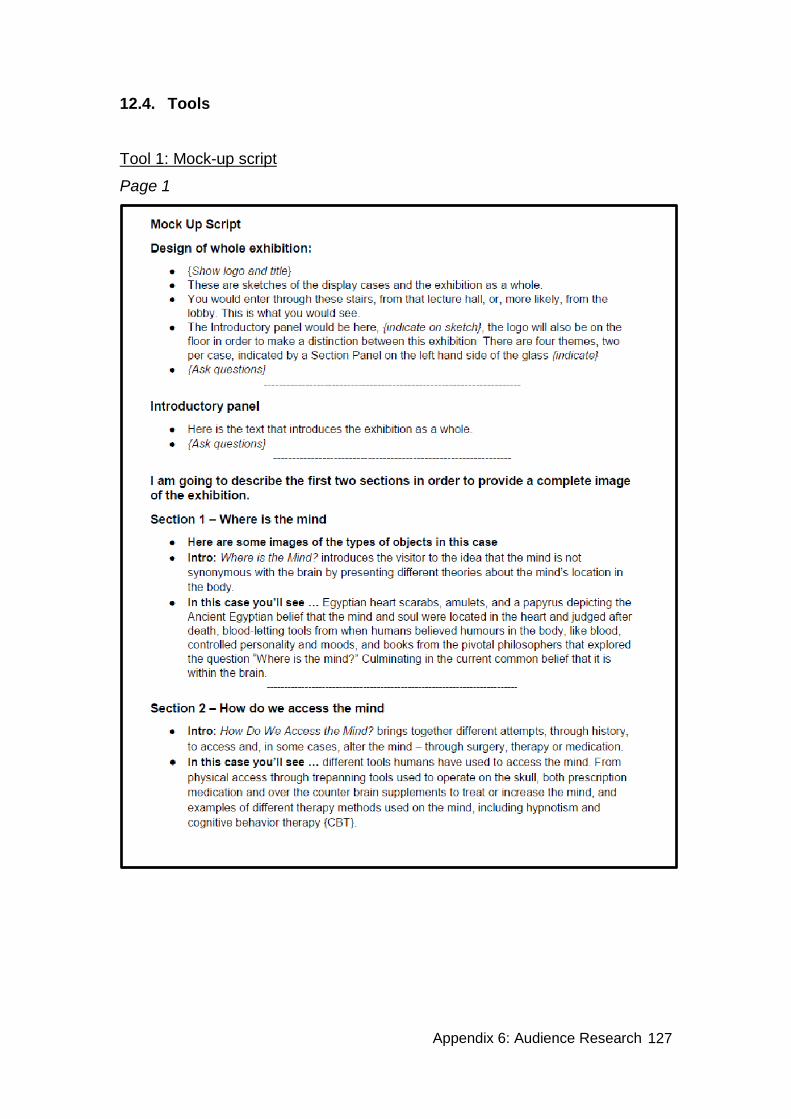
Appendix 6: Audience Research 127
12.4. Tools
Tool 1: Mock-up script
Page 1

Appendix 6: Audience Research 128
Page 2
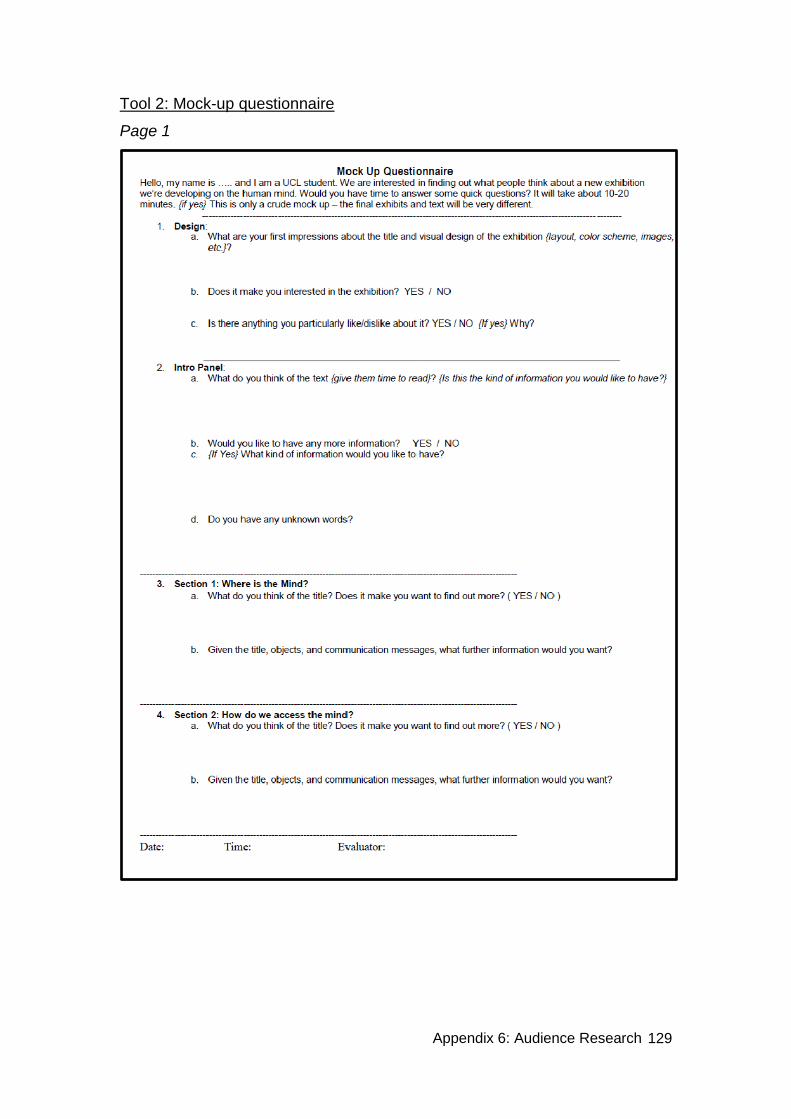
Appendix 6: Audience Research 129
Tool 2: Mock-up questionnaire
Page 1

Appendix 6: Audience Research 130
Page 2
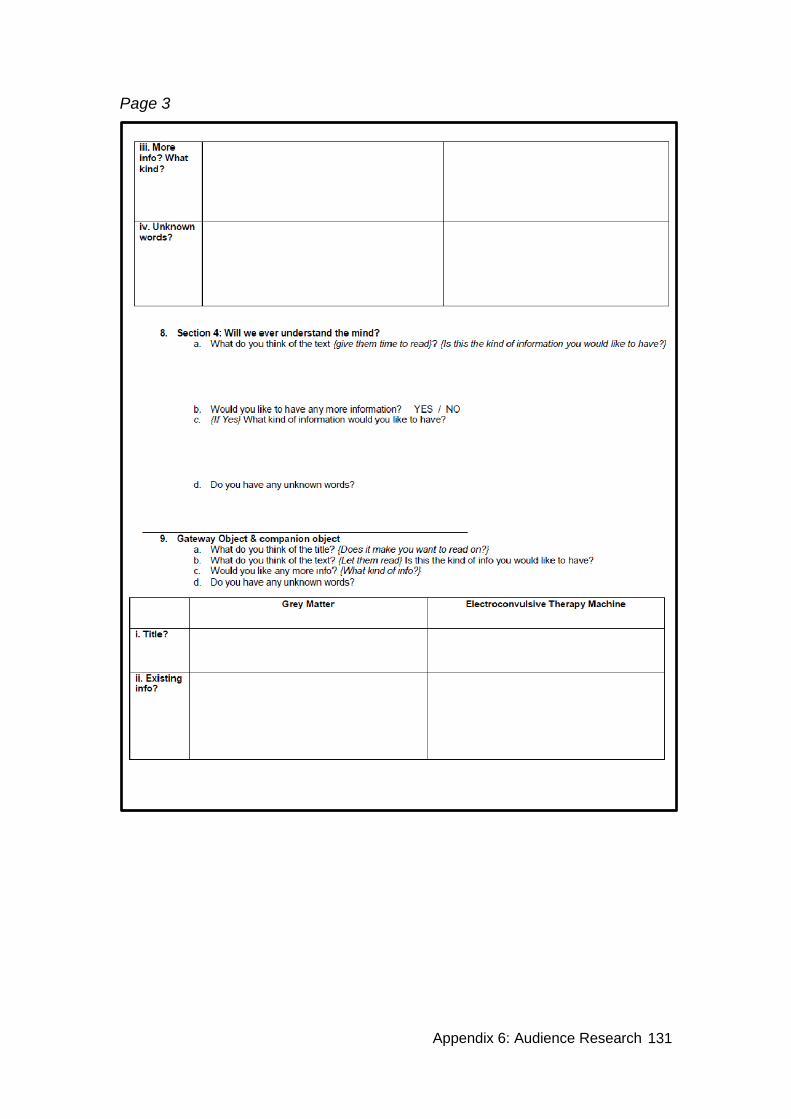
Appendix 6: Audience Research 131
Page 3

Appendix 6: Audience Research 132
Page 4

Appendix 6: Audience Research 133
Tool 3: Mock-Up Binder
Permanent link:
https://drive.google.com/file/d/0BzAoEOh25tdXTkRXTUpzX3RKT2M/view?us
p=sharing

Appendix 6: Audience Research 134
13. Formative Evaluation III
13.1. Executive Summary
This evaluation was developed in collaboration with the Digital Team to inform
their decisions when developing content for the exhibition’s digital totem
screens. It was designed to gather audience interest in the activity and
observe the social interactions the activity generates in order to determine
which of the three proposed optical illusions would draw in the most visitors
and incite the most conversation among visiting groups in accordance with the
exhibition’s learning theory and outcomes.
Two groups of friends participated in this study; Group 1 consisted of 3
females, while Group 2 consisted of 2 females.
Findings
● Participants demonstrated optical illusions and their text explanations
can incite conversations and enjoyment among groups.
● Participants displayed an interest in seeing and learning about optical
illusions in an exhibition about mysteries surrounding the mind.
● Participants liked the quality of the information, but do not want as
much text in the explanations or technical terms.
● Participants indicated they are not likely to engage longer than 3-5
minutes.
● Participants have a desire to see personal reasons and stories for why
they see what they see in an illusion.
● Participants would like to be able to explicitly see the two images.
● The Duck/Rabbit illusion is the least known.
● Focus Group 1 preferred the aesthetic appeal of the Rubin optical
illusion, while Focus Group 2 preferred the Duck/Rabbit for its
unfamiliarity.
● The text explanation for the Duck/Rabbit illusion incited laughter in both
groups.

Appendix 6: Audience Research 135
Recommendations
● Use Duck/Rabbit optical illusion in the interactive totem.
● Provide no more than 2-3 text explanation slides to accompany the
optical illusion.
● Display the page number on the display (ex. 1 of 3).
● Edit down the explanation already given into a cohesive narrative
without technical jargon (remove “ambiguous image” and keep the
‘Easter Sunday explanation’ in the Duck/Rabbit optical illusion, if used).
● Integrate the more detailed information into a shorter explanation.
● Provide personal reasons for why visitors might see one image over
the other.
● Provide the definitions of optical illusions on a separate screen: screen
3.
13.2. Methodology
This evaluation was conducted through two separate focus groups. The first
half was conducted 14 April 2016; the second half was conducted 15 April
2016.
The focus group method was chosen due to the Digital Team’s desire to test
the totem content’s ability to promote social interaction in accordance with the
social constructivist learning theory. This method allows evaluators to
simultaneously observe participant interaction and gather insights through
face-to-face discussions.
In order to conduct an ethical study, an agenda and consent form were given
to each participant before beginning the evaluation (see 13.4, Tools 3 and 5).
All participants were informed of the purpose of the study, the guarantee to
anonymity and their right to withdraw from the study at any point. Each
consent form had been previously signed by the evaluators present to
demonstrate the commitment to the agreement.

Appendix 6: Audience Research 136
All evaluators had previously read through the outline (see 13.3, Tool 4) to
understand the ethical procedures, evaluation plan and their role within the
evaluation. For each focus group, three evaluators were present with the
following roles:
● Audience Advocate: group facilitator
● Member of the Digital Team: optical illusion facilitator
● Member of the Audience Research Team: observer
The data for the evaluation consisted of facilitator and observer notes. These
were analysed by comparing the data from each focus group separately as
well as coding them to highlight three key areas: social interaction, responses
to the optical illusions and responses to the text explanations.
Focus Groups 1 and 2
Both focus groups were shown a PowerPoint presentation which included text
from the exhibition’s introductory panel (Figure 1), contextualising images of
the gallery space (Figure 2) and particularly its digital components (Figure 3).
Figure 1: Mysteries of the Mind introductory text.

Appendix 6: Audience Research 137
Figure 2: Diagram of the Leventis Gallery. Figure 2: Digital image of totem.
Participants of both groups were shown three optical illusions and text
explanations in a PowerPoint. In order to determine what information should
be included in the explanation and how long participants would like the activity
to last, the groups were shown text explanations of different lengths and
content. The text shown to Focus Group 1 was shorter and included
information designed to give only a basic understanding of how the illusion
works (see 13.4, Tool 1). Focus Group 2 was shown slightly longer text that
additionally included historical facts related to the creation of the illusion or
information from recent neuroscientific research relating to the illusion.
Observer and facilitator notes were used to analyse the evaluation data.
Participants were invited through the following methods:
● UCL social media groups
● Personal contacts
Appendix 6: Audience Research 138
Evaluation questions
● Which of the optical illusions is most socially engaging?
● Which text version do participants prefer?
● Is the optical illusion clearly explained?
13.3. Findings
Social interaction
Focus Group 1 did not discuss any of the images of the optical illusions,
saying only that they had seen each of them before; though this group felt
they would be more likely to discuss the Rubin optical illusion (Figure 2) with
friends as it was the most abstract and reminded them of an “art piece”.
More social interaction occurred during the second focus group. This is likely
attributed to the participants themselves and not to the change in-text
explanations as their only unprompted responses occurred viewing the
images before being shown the text explanations. Participants in this group
were unfamiliar with the Duck/Rabbit optical illusion (Figure 6); this
unfamiliarity led to greater discussion among participants as one participant
could not see both images and her co-participant had to show her.
Overall, both groups demonstrated enjoyment in their interaction as smiles
and laughter were observed. Laughter occurred during both focus groups
when participants were shown the ‘Easter Sunday’ text for the Duck/Rabbit
illusion (Figure 4). Additionally, participants in Focus Group 2 laughed at each
other when one participant could not identify the second image in an optical
illusion.
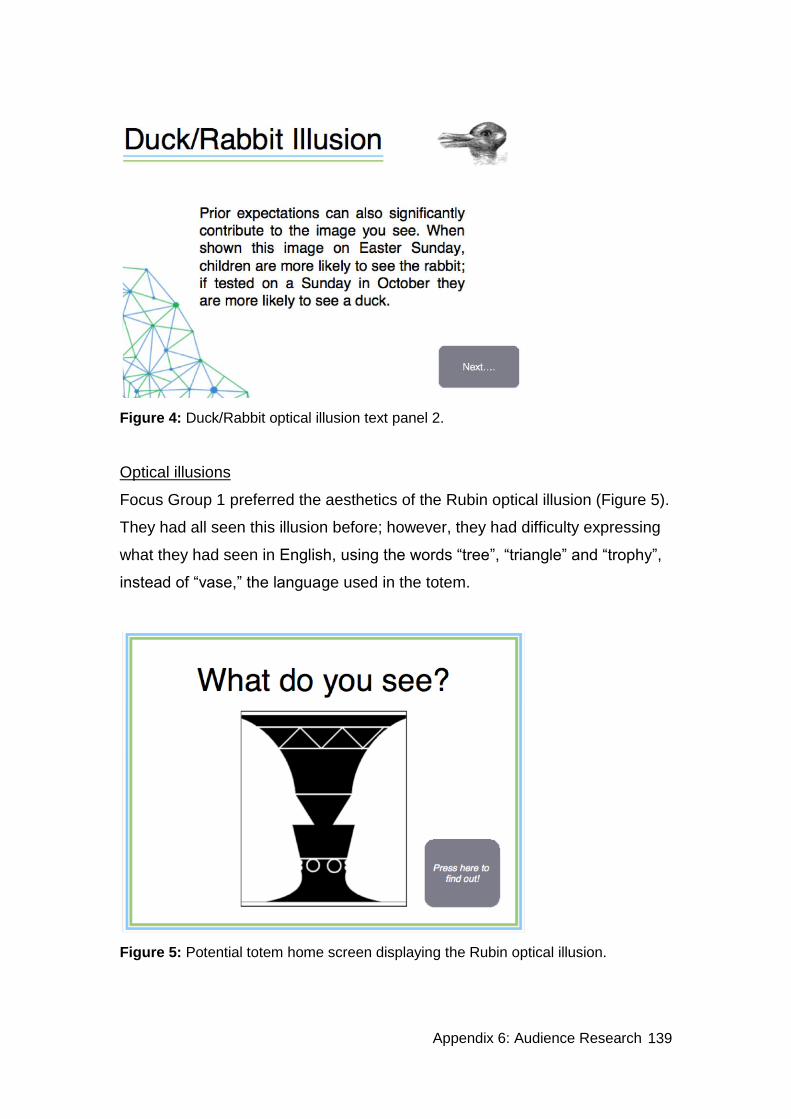
Appendix 6: Audience Research 139
Figure 4: Duck/Rabbit optical illusion text panel 2.
Optical illusions
Focus Group 1 preferred the aesthetics of the Rubin optical illusion (Figure 5).
They had all seen this illusion before; however, they had difficulty expressing
what they had seen in English, using the words “tree”, “triangle” and “trophy”,
instead of “vase,” the language used in the totem.
Figure 5: Potential totem home screen displaying the Rubin optical illusion.
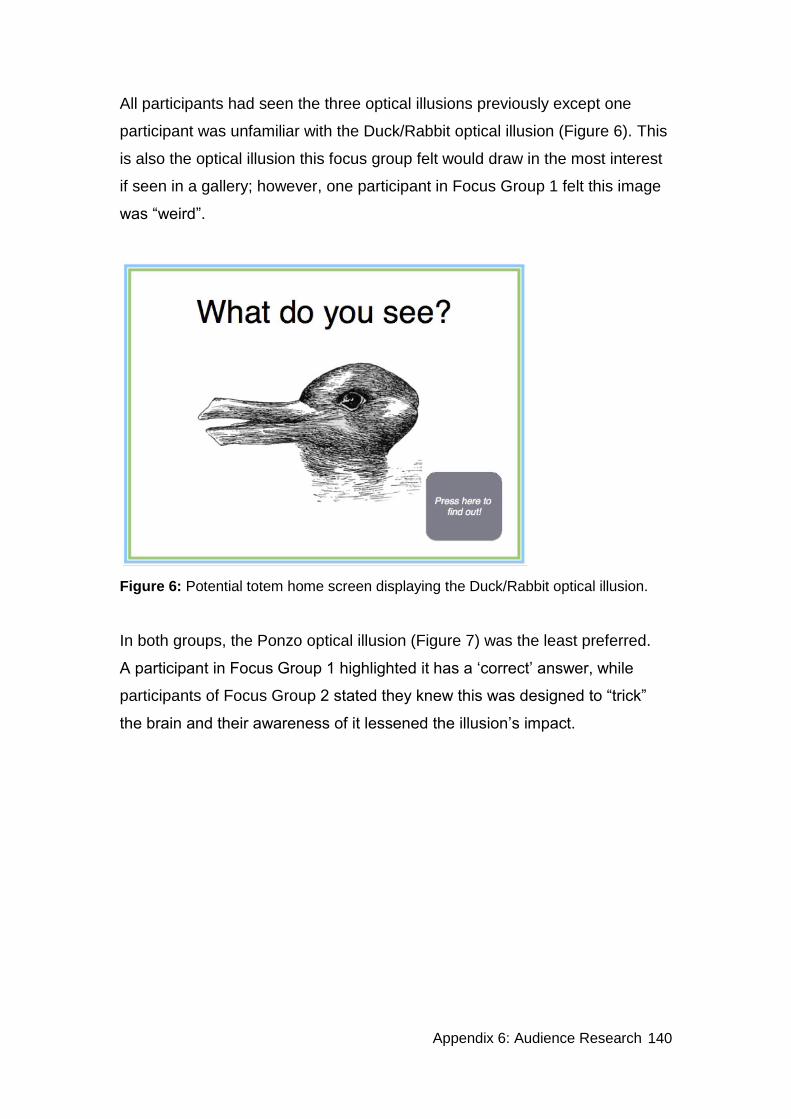
Appendix 6: Audience Research 140
All participants had seen the three optical illusions previously except one
participant was unfamiliar with the Duck/Rabbit optical illusion (Figure 6). This
is also the optical illusion this focus group felt would draw in the most interest
if seen in a gallery; however, one participant in Focus Group 1 felt this image
was “weird”.
Figure 6: Potential totem home screen displaying the Duck/Rabbit optical illusion.
In both groups, the Ponzo optical illusion (Figure 7) was the least preferred.
A participant in Focus Group 1 highlighted it has a ‘correct’ answer, while
participants of Focus Group 2 stated they knew this was designed to “trick”
the brain and their awareness of it lessened the illusion’s impact.

Appendix 6: Audience Research 141
Figure 7: Potential totem home screen displaying the Ponzo optical illusion.
Text explanations
All participants stated they liked the quality of the information for both
versions; however, both groups highlighted the need to be edited for length
and technical jargon. Focus Group 1 in particular, all of whom speak English
as a second language, identified multiple technical words including ‘fusiform’,
‘stimuli’ and the definitions of optical illusions slide (Figure 5), which impeded
their understanding and enjoyment of the activity. Participants indicated they
are not likely to engage with digital content longer than 3-5 minutes. In each
group, one participant suggested no more than 2 or 3 pages of text.
Additionally, Focus Group 1 expressed a desire to see more personal
information, the theories as to why that individual might see one image and
not another.

Appendix 6: Audience Research 142
Figure 5: Definitions of optical illusions.
13.4. Tools
Tool 1: Link to Google slide presentation to participants document for Focus
Group 1
https://drive.google.com/file/d/0B246FgbnuKTEUi1sWkhtcnFwS3c/view?usp=
sharing
Tool 2: Link to Google slide presentation to participants document for Focus
Group 2
https://drive.google.com/file/d/0B246FgbnuKTEVThDUW8yLWFJRUk/view?u
sp=sharing

Appendix 6: Audience Research 143
Tool 3: Focus group agenda

Appendix 6: Audience Research 144
Tool 4: Focus group outline
Front

Appendix 6: Audience Research 145
Reverse

Appendix 6: Audience Research 146
Tool 5: Participant consent form

Appendix 6: Audience Research 147
14. Summative Evaluation I
14.1. Executive Summary
This evaluation assessed visitor satisfaction and social interaction at the
Everyday Brain Enigmas event at the Science Museum Late Event. The
activity included three experiments: Age My Face, Oculus Rift Rollercoaster
and Navigate the World. The evaluation was developed in collaboration with
the Late Event Team and Pippa Hough, a representative from the Science
Museum.
16 rounds of observations in total were conducted at the three experiments.
Visitors were observed interacting with other visitors 249 times and interacting
with scientists 185 times. Additionally, 81 visitors who participated in at least
one experiment were invited to complete a questionnaire.
Findings
● An estimated 818 individuals visited Everyday Brain Enigmas.
● 562 visitors participated in the experiments.
● Visitors demonstrated enjoyment, both in observing and participating in
the experiments.
● A majority of the questionnaire participants found the Everyday Brain
Enigmas experiments interesting.
● About half of the participants felt positive or very positive about the
message that scientists do not know everything about how the mind or
brain works.
● Everyday Brain Enigmas was successful in changing the way half of
the participants understood the way the brain navigates and makes
sense of the world.
Recommendations for next year’s Late Event
● If enjoyment is the primary outcome, visitors demonstrated
enjoyment actively engaging with experiments.
● Including digital screens draw visitors in.

Appendix 6: Audience Research 148
● Queues naturally form. To discourage these, find a way to make
it clear that participants are chosen by the volunteers.
14.2. Methodology
This evaluation utilised two different methods: observations and a
questionnaire. Tools were developed to aid in observations (see 13.4, Tools
1, 2, and 3) and the questionnaire (see 13.4, Tool 4). It was conducted during
the Science Museum Lost in Thought Late Event, between 6:45-10pm on 27
April 2016.
The observations recorded all visitor and participation numbers as well as
participants’ interactions. Only visitors who participated in an experiment were
invited to complete a questionnaire. Seven evaluators contributed to this
evaluation including:
● 2 social interaction observers
● 3 visitor/participant number observers
● 1 questionnaire facilitator
Observations
Visitor numbers
Every 30 minutes during the event, visitors in the space were counted for 5
minutes. Visitors who only observed the experiments were counted as well as
those who actually took part in them. The estimated total number was
calculated at the end of the night.
Participant numbers
The volunteers who worked at each experiment recorded the number of
participants. Their records were gathered and combined.

Appendix 6: Audience Research 149
Participant interaction
Two observers took notes about participants’ interactions with scientists and
their interactions with each other. Each experiment had one main scientist
running the experiment and a second scientist with a name tag answering
questions and providing explanations among the non-participants.
● Before the evaluation was conducted, the observers preliminarily
decided on codes for types of interactions.
● At the beginning of observation, a 5-minute pilot observation was
conducted to test the observation tool.
● Halfway through the evaluations, the observers took 20 minutes to
compare and standardise their observation codes.
Questionnaire
Audience feedback was collected through a questionnaire with three closed
questions (see 13.4, Tool 5). Participants were asked to choose the icons that
correspond to their opinions and feelings.
Before handing participants the questionnaire, evaluators explained to them
that it was specific to the three Everyday Brain Enigmas experiments and they
only need to rate the activity/activities he/she took part in. For those who gave
specific negative feedbacks, evaluators encouraged them expand on their
reasons briefly.
The Audience Research team tried to keep the disturbance to visitors at a
minimum level while gaining useful information.
● The participants were randomly chosen by evaluators from the target
audience: those who had finished an experiment.
● The questionnaire was handed to participants with a clipboard and
pencil.
● The icons with captions helped participants understand the options
directly and quickly.

Appendix 6: Audience Research 150
After the event, all observation and questionnaire tools were combined in a
Google sheet for analysis (see 13.4 tool 5).
Evaluation questions
Observation
● How many visitors did Everyday Brain Enigmas have?
● How many participants did the three experiments have?
● Did visitors interact with the scientists as well as other visitors?
Questionnaire
● Were participants interested in the activity?
● What are participants’ attitudes about scientists not currently having all
the answers?
● Did participants’ understanding of how the brain navigates and makes
sense of the world change?
14.3. Findings
Visitor numbers
The usual Science Museum method for visitor number approximations is to
multiply half hour observations by 6; however, this method assumes a much
shorter dwell time than observed. In consultation with the Late Event Team,
the Audience Research Team decided to instead multiply the recorded visitor
numbers by 2, assuming a 15-minute dwell time. As per this method,
Everyday Brain Enigmas had an approximated total visitor number of 818.

Appendix 6: Audience Research 151
Figure 1: The counted audience number and estimated number.
Participant numbers
562 visitors participated in the three experiments. Age My Face received the
most participants (308) due to its ability to have multiple participants for each
session (Figure 2).
Figure 2: The number of participants at each experiment.
0
20
40
60
80
100
120
140
160
180
19:00-19:05 19:35-19:40 20:00-20:05 20:35-20:40 21:00-21:05 21:35-21:40
Visitor Numbers
Visitor Number Approximated Number
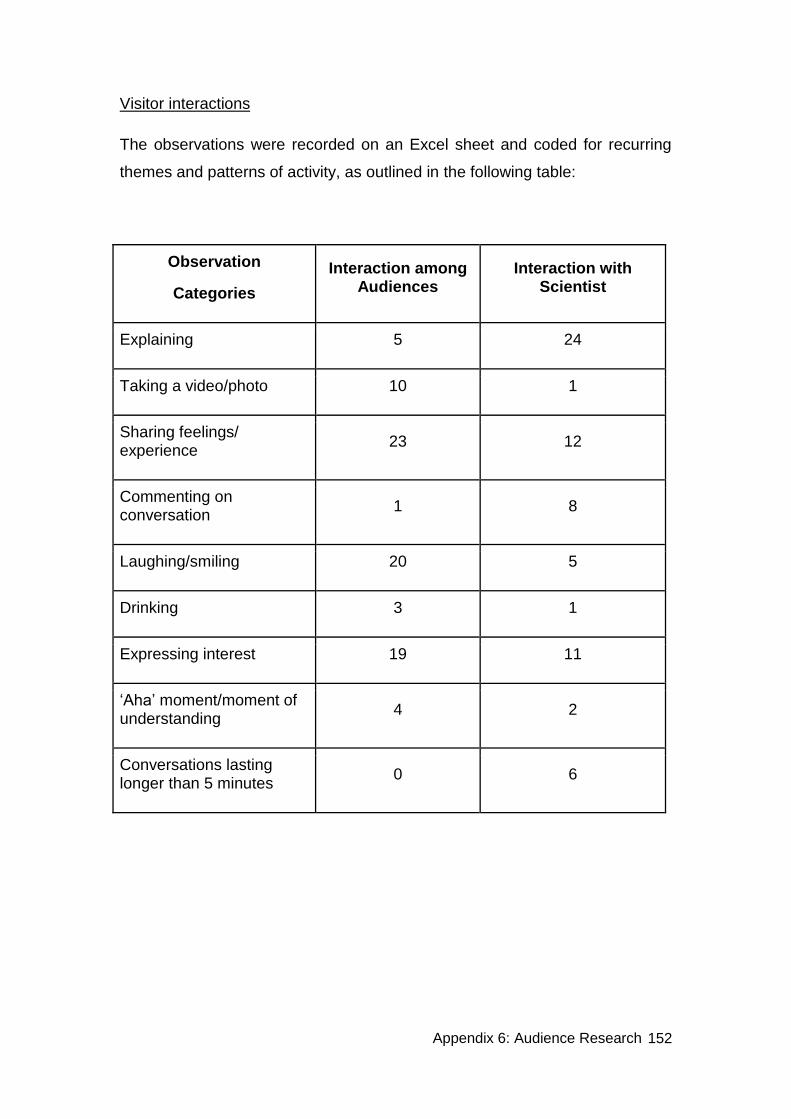
Appendix 6: Audience Research 152
Visitor interactions
The observations were recorded on an Excel sheet and coded for recurring
themes and patterns of activity, as outlined in the following table:
Observation
Categories
Interaction among Audiences
Interaction with Scientist
Explaining 5 24
Taking a video/photo 10 1
Sharing feelings/ experience
23 12
Commenting on conversation
1 8
Laughing/smiling 20 5
Drinking 3 1
Expressing interest 19 11
‘Aha’ moment/moment of understanding
4 2
Conversations lasting longer than 5 minutes
0 6

Appendix 6: Audience Research 153
Notable examples of each interaction are outlined below:
Observation
Categories
Interaction among Audiences
Interaction with Scientist
Explaining Explaining the phenomena being experimented in
another language to friend
"What do I need to do" during experiment setup
Taking a video/photo Filming each other
doing the experiment
Conversation about recording the experiment
Sharing feelings/ experience
2 unrelated participants
discussed their reactions to the
experiment; 1 liked it, another didn't; the 1 who liked it smiled a lot, the 1 who didn't
was woozy
Expression of surprise
Commenting on conversation
Mostly converse among selves, not to
scientist
Progressively asked longer questions and
received longer answers in response
Laughing/smiling Smiles Post-experiment smiling
Drinking "Hold my beer"
Discussing difficulty of writing while drinking
Expressing interest Looking over participant's shoulders
"Can we have a go?"
“Aha” moment/moment of understanding
Many experiencing the ‘aha moment
when they figure out what they are
Aha moment
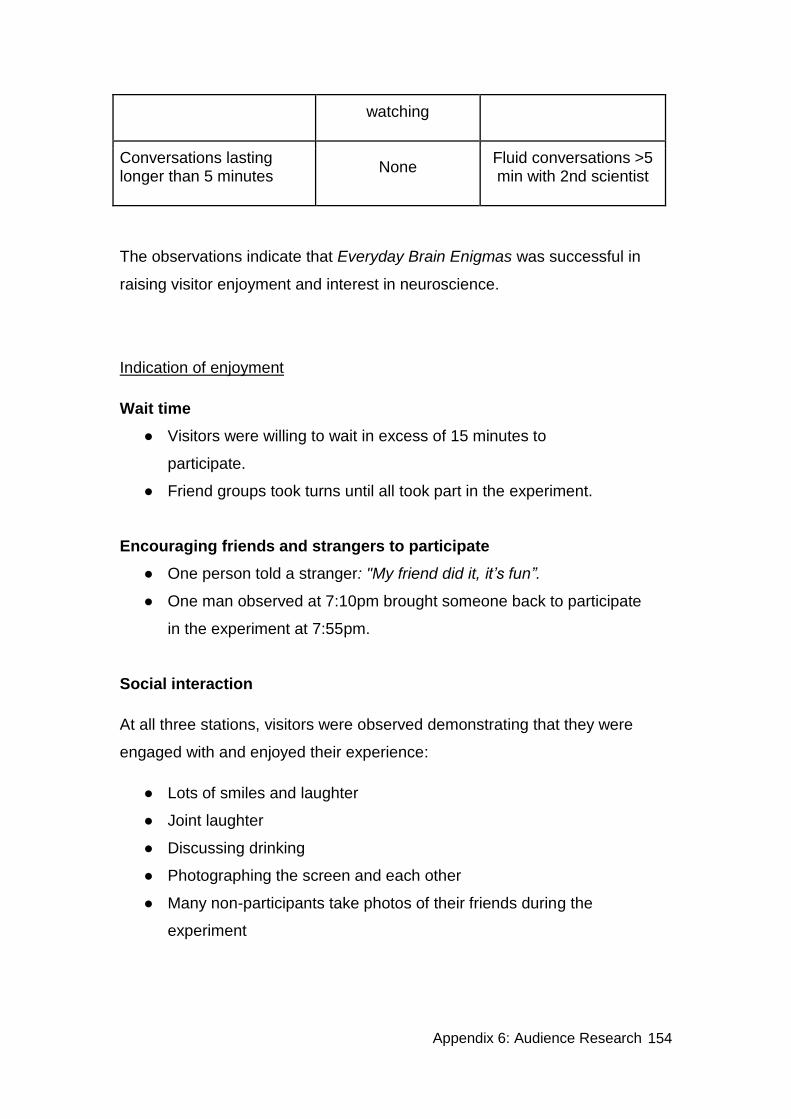
Appendix 6: Audience Research 154
watching
Conversations lasting longer than 5 minutes
None Fluid conversations >5 min with 2nd scientist
The observations indicate that Everyday Brain Enigmas was successful in
raising visitor enjoyment and interest in neuroscience.
Indication of enjoyment
Wait time
● Visitors were willing to wait in excess of 15 minutes to
participate.
● Friend groups took turns until all took part in the experiment.
Encouraging friends and strangers to participate
● One person told a stranger: "My friend did it, it’s fun”.
● One man observed at 7:10pm brought someone back to participate
in the experiment at 7:55pm.
Social interaction
At all three stations, visitors were observed demonstrating that they were
engaged with and enjoyed their experience:
● Lots of smiles and laughter
● Joint laughter
● Discussing drinking
● Photographing the screen and each other
● Many non-participants take photos of their friends during the
experiment
Appendix 6: Audience Research 155
Indication of interest
Demonstrating curiosity
● "How'd it go?"
● "What's going on here?"
● "What is this? Can I do it?"
● Participants looked over the shoulders of other participants for
better viewing.
Actively engaging in the experiment
Participants at the Age My Face experiment were concentrated and
serious, paying close attention to the screen.
Demonstrating pride when their answers or accomplishment after
participating in the experiment.
Inspiring discussion of related topics
● 1 participant expressed his own desire to buy VR headset.
● "How much do those [VR goggles] cost?"
● Strangers discussed experiment results among themselves.
● Visitors discussed similar experiments they were aware of.
● Visitors talked about the results to the scientist.
● Older man asked for clarification about how the results of the
experiment would be used.
● 1 participant discussed with a scientist for over two minutes the
results and concept of the experiment, leading to personal
questions.
● 1 participant actively directed a conversation with the scientist
saying: "Have you heard of this experiment ...?"
Social Interaction
The experiments were successful in encouraging social interaction among
visitors and with scientists:

Appendix 6: Audience Research 156
● Frequently the friend of the participant would be drawn into
conversation with the scientist through the participant.
● Those not participating talk more to the second scientist.
● Non-participants explain the experiment to each other.
● Mostly converse among selves, not to scientist.
● Participants encourage non-participants to join.
● One person told a stranger "My friend did it, it’s fun".
● Taking to non-friend groups while their friend participated in the
experiment.
● Mostly participants interacted with scientist during experiment setting
up as questions and answer interactions.
Comparing social interactions
The data suggests the visitors received more enjoyment from their social
interactions with each other than with the scientists; the former evoked 20
instances of laughing or smiling, while only 5 were observed from the latter.
Participants were most often observed interacting with scientists in order to
listen to their explanations of the experiments. The observation of non-
participants drinking and taking video/photographs of each other also
demonstrated that the visitors were relaxed with each other. However, there
were no observations that indicated outright discomfort with the scientists.
Differences in the duration of the conversation were observed. There were 6
visitor groups having deep communication with scientists, such as:
● Fluid conversations >5 min with 2nd scientist x3
● 3 participants from one friend group in a long (>5) conversation with
second scientist while jointly observing current participants
No conversations among audiences longer than 5 minutes were observed.
Part of the reason that can explain the phenomenon is that the core topic of
communication between participants and scientists is explanation of the
experiment, while the audiences themselves were mainly sharing feelings and
experiences with each other (Figure 3).

Appendix 6: Audience Research 157
Figure 3: The comparison of core topic between two kinds of interactions.
Level of interest
When being asked “Did you find the Everyday Brain Enigmas experiments
interesting?”, 71 of the 81 participants chose “very much” or “very”. Only 1
participant felt the ‘Age My Face’ is not that interesting (Figure 4).
Figure 4: Participant answers to Question 1.

Appendix 6: Audience Research 158
Recognition and acceptance of science not having definite answers
The Everyday Brain Enigmas tried to formulate personal opinions about
current neuroscientific research. Participants were asked to rate their attitude
regarding “scientists not having definite answers”.
48 of 81 participants found it is “Positive” or “Very Positive” that scientists do
not have definite answers and are continuing to conduct research; 27 of 81
were neutral on the subject. Only 4 felt upset about the fact and 2 declined to
provide their personal opinion about the issue (Figure 5).
Figure 5: Participant answers to Question 2.
Change of understanding of brain
When asked if their understanding of how the brain navigates and makes
sense of the world changed, 40 of 81 visitors who took part into the
experiments said “Yes”, 23 said “No,” while 18 responded “I don’t know”
(Figure 6).

Appendix 6: Audience Research 159
Figure 6: Participant answers to Question 3.
A few of the participants that responded “no” explained why they did not
change their understanding after taking part into experiments.
● “Three experiments are not enough”
● “It is only one experiment”
● “I did not have chance to communicate with scientist”
● “I already knew this. It is just good experience”
● “This is just the thing you do. Not any context”
● “The environment is too loud”
● “I need more experiments, but I want to know more now”

Appendix 6: Audience Research 160
13.4. Tools
Tool 1: Visitor Numbers Form
Tool 2: Observation Form A
Appendix 6: Audience Research 161
Tool 3: Observation Form B

Appendix 6: Audience Research 162
Tool 4: Questionnaire
Tool 5: Google document
https://docs.google.com/spreadsheets/d/1oSw6rYOmCOysqHTT1VHqT47er6
vWsiWzE7-6U8OWSiw/edit#gid=0