auckland district health board hospital advisory committee ... · pdf fileauckland district...
TRANSCRIPT

Auckland District Health Board
Hospital Advisory Committee Meeting
Wednesday 15 February 2012
9.30am
A+ Trust Room
Clinical Education Centre
Level 5
Auckland City Hospital
Hei Oranga Tika Mo Te Iti Me Te Rahi Healthy Communities, Quality Healthcare


1
ATTENDANCE AND APOLOGIES
1

2

2
CONFLICTS OF INTEREST
3

4

Conf l ic ts o f In terest Quick Reference Guide
Under the NZ Public Health and Disability Act Board members must disclose all interests, and the full nature of the interest, as soon as practicable after the relevant facts come to his or her knowledge. An “interest” can include, but is not limited to:
Being a party to, or deriving a financial benefit from, a transaction. Having a financial interest in another party to a transaction. Being a director, member, official, partner or trustee of another party to a transaction or a
person who will or may derive a financial benefit from it. Being the parent, child, spouse or partner of another person or party who will or may derive a
financial benefit from the transaction. Being otherwise directly or indirectly interested in the transaction.
If the interest is so remote or insignificant that it cannot reasonably be regarded as likely to influence the Board member in carrying out duties under the Act then he or she may not be “interested in the transaction”. The Board should generally make this decision, not the individual concerned. Gifts and offers of hospitality or sponsorship could be perceived as influencing your activities as a Board member and are unlikely to be appropriate in any circumstances.
When a disclosure is made the Board member concerned must not take part in any deliberation or decision of the Board relating to the transaction, or be included in any quorum or decision, or sign any documents related to the transaction.
The disclosure must be recorded in the minutes of the next meeting and entered into the interests register.
The member can take part in deliberations (but not any decision) of the Board in relation to the transaction if the majority of other members of the Board permit the member to do so.
If this occurs, the minutes of the meeting must record the permission given and the majority’s reasons for doing so, along with what the member said during any deliberation of the Board relating to the transaction concerned.
IMPORTANT If in doubt – declare. Ensure the full nature of the interest is disclosed, not just the existence of the interest. This sheet provides summary information only - refer to clause 36, schedule 3 of the New Zealand Public Health and Disability Act 2000 and the Crown Entities Act 2004 for further information (available at www.legisaltion.govt.nz) and “Managing Conflicts of Interest – Guidance for Public Entities” (www.oag.govt.nz ).
5

6

ADHB BOARD AND COMMITTEE (HAC) INTERESTS REGISTER
NAME OF
BOARD
MEMBER
ORGANISATION ROLE FINANCIAL
INTEREST NATURE OF
INTEREST DATE OF
LATEST
DISCLOSURE
Lester LEVY (Chair)
University of Auckland Business School New Zealand Leadership Institute Health Benefits Limited Tonkin & Taylor Waitemata District Health Board A+ Trust
Professor of Leadership Chief Executive Deputy Chair Independent Chairman Chairman Trustee
31 May 2011
Jo AGNEW Professional Teaching Fellow, School of Nursing, Auckland University Casual Staff Nurse ADHB
Salary Salary
9 September 2011
Peter AITKEN
Pharmacist Pharmacy Care Systems Ltd Pharmacy New Lynn Medical Centre
Pharmacy Locum Shareholder/ Director, Consultant Owner
Hourly Fee
Medical Centre development and pharmacy lease
18 January 2012
Judith BASSETT
Nil 9 December 2010
7

NAME OF
BOARD
MEMBER
ORGANISATION ROLE FINANCIAL
INTEREST NATURE OF
INTEREST DATE OF
LATEST
DISCLOSURE Susan BUCKLAND
Writing, editing and public relations services Medical Council of NZ Occupational Therapy Board Northern Regional Ethics Committee
Self-employed Professional Conduct Committee member Professional Conduct Committee member Member
Fees Hourly fee Hourly fee Fee
Writer, editor and public relations services Lay member of PCC set up to hear complaints brought to Medical Council and to determine outcomes Lay member of PCC to assess complaints and determine outcomes
7 August 2009
Dr Chris CHAMBERS
Employee, Auckland District Health Board Wife employed by Starship Trauma Service Clinical Senior Lecturer in Anaesthesia Auckland Clinical School Associate, Epsom Anaesthetic Group Member, ASMS Shareholder, Ormiston Surgical
20 April 2011
8

NAME OF
BOARD
MEMBER
ORGANISATION ROLE FINANCIAL
INTEREST NATURE OF
INTEREST DATE OF
LATEST
DISCLOSURE
Rob COOPER
Ngati Hine Health Trust James Henare Research Centre, University of Auckland Whanau Ora Governance Group National Health Board Waitemata District Health Board
Chief Executive Board Member Chair Member Member
Salary No fee Fee (to Ngati Hine Health Trust Fee (to Ngati Hine Health Trust Fee (to Ngati Hine Health Trust
Management of a Health, Disabilities, Social & Education Services Trust Advisory Assists in the development of Government’s Whanau Ora policy
25 February 2011
Lee MATHIAS
Lee Mathias Limited Midwifery and Maternity Providers Organisation Limited Pictor Limited John Seabrook Holdings Limited AuPairlink Limited
Managing Director Director Shareholder, Director Director Governance Advisor
Fee Fee paid to Lee Mathias Limited Fee No fee Fee
Shareholder, director, independent directorships and healthcare services consulting Provider of business and professional services to midwives and other maternity services providers Biotech start-up focussing on diagnostic products Estate of late husband Provider of early childhood education
1 November 2011
9
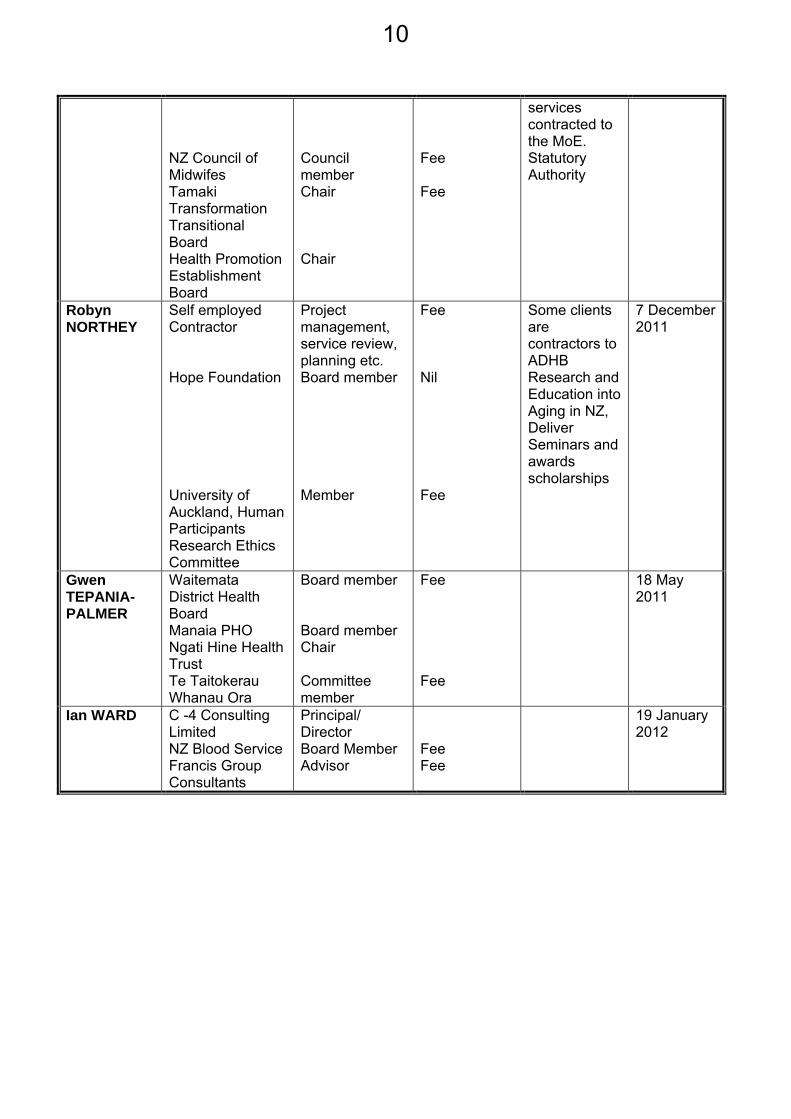
NZ Council of Midwifes Tamaki Transformation Transitional Board Health Promotion Establishment Board
Council member Chair Chair
Fee Fee
services contracted to the MoE. Statutory Authority
Robyn NORTHEY
Self employed Contractor Hope Foundation University of Auckland, Human Participants Research Ethics Committee
Project management, service review, planning etc. Board member Member
Fee Nil Fee
Some clients are contractors to ADHB Research and Education into Aging in NZ, Deliver Seminars and awards scholarships
7 December 2011
Gwen TEPANIA-PALMER
Waitemata District Health Board Manaia PHO Ngati Hine Health Trust Te Taitokerau Whanau Ora
Board member Board member Chair Committee member
Fee Fee
18 May 2011
Ian WARD C -4 Consulting Limited NZ Blood Service Francis Group Consultants
Principal/ Director Board Member Advisor
Fee Fee
19 January 2012
10

2.0 Board and Committee Interests Schedule HAC 2012.doc
NAME OF
BOARD
MEMBER
ORGANISATION ROLE FINANCIAL
INTEREST NATURE OF
INTEREST DATE OF
LATEST
DISCLOSURE
Anne KOLBE
Private Paediatric Surgical Practice Employee Communio NZ Siggins Miller, Australia Head, Auckland Clinical School, School of Medicine, University of Auckland Husband: Employee University of Auckland Risk and Audit Committee Whanganui District Health Board Pharmac Board National Health Committee
Director Senior Consultant Senior Consultant Employee Member Member Chair
Joint Owner Contractor Contractor Salary Fee Fee Fee
1 June 2011
11

12

3
CONFIRMATION OF MINUTES
7 DECEMBER 2011
13

14

Hospital Advisory CommitteeM i n u t e s
MEETING DETAILS
Time and Date 9:30am, Wednesday, 7 December 2011
Venue A+ Trust Room, Clinical Education Centre, Level 5, Auckland City Hospital, Grafton
1 ATTENDANCE AND APOLOGIES
The Chair declared the meeting open at 9:30am.
Taima Campbell introduced Susan Aitkenhead, Nurse Director Children’s Health to the Committee. Susan advised that the Starship building was a challenge in terms of space and infection control but staff were willing to move forward with different approaches to innovative models of care. The committee thanked Susan Aitkenhead for her attendance and noted her positive approach to the challenges ahead.
Committee Members Judith Bassett (Chair) Jo Agnew Rob Cooper Dr Chris Chambers Dr Lester Levy Dr Lee Mathias Robyn Northey Gwen Tepania Palmer Ian Ward Associate Professor Anne Kolbe Management in Attendance Garry Smith - Chief Executive Dr Margaret Wilsher – Chief Medical Officer Brent Wiseman – Chief Financial Officer Greg Balla – Director Performance and Innovation Ngaire Buchanan – General Manager Operations Taima Campbell – Executive Director of Nursing Hilda Fa’asalele – General Manager Pacific Health Janice Mueller – Executive Director of Allied Health, Scientific and Technical Ian Bell - Board Administrator
Apologies Apologies had been received from Peter Aitken (leave of absence) and Susan Buckland.
Moved Robyn Northey, seconded Anne Kolbe
That the apologies be sustained.
Carried
2 CONFLICTS OF INTEREST
There were no declarations of conflicts of interest for any item on the agenda. Robyn Northey advised that she was now a member of the University of Auckland Human Participants Research Ethics Committee.
15

3 CONFIRMATION OF MINUTES 2 NOVEMBER 2011
Moved Ian Ward; seconded Gwen Tepania-Palmer
That the minutes of the Hospital Advisory Committee meeting held on 2 November 2011 with the amendment that the new Clinical Director General Medicine be invited to the March 2012 meeting be confirmed as a true and correct record.
Carried
Matters arising Remanufacturing was being investigated by HBL at the national level.
Staff were being recruited for the Greenlane Surgical Unit so outsourcing had been done early and would reduce as the service develops capacity. Some theatres had been opened but there was still more staff required.
4 ACTION POINTS 2 NOVEMBER 2011
St Johns’ Data The data was being obtained and reviewed, with a report to come to the March meeting.
4.1 Nurse Entry to Practice Programme (NETP) Including Maori and Pacific New Graduates
The report related to the intake for January 2012 with the total appointed being 79. There was competition in the market. New graduates apply everywhere and then accept a position at their DHB of preference. Counties Manukau has support programmes and in many cases Counties Manukau is closer to residences for Maori and Pacific graduates. Twenty-two of the Maori/Pacific applicants to ADHB had accepted positions elsewhere. Waitemata did not have many Maori and Pacific applicants.
Discussions with school students began at Level 12 to encourage them into health careers. There was a Pacific initiative to encourage students to study sciences so that they can lead into a health career. Biology, maths and English were requirements. Students needed to know how to plan at an early stage so as not to close down later career options.
The Directors of Nursing across the region did discuss recruitment but each DHBs practice was different, related to different funding and there was competition. A+ Trust has a scholarship programme. There was a suggestion that the many Maori/Pacific hotel service staff working for the Board be used as a link to draw their children’s attention to health related careers. There was a need for ADHB to be the employer of choice through being considered the best and most innovative place to work.
The Government’s voluntary bonding scheme, which included debt relief, applied for Counties Manukau and Waitemata but not for Auckland and it had been raised with the Minister that it should apply to all DHBs in the Auckland region and Maori and Pacific. Maori and Pacific student have priority for placements and the volume of placements had increased. The problem was still the relatively small number completing courses, although retention was quite good.
The Committee suggested earlier action to contact students in schools and supported the recent changes in processes. They requested a report in six months on Maori and Pacific participation not only nursing and midwifery but also in the allied workforce.
25 cadets were starting on 3 November for work experience over the summer, with interest being very high.
16

4.2 Inventory management
The report was noted. A further paper to come in March 2012 will include showing the supply chain, what the national inventory looked like and the purchasing model, including what went into that model.
The inventory turn rate was low and there were significant opportunities for improvement i.e. number of stores and other local opportunities. HBL was handling the national approach.
Presentation – Cancer and Blood HSG
Dr Richard Sullivan and Fionnagh Dougan were in attendance.
The presentation covered cancer control, the national view, projected growth in cancer registrations with expected large increases in growth with demand projected at 89% nationally and 100% for Auckland as Auckland treated 37% of the national population. The big increase was with cancers in over 60s with only a small number of cancers in children. Nationally 7,500 adults were diagnosed each year and approximately 150 children. Where the services were delivered nationally was shown.
The Northern Cancer Network was outlined and there were opportunities to rethink governance, noting the coming increase in demand. Key challenges were how to work differently, an increase in cancer specific treatments and rising consumer expectations. A patient pathway approach was being taken, illustrated by the oncology model of care and there was a need to increase bone marrow transplantation capacity. A health improvement plan was being developed to improve the patient journey, reduce risks of developing cancers, provide equity of outcomes and effectively use findings from research. ADHB’s priorities were the patient pathway including advance care plans as half of people treated will die of the cancer. Early studies had shown inequities in the treatment of lung cancer and these had been addressed, but no inequities in the treatment of bowel cancer. There was a Cancer Network Maori Leadership Group.
The current achievements were noted as was the tumour stream model.
The Committee thanked Dr Sullivan for his presentation particularly appreciating the proactive approach being taken and how quickly improvements had been made.
5.1 Operational Performance Report
The Members had found the report confusing particularly in relation to volumes, revenue and accounting which swung between numbers and WIES. Further work would be done on presentation and trying to have more lucid explanation. Part of the complexity was the different accounting around clinical episodes and distinguishing between services for ADHB’s population and what for IDFs.
There needed to be a degree of confidence in workout plans based on evidence and assessment of potential risks. Tools used were to look at the bottom three and their plans to get back on track. There were still some gaps in connectivity, for example orthopaedics had more resources but had not aligned with theatre availability. The improvements in production planning could take 2 years.
Predictions for the cardiac waiting list were February, 92 and April, 75 however there may not be the sustained referral rate over the holiday season.
17

9.1 Resolution to Exclude the Public
Moved Judith Bassett; seconded Robyn Northey
That the exclusion of the public from the relevant part of the meeting is necessary to enable the Board to deliberate in private on a decision or recommendation as to whether any of the grounds in paragraphs (a) to (d) of clause 32 of Schedule 3 of the Act are established in relation to all or any part of the meeting.
1. THAT the public be excluded from the following part of the proceedings of this meeting, namely consideration of items 9 to of the Agenda.
The general subject of the matters to be considered while the public is excluded, the reason for passing this resolution in relation to each matter, and the specific grounds under the above clause for the passing of this resolution are as follows:
General subject o f each matter to be considered:
Reason for passing this resolution in relation to each matter:
Ground(s) under clause 34 for the passing of this resolution:
9.1 Confidential HAC Minutes
2 November 2011 9.2 R isk 9.3 Quality 9.4 Q uality Improvement
Savings
To enable the Board to carry on without prejudice or disadvantage commercial activities and negotiations: Offic ial Information Act 1982 s.9(2)(i) and s.9(2)(j)
That the public conduct o f the relevant part of the meeting would be likely to result inthe disclosure of information for which good reason for withholding would exist under s 9 of th e Offic ial Information Act 1982.
Carried
Items discussed in public exclusion were confidential minutes 2 November 2011, the Risk Register and Quality.
Moved Judith Bassett; seconded Lee Mathias
That the meeting resume in public.
Carried
NEXT MEETING
The meeting closed at 11:46am.
The next meeting is scheduled for 10:30am, Wednesday, 15 February 2012 A+ Trust Room, Level 5 Clinical Education Centre Auckland City Hospital Grafton
CONFIRMED CHAIR: DATE:
18

4
ACTION POINTS
7 DECEMBER 2011
19

20

Hospital Advisory Committee Action Points from the meeting on Wednesday 7 December 2011
Item Detail Designated Action Carried forward
Report from St John’s data on where 80+ patients go
Ngaire Buchanan March
Carried forward
Report on the reorganisation of General Medicine. The new Clinical Director would be invited to the March meeting.
Margaret Wilsher March 2012
4.1 A report in six months was requested on programmes for recruiting Maori and Pacific nurses and midwives and also on Maori and Pacific participation in the allied workforce.
Taima Campbell Janice Mueller
June 2012
4.2 A further paper to come in March 2012 on inventory management. It will include showing the supply chain, a view of national inventory and the purchasing model.
Greg Balla Brent Wiseman
March 2012
5.1 The Operational Performance Report was confusing. Further work would be done on presentation and trying to have more easily understood explanation.
Greg Ball Ngaire Buchanan
Noted
A report on how many new graduates had been placed in Te Whetu Tawera and their retention rate in that unit was requested.
Taima Campbell Verbal Update
A short report on the “not signed off” histology reports was requested.
Margaret Wilsher To be emailed.
21

22

5
PROVIDER OPERATIONAL PERFORMANCE REPORT
5.1 Operational Performance Report
5.2 Health Target Updates
23

24

5.1 Operat ional Per formance Repor t
25

26

Contents (with lead HAC attendee)
1. Overview – G Balla
2. Acute services performance – Dr M Wilsher
3. Elective services performance – Dr M Wilsher
4. Productivity – G Balla
4.1 Improvement projects G Balla
4.2 Savings schedule progress G Balla
5. Financial performance – B Wiseman
Appendix 1 Operating Statement December 2011
27

1. Overview – Greg Balla
Overall Assessment
The provider arm experienced a strong month for volumes and the resulting internal revenue allocation. Although WIES funded activity was just on plan for the month, there was a “catch up” of 260 WIES related to previous months – resulting in revenue of $1.2M. Non DRG were a further $2.1M ahead of budget. The total revenue upside compared to budget of $4.2M was the largest single contributor to the bottom line variance of $3.2M favourable for the month.
Staffing costs comprise approximately two-thirds of Provider operational expenditure and were unfavourable for the month. They remain a key focus for management– in terms of staff numbers and average costs.
Outsource costs remain high as services seek to maximise elective outputs.
Financial
Month
Against a budgeted deficit of $(7.6)M for the month of December, the provider arm reported a deficit of $(4.4)M, favourable to budget by $3.2M F.
Revenue was favourable to budget by $4.2M F for the month while operating costs were $(1.9)M U and non operating costs were favourable by $0.9M.
YTD
Against a budgeted surplus of $0.6M for YTD December, the provider arm reported a deficit of $3.3M, unfavourable to budget by $(3.9)M U.
Revenue was favourable to budget by $0.5M F YTD while operating costs were $(7.8)M U and non operating costs were favourable by $3.4M F.
FTE numbers for the month of December were unfavourable to the original budget by (40) FTE after normalising for the outsourced staff (unfavourable by $(1.1)M U). December YTD FTE were 8 FTE unfavourable to budget (unfavourable by $(2.7)M).
A summary P&L is in Appendix 1.
FTEs
As noted in Section 5.3 the Provider is now over the original budget for the month on FTE numbers by (40) after normalising for outsourced staff. The challenge for the Provider is to maintain service delivery within budgeted FTE. Each HSG is responsible for the management of this requirement.
28
Volume Related Variance (cf. Plan)
Monthly inpatient production was 10,252 WIES compared to a plan of 10,238 WIES (100%). YTD production has been 63,702 WIES compared to a plan of 63,598 WIES (100%).
Monthly production for non inpatient services was 110% (101% YTD).
Interpretation Note
The ADHB Provider for which results are presented here comprises the “operational” areas such as Adult
Health, Cancer & Blood and Cardiac as well as “functional” services such as Finance, HR and IS which
support the operational areas and finally “complementary” services such as Public Health, A+ Trust,
Research and the retail businesses.
WIES – weighted inlier equivalent separations – a weighting assigned to patients indicating the level of
resources employed in treating the patient’s condition – used as a proxy for complexity:-
Average WIES for coronary bypass ≈ 6 – 10 wies per case
Average WIES for hernia procedures without complication ≈ 1 wies per case
Average WIES for paediatric tonsillectomy ≈ 0.5 – 0.6 wies per case
29

2. Acute services performance – Margaret Wilsher
The tables which follow show firstly the number of acute discharges (numbers of patients) this year compared to last year and secondly the number of WIES compared to the plan for the year. Wies represents patient numbers with a weighting for complexity.
Acute Patient Numbers
Financial Year Jul Aug Sep Oct Nov Dec Grand Total
Last Year
8,182
8,121
8,076
8,070
7,974
8,109 48,532
This Year
7,991
8,118
8,256
8,029
7,741
7,889 48,024
Acute patient numbers are down on the same period last year.
Acute (WIES)
DHB Actual YTD Variance to Plan % of completion
ADHB 25,452 345 101%
CMDHB 6,400 68 101%
WDHB 8,774 (733) 92%
NLDHB 2,731 434 119%
Other DHBs 3,481 1 100%
Total volume 46,838 115 100%
Interpretation Note
We have been asked previously to provide additional ethnicity based data in the HAC report. The following
charts were provided last month. They show total acute wies for Maori and Pacific people – absolute
numbers of wies and as a share of all acute wies. We acknowledge that the information they contain can be
ambiguous – if the share of acute wies for Maori or Pacific People is higher than their population share this
can indicate unmet need in the community, conversely if the share of acute wies for Maori or Pacific People
is lower than their population share this can indicate access issues. Hospital management have
30
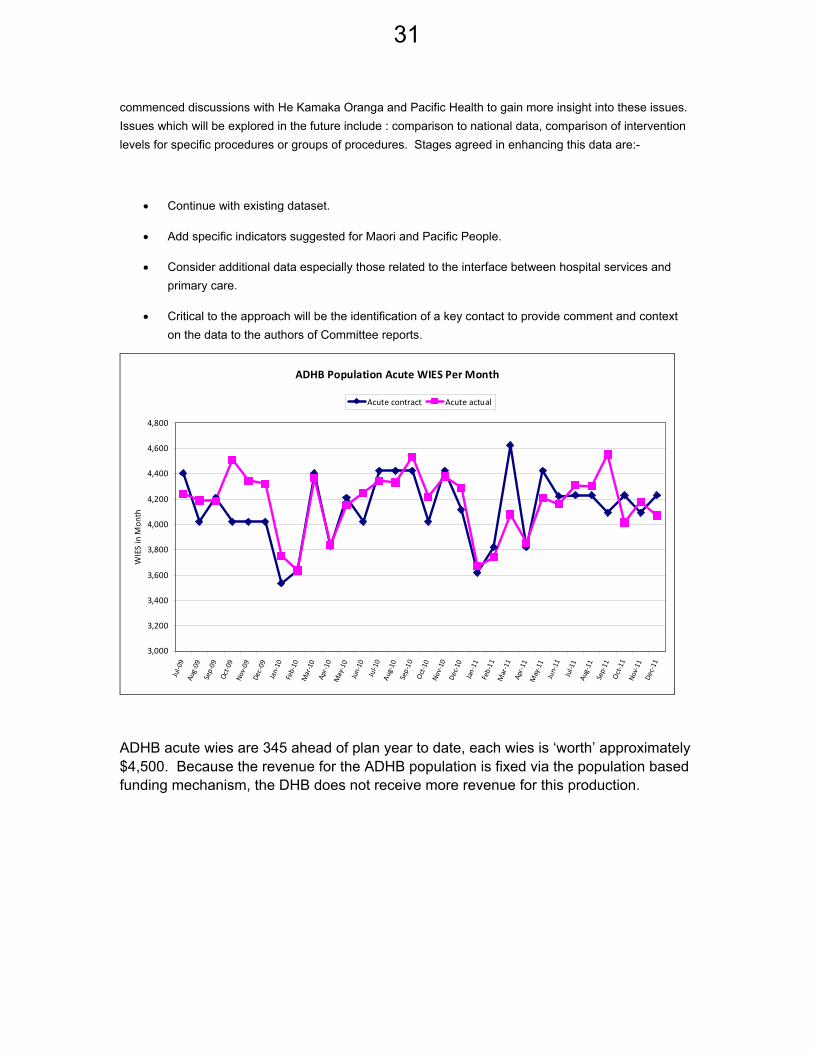
commenced discussions with He Kamaka Oranga and Pacific Health to gain more insight into these issues.
Issues which will be explored in the future include : comparison to national data, comparison of intervention
levels for specific procedures or groups of procedures. Stages agreed in enhancing this data are:-
Continue with existing dataset.
Add specific indicators suggested for Maori and Pacific People.
Consider additional data especially those related to the interface between hospital services and
primary care.
Critical to the approach will be the identification of a key contact to provide comment and context
on the data to the authors of Committee reports.
ADHB Population Acute WIES Per Month
3,000
3,200
3,400
3,600
3,800
4,000
4,200
4,400
4,600
4,800
Jul‐09
Aug‐09
Sep‐09
Oct‐09
Nov‐09
Dec‐09
Jan‐10
Feb‐10
Mar‐10
Apr‐10
May‐10
Jun‐10
Jul‐10
Aug‐10
Sep‐10
Oct‐10
Nov‐10
Dec‐10
Jan‐11
Feb‐11
Mar‐11
Apr‐11
May‐11
Jun‐11
Jul‐11
Aug‐11
Sep‐11
Oct‐11
Nov‐11
Dec‐11
WIES in M
onth
Acute contract Acute actual
ADHB acute wies are 345 ahead of plan year to date, each wies is ‘worth’ approximately $4,500. Because the revenue for the ADHB population is fixed via the population based funding mechanism, the DHB does not receive more revenue for this production.
31

Acute Data Maori
0
50
100
150
200
250
300
350
400
450
500
Jul-09
Aug-09
Sep-09
Oct-09
Nov-09
Dec-09
Jan-10
Feb-10
Mar-10
Apr-10
May-10
Jun-10
Jul-10
Aug-10
Sep-10
Oct-10
Nov-10
Dec-10
Jan-11
Feb-11
Mar-11
Apr-11
May-11
Jun-11
Jul-11
Aug-11
Sep-11
Oct-11
Nov-11
Dec-11
0.0%
2.0%
4.0%
6.0%
8.0%
10.0%
12.0%
Acute WIES for Maori actual Acute wies for Maori as % of all acute wies actual
Acute Data - Pacific
0
100
200
300
400
500
600
700
800
900
Jul-09
Aug-09
Sep-09
Oct-09
Nov-09
Dec-09
Jan-10
Feb-10
Mar-10
Apr-10
May-10
Jun-10
Jul-10
Aug-10
Sep-10
Oct-10
Nov-10
Dec-10
Jan-11
Feb-11
Mar-11
Apr-11
May-11
Jun-11
Jul-11
Aug-11
Sep-11
Oct-11
Nov-11
Dec-11
0%
2%
4%
6%
8%
10%
12%
14%
16%
18%
20%
Acute wies for Pacific People actualPacific People wies as % of all acute actual
Interpretation Note:- The charts above represent a view of ADHB population treated at ACH, not a
comprehensive population view which would incorporate the ADHB population treated at other hospitals.
32
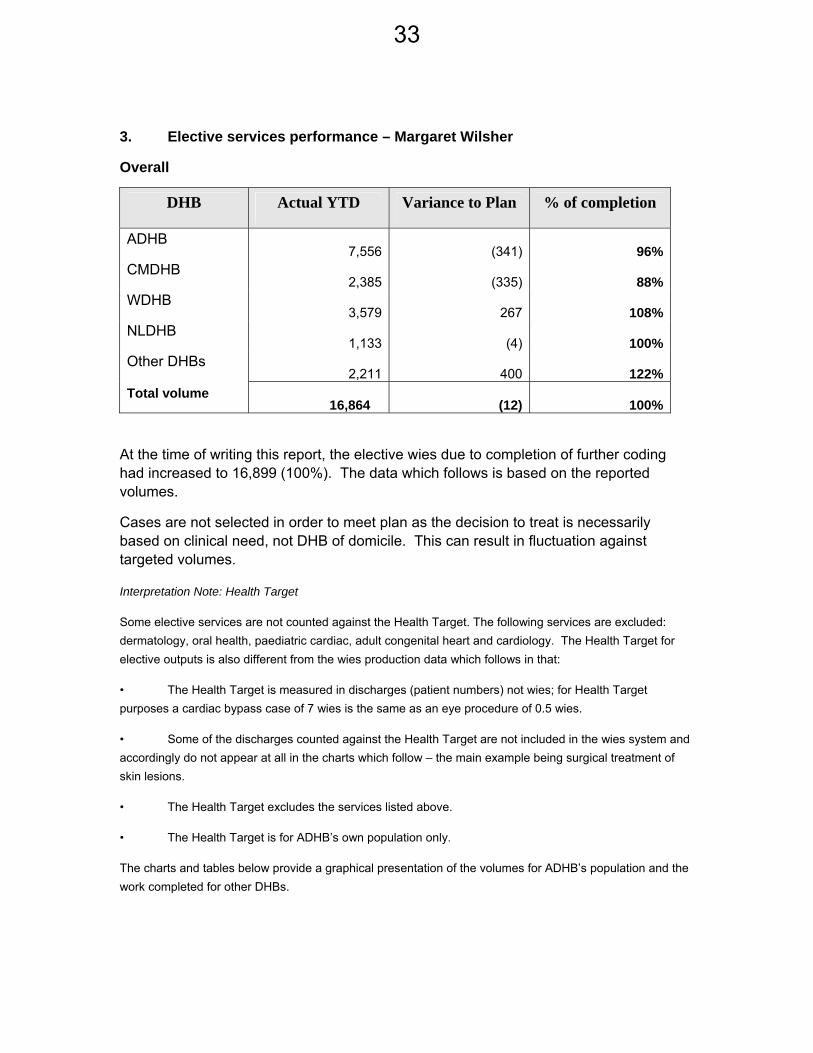
3. Elective services performance – Margaret Wilsher
Overall
DHB Actual YTD Variance to Plan % of completion
ADHB 7,556 (341) 96%
CMDHB 2,385 (335) 88%
WDHB 3,579 267 108%
NLDHB 1,133 (4) 100%
Other DHBs 2,211 400 122%
Total volume 16,864 (12) 100%
At the time of writing this report, the elective wies due to completion of further coding had increased to 16,899 (100%). The data which follows is based on the reported volumes.
Cases are not selected in order to meet plan as the decision to treat is necessarily based on clinical need, not DHB of domicile. This can result in fluctuation against targeted volumes.
Interpretation Note: Health Target
Some elective services are not counted against the Health Target. The following services are excluded:
dermatology, oral health, paediatric cardiac, adult congenital heart and cardiology. The Health Target for
elective outputs is also different from the wies production data which follows in that:
• The Health Target is measured in discharges (patient numbers) not wies; for Health Target
purposes a cardiac bypass case of 7 wies is the same as an eye procedure of 0.5 wies.
• Some of the discharges counted against the Health Target are not included in the wies system and
accordingly do not appear at all in the charts which follow – the main example being surgical treatment of
skin lesions.
• The Health Target excludes the services listed above.
• The Health Target is for ADHB’s own population only.
The charts and tables below provide a graphical presentation of the volumes for ADHB’s population and the
work completed for other DHBs.
33

Auckland DHB - WIES
Jul-11 Aug-11 Sep-11 Oct-11 Nov-11 Dec-11 Jan-12 Feb-12 Mar-12 Apr-12 May-12 Jun-12
Cumulative Original Plan 1,244.3 2,677.9 4,065.9 5,339.2 6,788.8 7,896.3 8,746.1 10,116.8 11,691.1 12,920.3 14,515.0 15,946.0
Cumulative Current Plan 1,244.3 2,677.9 4,065.9 5,339.2 6,788.8 7,896.3 8,746.1 10,116.8 11,691.1 12,920.3 14,515.0 15,946.0
Cumulative Actual WIES 1,167.8 2,412.4 3,774.9 4,897.0 6,258.5 7,555.7
Cumulative Actual WIES Variance -76.5 -265.4 -291.0 -442.2 -530.2 -340.6
% Plan Achieved 94% 90% 93% 92% 92% 96%
% Coded 100% 100% 100% 100% 100% 100%
Elective Cumulative Inpatient WIES VolumesFor Auckland DHB
For 01 July 2011 to 30 June 2012
0
2000
4000
6000
8000
10000
12000
14000
16000
18000
Original Plan Volume
Current Plan Volume
Actual WIES
34

Because funding for ADHB’s population is on the basis of a population based funding formula, an underperformance on ADHB elective WIES is not a revenue risk, except if it is matched by an underperformance on the Health Targets which have revenue attached (and for which the revenue is calculated on the basis of WIES production).
As noted above, the ethnicity based data for elective wies is still being reviewed for relevance and appropriateness and will be refined over time.
35

Counties Manukau – planned and actual WIES
Jul-11 Aug-11 Sep-11 Oct-11 Nov-11 Dec-11 Jan-12 Feb-12 Mar-12 Apr-12 May-12 Jun-12
Cumulative Original Plan 428.7 922.5 1,400.7 1,839.4 2,338.8 2,720.3 3,013.1 3,485.3 4,027.6 4,451.1 5,000.5 5,493.4
Cumulative Current Plan 428.7 922.5 1,400.7 1,839.4 2,338.8 2,720.3 3,013.1 3,485.3 4,027.6 4,451.1 5,000.5 5,493.4
Cumulative Actual WIES 375.8 793.9 1,204.8 1,627.3 2,053.0 2,384.8
Cumulative Actual WIES Variance -52.8 -128.6 -195.9 -212.0 -285.7 -335.5
% Plan Achieved 88% 86% 86% 88% 88% 88%
% Coded 100% 100% 100% 100% 100% 100%
Elective Cumulative Inpatient WIES VolumesFor Counties Manukau DHB
For 01 July 2011 to 30 June 2012
0
1000
2000
3000
4000
5000
6000
Original Plan Volume
Current Plan Volume
Actual WIES
36

Northland – planned and actual WIES
Jul-11 Aug-11 Sep-11 Oct-11 Nov-11 Dec-11 Jan-12 Feb-12 Mar-12 Apr-12 May-12 Jun-12
Cumulative Original Plan 179.2 385.6 585.5 768.8 977.5 1,137.0 1,259.4 1,456.8 1,683.4 1,860.4 2,090.1 2,296.1
Cumulative Current Plan 179.2 385.6 585.5 768.8 977.5 1,137.0 1,259.4 1,456.8 1,683.4 1,860.4 2,090.1 2,296.1
Cumulative Actual WIES 103.4 259.1 507.2 667.2 948.2 1,133.4
Cumulative Actual WIES Variance -75.8 -126.5 -78.2 -101.7 -29.3 -3.6
% Plan Achieved 58% 67% 87% 87% 97% 100%
% Coded 100% 100% 100% 100% 100% 100%
Elective Cumulative Inpatient WIES VolumesFor Northland DHB
For 01 July 2011 to 30 June 2012
Original Plan Volume
Current Plan Volume
Actual WIES
37

Jul-11 Aug-11 Sep-11 Oct-11 Nov-11 Dec-11 Jan-12 Feb-12 Mar-12 Apr-12 May-12 Jun-12
Cumulative Original Plan 528.3 1,137.0 1,726.4 2,267.0 2,882.5 3,352.7 3,713.6 4,295.6 4,964.0 5,485.9 6,163.0 6,770.6
Cumulative Current Plan 521.8 1,123.0 1,705.1 2,239.0 2,846.9 3,311.4 3,667.7 4,242.5 4,902.8 5,418.2 6,087.0 6,687.1
Cumulative Actual WIES 629.8 1,253.9 1,839.8 2,366.6 3,013.2 3,578.7
Cumulative Actual WIES Variance 108.0 131.0 134.8 127.6 166.2 267.3
% Plan Achieved 121% 112% 108% 106% 106% 108%
% Coded 100% 100% 100% 100% 100% 100%
Elective Cumulative Inpatient WIES VolumesFor Waitemata DHB
For 01 July 2011 to 30 June 2012
0
1000
2000
3000
4000
5000
6000
7000
8000
Original Plan Volume
Current Plan Volume
Actual WIES
Waitemata – planned and actual WIES
38

Top and Bottom Three Elective Services for Auckland Population
The following table is a presentation of the top and bottom 3 elective services for ADHB’s own population (by variance in WIES). The variance from plan is shown in wies and this is converted to approximate patient numbers in the final column.
Plan Actual Variance VarianceAverage wies
per VarianceTop 3 wies wies wies % Patient Patients Paediatric Cardiac 165 214 49 29% 2.9 17Vascular Surgery 233 292 59 25% 2.3 26ORL 433 537 104 24% 1.2 87 Bottom 3 Cardiothoracic 622 405 (217) -35% 5.7 (38)General Surgery 1,648 1,459 (189) -11% 1.5 (126)Paediatric ORL 289 237 (52) -18% 0.5 (103)
39
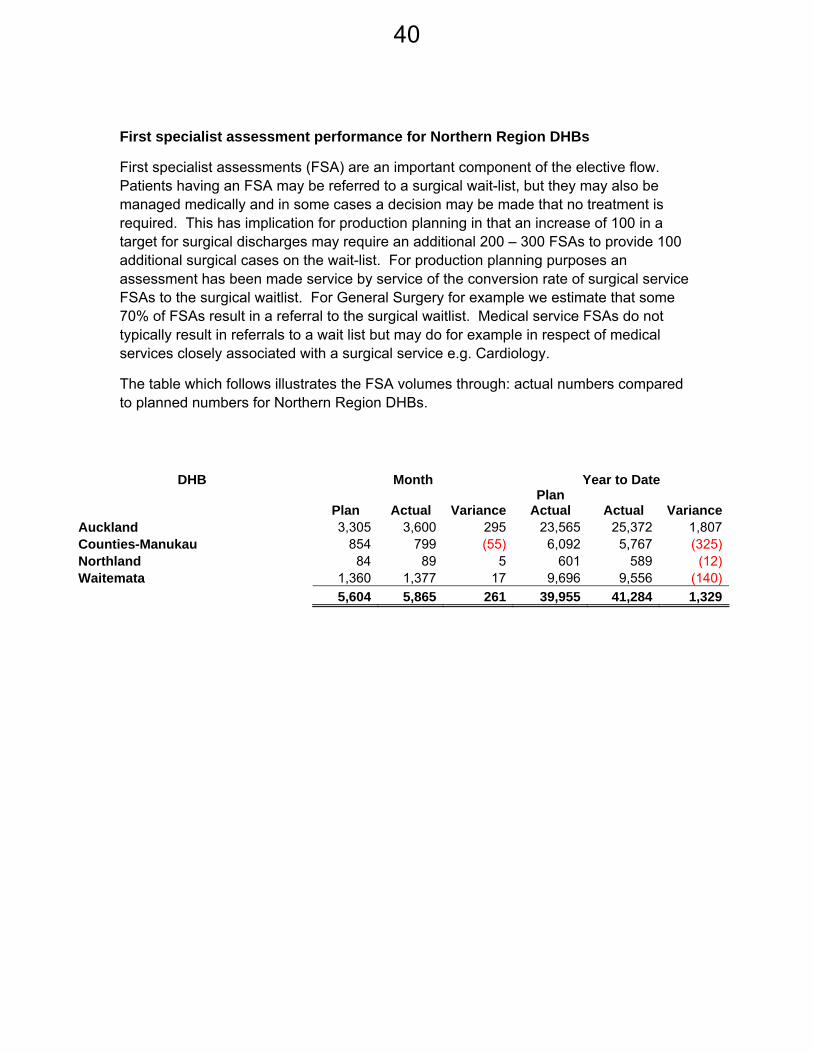
First specialist assessment performance for Northern Region DHBs
First specialist assessments (FSA) are an important component of the elective flow. Patients having an FSA may be referred to a surgical wait-list, but they may also be managed medically and in some cases a decision may be made that no treatment is required. This has implication for production planning in that an increase of 100 in a target for surgical discharges may require an additional 200 – 300 FSAs to provide 100 additional surgical cases on the wait-list. For production planning purposes an assessment has been made service by service of the conversion rate of surgical service FSAs to the surgical waitlist. For General Surgery for example we estimate that some 70% of FSAs result in a referral to the surgical waitlist. Medical service FSAs do not typically result in referrals to a wait list but may do for example in respect of medical services closely associated with a surgical service e.g. Cardiology.
The table which follows illustrates the FSA volumes through: actual numbers compared to planned numbers for Northern Region DHBs.
DHB Month Year to Date
Plan Actual VariancePlan
Actual Actual VarianceAuckland 3,305 3,600 295 23,565 25,372 1,807Counties-Manukau 854 799 (55) 6,092 5,767 (325)Northland 84 89 5 601 589 (12)Waitemata 1,360 1,377 17 9,696 9,556 (140)
5,604 5,865 261 39,955 41,284 1,329
40

Elective Performance: Zero Patients Waiting Over 6 Months
An ADHB Annual Plan objective is that no patients are waiting over 6 months for clinic or surgery by 30 June 2012.
Individual services have targeted the timeframes as set out below. These are more challenging than advised to NHB to allow for increased understanding of referrals flows and to allow for data anomalies and classification issues to be worked through the system.
41

ZERO WAITERS > 6 MONTHSGreen as compliant with zero or on target to meet timeframe for achieving targetAmber for service not achieving zero or timeline target at risk in a minor wayRed for services that are at high risk of not achieving zero by required timeline
Traffic Light
Clinic at date of report
Surgery at date of report
31-Dec 31-Dec
Jul Aug Sep Oct Nov Dec Jan Feb Mar Apr May Jun No. Pts No. Pts No. Pts
Gastroenterology Clinic 0 0
General Medicine Clinic 0 0
General SurgeryClinic Surgery 38 14 24
Infectious Diseases Clinic 0 0
Haematology Clinic 0 0
Liver Transplant Clinic 0
Neurology Clinic 0 0
Neurosurgery Adult Clinic Surgery 15 11
Medical Oncology Clinic 0 0
Ophthalmology Clinic Surgery 451 299 152
ORL Adult Surgery Clinic 24 1
Oral Health Surgery 0 0
Orthopaedics AdultClinic Surgery 45 24
Renal Clinic 1 0
Urology Clinic Surgery 0 32
Cardiology 1 2
CardiothoracicClinic Surgery 11 0 1
Respiratory Clinic 0 0
Vascular Service Clinic Surgery 5 1 4
Dermatology Clinic 0 0
Endocrinology Clinic 2
Immunology Clinic 4 4 0
Rheumatology Clinic 0
Tarps Clinic 0 0
Gynaecology Clinic Surgery 11 3 8
Paed ENTClinic Surgery 5 5 0
Paed Endocrinology Clinic 0 0
Gen Paeds Clinic 1 0
Paed Gastroenterology Clinic 1 0
Paed Immunology Clinic 0 0
Paed Infectious Diseases Clinic 0 0
Paed Neurology Clinic 9 9 0
Paed Neuro services Clinic Surgery 0 3
Paed Orthopaedics Clinic Surgery 20 6 1
ACHD (S) 0 .
Paed CardiologyClinic Surgery 19 19
Paed CTSU Surgery 9 2
Renal-Paed Clinic 0 0
Paed Respiratory Clinic 5 5 0
Paed Rheumatology Clinic 0 0
Paed Surgery Clinic Surgery 42 15 27
460 361
Services Plan 2011/12
> 6 months
Service Timelines for Zero Patients
Waiting > 6 Months
9
1
4
42

Interpretation Note – Wait time penalties
NHB has written to ADHB advising that from 1 July 2012 all patients are to be seen within 6 months and that
the following estimated buffers will apply from 1 July 2012, clinics 40 patients (currently 311) and surgery 50
patients (currently 225).
The NHB current policy is that where a DHB is non-compliant (ie patients waiting > 6 months) on 3
consecutive months (or any 5 months in a year) the DHB will be penalised 1/12th of its additional elective
revenue for each month of non-compliance with a minimum of 2 months.
• ADHB’s annual additional elective revenue is approximately $24m per annum therefore a penalty of
$2m per month or minimum of $4m.
• ADHB has raised with NHB the disproportionate quantum of the penalty.
While there are a number of risks across the specialties these are more apparent for those services that plan to be compliant in the month of June 2012 ie orthopaedics, urology, ophthalmology and neurosurgery. ADHB has used the Patient and Operational Demand (POP) plan to inform the additional resourcing required for those services to become compliant by 30 June 2012. Some of these services have significant IDF components within their waitlists (eg Ophthalmology) which may require ADHB to deliver above planned levels in order to deliver services within the 6 months or the appropriate waiting time for the assigned patient priority.
43

Surgical Wait List Distribution for the ADHB Population
Refreshed on
< 1 1 2 3 4 5 6 7 8 9 10 11 12 > 12 Total
Total Waiting 773 700 344 302 249 116 80 58 34 17 12 10 5 74 2,774
#############
Surgical Waiting Time Distribution
For Auckland DHBAs at 31 December 2011
0.0
100.0
200.0
300.0
400.0
500.0
600.0
700.0
800.0
900.0
Months Waiting
Total Waiting
A number of the cases waiting more than 12 months are for staged/planned surgery i.e. cases where surgery cannot be undertaken within 12 months because for example clearance from another medical specialty is required. Such cases are legitimate exclusions from Ministry reporting.
% of waiters by ethnic group (ADHB population)
% of waiters by ethnic group (ADHB population)
1 Month 2 Month 3 Month 4 Month 5 Month 6 Month > 6 Month
Maori 10% 9% 10% 8% 11% 10% 15%
Pacific 12% 13% 11% 15% 11% 17% 16%
A number of those waiting > six months are for staged/planned procedures.
44

Outpatient Wait List Distribution for the ADHB Population
Refreshed on
< 1 1 2 3 4 5 6 7 8 9 10 11 12 > 12 Total
FSAs Waiting 1610 1041 544 402 320 180 98 53 14 5 2 5 2 3 4279
#############
Outpatient Waiting Time DistributionFor Auckland DHB
As at 31 December 2011
0
200
400
600
800
1000
1200
1400
1600
1800
Months Waiting
% of waiters by ethnic group (ADHB population)
1 Month
2 Month
3 Month
4 Month
5 Month
6 Month
> 6 Month
Maori 7% 7% 7% 7% 8% 8% 8%
Pacific 12% 11% 12% 12% 12% 14% 16%
The ethnic data shown here will be subject to the same review (of relevance and appropriateness) as other ethnic data referred to in this pack.
45

OR Performance Statistics
OR management maintain and report on a wide range of operational KPIs. Included among these is elective theatre utilisation. The benchmark figure for OR utilisation is 85%. ADHB theatres typically exhibit utilisation close to this benchmark:-
December 2011 utilisation:-
Dec Nov Oct Sept Aug
Level 4 (cardiac, ORL) 84% 82% 77% 76% 81%
Level 8 (other adult) 86% 87% 84% 87% 82%
Level 9 (Women’s health) 81% 83% 84% 83% 82%
Starship 77% 78% 74% 74% 76%
Greenlane (day stay) 83% 81% 82% 79% 83%
The ongoing replacement of cancelled cases with other cases waiting surgery is evidenced by these utilisation rates. At the same time median acute time to theatre has been reducing.
Median acute time to theatre (decimal hrs) - all suites
-
1.00
2.00
3.00
4.00
5.00
6.00
Jul-10
Aug-10
Sep-10
Oct-10
Nov-10
Dec-10
Jan-11
Feb-11
Mar-11
Apr-11
May-11
Jun-11
Jul-11
Aug-11
Sep-11
Oct-11
Nov-11
Dec-11
Source: Monthly Throughput Report and PIMs Report TH039
46

Interpretation Note
In reviewing cancellation statistics it’s important to appreciate that some issues of data quality have been
identified as part of The Productive Operating Theatre (TPOR) work. These issues will be systematically
addressed as the project proceeds.
Production Plan
Our production plan shows a Quarter 1 performance of 102%, Q2 performance is at 98% with year to date December at 100%. As with other key metrics, an update of the month in progress will be provided at the meeting.
We continue to monitor elective volumes and identify and implement solutions to specific service based issues. Key to ongoing achievement is sufficient operating room access for Orthopaedics and the successful expansion of Greenlane facilities in the new calendar year to assist the paediatric services but also General Surgery within the Adult HSG.
Greenlane Surgical Unit Production
GSU elective discharge outputs (expressed as discharges per working day) have reduced from the high level at the end of the previous financial year. A key driver for the high numbers in the latter part of the year were additional lists in Ophthalmology; these lists and others required to boost production to the target line below will commence with recruitment of staff (see Section 5.3).
Elective Surgical Discharges per Working Day at Greenlane (All populations)
25
27
29
31
33
35
37
39
41
43
Jul-10
Aug-10
Sep-10
Oct-10
Nov-10
Dec-10
Jan-11
Feb-11
Mar-11
Apr-11
May-11
Jun-11
Jul-11
Aug-11
Sep-11
Oct-11
Nov-11
Dec-11
Jan-12
Feb-12
Mar-12
Apr-12
May-12
Jun-12
actual forecast
47

4. Productivity – Greg Balla
4.1 Improvement projects
The improvements projects reflect either the release of resources for further service volumes or a reduction in costs. Whilst most projects remain in the planning phase there has been good progress for the projects in the implementation phase.
48

Can Fin
Do Act cell ish
Goal Num Start D M A I C Green Orange Red Green Orange Red Green Orange Red ed ed Green Orange Red
1 Lift the Health of the people in Auckland City
61 61 35 0 7 13 4 50 9 0 59 0 0 58 1 0 0 2 0 0 0
2 Performance improvement
61 61 24 6 4 20 2 49 7 0 52 4 0 52 4 0 0 5 0 0 0
3 Live within our means
26 26 13 0 8 4 0 25 0 0 21 4 0 24 1 0 0 1 0 0 0
Total # 148 148 72 6 19 37 6 124 16 0 132 8 0 134 6 0 0 8 0 0 0
Total % 51.4% 4.3% 13.6% 26.4% 4.3% 88.6% 11.4% 0.% 94.3% 5.7% 0.% 95.7% 4.3% 0.% 0.% 0.% 0.%
Post Implementation
Plan On Time On Budget Expected Outcome Benefits
Current Phase
49

4.2 Savings schedule progress
Category Gains this month Gains Year to date $000 $000 Direct treatment costs 767 3,008 FTE Productivity 2,344 6,867 Indirect treatment costs 893 2,364 Total gains achieved 4,004 12,239 Direct Treatment Costs ($ 3,008k Year to Date) The main contributors to Direct Treatment Savings YTD are Procurement savings effective this financial year of $1,055k and reduction in blood usage through a reduction in unnecessary usage of blood of $1,143k. FTE Productivity ($6,867k Year to Date) The major contributor to this is the Releasing Time to Care Programme which is currently operating in 34 wards and is achieving an additional 5% direct patient contact time for on average 35 nurses a ward $1,820k. Other significant contributions came from reducing stay in AED $1,544k and CED $634k. Adult Service has contributed savings of $672k YTD. Indirect Treatment Costs ($2,364k Year to Date) Improved procurement pricing year to date amounts to $2,364k
50

5. Financial Performance – Brent Wiseman
5.1 Overview
The provider arm was favourable to budget for the month by $3.2 M. YTD is $(3.9) M unfavourable.
Actual Month
Variance Month
Actual YTD
Variance YTD
$k $k $k $k
Income 98,817 4,212 F 608,156 533 F
Operating Expenditure 95,945 (1,904) U 566,230 (7,828) U
Operating Surplus/(Deficit) 2,872 2,308 F 41,926 (7,295) U
Non-Operating Expenditure 7,311 887 F 45,215 3,426 F
Total Surplus / (Deficit) (4,439) 3,195 F (3,289) (3,869) U
5.2 Revenue
Category Variance
Month Variance
YTD Explanation of major items (YTD)
$M $M
MOH - Base Funding
3.5 (1.3) ADHB population $4.2M favourable, offset by IDF revenue $(5.5)M unfavourable.
MoH Sub Contracts
0.3 0.2
A large number of favourable and unfavourable variances with respect to Ministry contracts, largely netting off.
Other Patient Care Revenue
(0.8) (0.5)
Non IDF revenue from other DHBs is favourable but offset by Non NZ resident and ACC revenue unfavourable (predominantly in Older
People’s Health rehab bed days, due to lower numbers of patients meeting ACC criteria and thus defaulting to DHB funded).
51

Category Variance
Month Variance
YTD Explanation of major items (YTD)
Financial Income
1.3 2.3 Gain on the mark to market valuation of interest rate swaps
Trust & Donation Income
(0.1 (0.7)
Arises from lower receipts of Starship Foundation donations. The donations to be agreed for this calendar year are expected to return this to budget.
5.3 Workforce
The tables below analyses the FTE numbers and variance both in numbers and value for the month.
Employee Group
Actual FTE
Month
Variance FTE
Month Variance
Month
Actual FTE YTD
Variance FTE YTD
Variance YTD
# # $k # # $k
Medical 1,217 (45) U (928) U 1,197 (27) U (1,764) U
Nursing 3,306 (26) U 522 F 3,330 (44) U (753) U
Technical 1,832 24 F 489 F 1,781 45 F 1,365 F
Hotel Services 233 (6) U (82) U 230 (2) U (307) U
Administration 1,174 46 F 142 F 1,154 66 F 1,005 F
Other 2 - (2) U 2 - 5 F
Total (excl Outsourced Staff)
7,763 (8) U 141 F 7,694 38 F (449) U
Outsourced staff 114 (74) U (819) U 86 (46) U (2,634) U
Total (incl Outsourced Staff)
7,877 (82) U (679) U 7,780 (8) U (3,082) U
Other Staff Related Costs
(1,212) U (2,232) U
Total Employee Costs 7,877 (82) U (1,890) U 7,780 (8) U (5,314) U
52
Employee Group
Actual FTE
Month
Variance FTE
Month Variance
Month
Actual FTE YTD
Variance FTE YTD
Variance YTD
# # $k # # $k
Operational 6,329 (84) U (1,170) U 6,272 (52) U (6,001) U
Mental Health 744 (5) U (162) U 729 10 F 354 F
Ancillary Services 805 7 F (559) U 779 33 F 333 F
Total Employee Costs 7,877 (82) U (1,890) U 7,780 (8) U (5,314) U
FTE
December FTE are 82 above budget and 82 higher than November. December numbers, however, include 42 outsourced FTE for November. After normalising the two months for this adjustment the underlying FTE has not changed, and December would be 40 (0.5%) above budget.
FTE continue to be actively managed by the Level 2 HSG managers.
By category, Medical and Nursing FTE are both above budget, with these variances offset by Technical and Administration which are below budget. These offsetting variances reflect the difference mix in the types of staff between the initial budget assumptions and the prioritisation of staffing resources that is being undertaken by each HSG.
Employee Costs
The financial variance for the month of December $(1,890)k U is explained below:
Medical $(928)k U - the key variances for the month are as follows: 1. Child Health $883k U – reflecting job sizing back pay, high cross cover and Locum
costs for Registrars. 2. House Officers $305k U – this variance is spread across several HSGs, although
most significantly in Adult, and reflects over appointment of House Officers in the December 2011 rotation. Total House Officer FTE are 178 versus budget of 149. FTE numbers are expected to reduce during the rotation due to resignation, as with past experience.
53

Nursing $522k F - Nursing FTE are close to budget, being 26 (0.8%) above budget. However there is a favourable variance of $522k which is due to the favourable financial impact of annual leave taken over the Christmas period. Technical $489k F - Technical FTE are close to budget, being 24 (1.3%) below budget. There is a favourable variance of $489k which is due to the impact of annual leave taken over the Christmas period. Outsourced Staff $(819)k U - The key variances for the month are as follows: 1. Management & Admin contractors $271k U – spread primarily across Support
Services, and partly offset by vacancies in permanent staff. 2. Improvement Project $174k U – due to the classification of expenses which are to be
reallocated to Non Staff Administration costs (which are $366k F for the month). 3. Nursing Bureau $180k U - reflecting external agency nursing costs, this is offset by
favourable permanent nursing staff costs - bottom line neutral. Other Staff Related Costs $(1,212)k U - The key variances for the month are as follows: 1. CME $511k U – these are variable from month to month and December was
particularly high. In addition, changes in CME policy have resulted in a higher utilisation rate than budgeted.
2. RMO Training Costs $190k U – these are similarly variable from month to month and December was particularly high – year to date costs remain close to budget.
The balance of the unfavourable variance for Other Staff Related Costs is spread over a number of expenses, and relates primarily to the variable timing of actual expenditure from month to month.
5.4 Clinical Services Outsourcing Costs
Outsourcing costs were $(548)k U for the month. YTD is $(3,928)k U.
Outsourcing activity continues to be bought forward in order to continue to achieve ADHB population elective discharge targets. The key areas of higher expenditure against budget are in Cardiothoracic, Orthopaedics, General Surgery and Paediatric Surgery. The higher level of activity has enabled us to meet the Q1 and Q2 targets. GMs have agreed a Provider wide plan with a number of initiatives to ensure we meet balance of year targets with a lower level of outsourcing than YTD. This is being worked through at a detailed level within the POP production plans.
Specific commentary regarding the year to date areas of unfavourable expenditure comprises:
Cardiac HSG $(1,544)k U - outsourcing is driven by the requirement to reduce the waiting list below 94. The service is also maximising the use of internal capacity by completing additional weekend work. The capacity gap identified given the funded volume growth needs to be closed either through outsourcing or development of internal capacity requiring additional expenditure.
54

Children’s HSG $(1,233)k U - It was intended the full year outsourcing budget be fully deployed prior to Christmas and the volumes would be transferred across to GSU when the facility is open at the beginning of February.
Adult HSG $(989)k U – the variance primarily relates to Orthopaedics and General Surgery, and reflects the decision to bring forward elective surgery outsourcing to achieve Q1 and Q2 targets. Balance of year targets are being addressed through the Provider wide plan.
Operations & Clinical Support $(818)k U - PET scans are $491k U and reflect the ongoing increase in demand. In addition, outsourced MRI scans are $165k U – the budget was reduced based on higher utilisation of in-house capacity (December YTD last year cost $1,800k, YTD this year $1,487k) which is being achieved but not to the full extent budgeted.
5.5 Direct Treatment Costs
Direct treatment costs remain favourable to budget at $201k F for the month and $1,585k F YTD.
Within this there are three key variances YTD, as follows:
Category
Variance YTD
($k)
Explanation of major items YTD
Drugs 5,015 F Cancer & Blood HSG $3,257 k F - lower demand for Haemophilia blood products $0.6M F, together with lower demand for PCT drugs $0.4m F (both offset by lower revenue). The remaining $2.3m F relates to the revised production plan together with repatriation of services to Northland from 1 July.
Adult HSG - $1,197k F – key variance is Blood $634k F due to savings achieved in the Concord “Blood is a Gift” project. The other single material item is Peritoneal Dialysis Fluids $225k F due to a change in mix of dialysis patients, with a higher number on haemodialysis (for which costs are incurred under Clinical Supplies).
Children’s HSG – $442k F across most drug categories. This reflects the different mix of patients compared with the average last year.
55

Category
Variance YTD
($k)
Explanation of major items YTD
Clinical Supplies
(2,520) U Volume related costs spread across the provider driven by activity, with the key unfavourable variances as follows:
ORA $908k U - ORA has continued to have growth in both theatre minutes and theatre cases over the equivalent period last year. The unfavourable variance is expected to be reduced by the YTD January position.
Complementary Services $518k U – Research and LabPlus national services – both fully funded
Operations & Clinical Support $481k U – predominantly Radiology due to higher volume of interventional procedures than YTD budget.
Patient Appliances
(1,102) U Volume related costs spread across the provider driven by activity, with the key unfavourable variances as follows:
Children’s HSG $663k U – variance is split across Paediatric Cardiac and Surgical Services. Paediatric Cardiac volumes are ahead of last year for pacemakers, melody valves and heart valves. Paediatric Surgical Services is a timing matter relating to overachievement of elective surgical volumes YTD – the variance is expected to correct.
Cardiac HSG $368k U – costs of valves in Cardiothoracic due to an increase in the number of referrals for valve replacement surgery.
56

Appendix 1 Provider Operating Statement December 2011 and YTD
$k December YTD
Actual Budget Variance Actual Budget Variance
Income
ADHB Funder Sourced 85,430 81,898 3,532 F 526,740 528,093 (1,353) U
MoH Sourced (Incl CTA) 4,774 4,409 365 F 25,508 24,993 515 F
Other Income 7,278 8,196 (918) U 48,802 48,987 (185) U
Trust & Donation Income 318 419 (101) U 1,300 2,014 (714) U
Financial Income 1,017 (316) 1,334 F 5,806 3,536 2,270 F
98,817 94,605 4,212 F 608,156 607,623 533 F
Expenditure
Employee Costs 62,013 60,942 (1,071) U 362,466 359,786 (2,680) U
Outsourced Staff 4,669 3,858 (811) U 25,761 23,116 (2,645) U
Outsourced Clinical Services 3,142 2,594 (548) U 19,483 15,555 (3,928) U
Treatment Costs - Direct 17,175 17,386 210 F 103,065 104,650 1,585 F
Treatment Costs - Indirect 3,633 3,538 (95) U 21,515 21,161 (354) U
Other Costs 5,313 5,723 410 F 33,940 34,134 194 F
Total Operating Expenditure 95,945 94,040 (1,904) U 566,230 558,402 (7,828) U
Operating Contribution 2,872 564 2,308 F 41,926 49,221 (7,295) U
Depreciation, Interest & Capital Charge
7,311 8,199 887 F 45,215 48,641 3,426 F
Net Surplus / (Deficit)
(4,439) (7,634) 3,195 F (3,289) 579 (3,869) U
57

58

5.2 Heal th Target Updates
59

60

5.2 Heal th Target Updates The Health targets areas applicable to the provider arm are set out in the table below. Three of the six measures have been met.
Acute patient flow management is a focus in all departments, and both Adult and Child achieved the target of 95% for the month and for the quarter.
There was an overall 2% improvement for ‘better help for smokers to quit”. A number of initiatives are ongoing with positive effect. Audits and coaching in Adult Emergency Department has seen a steady improvement in the number of patients provided with advice and help to stop smoking.
Cardiac bypass surgery did not meet the target this month. There were 108 referral accepted onto the waiting list. This is significantly higher then expected and has not followed previous seasonal trends. Outsourcing has continued though capacity was reduced due to closures over the Christmas period.
Radiotherapy continues to meet the target of 100% having now delivered to target for 615 consecutive days
Status Comment
Adult acute patient flow 95% achieved against 95% target.
Child acute patient flow 95% achieved against 95% target.
Improved access to elective surgery 99% achieved against 100% target
100% YTD
Shorter waits for radiation therapy 100% of eligible patients treated.
Better help for smokers to quit 84% achieved against 95% target
Cardiac bypass surgery Patients waiting 108 against a target of 94
Proceeding to plan
Issues being addressed
Target unlikely to be met
Key to symbols
61

62

Project: Primary Objective: That at least 95% of patients will be admitted, discharged or transferred from Auckland Emergency Departments within 6 hours
Date of Delivery: 30 June 2012
Project Risks / Comments:95% of patients admitted, discharged or transferred from Emergency Department within six hours in
December, giving 3 consecutive months of 95% performance. Quarterly result advised to MoH is 95%.
Actions continue to be taken across Adult and Children’s service to respond to constraints impacting on flow
and to sustain current level of performance.
Acute Patient Flow, Actual vs Target, July 2010 - June 2012
0%
20%
40%
60%
80%
100%
Jul-2
010
Aug-
2010
Sep-
2010
Oct
-201
0N
ov-2
010
Dec
-201
0
Jan-
2011
Feb-
2011
Mar
-201
1Ap
r-20
11
May
-201
1Ju
n-20
11Ju
l-201
1Au
g-20
11
Sep-
2011
Oct
-201
1N
ov-2
011
Dec
-201
1
Jan-
2012
Feb-
2012
Mar
-201
2Ap
r-20
12
May
-201
2Ju
n-20
12
Actual Goal M OH Target
63

Project: Adult Acute Patient FlowPrimary Objective: That at least 95% of patients will be admitted, discharged or transferred from Auckland Adult Emergency Department
within 6 hoursDate of Delivery: 30 June 2012Clinical Leads: Nurse Director Margaret Dotchin , Dr Tim ParkeProject Sponsor: Nurse Director Margaret DotchinSteering Group: Nurse Director Margaret Dotchin, General Manager Ngaire Buchanan,Dr Tim Parke, Dr Art Nahill, Dr Wayne Jones, Dr Andrew Old
Improvements to date:Streamlined AED processes and measurement and manage the challenge of
growing demandReviewed Medical / Nursing requirements for AED and approved business case for
resource increase to match increased workload.Charge nurse patient flow coordinator introducedImproved access to Radiology Streamlined documentation required for safe transfer Improved triage processes.Managing bed block with additional resources58 Additional beds opened 2009‐2010 Winter Ward 31 General Medicine 10 additional beds August – October 2010Managing bed block & reducing the time patients wait through improved processes
and teamworkDaily Rapid Rounds introduced in General Medicine (Feb 2010) and
Orthopaedics
(July 2010)Nurse Facilitated Discharging in General Medicine (April 2010)Improved Bed Management Communication via Estimated Discharge Dates, CMS
upgrades, improved visual management, more efficient bed management meetings,
earlier time of day discharging.Daily breech review meetings to understand root causes and implement short term
solutions.Immediate actions to improve performance:1.
Increased engagement of Senior Leadership Team to support improvement
activities and reduce road blocks to improvement.Increase communication and engagement of Clinical Directors, SMO’s, RMO’s Increase communication and engagement of Charge Nurses and RN’s after hours
to further reduce wait times for patient transfer from Emergency
DepartmentEngage with SMO’s, RMO’s and nurses one to one, by CD, Nurse Advisor
or Level 2 clinical leader where resistance to required behaviour is
demonstrated.Valuing patient time poster campaign
2.
Establish ED short stay unitImplement APU flex beds Improve measurement of Ready to Go patients in EDComplete recruitment of remaining ED resource to improve weekend
coverageSupport General Medicine by diversion of patients to subspecialtiesImplement general surgery acute flow team initiatives to improve
response timeCMO to attend Orthopaedic SMO meeting to increase engagement.Relocate bed manager to ED after hours Implement ED discharge nurse on weekendHands on support of ED flow Charge Nurse to reduce roadblocks to
timely review and transfer of patientsCommence physiotherapy facilitated discharge in Orthopaedics.Establish discharge co‐ordination responsibility in Gen Med ward nursing team.Further increase timely overnight transfers from ED to inpatient
wards once bed
allocated.3.
Five day rapid improvement event planned for April to focus on improvement of
process from decision to admit to patient transfer complete.Improve elective scheduling.
Project Risks / Comments:
95% of patients admitted, discharged or transferred from Adult Emergency Department within six hours in December,
giving 3 consecutive months of 95% performance.
Three areas for further focus include: reducing delays to ED sign on, reducing delays to inpatient specialty sign on post
referral from ED, reducing access block (no beds available).Measures underway to address these concerns include:Finalising Adult ED escalation plan and incorporate into hospital wide plan. Implement Gen med redesign with new rosters commenced 16th
December.Develop acute and elective bed capacity forecasting to integrate
with elective surgery POP.
Adult Acute Patient Flow, Actual vs Target, July 2010 - June 2012
0%
20%
40%
60%
80%
100%
Jul-2
010
Aug-
2010
Sep-
2010
Oct
-201
0N
ov-2
010
Dec
-201
0Ja
n-20
11Fe
b-20
11M
ar-2
011
Apr-
2011
May
-201
1Ju
n-20
11Ju
l-201
1Au
g-20
11Se
p-20
11
Oct
-201
1N
ov-2
011
Dec
-201
1Ja
n-20
12Fe
b-20
12M
ar-2
012
Apr-
2012
May
-201
2Ju
n-20
12Actual Goal M OH Target
11
2233
64

Project: Children’s Acute Patient FlowPrimary Objective: That at least 95% of patients will be admitted, discharged or transferred from Auckland Children’s Emergency
Department within 6 hoursDate of Delivery: 30 July 2012Clinical Lead: Richard AickinProject Sponsor: Ngaire BuchananSteering Group: Ngaire Buchanan, Richard Aickin, Michael Shepherd, Janet Campbell, Stuart Dalziel
Improvements to date:Estimate Discharge Date (EDD’s) for current inpatient
Improvement in the forecasting occupancy
Changes to the call back registrar guidelines
Improvements to capacity planning
Bed turnaround time
Immediate Actions to Lift PerformanceContinue to progress the specific project we are operating on
the 2 hour component
Chief Resident to attend the Children’s daily review meeting.
Planning a rapid improvement event – focusing on further improving the 1 hour transfer from CED to ward time.
Longer term projectsStarship Capacity Planning Project
Project Risks /Comments:
December produced another solid performance for Starship Acute Patient flow where we achieved 95% for the third month in succession. Results are becoming more consistent, with December having 24 days at 95% or better, and just 4 days below 90%, with the lowest daily result being 88%. The focus is now maintaining consistency and ensuring capacity plans are in place to sustain performance through 2012.
Children's Acute Patient Flow, Actual vs Target, July 2010 - June 2012
0%
20%
40%
60%
80%
100%
Jul-2
010
Aug-
2010
Sep-
2010
Oct
-201
0N
ov-2
010
Dec
-201
0
Jan-
2011
Feb-
2011
Mar
-201
1Ap
r-20
11M
ay-2
011
Jun-
2011
Jul-2
011
Aug-
2011
Sep-
2011
Oct
-201
1N
ov-2
011
Dec
-201
1
Jan-
2012
Feb-
2012
Mar
-201
2Ap
r-20
12M
ay-2
012
Jun-
2012
Actual Goal M OH Target
65

Project: Improved access to elective surgeryPrimary Objective: Increase ADHB Elective Surgical Discharges from 11,149 to 11,950Date of Delivery: 30 June 2012Clinical Lead: Vanessa Beavis, Ian CivilProject Sponsor: Peter LowrySteering Group: Ngaire Buchanan, Dr Vanessa Beavis, Margaret Dotchin, Fionnagh Dougan, Ian Civil.
Risks / Comments: (Amber)Risks / Comments: (Amber)
Year to Date 31 December 2011 is 100% of target.September is the only month we have met or exceeded monthly
target
Planned activities:
1.
Maintaining the increased level of in‐house and
outsource activity including new GSC capacity
2.
Continuing to review the production plan at a daily and
weekly level.
ADHB Elective Discharges
97%96%
101%
100%99% 99%
‐
2,000
4,000
6,000
8,000
10,000
12,000
14,000
July August September October November December January February March April May June
Discharges
80.00%
85.00%
90.00%
95.00%
100.00%
105.00%
110.00%
% of H
ealth
target YTD
cum actual cum % cum plan
66
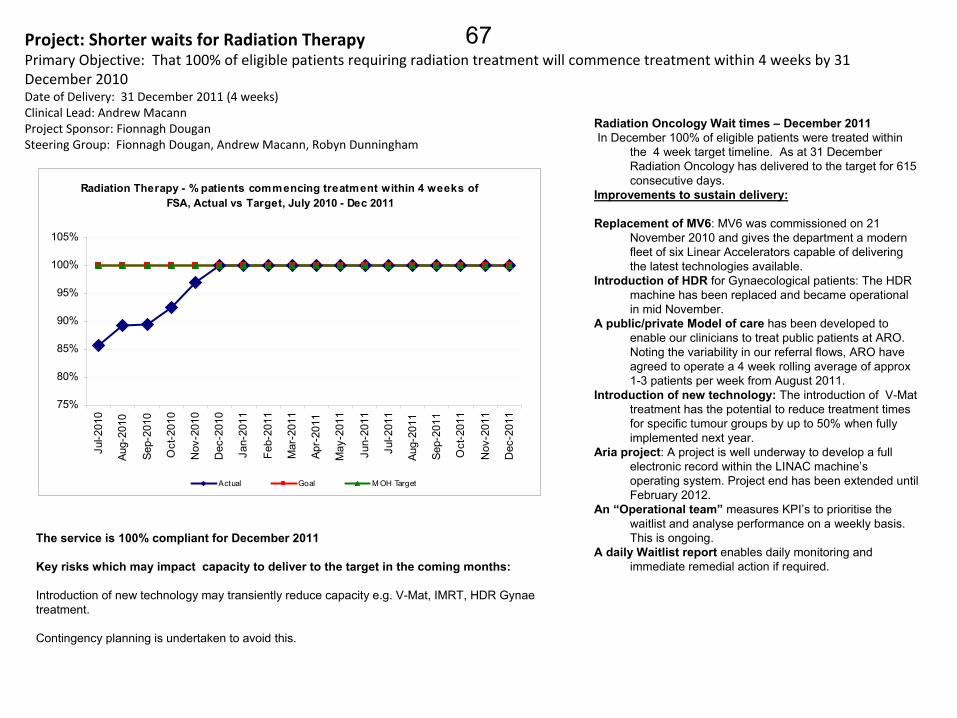
Project: Shorter waits for Radiation TherapyPrimary Objective: That 100% of eligible patients requiring radiation treatment will commence treatment within 4 weeks by 31
December 2010 Date of Delivery: 31 December 2011 (4 weeks)Clinical Lead: Andrew MacannProject Sponsor: Fionnagh DouganSteering Group: Fionnagh Dougan, Andrew Macann, Robyn Dunningham
Radiation Oncology Wait times – December 2011In December 100% of eligible patients were treated within
the 4 week target timeline. As at 31 December Radiation Oncology has delivered to the target for 615 consecutive days.
Improvements to sustain delivery:
Replacement of MV6: MV6 was commissioned on 21 November 2010 and gives the department a modern fleet of six Linear Accelerators capable of delivering the latest technologies available.
Introduction of HDR for Gynaecological patients: The HDR machine has been replaced and became operational in mid November.
A public/private Model of care has been developed to enable our clinicians to treat public patients at ARO. Noting the variability in our referral flows, ARO have agreed to operate a 4 week rolling average of approx 1-3 patients per week from August 2011.
Introduction of new technology: The introduction of V-Mat treatment has the potential to reduce treatment times for specific tumour groups by up to 50% when fully implemented next year.
Aria project: A project is well underway to develop a full electronic record within the LINAC machine’s operating system. Project end has been extended until February 2012.
An “Operational team” measures KPI’s to prioritise the waitlist and analyse performance on a weekly basis. This is ongoing.
A daily Waitlist report enables daily monitoring and immediate remedial action if required.
The service is 100% compliant for December 2011
Key risks which may impact capacity to deliver to the target in the coming months:
Introduction of new technology may transiently reduce capacity e.g. V-Mat, IMRT, HDR Gynae treatment.
Contingency planning is undertaken to avoid this.
Radiation Therapy - % patients commencing treatment within 4 weeks of FSA, Actual vs Target, July 2010 - Dec 2011
75%
80%
85%
90%
95%
100%
105%
Jul-2
010
Aug-
2010
Sep-
2010
Oct
-201
0
Nov
-201
0
Dec
-201
0
Jan-
2011
Feb-
2011
Mar
-201
1
Apr-
2011
May
-201
1
Jun-
2011
Jul-2
011
Aug-
2011
Sep-
2011
Oct
-201
1
Nov
-201
1
Dec
-201
1
Actual Goal M OH Target
67

Achievements in October:•
Greenlane Surgical Centre recording of ABC on day of surgery
implemented and being monitored weekly
Immediate Actions to improve performance by 13%:A.
Focus on short stay/high volume areas to achieve 5‐8%:•
Continued auditing and 1:1 coaching in AED and APU•
To remove the" not asked/ documented”
option from the the
Electronic Discharge Summary
B.
Improve engagement of clinical workforce to achieve 3‐4%:•
Data on target now distributed weekly to senior leadership •
Best Practise Guidelines to be distributed to wards and updated
weekly
•
To work with Registrars to determine barriers and support
mechanisms to assist junior doctors complete the ABC in clinical
documents and EDS
C.
Data collection systems and processes
to achieve
1 % :•
Smoking and Brief advice column to be added to Ward electronic
whiteboards to monitor the ABC completion
•
Investigation of generation of a Brief Advice Brochure with the EDS
for AED
•
Research – ADHB joining 6 other DHBs is participating in a ABC
Outcomes survey funded by the MOH to measure the outcomes of
Brief Advice given in hospitals
D.
Communications – planned activities•
An NRT working Group as been established to develop an NRT
promotion campaign to all clinical staff
•
Quit Banner set up at Level four entrance
CommentsResult: Of the 7810 events coded in December 1133 (14.5%) were identified as smokers. 84%
(955) of all smokers were given brief advice to stop smoking. 86
% of Maori patients were
recorded with brief advice. The result for Quarter 2 was also 84%The Emergency Dept. results continue to improve with the number of patients with no brief
advice steadily reducing. AED remains an area of focus. Daily audits of completion of the
smoking section if the AED Clinical document continued throughout the month. The AED
Service Manager and Nurse Manager met with key stakeholders from
Smokefree Services and
IMTS to review the current system look at improvements in late December . As a result the
“Not Asked/Not documented”
option in the mandatory smoking section is to be removed from
the beginning of 2012 and longer term changes to the patient registration to included smoking
status are being developed. Monitoring of coding and ward performance will continue in the new year to improve the
target result
Project: Better help for smokers to quit
Objective : 95% of hospitalised smokers provided advice and help
to quit by 1/07/2012
Clinical Lead: Stephen Child
Programme Sponsor: Taima Campbell
Programme Manager: Jan Marshall Steering Group: Di Roud, Anna Schofield, Maggie O’Brien, Stephen Child, George Laking, Jim Kriechbaum, Paul Bohmer, Arun Kulkarni, Michelle Stevens, Kristine
Nicol, Bernadette Rehman, Paul Birch, Anne‐Marie Pickering, Michael Haw, Jan Marshall, Kara Hamilton, Steven Stewart
Better help for smokers -% of hospitalised smokers provided advice and help to quit, Actual vs Target, July 2010 - Dec 2011 and % of Maori
hospitalized smokers offered advice and support to quit
0%10%20%30%40%50%60%70%80%90%
100%
Jul-2
010
Aug-
2010
Sep-
2010
Oct
-201
0
Nov
-201
0
Dec
-201
0
Jan-
2011
Feb-
2011
Mar
-201
1
Apr-
2011
May
-201
1
Jun-
2011
Jul-2
011
Aug-
2011
Sep-
2011
Oct
-201
1
Nov
-201
1
Dec
-201
1
020040060080010001200140016001800
Actual Goal M OH Target Actual - M aori No.with B.A
68

Project: Cardiac Bypass SurgeryPrimary Objectives: To enable timely access to cardiac bypass surgery the waiting list should be no greater than 94.
To support the national cardiac bypass intervention target, 940 bypasses should be completed in 2011/2012Date of Delivery: 30 June 2012Clinical Lead: Peter RuygrokProject Sponsor: Fionnagh DouganSteering Group: Paget Milsom, Andrew McKee, Peter Ruygrok, Elizabeth Shaw, Pam Freeman
Completed Improvement Activities:
Developed and implemented electronic scheduling system
Initiated pre‐admit process
Developed detailed operational reporting
Set up development production process
Approved business case for CVICU bed capacity
Built capacity planning model for CVICU and Ward 42
Developed patient load planning tool
Initiated daily bed management meeting
Enhanced recovery pathway in ICU
Scheduling workshop for productive theatres
Releasing time to care foundation modules
CVICU\HDU merger
Further improvements in progress:. 3 in a row bypass (productive list)
Optimise the theatre schedule by planning a “productive list”
ECMO – Resource planning processTo improve resource planning and day to day processes to
reduce the impact of high ECMO demand on bypass cases
The Productive Operating Room (NHS Programme)To increase productivity and improve safety in theatre through
better co‐ordination and removal of waste and
frustrations
Delay to discharge – ward 42To reduce LOS for patients who are delayed during the discharge
process, reducing theatre cancellations
Delay to discharge CVICUTo reduce LOS for patients who are delayed during the discharge
process, reducing theatre cancellations•
Elective patient focused team projectTo maintain elective throughput in the service during periods of
constrained production• ICU Nursing FTE business case approved• Weekend contract case certainty• Rapid Rounds ward 42• Increasing capacity\delivery project
Monthly Performance
The wait list has grown significantly in December. 108 eligible referrals were accepted onto the wait list which was much higher than anticipated (82 referrals in December 2010). Previous years have shown a seasonal downturn in our referral rate from December through to March so December 2011 certainly is a significant outlier in that regard. During the month of December the service delivered 65 eligible procedures against a plan of 71, and YTD we are now 13 ahead of planned eligible volumes. Whilst the service was behind in terms of eligible bypass production in December, the service over delivered by six thoracic cases . This was due to a higher than anticipated referral rate for urgent thoracic cases. Outsourcing continued through December with all available lists at the Mercy being booked for bypass surgery. Due to Mercy closing down for Christmas we were only able to complete 7 cases through this pathway. Mercy is available from the 16th of January and we will immediately resume outsourcing. Due to surgeon leave only limited lists are available at the Mercy through January which will effect the time required to reduce the number of waiting patients.
The cancellation rate for December is the lowest we have seen since July 2011. The service plans to use this time to address a backlog of elective work for as long as the downturn lasts. Historical trends suggest this referral pattern change should be sustained until March – however the referral pattern this year has been so different from previous years it is hard to predict what the demand profile in the coming months will be.
Reduce Cardiac Waiting List, Actual vs Target, Jan 2010 - Jun 2012
0
20
40
60
80
100
120
140
160
Jan-
2010
Feb-
2010
Mar
-201
0Ap
r-20
10M
ay-2
010
Jun-
2010
Jul-2
010
Aug-
2010
Sep-
2010
Oct
-201
0N
ov-2
010
Dec
-201
0Ja
n-20
11Fe
b-20
11M
ar-2
011
Apr-
2011
May
-201
1Ju
n-20
11Ju
l-201
1Au
g-20
11Se
p-20
11O
ct-2
011
Nov
-201
1D
ec-2
011
Jan-
2012
Feb-
2012
Mar
-201
2Ap
r-20
12M
ay-2
012
Jun-
2012
Actual Goal M OH Target
69

70

6
FEEDBACK TO BOARD
71

72

7
GENERAL BUSINESS
73

74

8
APPENDICES
8.1 Healthcare System Diagram
75

76
8.1 Heal thcare System Diagram
77

78
9
APPENDICES
9.1 Resolution to exclude the public from a meeting of the Hospital Advisory Meeting
79

80

AUCKLAND DISTRICT HEALTH BOARD
RESOLUTION TO EXCLUDE THE PUBLIC
FROM A MEETING OF THE HOSPITAL ADVISORY MEETING
Clauses 32 and 33, Schedule 3, New Zealand Public Health and Disability Act 2000 (“Act”)
That the exclusion of the public from the relevant part of the meeting is necessary to enable the Board to de liberate in private on a decision or recommendation as to whether any of the grounds in paragraphs (a) to (d) of clause 32 of Schedule 3 of the Act are established in relation to all or any part of the meeting. 1. THAT the public b e excluded from the following part of the pro ceedings of th is meeting, namely consideration of items 9 to of the Agenda. The general subject of the matters t o be considered while the public is excluded, the reason for passing this resolution in relation to each matter, and the specific grounds under the above clause for the passing of this resolution are as follows: General subject of each matter to be considered:
Reason for passing this resolution in relation to each matter:
Ground(s) under clause 34 for the passing of this resolution:
9.1 Confidential HAC Minutes
7 December 2011 9.2 Action Points
7 December 2011 9.3 Risk 9.4 Qualit y 9.5 Patient and Family
Experience
9.6 Unaccepted Laboratory Reports
To enable the Board to carry on without prejudice or disadvantage commercial activities and negotiations: Official Information Act 1982 s.9(2)(i) and s.9(2)(j)
That the public conduct of the relevant part of the meeting would be likely to result in the disclosure of information for which good reason for withholding would exist under s 9 of the Official Information Act 1982.
81

Hospital Advisory Committee
A g e n d aMEETING DETAILS
Time and Date 9:30am – 12:30pm, Wednesday, 15 February 2012
Venue A+ Trust Room, Level 5, Clinical Education Centre, Auckland City Hospital
Members Judith Bassett (Chair), Jo Agnew, Peter Aitken, Susan Buckland, Rob Cooper, Dr Chris Chambers, Dr Lester Levy, Dr Lee Mathias, Robyn Northey, Gwen Tepania-Palmer, Ian Ward, Assoc Prof Anne Kolbe, Prof Iain Martin.
Apologies
In Attendance Garry Smith, Dr Margaret Wilsher, Brent Wiseman, Greg Balla, Taima Campbell, Janice Mueller, Ian Bell.
COMMITTEE FUNCTIONS
To monitor the financial and operational performance of the hospitals and related services of the DHB, assess strategic issues relating to the provision of hospital services by or through the DHB and give the Board advice and recommendations on that monitoring and that assessment.
Item Page No
1
2m to 9:32am
Attendance and Apologies 001
2
3m to 9:35am
Conflicts of Interest 003
3
5m to 9:40am
Confirmation of Minutes Wednesday 7 December 2011 013
4
10m to 9:50am
Action Points Wednesday 7 December 2011 019
5
40m 15m to 10:45am
Provider Operational Performance Report
5.1 Operational Performance Report 5.2 Health Target Updates
023
025 059
6 Feedback to Board 071
7
5m to 10:55am
General Business 073
8 Appendices
8.1 Healthcare System Diagram
075
Hospital Advisory Committee Agenda – Wednesday 15 February 2012 Page 1

Hospital Advisory Committee Agenda – Wednesday 15 February 2012 Page 2
9
70m to 12:00 noon
Resolution to exclude the public from a meeting of the Hospital Advisory Meeting
9.1 Resolution to exclude the public
079
NEXT MEETING
Time and Date: 9.30am, Wednesday, 28 March 2012
Venue: A+ Trust Room, Level 5, Clinical Education Centre, Auckland City Hospital
Hei Oranga Tika Mo Te Iti Me Te Rahi
Healthy Communities, Quality Healthcare