atypical antipsychotic utilization: emerging trends in...
TRANSCRIPT
Atypical Antipsychotic Utilization: Emerging Trends in Indiana
Medicaid Children and Teens
Professor of Psychiatry Indiana University School of Medicine
MMAC Consultant
Andrew W. Goddard, M.D.
Collaborators IU Medicaid Medical Advisory
Cabinet (MMAC) Steve Downs, MD Kristin Hendrix, PhD Katie Schwartz, JD Matt Aalsma, PhD Maria Finnell, MD Kathleen Unroe, MD Brownsyne Tucker Edmonds, MD Nancy Swigonski, MD Marc Rosenman, MD Wendy Morrison, PhD
Indiana OMPP
Emily Hancock, PharmD
Dave Lambert, JD
IU Regenstrief Institute
Bert Ambeuhl, MS
IU Biostatistics
James Slaven, MS

Context for the Presentation • OMPP requested that MMAC conduct a local replication
and extension of the 16-state AHRQ-Rutgers Study of atypical antipsychotic (AAP) use in IN Medicaid children and teens.
• Initial report to MHQAC 10/2011:
— AAP utilization rates in IN Medicaid FFS youth (2.3%) were similar to AHRQ-Rutgers findings, but IN utilization rates for foster children were greater (17%);
— AHRQ-Rutgers dataset not well defined with respect to FFS, RBMC, and unique cases.

Agenda • Overview of atypical antipsychotics
(AAPs); position in the marketplace • Rationale for current Indiana-OMPP
study extension • Methods • Overview of Current Cost/Utilization
Findings • Conclusions/Next Steps

Currently Available AAPs
Dopamine Serotonin Muscarinic Histamine Adrenergic Agent D1 D2 D4 5-HT1A 5-HT2A 5-HT2C M1 H1 Alpha1A Alpha2A
Aripiprazole - +++ + +++ +++ ++ - ++ ++ ++ Asenapine +++ +++ +++ +++ ++++ ++++ - +++ +++ +++ Clozapine + + ++ + +++ +++ +++ +++ +++ ++
Iloperidone + +++ ++ ++ +++ ++ - ++ ++++ + Lurasidone + +++ ++ +++ +++ + - - ++ ++ Olanzapine ++ ++ ++ - +++ +++ +++ +++ + +
Paliperidone ++ +++ ++ ++ ++++ ++ - ++ +++ +++ Quetiapine + + - + + - ++ +++ ++ - Risperidone + +++ +++ + ++++ ++ - ++ +++ ++ Ziprasidone ++ +++ ++ ++ ++++ ++ - ++ ++ + Binding affinities expressed as plus (+) sign based on Ki (nM) from published sources. Very high (++++): Ki < 1, High (+++): Ki < 10, Moderate (++): Ki < 100, Low (+): Ki < 1000, Very low (-): Ki < 10,000
Dosing/administration
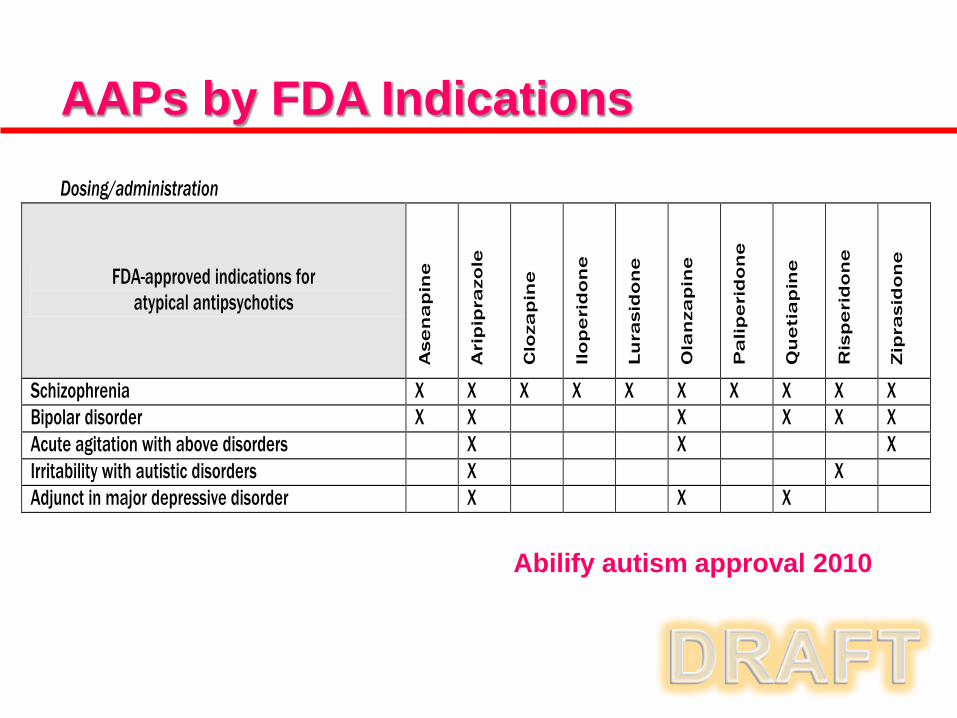
FDA-approved indications for atypical antipsychotics
Ase
na
pin
e
Ari
pip
razo
le
Clo
zap
ine
Ilo
pe
rid
on
e
Lu
rasi
do
ne
Ola
nza
pin
e
Pa
lip
eri
do
ne
Qu
eti
ap
ine
Ris
pe
rid
on
e
Zip
rasi
do
ne
Schizophrenia X X X X X X X X X X Bipolar disorder X X X X X X Acute agitation with above disorders X X X Irritability with autistic disorders X X Adjunct in major depressive disorder X X X
AAPs by FDA Indications
Abilify autism approval 2010
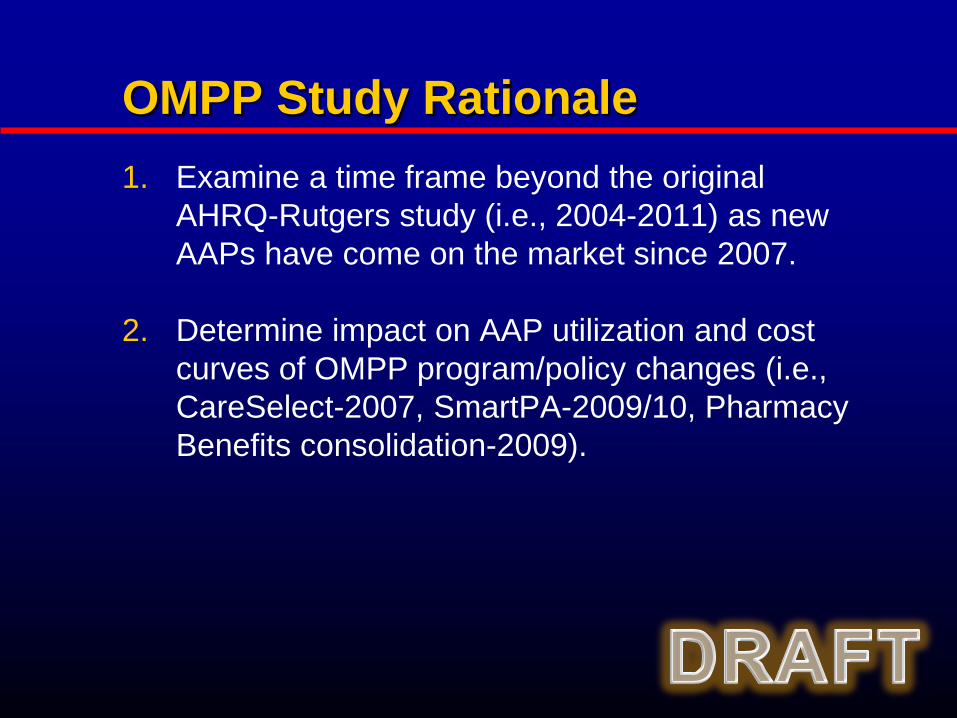
OMPP Study Rationale 1. Examine a time frame beyond the original
AHRQ-Rutgers study (i.e., 2004-2011) as new AAPs have come on the market since 2007.
2. Determine impact on AAP utilization and cost curves of OMPP program/policy changes (i.e., CareSelect-2007, SmartPA-2009/10, Pharmacy Benefits consolidation-2009).
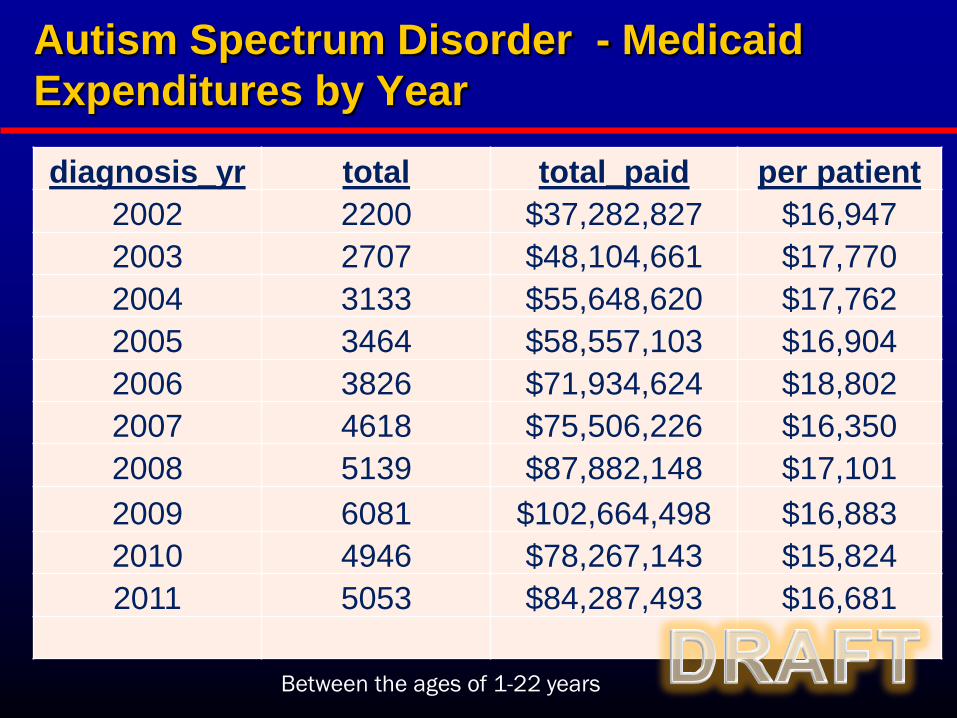
Autism Spectrum Disorder - Medicaid Expenditures by Year
diagnosis_yr total total_paid per patient 2002 2200 $37,282,827 $16,947 2003 2707 $48,104,661 $17,770 2004 3133 $55,648,620 $17,762 2005 3464 $58,557,103 $16,904 2006 3826 $71,934,624 $18,802 2007 4618 $75,506,226 $16,350 2008 5139 $87,882,148 $17,101 2009 6081 $102,664,498 $16,883 2010 4946 $78,267,143 $15,824 2011 5053 $84,287,493 $16,681
Between the ages of 1-22 years
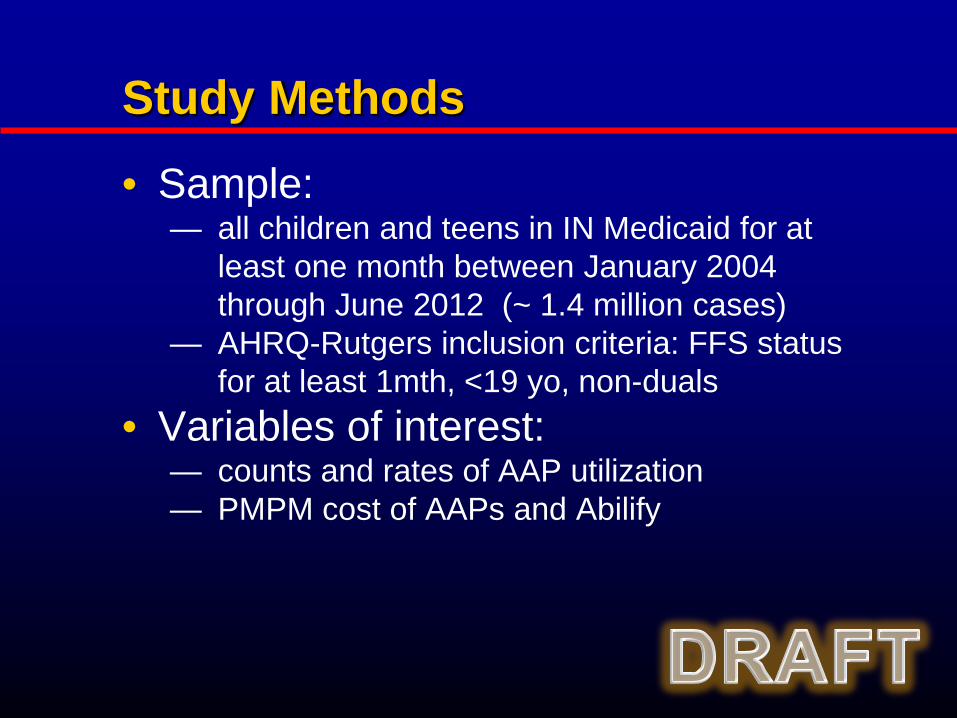
Study Methods
• Sample: — all children and teens in IN Medicaid for at
least one month between January 2004 through June 2012 (~ 1.4 million cases)
— AHRQ-Rutgers inclusion criteria: FFS status for at least 1mth, <19 yo, non-duals
• Variables of interest: — counts and rates of AAP utilization — PMPM cost of AAPs and Abilify

Number of IN Medicaid Children (<19yo)
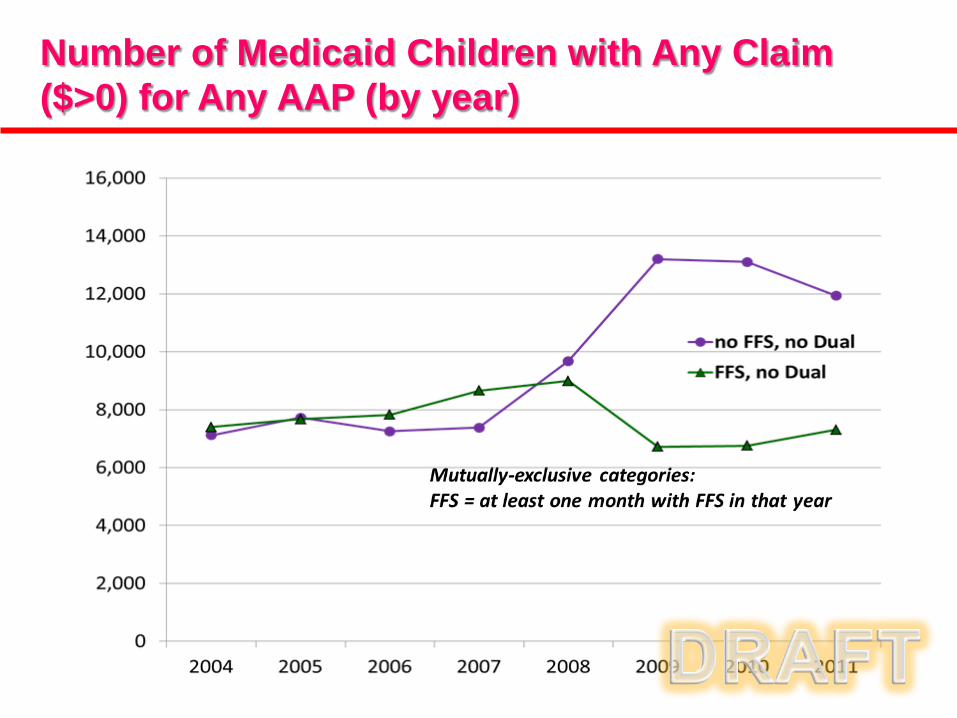
Number of Medicaid Children with Any Claim ($>0) for Any AAP (by year)
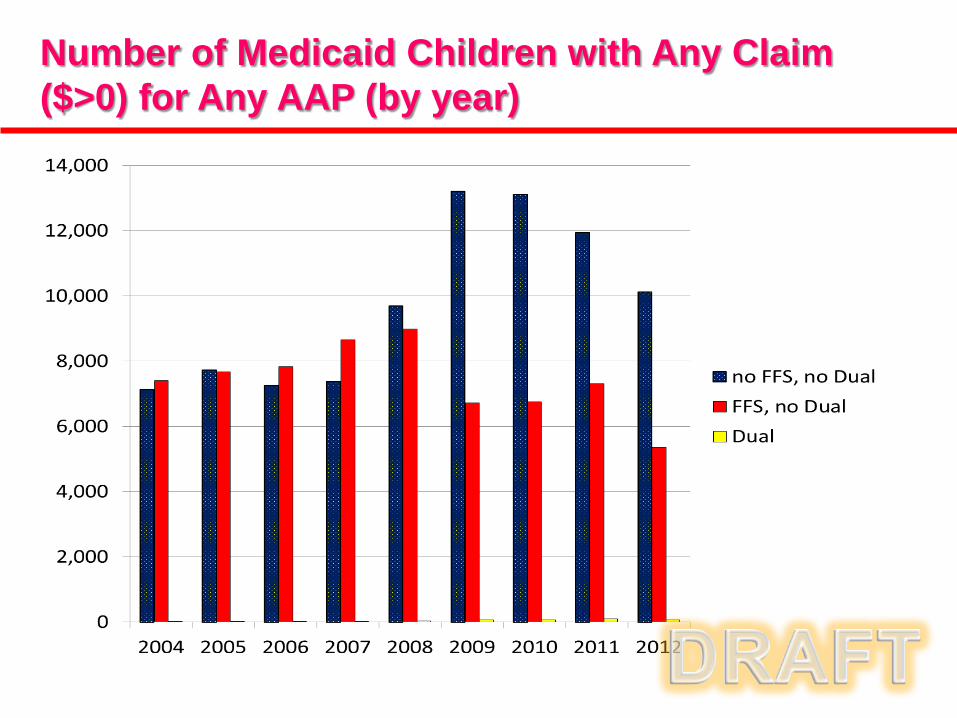
Number of Medicaid Children with Any Claim ($>0) for Any AAP (by year)
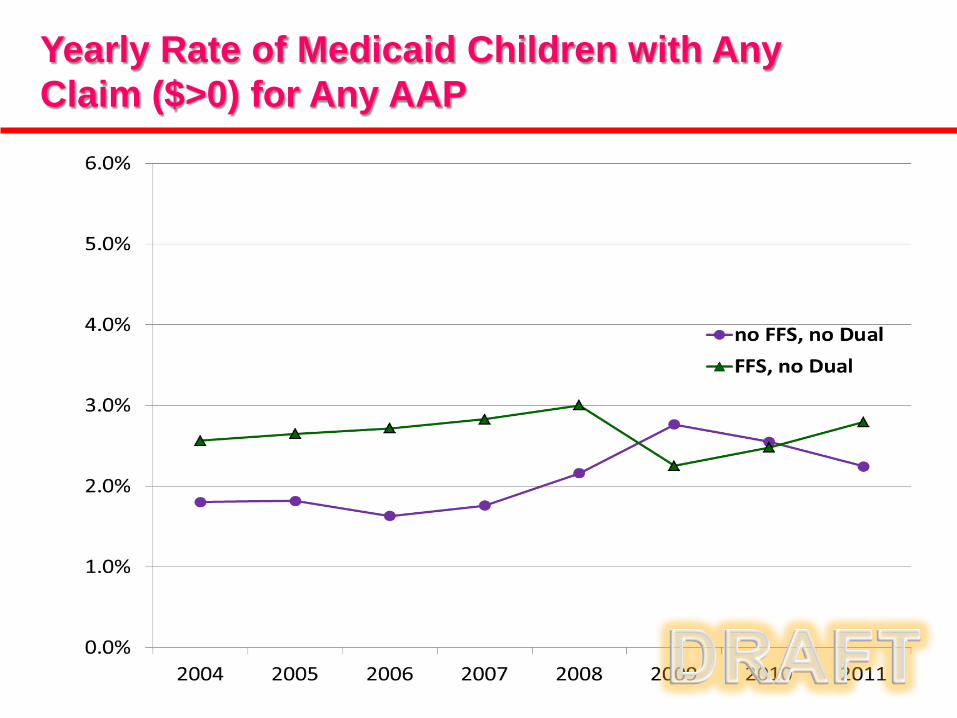
Yearly Rate of Medicaid Children with Any Claim ($>0) for Any AAP
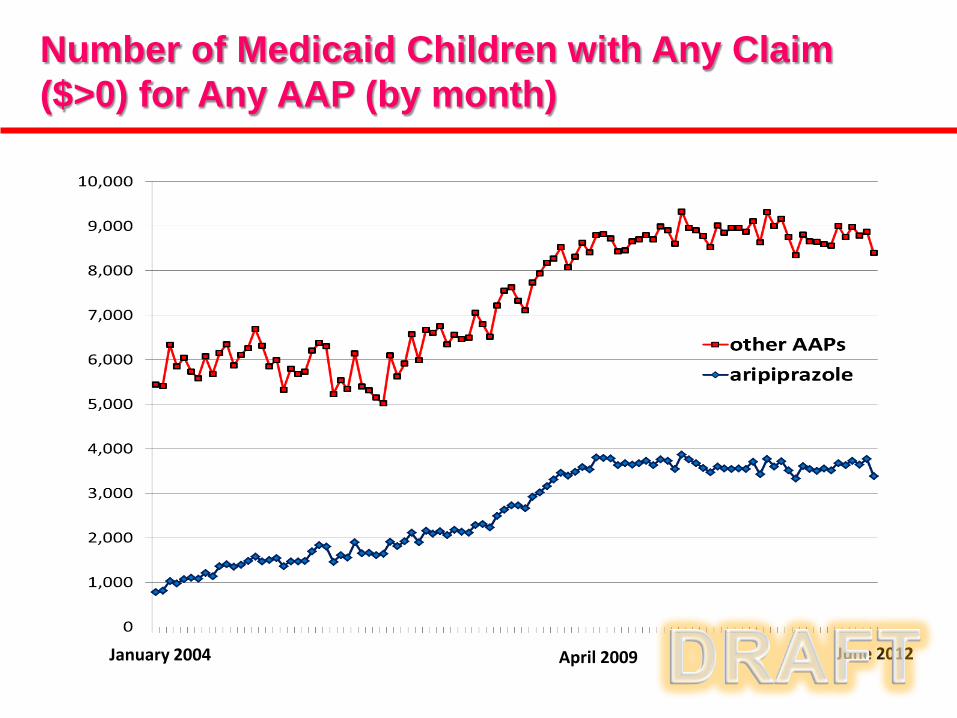
Number of Medicaid Children with Any Claim ($>0) for Any AAP (by month)
January 2004 April 2009 June 2012
0
100
200
300
400
500
600
700(d
olla
rs)
Month
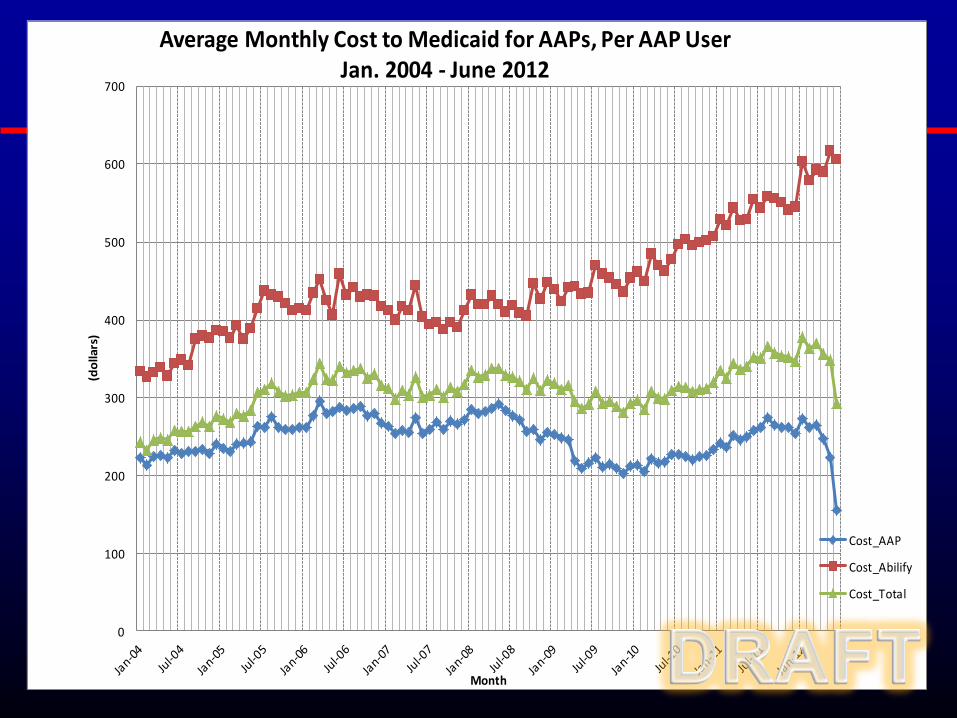
Average Monthly Cost to Medicaid for AAPs, Per AAP User Jan. 2004 - June 2012
Cost_AAP
Cost_Abilify
Cost_Total
http://insendems.wordpress.com/2011/07/22/budget-briefs-medicaid-budget-breakdown/
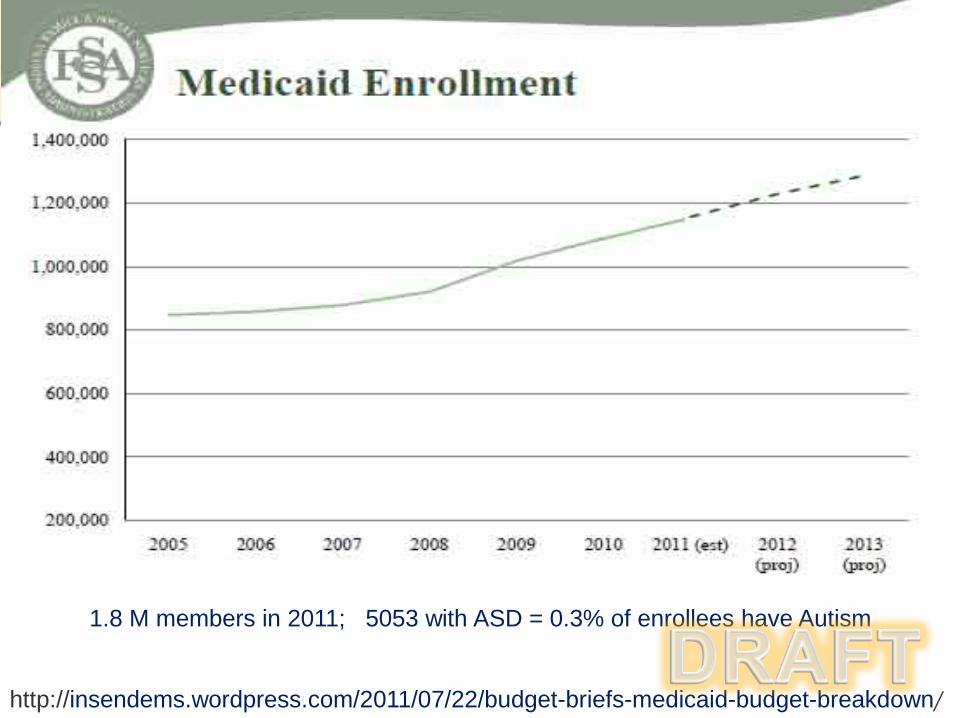
1.8 M members in 2011; 5053 with ASD = 0.3% of enrollees have Autism
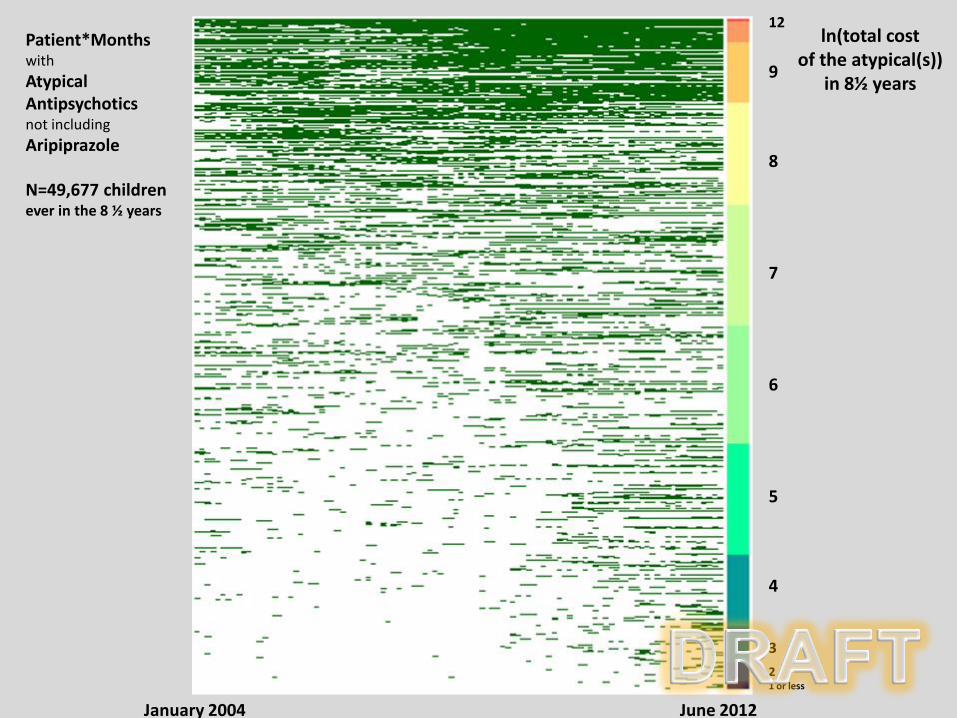
January 2004 June 2012
Patient*Months with Atypical Antipsychotics not including Aripiprazole N=49,677 children ever in the 8 ½ years
12
9 8 7 6 5 4 3
2 1 or less
ln(total cost of the atypical(s))
in 8½ years

January 2004 June 2012
Patient*Months with Aripiprazole N=26,011 children ever in the 8 ½ years
11 9
8
7
6 5 4 3 or less
ln(total cost of the atypical)
in 8½ years
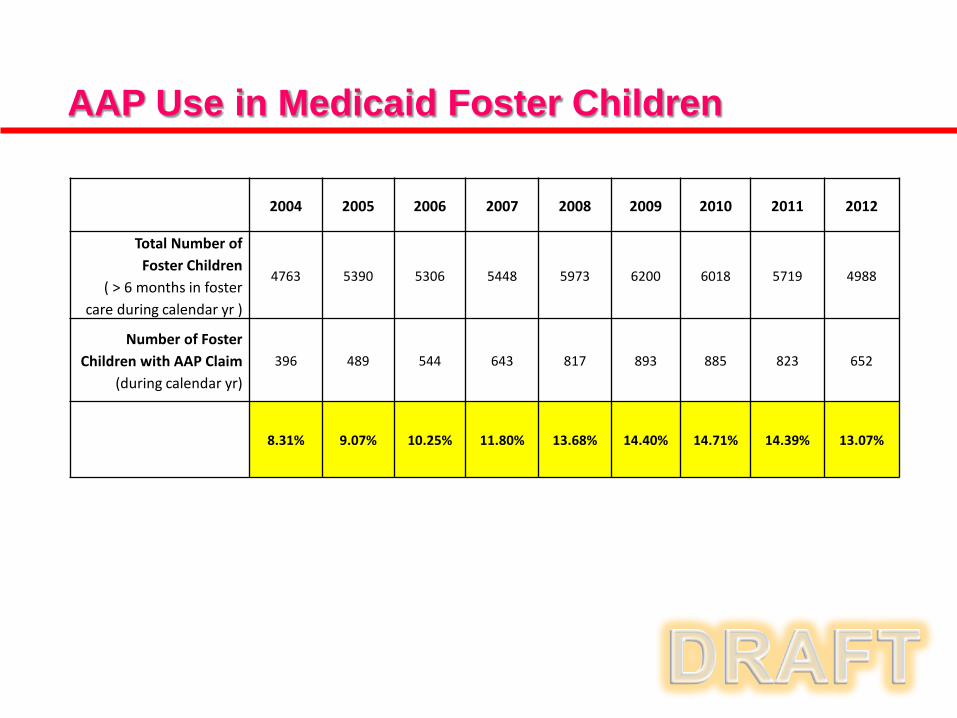
2004 2005 2006 2007 2008 2009 2010 2011 2012
Total Number of Foster Children
( > 6 months in foster care during calendar yr )
4763 5390 5306 5448 5973 6200 6018 5719 4988
Number of Foster Children with AAP Claim
(during calendar yr) 396 489 544 643 817 893 885 823 652
8.31% 9.07% 10.25% 11.80% 13.68% 14.40% 14.71% 14.39% 13.07%
AAP Use in Medicaid Foster Children

AAP Use in Medicaid Children ≤ 5 Years Old
2004 2005 2006 2007 2008 2009 2010 2011 2012
Number FFS children ≤ 5 y.o.
337 307 349 373 372 301 286 304 136
Number Non-FFS children ≤ 5
398 394 344 361 470 575 581 521 315
Conclusions • Similarity to original AHRQ-Rutgers findings
• Utilization patterns: FFS & non FFS AAP utilization is fairly flat (2-3%),
despite non-FFS population growth after 2007
• Cost trends: Not adjusted. Average Abilify per member per month spending increases after 2007-8. Other AAP spending stabilizes by early 2009.
• Foster children demonstrate a higher AAP exposure rate, when compared to non-foster children, as expected. Their AAP utilization rates were fairly constant over the study period (~8-15%).
• FFS children under 5 years old experience some AAP exposure, though utilization rates did not appear to grow over time.

Limitations • Claims data do not provide information
about individual patient status, patient needs, and individual provider decision processes.
• Minimal access to clinical safety data (e.g.,
basic info such as weight, vitals).
• Evaluation of “clinically appropriate” prescribing calls for either a chart-review study or, ideally, a prospective F/U study.

Next Steps: follow-up analyses • Analysis of AAP use by mental health diagnosis.
• Analysis of AAP use by other demographic
variables (e.g. race, Medicaid aid category, age range).
• Preliminary safety analyses (e.g. rates of diabetes in AAP utilizers versus non-utilizers).
• Regression analyses to more rigorously assess impact of OMPP program/policy updates on costs.