attenuation of arias intensity based on the chi-chi...
TRANSCRIPT

Howard Hwang
Professor
Graduate Institute of Architecture and Sustainable Planning
National Ilan University
Attenuation of Arias Intensity Based on
the Chi-Chi Earthquake Data

Outlines of Presentation
Introduction
Objective of study
Strong-motion data from the Chi-Chi earthquake
Estimation of Arias intensity
Two-step regression analysis
Discussion of regression results
Conclusions

Introduction
Suitable parameter for describing ground shaking?
Peak ground acceleration
Spectral acceleration
Arias intensity

Objective of Study
Develop attenuation relations of Arias intensity for
various site conditions based on the strong-motion
data recorded in the Chi-Chi earthquake.

The Chi-Chi earthquake resulted
from a rupture of the Chelungpu
fault and produced an energetic
aftershock sequence.
ハレ
Chelungpu Fault
Epicenter of Chi-Chi Earhtquake
N
0 20 40 Kilometers

Date Universal
time
Latitude
(N)
Longitude
(E)
Local magnitude
ML
1999/09/20 14:49:40.07 23.977 120.830 6.07
1999/09/20 17:57:15.58 23.912 121.044 6.44
1999/09/20 18:03:40.83 23.797 120.861 6.60
1999/09/20 18:11:54.21 23.865 121.067 6.70
1999/09/20 18:16:17.95 23.862 121.041 6.66
1999/09/20 21:46:38.11 23.585 120.857 6.59
1999/09/22 00:14:40.77 23.826 121.047 6.80
1999/09/22 00:49:43.45 23.765 121.031 6.20
1999/09/22 12:17:20.96 23.739 120.981 6.00
1999/09/25 23:52:49.51 23.854 121.002 6.80
1999/10/22 02:18:56.90 23.517 120.423 6.40
1999/10/22 03:10:17.46 23.533 120.431 6.00
2000/06/10 18:23:29.45 23.901 121.109 6.70
Large Aftershocks of the Chi-Chi Earthquake

Strong-motion data used in this study are taken
from the mainshock and three large aftershocks of
the Chi-Chi earthquake.

Summary of Four Earthquake Events
Event Mainshock /
aftershock Date Universal time
Focal depth
(km) ML MW
1 Mainshock 1999/09/20 17:47:15.85 8.0 7.3 7.7
2 Aftershock 1999/09/20 18:03:40.83 3.5 6.6 6.2
3 Aftershock 1999/09/22 00:14:40.77 15.6 6.8 6.4
4 Aftershock 1999/09/25 23:52:49.51 9.9 6.8 6.5


With extensive strong-motion stations in Taiwan, strong-
motion data resulting from the mainshock and aftershocks
of the Chi-Chi earthquake are well recorded.

Site Classification of Strong-Motion Stations
Lee et al. (2001) classified strong-motion stations into four site
classes.
Site class B: rock sites
Site class C: sites with very dense soils
Site class D: sites with stiff soils
Site class E: sites with soft soils
The site classes of these strong-motion stations are utilized and
implemented as a GIS data file.

Site class D
(stiff soil sites)
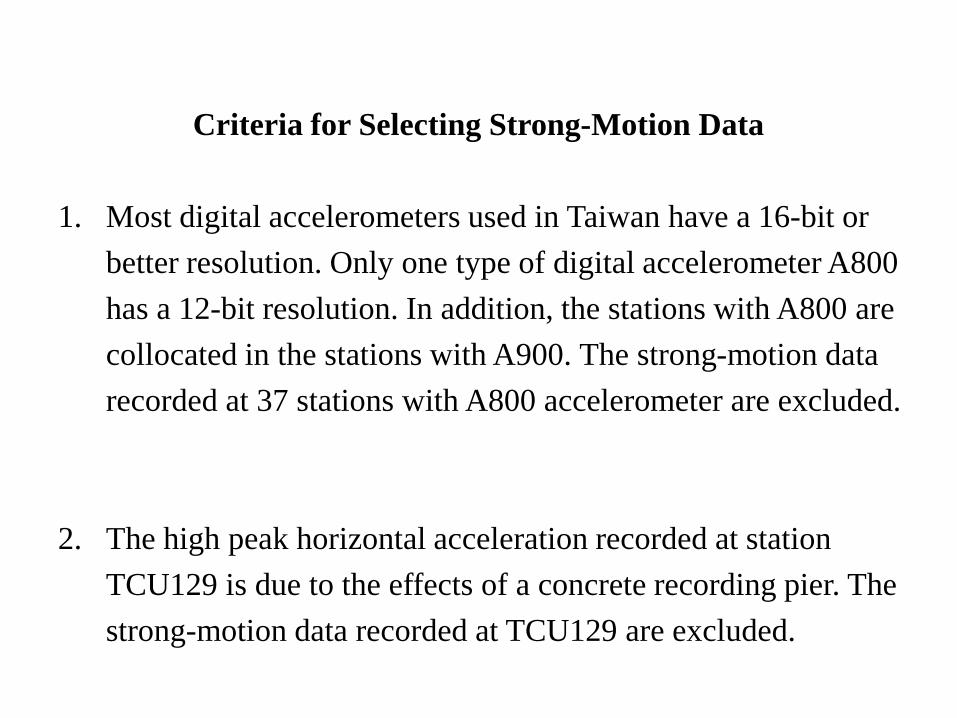
Criteria for Selecting Strong-Motion Data
1. Most digital accelerometers used in Taiwan have a 16-bit or
better resolution. Only one type of digital accelerometer A800
has a 12-bit resolution. In addition, the stations with A800 are
collocated in the stations with A900. The strong-motion data
recorded at 37 stations with A800 accelerometer are excluded.
2. The high peak horizontal acceleration recorded at station
TCU129 is due to the effects of a concrete recording pier. The
strong-motion data recorded at TCU129 are excluded.

3. The site classes of 7 strong-motion stations are not
available. The strong-motion data recorded at these
stations are excluded.
4. The characteristics of strong motion in the hanging
wall area are quite different from those in the footwall
area. These are 13 hanging wall stations within 35 km
from the surface trace of Chelungpu fault. The strong-
motion data recorded at these stations are excluded.
In summary, strong-motion data selected for this study
are from stations located in the footwall area or in the
area away from the fault.
The strong-motion data are separated into four groups
according to site classes B, C, D, and E.
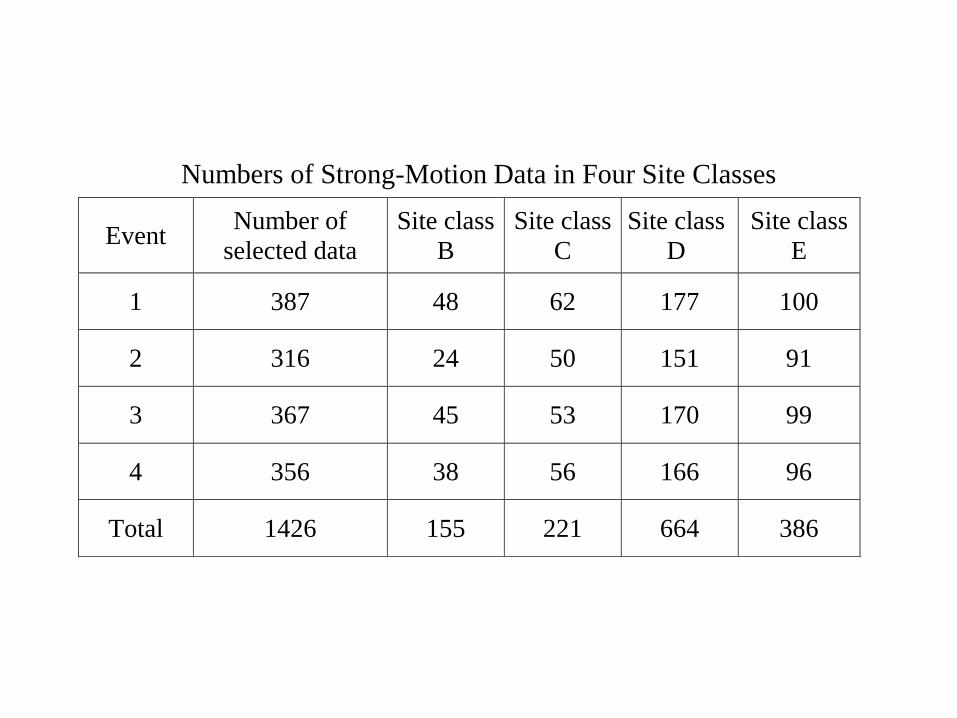
Numbers of Strong-Motion Data in Four Site Classes
Event Number of
selected data
Site class
B
Site class
C
Site class
D
Site class
E
1 387 48 62 177 100
2 316 24 50 151 91
3 367 45 53 170 99
4 356 38 56 166 96
Total 1426 155 221 664 386

Estimation of Arias Intensity (Arias, 1970)
0t
0
2EWEW dt(t)][a
g2
πI
NSEWh III

-300
-200
-100
0
100
200
300
0 15 30 45
Time (sec)
Acce
lera
tio
n (
cm
/se
c/s
ec)
TCU055 E-W Direction
MW = 7.7 R = 6.49 km
Site Class D
Mainshock of Chi-Chi Earthquake
55
-300
-200
-100
0
100
200
300
0 15 30 45
Time (sec)
Acce
lera
tio
n (
cm
/se
c/s
ec)
TCU055 N-S Direction
MW = 7.7 R = 6.49 km
Site Class D
Mainshock of Chi-Chi Earthquake
55
Horizontal Acceleration Time Histories at TCU055
IEW = 1.753 m/sec
INS = 1.524 m/sec
Ih = INS + INS = 3.277 m/sec

GIS Mapping of the Chelungpu Fault
The Chelungpu fault is an east-dipping thrust fault. After
the Chi-Chi earthquake, an approximately 100-km surface
trace of the Chelungpu fault was mapped in detail by the
Central Geological Survey (CGS) of Taiwan. The results
were published in a series of 1:25,000 scale maps.
On the basis of these maps, a digital coverage of the
Chelungpu fault is created using ArcView, a geographic
information system (GIS) software package.

Chelungpu Fault
0 5 10 Kilometers
N
Hanging wall areaFootwall area
Shortest Horizontal Distance
The shortest horizontal distances R of all strong-motion
stations to the surface trace of the Chelungpu fault are
determined using the spatial analysis tools built into
ArcView.

R = 6.49 km
Hanging wall areaFootwall area

Hanging wall area
Footwall area

2/122 )hR(r
h is the focal depth in km.
The source distance r is defined as
Example: TCU055
h = 8 km (Event 1, mainshock)
r = ( 6.492 + 82 )1/2 = 10.30 km
R
h
r

Factors Affecting Arias Intensity
• Seismic source Moment magnitude (MW)
• Path attenuation Source distance ( r )
• Local site condition Site classes B, C, D, and E

Regression Model
For each site class, the regression model for Arias intensity is
ln Ih = a MW + b ln r + c + ε (1)
ε is the random error (residual) and N( 0, σ2 ).
a, b, and c are unknown regression coefficients.

Two-Step Regression Analysis
The two-step regression analysis method proposed by
Joyner and Boore (1981, 1993) is used to derive the
attenuation relation.
Advantage: It decouples the determination of the
magnitude coefficient from the determination of the
distance coefficient.

Using strong-motion data, an attenuation relation of Arias
intensity for each site class is derived.
ln Ih = a MW + b ln r + c + ε
Regression coefficients Site class
a b c σ
B 2.071 -2.178 -8.492 1.29
C 2.290 -1.245 -13.539 1.23
D 2.155 -1.323 -11.920 1.25
E 1.746 -1.585 -7.409 0.82

Attenuation Curves of Arias Intensity for Site Class D

Comparison of Attenuation Curves with
Different Moment Magnitudes

Median Attenuation Curves of Arias Intensity with Four Moment Magnitudes
0.01
0.1
1
10
1 10 100 1000
Shortest Distance to Surface Projection of Fault (km)
Arias I
nte
nsity (
m/s
ec)
ln Ih = 2.155 MW - 1.323 ln r - 11.920 + ε
Site Class D
Focal Depth = 10 km
MW = 7.5
MW = 6.5
MW = 6.0
MW = 7.0

Comparison of Attenuation Curves
for Four Site Classes

Median Attenuation Curves of Arias Intensity for Four Site Classes
0.01
0.1
1
10
1 10 100 1000
Shortest Distance to Surface Projection of Fault (km)
Arias I
nte
nsity (
m/s
ec)
Site Class B
Site Class C
Site Class D
Site Class E
MW = 7
Focal Depth = 10 km

The attenuation curves of Arias intensity for soil sites (site
classes C, D, and E) have a similar shape. The attenuation
curve for sites with soft soils (site class E) has the largest
amplitude and the attenuation curve for sites with very
dense soils (site class C) has the smallest amplitude.
The attenuation curve of Arias intensity for rock sites (site
class B) decreases faster than the curves for soil sites (site
classes C, D, and E).

Conclusions
The attenuation relations of Arias intensity for four site
classes (B, C, D, and E) have been derived based on data
from the Chi-Chi earthquake.
The attenuation relations established in this study can be
used to estimate Arias intensity from a rupture of a thrust
fault for stations located in the footwall area or in the area
away from the fault.