attenuation - homebrewers association · trial forced fermentation protocol analysis • tests are...
TRANSCRIPT

Exploring Attenuation
Greg Doss
Wyeast Laboratories Inc.
NHC 2012

Overview
• General
• Testing
• Model

Brewing Control Panel
Beginning Brewing Control
Experienced Brewing Control

Volatile Aroma Compounds
Residual Carbohydrate
Hop Flavor
Color
Hop Aroma
Bitterness
Malt Character
Clarity
Negative Flavor Compounds
Ethanol
Carbonation
Good Beer – Balancing Act

Control Points in Brewing
Ingredient Selection
Successful Fermentation
Good Beer
Good Finishing
Good Processing
+ + =
•Malt •Hops •Water
•Adjuncts •Misc.
•Milling •Mash •Sparge
•Boil •Cooling
•Desired Culture •Aeration
•Yeast Pitch Rate •Culture Health •Temperature
•Yeast Nutrition
•Conditioning •Dry Hopping •Clarification
•Kegging/Bottling
+
It’s All About Control
Brewer’s Goal
1. Complete control over all process variables.
2. Manipulate the variables to achieve the desired beer.
2010 NHC

Fermentation Mass Balance
Carbohydrate 1.00g
Ethanol 0.5 g
CO2
0.5 g
Carbohydrate 1.00g
Ethanol 0.375g
CO2 .375g
Carbohydrate 0.25g
+ +
+
Apparent Attenuation
Carbohydrate 1.00g
Ethanol 0.375g
CO2 0.375g
Carbohydrate 0.25g
+ +
Real Attenuation

Attenuation
Apparent Attenuation (ASBC Apparent Degree of Fermentation)
%AA = (OG – TG) / OG x 100
Example:
OG = 1.056, TG = 1.012
(56-12)/56 x 100 = 78.57%

Balancing Beers
• Phase 1
– Determine Terminal
– BU:TG
• Phase 2
– Sensory
– Sweetness Factor

BU:TG TG
5 6 7 8 9 10 11 12 13 14 15 16 17 18 19 20
BU
15 3.00 2.50 2.14 1.88 1.67 1.50 1.36 1.25 1.15 1.07 1.00 0.94 0.88 0.83 0.79 0.75
17.5 3.50 2.92 2.50 2.19 1.94 1.75 1.59 1.46 1.35 1.25 1.17 1.09 1.03 0.97 0.92 0.88
20 4.00 3.33 2.86 2.50 2.22 2.00 1.82 1.67 1.54 1.43 1.33 1.25 1.18 1.11 1.05 1.00
22.5 4.50 3.75 3.21 2.81 2.50 2.25 2.05 1.88 1.73 1.61 1.50 1.41 1.32 1.25 1.18 1.13
25 5.00 4.17 3.57 3.13 2.78 2.50 2.27 2.08 1.92 1.79 1.67 1.56 1.47 1.39 1.32 1.25
27.5 5.50 4.58 3.93 3.44 3.06 2.75 2.50 2.29 2.12 1.96 1.83 1.72 1.62 1.53 1.45 1.38
30 6.00 5.00 4.29 3.75 3.33 3.00 2.73 2.50 2.31 2.14 2.00 1.88 1.76 1.67 1.58 1.50
32.5 6.50 5.42 4.64 4.06 3.61 3.25 2.95 2.71 2.50 2.32 2.17 2.03 1.91 1.81 1.71 1.63
35 7.00 5.83 5.00 4.38 3.89 3.50 3.18 2.92 2.69 2.50 2.33 2.19 2.06 1.94 1.84 1.75
37.5 7.50 6.25 5.36 4.69 4.17 3.75 3.41 3.13 2.88 2.68 2.50 2.34 2.21 2.08 1.97 1.88
40 8.00 6.67 5.71 5.00 4.44 4.00 3.64 3.33 3.08 2.86 2.67 2.50 2.35 2.22 2.11 2.00
42.5 8.50 7.08 6.07 5.31 4.72 4.25 3.86 3.54 3.27 3.04 2.83 2.66 2.50 2.36 2.24 2.13
45 9.00 7.50 6.43 5.63 5.00 4.50 4.09 3.75 3.46 3.21 3.00 2.81 2.65 2.50 2.37 2.25
47.5 9.50 7.92 6.79 5.94 5.28 4.75 4.32 3.96 3.65 3.39 3.17 2.97 2.79 2.64 2.50 2.38
50 10.00 8.33 7.14 6.25 5.56 5.00 4.55 4.17 3.85 3.57 3.33 3.13 2.94 2.78 2.63 2.50
52.5 10.50 8.75 7.50 6.56 5.83 5.25 4.77 4.38 4.04 3.75 3.50 3.28 3.09 2.92 2.76 2.63
55 11.00 9.17 7.86 6.88 6.11 5.50 5.00 4.58 4.23 3.93 3.67 3.44 3.24 3.06 2.89 2.75
57.5 11.50 9.58 8.21 7.19 6.39 5.75 5.23 4.79 4.42 4.11 3.83 3.59 3.38 3.19 3.03 2.88
60 12.00 10.00 8.57 7.50 6.67 6.00 5.45 5.00 4.62 4.29 4.00 3.75 3.53 3.33 3.16 3.00
62.5 12.50 10.42 8.93 7.81 6.94 6.25 5.68 5.21 4.81 4.46 4.17 3.91 3.68 3.47 3.29 3.13
65 13.00 10.83 9.29 8.13 7.22 6.50 5.91 5.42 5.00 4.64 4.33 4.06 3.82 3.61 3.42 3.25
67.5 13.50 11.25 9.64 8.44 7.50 6.75 6.14 5.63 5.19 4.82 4.50 4.22 3.97 3.75 3.55 3.38
70 14.00 11.67 10.00 8.75 7.78 7.00 6.36 5.83 5.38 5.00 4.67 4.38 4.12 3.89 3.68 3.50
72.5 14.50 12.08 10.36 9.06 8.06 7.25 6.59 6.04 5.58 5.18 4.83 4.53 4.26 4.03 3.82 3.63
75 15.00 12.50 10.71 9.38 8.33 7.50 6.82 6.25 5.77 5.36 5.00 4.69 4.41 4.17 3.95 3.75
77.5 15.50 12.92 11.07 9.69 8.61 7.75 7.05 6.46 5.96 5.54 5.17 4.84 4.56 4.31 4.08 3.88
80 16.00 13.33 11.43 10.00 8.89 8.00 7.27 6.67 6.15 5.71 5.33 5.00 4.71 4.44 4.21 4.00
82.5 16.50 13.75 11.79 10.31 9.17 8.25 7.50 6.88 6.35 5.89 5.50 5.16 4.85 4.58 4.34 4.13
85 17.00 14.17 12.14 10.63 9.44 8.50 7.73 7.08 6.54 6.07 5.67 5.31 5.00 4.72 4.47 4.25
87.5 17.50 14.58 12.50 10.94 9.72 8.75 7.95 7.29 6.73 6.25 5.83 5.47 5.15 4.86 4.61 4.38
90 18.00 15.00 12.86 11.25 10.00 9.00 8.18 7.50 6.92 6.43 6.00 5.63 5.29 5.00 4.74 4.50
92.5 18.50 15.42 13.21 11.56 10.28 9.25 8.41 7.71 7.12 6.61 6.17 5.78 5.44 5.14 4.87 4.63
95 19.00 15.83 13.57 11.88 10.56 9.50 8.64 7.92 7.31 6.79 6.33 5.94 5.59 5.28 5.00 4.75

Factors Affecting Attenuation • Fermentability
– Grist
– Mash Time
– Mash Temperature
– Mash pH
– Mash thickness
• Yeast ability to ferment
– Strain • Sugar uptake
• Metabolism
– Culture health
– Inhibition

Carbohydrates/ Sugars
• Fructose 2%
• Glucose 8%
• Sucrose 6%
• Maltose 45%
• Maltotriose 14%
• Dextrins 25%

Experiment
• Strain
• Grist
• Temperature
• Time
Goal – Create a calculator to estimate terminal density
Original Density x Fermentability x Strain Att. Factor = Terminal Density
Fermentability
Ability to Fermentability

Strain
• Forced Fermentation
• Each Strain Triplicate
• With Media Control
• Calculate Strain factor from results

Trial Forced Fermentation Protocol Prep
• Centrifuge and wash yeast sample 2x to produce clean yeast paste
• mix media 1 L @ 19 P (Light DME all from same lot )
• Add 2g Saaz per L
• Autoclave (Sterilize)
• Blend to consistent starting density (15.0P)
• Shake 2 x 30 Seconds to achieve DO 8 ppm
• Pour 170 ml. control flask
– Inoculate with control yeast
• Inoculate 600ml. with 2.5g/150 ml washed yeast paste (Pitch Rate ~ 60 million - 80 million cell ml-1)
• Dispense into 3 x 150 ml.
• Centrifuge 25 ml. of Remaining
• Centrifuge control
4 Flasks per test. 3 with strain, 1 media control

• Record starting densities with digital density meter
• Incubate all flasks shaken 150 rpm @ 20 C
• Remove 1 ml. sample every three hours and cetrifuge.
• Measure density with refractometer
• Continue taking readings until refractometer readings stabilize for 2 hours.
• Remove flasks from shaker remove 25 ml. from flask
• Centrifuge 2 x to remove solids
• Measure density with digital density meter and record final density.
• Average readings for sample strain and calculate apparent attenuation.
• Record reading for control strain and calculate apparent attenuation.
Trial Forced Fermentation Protocol Data Recording

Trial Forced Fermentation Protocol Analysis
• Tests are subject to fermentability of media – Needs adjustment
• Calculate average control attenuation for all tests (75)
• Subtract average control from sample control to produce control factor
• Add control factor to strain attentuation.
Sample Control Att - Average Control Att = Control Factor
Control Factor + Strain Att = Final Att
Example 1007 Media Control Att = 76.67
Average Media Control Att = 77.05 1007 Att = 76.70
76.67 - 77.05 = -0.29
-0.29 + 76.70 = 76.41%

60.00%61.00%62.00%63.00%64.00%65.00%66.00%67.00%68.00%69.00%70.00%71.00%72.00%73.00%74.00%75.00%76.00%77.00%78.00%79.00%80.00%81.00%82.00%83.00%84.00%85.00%86.00%87.00%88.00%89.00%90.00%
10
07
10
10
10
28
10
56
10
84
10
98
10
99
11
87
12
14
12
72
12
75
13
18
13
32
13
35
13
88
14
50
14
69
17
28
17
62
17
64
19
68
20
00
20
01
20
07
20
35
20
42
21
12
21
24
22
06
22
47
22
78
23
08
23
52
25
65
25
75
30
68
33
33
34
63
35
22
35
38
36
38
37
11
37
24
37
25
37
26
37
87
39
42
39
44
40
21
51
12
55
26
% a
tte
nu
atio
n
strain
% Attenuation per strain
Trial Forced Fermentation Analysis

60.00%61.00%62.00%63.00%64.00%65.00%66.00%67.00%68.00%69.00%70.00%71.00%72.00%73.00%74.00%75.00%76.00%77.00%78.00%79.00%80.00%81.00%82.00%83.00%84.00%85.00%86.00%87.00%88.00%89.00%90.00%
40
21
12
14
20
42
21
12
20
07
10
07
10
10
23
08
20
35
33
33
23
52
12
75
22
47
37
25
22
78
19
68
20
01
35
38
21
24
30
68
36
38
10
99
39
42
20
00
22
06
35
22
13
35
25
75
10
84
25
65
10
56
17
28
13
88
10
28
37
87
37
26
10
98
51
12
55
26
13
18
12
72
14
50
17
64
14
69
13
32
39
44
34
63
11
87
17
62
37
24
37
11
% a
tte
nu
atio
n
Strain
% attenuation per strain
Trial Forced Fermentation Analysis

Attenuation Analysis
• Calculate average Att
• Divide Strain Att by Average Att for Att Factor
Example 1007 Att = 75.08 1056 Att = 77.35 Ave Att = 76.70
1007 75.08 / 76.70 = 97.88%
1056 77.35 / 76.70 = 100.84%

Experiment
• Strain
• Grist
• Temperature
• Time
Goal – Create a calculator to estimate terminal density
Original Density x Fermentability x Strain Att. Factor = Terminal Density
Fermentability
Ability to Fermentability

Fermentability Study
Variables
• pH
• Malt Grind
• Mash Thickness
• Density?
• Boil?
• Mash Temperature
• Grist
• Mash Time
Goals • Quantify how variables affect fermentability of wort • Manipulate one variable at a time

pH
• Affects performance of enzymes
• Malt
– Color
• Temperature
– Solution reaction
• Goal 5.2 - 5.3
• Used 5.2 Buffer (pH 5.2 - 5 Star)
– Affects original and terminal density slightly
– No affect on attenuation rate
– Tested at different pH
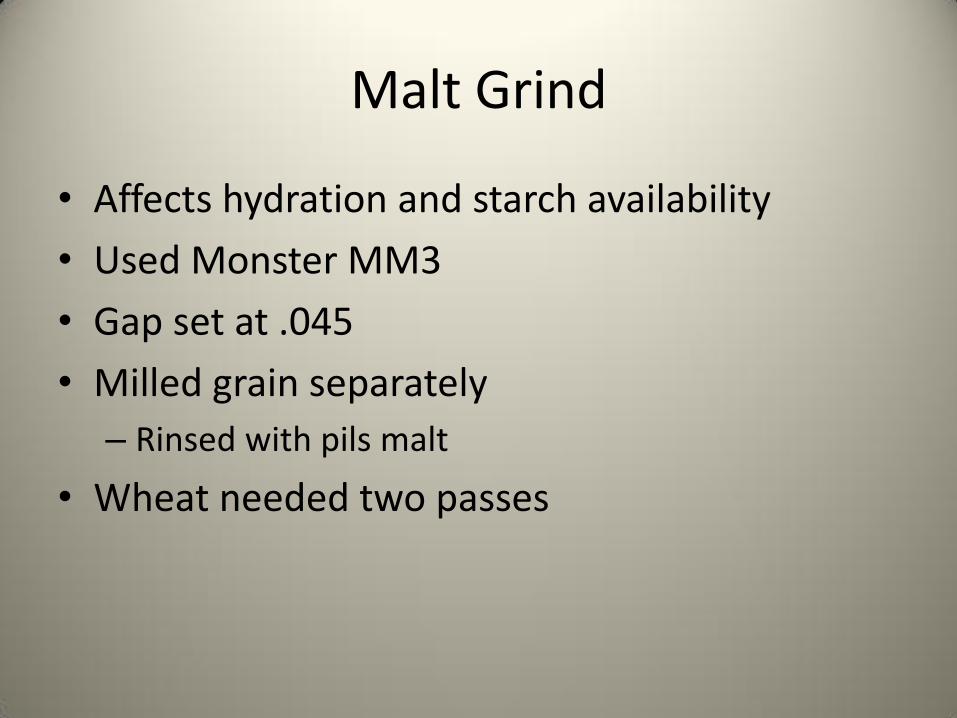
Malt Grind
• Affects hydration and starch availability
• Used Monster MM3
• Gap set at .045
• Milled grain separately
– Rinsed with pils malt
• Wheat needed two passes

Mash Thickness
• Starch availability
• 1 qt/#
– 2.09ml/g

Fermentability Testing


Mash Protocol • 180 g Malt
• 376.2 ml liquor and buffer (2.09 ml/g = 1qt:#) into Stanley
• Calculate Strike temp based on malt temp
• Mix liquor and malt stir 10 seconds
• Cap place in water bath set at desired mash temp. 3 min.
• Remove from water bath and shake 10 seconds
• Back in water bath
• Record temperature at 5 min
• Record temp at 30 min
• Add 300 ml. boiling liquor to mash press
• Record temp at 60 min (Other times for time trial)
• Record pH @ 60 min
• Pour mash into press stir 2 min record temp.
• Press and remove 500g into flask Record weight.
• Within 1 min Microwave High to boil 1:45
• Place on heat plate at standard setting.
• Add 1g Saaz hops
• Boil 30 min
• Place in ice bath.
• Record final weight

Fermentation Protocol
• Centrifuge wort 4 min to remove solids (Aseptically)
• Record wort weight
• Asepetically remove 0.5 ml. for density testing.
• Measure record denstiy with digital refractometer
• Blend media with sterile water to make 450 ml. @ 10.5P
• Shake 2 x 30 seconds to reach 8 ppm DO.
• Pour 2 x 170 ml. into flasks
• Add standard yeast mix
• Remove 20g from each flask.
• Centrifuge 2 x to remove solids
• Measur starting densities with digital density meter
• Incubate all flasks shaken 150 rpm @ 20 C
• Remove 1 ml. sample every three hours and cetrifuge.
• Measure density with refractometer
• Continue taking readings until refractometer readings stabilize for 2 hours.
• Remove flasks from shaker remove 25 ml. from flask
• Centrifuge 2 x to remove solids
• Measure density with digital density meter and record final density.

Mash
Sparge
Boil


Experiment
• Strain
• Temperature
• Grist
• Mash Time
Goal – Create a calculator to estimate terminal density
Original Density x Fermentability x Strain Att. Factor = Terminal Density
Fermentability
Ability to Fermentability

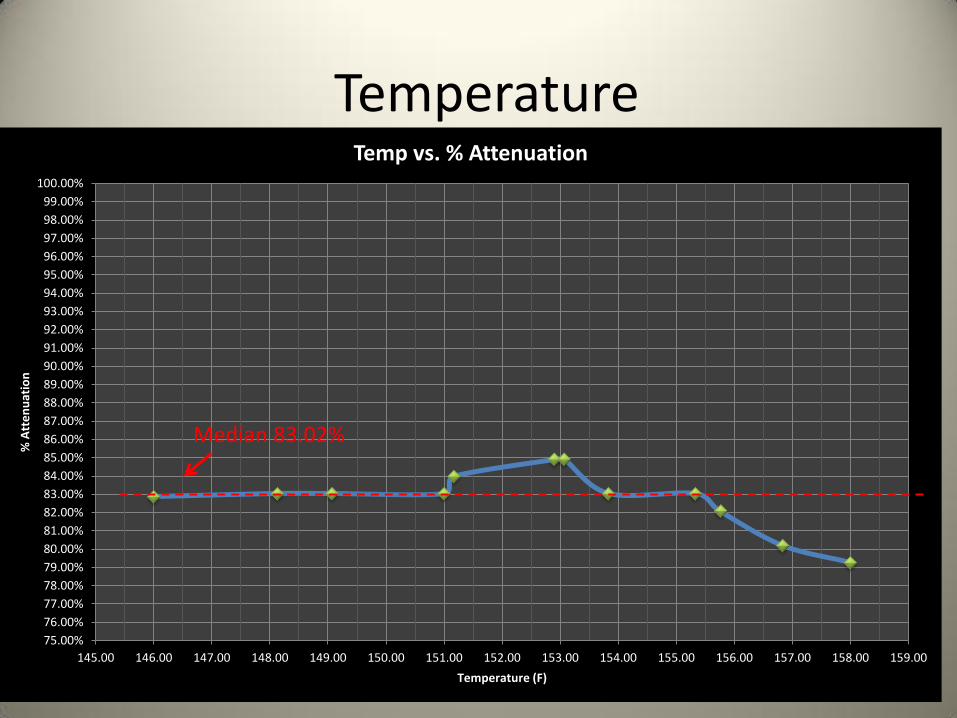
Temperature
• All Pilsner malt grist • 60 min mash • 146-158 every 2 degrees • Manipulate enzyme performance

Temperature
Temperature factor = Median/Attenuation
Temp Trial ID pH
Mash Temp (@ minutes) Analysis
5 30 60 Min Max Delta Ave Att. Factor
146F 146F-0612 5.24 146 146 146 146.00 146.00 0.00 146.00 82.86% 99.81%
148F 148F-0612 5.24 148.1 148.2 148.1 148.10 148.20 0.10 148.13 83.02% 100.00%
150F 150F-0613 5.28 150 149.2 148 149.20 150.00 0.80 149.07 83.02% 100.00%
151F 151-0616 5.36 151 151 151 150.77 151.00 0.23 151.00 83.02% 100.00%
151F 152F-0613 5.25 151 151.5 151 151.00 151.50 0.50 151.17 83.96% 101.14%
153F 152F-0524 5.3 152 153.5 153.2 152.00 153.50 1.50 152.90 84.91% 102.27%
153F 153F-0613 5.25 153.7 153 152.5 152.50 153.70 1.20 153.07 84.91% 102.27%
154F 154.5F-0616 5.22 154 154 153.5 153.50 154.00 0.50 153.83 83.02% 100.00%
155F 156F-0611 5.17 155 156 155 155.00 156.00 1.00 155.33 83.02% 100.00%
156F 156.5F-0616 5.28 155.5 156 155.8 155.50 156.00 0.50 155.77 82.08% 98.86%
157F 157F-0617 5.28 157 157 156.5 156.50 157.00 0.50 156.83 80.19% 96.59%
158F 158F-0611 5.19 158 158 158 158.00 158.00 0.00 158.00 79.25% 95.45%
Median (83.07)
75.00%
76.00%
77.00%
78.00%
79.00%
80.00%
81.00%
82.00%
83.00%
84.00%
85.00%
86.00%
87.00%
88.00%
89.00%
90.00%
91.00%
92.00%
93.00%
94.00%
95.00%
96.00%
97.00%
98.00%
99.00%
100.00%
145.00 146.00 147.00 148.00 149.00 150.00 151.00 152.00 153.00 154.00 155.00 156.00 157.00 158.00 159.00
% A
tte
nu
atio
n
Temperature (F)
Temp vs. % Attenuation
Temperature
Median 83.02%

Experiment
• Strain
• Temperature
• Grist
• Mash Time
Goal – Create a calculator to estimate terminal density
Original Density x Fermentability x Strain Att. Factor = Terminal Density
Fermentability
Ability to Fermentability

Grist
• 10 Different Malts/Adjunct
• 10% of grist
• Standard temp 151F
• 60 Min Mash

Grist
Trial ID pH
Mash Temp (@ minutes) Analysis
5 30 60 Min Max ∆T T Ave Att Att per %
Pils Pils-100-0617 5.34 151 151.5 151 151.00 151.50 0.50 151.17 83.02% 0.00%
Munich 10 Mun-10-0615 5.23 151 151 150.5 150.5 151 0.50 150.83 82.08% -0.09%
Wheat Wheat-10-
0616 5.33 150.8 151 150.5 150.5 151 0.50 150.77 82.08% -0.09%
C-120 C120-10-0615 5.18 151 151 150.5 150.5 151 0.50 150.83 80.95% -0.21%
C-40 C40-10-0615 5.23 151.5 151 150.5 150.5 151.5 1.00 151.00 80.19% -0.28%
Carapil Cpil-10-0613 5.3 151.5 151 151 151 151.5 0.50 151.17 80.19% -0.28%
Oats Oats-10-0615 5.38 151 150.8 149.8 149.8 151 1.20 150.53 79.72% -0.33%
Chocolate Choc-10-0614 5.2 151 151 150.5 150.5 151 0.50 150.83 76.30% -0.67%
Roasted Barley Roast Barley-
10-0616 5.15 151.8 151.5 150.8 150.8 151.8 1.00 151.37 76.19% -0.68%
Sucrose Sucrose-10-
0616 5.32 151 151 151 151 151 0.00 151.00 87.04% 0.40%

Grist
65.00%
70.00%
75.00%
80.00%
85.00%
90.00%
95.00%
100.00%
Pils
Mu
nic
h 1
0
Wh
eat
C-1
20
C-4
0
Car
apil
10
Oat
s
Ch
oco
late
Ro
aste
d B
arle
y
Sucr
ose
% A
tte
nu
atio
n
malt
% Apt. Attenuation vs. Grist

Calculate - Stout
Malt Att 10% Att 1% % Affect
Pils 83.02% 0 76 0
Munich 10 82.08% 0.0009434 0
Wheat 82.08% 0.0009434 0
C-120 80.95% 0.00206649 5 0.010332435
C-40 80.19% 0.00283019 0
Carapil 10 80.19% 0.00283019 0
Oats 79.72% 0.00330189 10 0.033018868
Chocolate 76.30% 0.00671555 4 0.026862202
Roasted Barley 76.19% 0.00682839 5 0.034141959
Sucrose 87.04% -0.0040182 0
Total 100 0.104355463
OG Factor TG
15 0.73 4.11

Sucrose and C-Pils?
Malt Att 10% Att 1% % Affect
Pils 83.02% 0 93 0
Munich 10 82.08% 0.00094
34 0
Wheat 82.08% 0.00094
34 0
C-120 80.95% 0.00206
649 0
C-40 80.19% 0.00283
019 0
Carapil 10 80.19% 0.00283
019 5 0.014150943
Oats 79.72% 0.00330
189 0
Chocolate 76.30% 0.00671
555 0
Roasted Barley
76.19% 0.00682
839 0
Sucrose 87.04% -
0.0040182
2 -0.008036338
Total 100 0.006114605
OG Factor TG
17 0.82 2.99
Malt Att 10% Att 1% % Affect
Pils 83.02% 0 98 0
Munich 10 82.08% 0.00094
34 0
Wheat 82.08% 0.00094
34 0
C-120 80.95% 0.00206
649 0
C-40 80.19% 0.00283
019 0
Carapil 10 80.19% 0.00283
019 2 0.005660377
Oats 79.72% 0.00330
189 0
Chocolate 76.30% 0.00671
555 0
Roasted Barley
76.19% 0.00682
839 0
Sucrose 87.04% -
0.0040182
0
Total 100 0.005660377
OG Factor TG
17 0.82 2.98

Experiment
• Strain
• Temperature
• Grist
• Mash Time
Goal – Create a calculator to estimate terminal density
Original Density x Fermentability x Strain Att. Factor = Terminal Density
Fermentability
Ability to Fermentability

Mash Time
• Standard temp
• 100% Pils Malt
• 45-90 min (Every 15 min)

Mash Time
Trial ID pH
Mash Temp (@ minutes) Analysis
5 30 45 60 75 90 Min Max ∆T Ave Att Factor
45 Min
45 min 01617 5.35 151 151 151 - - - 151.00 151.00 0.00 151.00 80.19% 96.59%
60 Min
60 min 0616 5.34 150.5 151 - 150.8 - - 150.5 151 0.50 150.77 83.02% 100.00%
75 Min
75 Min-0617 5.28 151 151 - 151 150.5 - 150.5 151 0.50 150.88 85.71% 103.25%
90 Min
90 Min-0617 5.28 151 151 - 151 - 150.2 151 150.2 0.80 150.80 84.91% 102.27%

75.00%
76.00%
77.00%
78.00%
79.00%
80.00%
81.00%
82.00%
83.00%
84.00%
85.00%
86.00%
87.00%
88.00%
89.00%
90.00%
91.00%
92.00%
93.00%
94.00%
95.00%
96.00%
97.00%
98.00%
99.00%
100.00%
30.00 35.00 40.00 45.00 50.00 55.00 60.00 65.00 70.00 75.00 80.00 85.00 90.00 95.00
% A
tte
nu
atio
n
Time (Min)
Time vs. % Attenuation
Mash Time

What Do We Do With This? Goal – Create a calculator to estimate terminal density
Original Density x Fermentability x Strain Att. Factor = Terminal Density
Fermentabililty 1. Calculate Grist Factor 2. Apply Temp Factor 3. Apply Time Factor
Yeast Factor
1. Apply Yeast Factor

Temp Factor - Stout
Recipe Stout Stout Stout
Mash Temp 150 153 158
Mash Time 60 60 60
Yeast 1056 1056 1056
Grist Att 0.73 0.73 0.73
Temp Factor 1 1.0227 0.9545
Time Factor 1 1 1
Yeast Factor 1.0084 1.0084 1.0084
O Density 15 15 15
Attenuation 0.736132 0.752842 0.702638
Terminal 3.96 3.71 4.46

Time Factor - Stout
Recipe Stout Stout Stout
Mash Temp 156 156 156
Mash Time 45 60 75
Yeast 1056 1056 1056
Grist Att 0.73 0.73 0.73
Temp Factor 0.9886 0.9886 0.9886
Time Factor 0.9659 1 1.0325
Yeast Factor 1.0084 1.0084 1.0084
O Density 15 15 15
Attenuation 0.702924 0.72774 0.751392
Terminal 4.46 4.08 3.73

Yeast Factor - Stout Recipe Stout Stout Stout
Mash Temp 156 156 156
Mash Time 60 60 60
Yeast 1007 1056 1187
Grist Att 0.73 0.73 0.73
Temp Factor 0.9886 0.9886 0.9886
Time Factor 1 1 1
Yeast Factor 0.9778 1.0084 1.025
O Density 15 15 15
Attenuation 0.705657 0.72774 0.73972
Terminal 4.42 4.08 3.90

Conclusion
• Phase 1
– More testing/analysis
– Better way to use Attenuation Numbers
• Phase 2
– Sweetness
– Balancing IBU vs. Att vs. Sweetness

Special Thanks
• Briess Malting
• 5 Star Chemicals - John
• John Palmer
• Tamara Logsdon
