attachment 20.47 sa power networks: it ppm business … - 20.47 public - sapn it... · business...
TRANSCRIPT

Attachment 20.47
SA Power Networks: IT PPM Business Case
October 2014

Business Case - Project Portfolio Management (PPM) Executive Summary
www.sapowernetworks.com.au
Page 1 of 50
SA Power Networks
Business Case
www.sapowernetworks.com.au
Project Portfolio Management (PPM)Project Ref Number : C17-16/ BC05b Document Ref Number :
Version : 4.1
Issue Date : 15/10/2014

Business Case - Project Portfolio Management (PPM) Executive Summary
www.sapowernetworks.com.au Page 2 of 50
Table of Contents
1. Executive Summary ......................................................................................................................... 4
1.1 Introduction ............................................................................................................................ 4
1.2 Reasons for the Project ........................................................................................................... 4
1.3 High level scope ...................................................................................................................... 5
1.4 Business Options Considered .................................................................................................. 5
1.5 Recommended Option ............................................................................................................ 6
2. Reasons ........................................................................................................................................... 8
2.1 Introduction ............................................................................................................................ 8
2.2 Background ............................................................................................................................. 9
2.3 Current State ......................................................................................................................... 10
2.4 Objectives.............................................................................................................................. 11
2.5 Relationship to Business Strategies and Programs ............................................................... 12
2.6 Relationship to National Electricity Rules Capital Expenditure Objectives .......................... 15
2.7 Meeting the National Electricity Rules Capital Expenditure Criteria .................................... 16
3. Scope ............................................................................................................................................. 18
3.1 Scope Exclusions ................................................................................................................... 18
3.2 Interdependencies ................................................................................................................ 18
4. Business Options ........................................................................................................................... 20
4.1 Option 1 – Do Nothing .......................................................................................................... 20
4.1.1 Option 1 Delivery Costs ................................................................................................. 20
4.1.2 Option 1 Delivery Cost Assumptions............................................................................. 20
4.1.3 Option 1 Opex Impact ................................................................................................... 21
4.1.4 Option 1 Opex Impact Cost Assumptions ..................................................................... 21
4.1.5 Option 1 Positive Outcomes ......................................................................................... 22
4.1.6 Option 1 Expected Negative Outcomes ........................................................................ 22
4.1.7 Option 1 Timescale ....................................................................................................... 22
4.1.8 Option 1 Major Business Risks ...................................................................................... 22
4.2 Option 2 – Functionality Upgrade to Existing Processes and Systems ................................. 24
4.2.1 Option 2 Cost Summary ................................................................................................ 26
4.2.2 Option 2 Delivery Costs ................................................................................................. 27
4.2.3 Option 2 Delivery Cost Assumptions............................................................................. 27
4.2.4 Option 2 Change Management Costs Assumptions ..................................................... 28
4.2.5 Option 2 Opex Uplift ..................................................................................................... 28
4.2.6 Option 2 Opex Step Change Assumptions .................................................................... 28
4.2.7 Option 2 Expected Positive Outcomes .......................................................................... 29
4.2.8 Option 2 Expected Negative Outcomes ........................................................................ 31
4.2.9 Option 2 Timescale ....................................................................................................... 32

Business Case - Project Portfolio Management (PPM) Executive Summary
www.sapowernetworks.com.au Page 3 of 50
4.2.10 Option 2 Major Business Risks ...................................................................................... 32
4.3 Option 3 – Implement a Multi-platform, Integrated Solution .............................................. 34
4.3.1 Option 3 Cost Summary ................................................................................................ 36
4.3.2 Option 3 Delivery Costs ................................................................................................. 37
4.3.3 Option 3 Delivery Cost Assumptions............................................................................. 37
4.3.4 Option 3 Change Management Costs Assumptions ..................................................... 38
4.3.5 Option 3 Opex Impact ................................................................................................... 38
4.3.6 Option 3 Opex Impact Assumptions ............................................................................. 38
4.3.7 Option 3 Expected Positive Outcomes .......................................................................... 39
4.3.8 Option 3 Expected Negative Outcomes ........................................................................ 39
4.3.9 Option 3 Timescale ....................................................................................................... 39
4.3.10 Option 3 Major Business Risks ...................................................................................... 40
5. Investment Appraisal .................................................................................................................... 42
6. High Level Summary of Options .................................................................................................... 43
7. Recommendation .......................................................................................................................... 44
8. Document Authorisation and History ........................................................................................... 45
8.1 References ............................................................................................................................ 45
8.2 Acronyms and Abbreviations ................................................................................................ 45
Appendix A Cost Details ................................................................................................................... 47
Appendix B SAP Value Roadmap Initiatives – SAP Foundation Business Case ................................ 49

Business Case - Project Portfolio Management (PPM) Executive Summary
www.sapowernetworks.com.au Page 4 of 50
1. Executive Summary 1.1 Introduction
The operating model for the electricity distribution industry continues to undergo rapid change to
meet increased demands for improved customer service and to cater for the impacts of distributed
energy resources and complex technological changes whilst maintaining reliability and security of
supply. To operate in this continuously changing operating environment, SA Power Networks must
improve on its capability to provide good management of its programs of work.
SA Power Networks has already commenced a number of initiatives to improve its capability in
response to growing customer expectations and an increase its future program of work. The
implementation of integrated system to support project portfolio management processes and
resource planning system, will build on the work already undertaken and provide a solid foundation
for the entire organisation to better manage its programs of work and to electronically collect data
to support the Australian Energy Regulator (AER) Regulatory Information Notice (RIN) requirements.
The primary outcome will be an integrated system that will bring together the organisation’s
strategic planning, resourcing, finance and project management.
1.2 Reasons for the Project
In the 2015 – 2020 Regulatory Control Period (RCP), SA Power Networks is increasing the program of
work to be delivered in order to meet these expanding customer requirements for electricity
distribution services, to meet the challenge of replacing and maintaining aging infrastructure, both
across the network and non-network areas1, and to deliver on the RIN data requirements.
In order to achieve this, the organisation will create a business-wide integrated approach to work
management that is fit for purpose, has standardised processes and is cost effective. This will deliver
significant uplift in the capability across the Program Management, Work Planning, Corporate
Portfolio Management and IT Portfolio functions and will enable the organisation to meet these
challenges whilst limiting the increase in program and planning resources.
The introduction of an integrated project portfolio management system and resource capacity
planning system will build on the progress already made by SA Power Networks in developing an
improved work management capability. The intention to further improve this capability is good-
practice and consistent with the approach taken by other utilities companies in Australia.
The work already undertaken has been in response to an increase in the program of work in the
current RCP, improvements to data collection and scoping of business processes for a centralised
control of work functions has already commenced. To fully capitalise on these improvements and to
standardise processes across the business, an integrated project portfolio management system and
resource planning system are required to manage capacity requirements to meet the program of
work and deliver to customer expectations.
This Business Case also extends the improvement of processes and integration to SA Power
Networks’ Information Technology Project Management Office (ITPMO) and the Corporate Portfolio
Management Office (CPMO) and promotes the ‘one business’ approach.
1 May 2010, AER Final Decision, SA Distribution Determination 2010/11 – 2014/15, p.106

Business Case - Project Portfolio Management (PPM) Executive Summary
www.sapowernetworks.com.au Page 5 of 50
1.3 High level scope
This Business Case considers viable solutions that enable significant improvements to the
management of network and non-network project, program and portfolio functions, specifically
through the delivery and integration of:
An enhanced project management system;
A project portfolio management system;
A project scheduling and resource capacity system.
Section 3 of this business case also discusses the dependencies and interrelationships between these
and other core systems.
1.4 Business Options Considered
SA Power Networks has considered three options to ensure that it is well placed to provide systems
and processes to support the increase in the program of work.
The options considered were:
1. Do Nothing - In this Business Case ‘Do Nothing’ means maintaining the status quo by
continuing with current systems and processes and increase the level of internal resources to
meet the management of the Capital Expenditure program of work for network and non-
network.
2. Functionality Upgrade to Existing Processes and Systems - Leverage off the investment SA
Power Networks has in its existing corporate Enterprise Resource Planning system (SAP ERP)
to provide the additional functionality to integrate project portfolio management across the
organisation. This functionality will be provided by implementing additional SAP modules,
realigning and integrating existing SAP modules and associated SAP supported applications so
that the existing core ERP enables revised business processes to operate effectively. This work
will deliver a portfolio and program management, project management and resource
scheduling capability that can be used across the organisation.
3. Implement a Multi-platform, Integrated Solution - Provide the same functionality as outlined
in Option 2, but consider using point solutions (such as Microsoft and Primavera) and
integrating them with the existing corporate ERP system through additional applications.
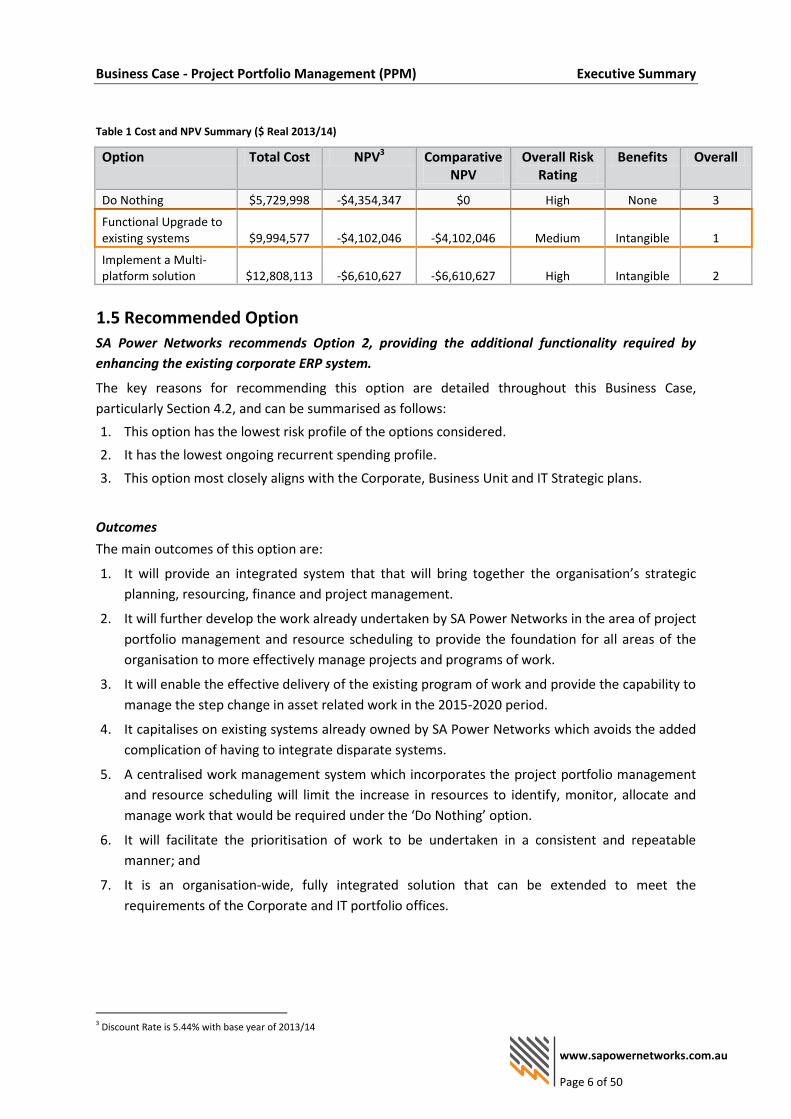
A summary of the three options considered, including investment appraisal is provided in the
following table2. As the Do Nothing costs correspond to cost avoidance benefits of options 2 and 3,
the ‘NPV’ represents the NPV of each option in isolation without consideration of the alternate
options; this is the true NPV cost to SA Power Networks should it proceed with that option. The
‘Comparative NPV’ represents the NPV when taking into consideration the alternate options and is
the NPV to be used for option comparative purposes.
2 Investment Period is 2015/16 to 2021/22
Business Case - Project Portfolio Management (PPM) Executive Summary
www.sapowernetworks.com.au Page 6 of 50
Table 1 Cost and NPV Summary ($ Real 2013/14)
Option Total Cost NPV3 Comparative NPV
Overall Risk Rating
Benefits Overall
Do Nothing $5,729,998 -$4,354,347 $0 High None 3
Functional Upgrade to existing systems $9,994,577 -$4,102,046 -$4,102,046 Medium Intangible 1
Implement a Multi-platform solution $12,808,113 -$6,610,627 -$6,610,627 High Intangible 2
1.5 Recommended Option
SA Power Networks recommends Option 2, providing the additional functionality required by
enhancing the existing corporate ERP system.
The key reasons for recommending this option are detailed throughout this Business Case,
particularly Section 4.2, and can be summarised as follows:
1. This option has the lowest risk profile of the options considered.
2. It has the lowest ongoing recurrent spending profile.
3. This option most closely aligns with the Corporate, Business Unit and IT Strategic plans.
Outcomes
The main outcomes of this option are:
1. It will provide an integrated system that that will bring together the organisation’s strategic
planning, resourcing, finance and project management.
2. It will further develop the work already undertaken by SA Power Networks in the area of project
portfolio management and resource scheduling to provide the foundation for all areas of the
organisation to more effectively manage projects and programs of work.
3. It will enable the effective delivery of the existing program of work and provide the capability to
manage the step change in asset related work in the 2015-2020 period.
4. It capitalises on existing systems already owned by SA Power Networks which avoids the added
complication of having to integrate disparate systems.
5. A centralised work management system which incorporates the project portfolio management
and resource scheduling will limit the increase in resources to identify, monitor, allocate and
manage work that would be required under the ‘Do Nothing’ option.
6. It will facilitate the prioritisation of work to be undertaken in a consistent and repeatable
manner; and
7. It is an organisation-wide, fully integrated solution that can be extended to meet the
requirements of the Corporate and IT portfolio offices.
3 Discount Rate is 5.44% with base year of 2013/14
Business Case - Project Portfolio Management (PPM) Executive Summary
www.sapowernetworks.com.au Page 7 of 50
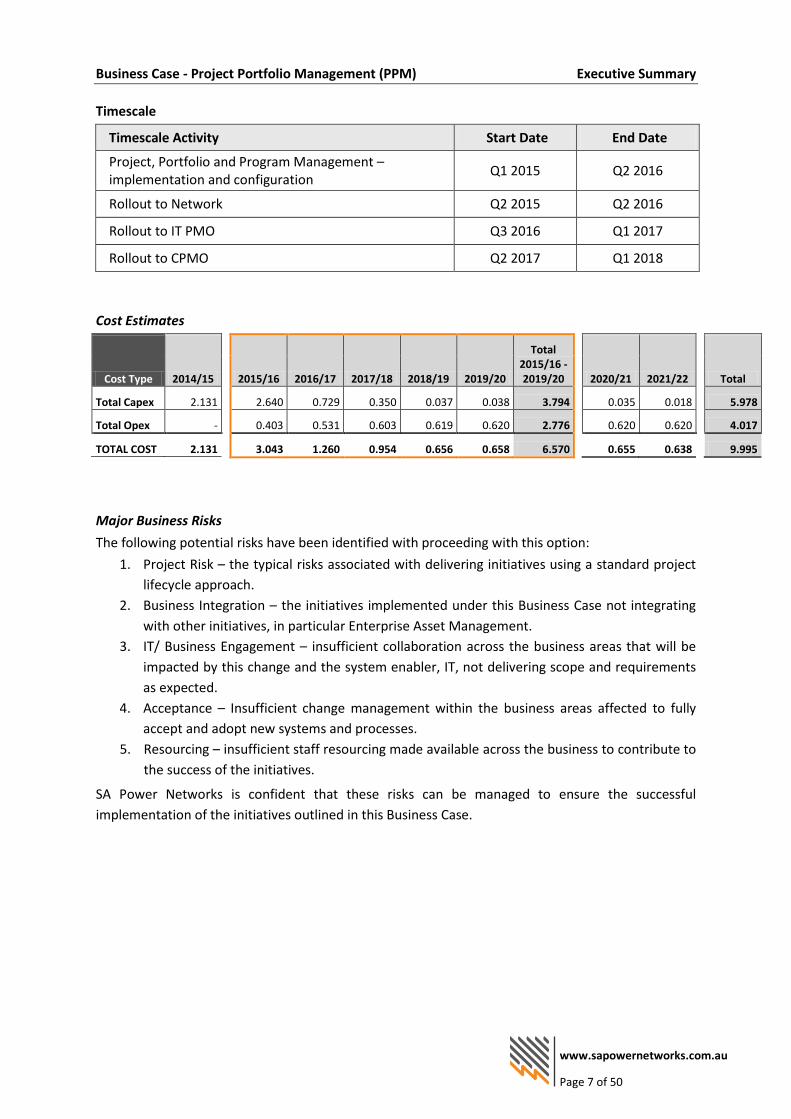
Timescale
Timescale Activity Start Date End Date
Project, Portfolio and Program Management – implementation and configuration
Q1 2015 Q2 2016
Rollout to Network Q2 2015 Q2 2016
Rollout to IT PMO Q3 2016 Q1 2017
Rollout to CPMO Q2 2017 Q1 2018
Cost Estimates
Cost Type 2014/15
2015/16 2016/17 2017/18 2018/19 2019/20
Total 2015/16 - 2019/20
2020/21 2021/22
Total
Total Capex 2.131
2.640 0.729 0.350 0.037 0.038 3.794
0.035 0.018
5.978
Total Opex -
0.403 0.531 0.603 0.619 0.620 2.776
0.620 0.620
4.017
TOTAL COST 2.131
3.043 1.260 0.954 0.656 0.658 6.570
0.655 0.638
9.995
Major Business Risks
The following potential risks have been identified with proceeding with this option:
1. Project Risk – the typical risks associated with delivering initiatives using a standard project
lifecycle approach.
2. Business Integration – the initiatives implemented under this Business Case not integrating
with other initiatives, in particular Enterprise Asset Management.
3. IT/ Business Engagement – insufficient collaboration across the business areas that will be
impacted by this change and the system enabler, IT, not delivering scope and requirements
as expected.
4. Acceptance – Insufficient change management within the business areas affected to fully
accept and adopt new systems and processes.
5. Resourcing – insufficient staff resourcing made available across the business to contribute to
the success of the initiatives.
SA Power Networks is confident that these risks can be managed to ensure the successful
implementation of the initiatives outlined in this Business Case.

Business Case - Project Portfolio Management (PPM) Reasons
www.sapowernetworks.com.au Page 8 of 50
2. Reasons 2.1 Introduction
The operating model for the electricity distribution industry continues to undergo rapid change:
to meet rising customer demand for an increasing range of services including information on
their connections and any change to their supply; and
the operation of the network to cater for the impacts of distributed energy resources and
complex technological changes whilst maintaining reliability and security of supply in an
environment confronting more severe weather events.
Responding to this change needs to be achieved at the lowest sustainable cost, and consequently SA
Power Networks has been developing a business-wide integrated approach to work management
that is fit for purpose, has standardised processes and is cost effective.
This initiative will provide significant uplift in the work management capability across the Program
Management, Work Planning, Corporate Portfolio Management and IT Portfolio functions. The
outcomes will provide a pathway towards the ‘excellence in asset management and delivery of
services provider’4 business driver as embodied in the SA Power Networks Strategic Plan.
Across the network and non-network areas, SA Power Networks is increasing the program of work to
be delivered in order to maintain continuity of supply to existing and new customers. The goal of this
initiative is to enable the current capacity to meet this challenge without a material increase in the
internal resource base.
Optimising the capabilities of an integrated project portfolio management system and resource
capacity planning system across the business will enable SA Power Networks to have a sustainable
approach to the management of work and enable an increased portfolio of work to be planned and
managed with a limited increase in resources. A system integrated with SA Power Networks’ core
ERP will eliminate the increasing use of manually intensive processes recording independent pieces
of data, will provide the opportunity to view the organisation’s program of work in total and allow
better informed decisions about how best to execute that program of work.
The organisation has been under increasing pressure to manage its program of work with its current
systems, and with the program of work expected to increase in coming years, SA Power Networks
needs to ensure it has the systems and processes in place across the organisation to best be able to
complete this work in an efficient and cost effective way.
SA Power Networks is also operating in an increasingly complex environment, including greater
scrutiny, vegetation management and bushfire management obligations, and increased expectations
of a more efficient and reliable service from customers. All of these factors point to the need for
greater visibility around the work being undertaken, the way this work is prioritised and the ability to
respond to changes in priority quickly.
This business case also extends the improvement in processes and level of integration to SA Power
Networks’ Information Technology Project Management Office (ITPMO) and the Corporate Portfolio
Management Office (CPMO) to deliver a sustainable platform and enable capacity improvements
necessary to undertake the proposed increased level of work and promote the ‘one business’
approach.
4 SA Power Networks Strategic Plan 2013-2017, p9
Business Case - Project Portfolio Management (PPM) Reasons
www.sapowernetworks.com.au Page 9 of 50
There are several ‘business as usual’ initiatives grouped under the broader ‘Management of Work’
initiative that are charged with improving the processes involved with network programming,
planning, design and delivery. The introduction of an integrated project and portfolio management
system(s) and resource capacity planning system (which is the subject of this business case) provides
the systems foundation for the Management of Work initiative.
2.2 Background
SA Power Networks conducts capital projects across network (including Program Management and
Resource Capacity Planning) and non-network (including the Information Technology and Corporate
program) areas of the organisation. The organisation acknowledges that while existing resources,
processes and systems have been sufficient to manage previous levels of capital works, it needs to
ensure it is well placed across these three areas to meet the challenge of an increased capital
program.
The organisation has already undertaken significant steps to ensure it is providing an improved
capability towards managing its network and non-network programs of work, and is better prepared
to managing an increasing capital program:
1. The establishment of a Management of Work program of initiatives, which includes:
re-engineering processes;
the ability to collect and accurately record relevant system data;
development and implementation of a single estimating tool for estimating electricity
infrastructure projects;
the evaluation of systems to support the business with respect to management at a project,
and portfolio level; and
improved resource capacity planning to make the best use of its resources.
2. The establishment of the Corporate Portfolio Management Office (CPMO), which will monitor,
support and report on major strategic and business change projects throughout SA Power
Networks. The CPMO has already achieved the following:
developed a consolidated, enterprise-wide list of strategic change initiatives and placed
them into logical groups (Business Unit Portfolios);
gained endorsement for the creation over a number of CPMO projects; and
commenced work on the CPMO framework.
3. An interim resource capacity planning system has been developed and is in use as the first stage
towards improving the way SA Power Networks manages its resource planning.
4. Enhancements to the business’ core ERP system to provide improved project management and
providing integration with financial data to provide up-to-date information on how projects and
programs are performing against budget. These enhancements have been rolled out to the IT
Project Management Office as an initial step towards improved project management for IT
projects.
The systems development and process changes already taking place are providing better integration
of systems and data, providing SA Power Networks with a much improved approach to project,
portfolio management and resource scheduling. This business case proposes to further build on this
foundation by providing integrated systems capability that can be used across the business in

Business Case - Project Portfolio Management (PPM) Reasons
www.sapowernetworks.com.au Page 10 of 50
Network Planning, IT Project Management, Corporate Portfolio Management and Regulatory
Reporting.
2.3 Current State
Project portfolio management across SA Power Networks is currently made up of disparate
processes and systems. In order to present aggregate views of project programs and portfolios, the
current system relies on manual systems and manipulation of data, using ‘off-system’ spreadsheets.
There is an opportunity for the current system to be reviewed from a process and system maturity
perspective as follows:
1. Consider ways to improve portfolio evaluation and optimisation, and portfolio risk
management;
2. Re-engineer processes and review systems to assist in project execution and improved resource
management;
3. Consider approaches to more effectively provide project and portfolio governance good
practice; and
4. Consider options to improve the integration of systems, especially with Financials, HR,
Procurement, Operations and Project Estimation.
The issues from the current level of integration of systems impacting current project portfolio
management are:
Corporate Portfolio Management
The visibility of strategic and business projects due to the current systems in place.
A reliance on ‘off-system’ spreadsheets leads to difficulties balancing and prioritising the
portfolio of work.
Current systems do not contain detailed information around project dependencies and
relationships, and impacts to people, processes, systems and data.
There are difficulties in reporting and analysing project performance.
IT Project Portfolio Management
Use of ‘off-system’ spreadsheets makes it difficult to gain an overall view of the current
program of work, leading to difficulties in terms of allocating the correct resources and
prioritising projects.
Work Portfolio issues
Use of ‘off-system’ spreadsheets makes it difficult to gain an overall view of the current
program of work
The amount of manual data required to an overall portfolio or program view can delay the
provision of timely and up to date information and reporting.
It is difficult to manage resources using a whole-of- business view due to the lack of a fully
integrated system.

Business Case - Project Portfolio Management (PPM) Reasons
www.sapowernetworks.com.au Page 11 of 50
A consistent approach across the organisation with respect to scheduling, allocation/dispatch
for field and non-field resources will contribute to removing gaps (‘white space’) within
schedules, and better manage field crew down-time.
An improvement to the capture of real-time data and integration to asset systems will
improve the ability to manage the increase in the planning of field work.
A better integrated system will result in less administrative effort required of operational
leaders, allowing them to increase their focus on leading field crews.
A better integrated system will result in improvements around managing Works Coordinators
priorities with respect to completing pre-construct activities and work execution.
The number of handoffs in a process, due to non-integrated systems can be numerous, often
completed manually, resulting in work often cycling through the process several times.
Increased reliance on integrated systems to complete data handling tasks will help to ensure
that data integrity and process effectiveness can be effectively measured and reported.
System integration improvements will help to facilitate an end-to-end planning process
(estimates are not attached to the asset), making it easier to track work from concept through
to reconciliation.
Improvements to asset data integration will enable bundling of work throughout the lifecycle.
Improvements to systems integration will help to better manage data that is currently held in
multiple databases and systems. For example, better integration with the following systems
will significantly improve the management of work:
o Integration with HR data (headcount, FTEs) and the organisation structure; and
o Asset-NMI-Service-Customer data.
Improvements to the timeliness close-out processes will improve the management of
instances of incomplete, out-of-date and disparate asset data across the business.
Improvements to the standardised way of capturing asset information will improve the
reliability and quality of data stored in the system.
Better managed data and integrated systems will significantly increase the ability of SA Power
Networks to satisfy increasingly frequent requests for information from stakeholders (e.g.,
RIN’s from the AER) that is currently difficult and complex to extract from current systems.
2.4 Objectives
The key objectives of this initiative are the implementation and integration of project, program and
portfolio systems to help ensure project planning and delivery can be applied consistently across the
Management of Work, IT and Corporate portfolios of work.
The Project portfolio management initiative will implement and integrate an enterprise:
common project management system;
project portfolio management system; and
project scheduling and resource capacity system.
To maximise the improvements that these solutions deliver, this Business Case proposes to integrate
the project and portfolio systems with and other related systems in the organisation such as:
Human Resources - for work skills, time sheeting and reporting;
Customer Facing systems;

Business Case - Project Portfolio Management (PPM) Reasons
www.sapowernetworks.com.au Page 12 of 50
Finance - for asset registers, consolidated reporting; and
Estimating - for project, portfolio and program planning.
The Project, Program & Portfolio Management initiative’s inter-relationship to SA Power Networks
divisions and functions can be observed in the diagram below.
2.5 Relationship to Business Strategies and Programs
SA Power Networks’ strategic intent is to become ‘a leader in the electricity distribution and
infrastructure services in Australia’5. The Project portfolio management supports this intent by
enabling the business to create and embed an improved whole of business approach to the way
work is planned and delivered. The benefit of achieving this is greater visibility to customers in terms
of the services provided to them and the work undertaken which impacts this level of service.
The ability of SA Power Networks to coordinate its workforce to plan and deliver services efficiently
and productively is a key driver of customer satisfaction, quality and reliability of supply and
reliability and safety of the network.
The Project, Program & Portfolio Management initiative is mapped to SA Power Networks strategic
intent that builds on the foundations and contributes to the core areas of focus and business drivers
in the Strategic Framework.
5 SA Power Networks Strategic Intent

Business Case - Project Portfolio Management (PPM) Reasons
www.sapowernetworks.com.au Page 13 of 50
Links to SA Power Networks Strategic Plan 2013-17
Strategic Intent A Leader in Electricity Distribution and Infrastructure Services in Australia
Business Driver The cost efficient service provider
Core Areas of Focus
Excellence in asset management & delivery of services;
Investing in our People, Assets and Systems;
Energised & Responsive Customer Service
Foundations Sound Financial Management & Governance
The program of work that this Business Case enables ‘reflects the need to integrate and streamline our activities across the asset management and field delivery groups’, recognises ‘that we need to continue to be cost efficient in all that we do’ and emphasises the ‘”one-business” philosophy’.
Table 2 Contribution to the SA Power Networks Strategic Framework
Strategic Intent:
A Leader in Electricity Distribution and Infrastructure Services in Australia
Business Driver: The cost efficient service provider
Core Areas of Focus Contribution
Excellence in asset management and delivery of services
The Project, Program & Portfolio Management initiative contributes to excellence in asset management and delivery of services by enabling:
the integration of existing project management systems across the organisation , to provide additional process automation functionality driving project management efficiencies and

Business Case - Project Portfolio Management (PPM) Reasons
www.sapowernetworks.com.au Page 14 of 50
governance;
a corporate visibility (7 year view) of the SA Power Networks program of work;
the monitoring of investment decisions and costs during the year allowing for re-prioritisation if required;
an integrated forecast capability that can be applied to all work;
the capability to identify, prioritise, balance and monitor all work and resources;
the integration of work estimates with whole of business portfolio management and budgeting;
the planning of resource requirements by planning jobs and identifying resources with the right skills;
the integration and optimisation of job scheduling for project, unplanned and planned work, as well as management of work more broadly through the systems;
the automatic prioritised and optimised work bundling for field workers and asset inspectors in logical groupings according to location and other configurable conditions;
resource capacity planning and work allocation for all workers - Field and non-Field (network planners, network project managers, delivery project managers, designers), IT and Property project managers and specialised fleet and equipment; and
the inclusion of Fatigue Management to resource scheduling and planning.
Investing in our people, assets and systems
The Project, Program & Portfolio Management initiative contributes to the ‘investing in our people, assets and systems’ core area of focus through:
Investing in Project portfolio management to enable assets to be correctly managed, and people to manage programs of work efficiently.
Energised and responsive customer service
The Project, Program & Portfolio Management initiative contributes to the ‘Energised and responsive customer service’ core area of focus through:
The delivery of the SA Power Networks program of work and ensure customer demand for services is met. The initiatives will establish a capability that will allow SA Power Networks to identify, prioritise, balance and monitor all work and resources.
Providing customers with the facility to have greater visibility of their service and the work being undertaken that may impact the delivery of that service.
This project is aligned to the IT Strategic Objectives as described below.

Business Case - Project Portfolio Management (PPM) Reasons
www.sapowernetworks.com.au Page 15 of 50
Table 3 Contribution to IT strategic objectives6
IT Strategic Objective Contribution
Ensure technology, systems and processes support SA Power Networks long-term business direction
The initiatives are based on leveraging the investment in existing technologies consistent with the IT Strategic direction.
Ensure IT governance, planning and reporting are aligned with SA Power Networks strategy
Improvements in the integration of project portfolio management will improve our governance capability and provide a single view of work.
Contributing to ensuring that IT projects and processes are totally aligned to the organisational portfolio management requirements and investment standards
Partner with other business departments to deliver value through technology
The technologies employed provide foundation systems and enable the technology to be available to all business units. This provides the opportunity to improve the consistency of project management and resource scheduling across the organisation
Ensure our people are informed and engaged, and have the right skills aligned with business objectives
Training and change management is an important part of the initiatives that make up this business case, ensuring all effected staff understand and accept the systems, and are adequately trained in the new technology and associated processes.
Improve efficiency of our processes in line with good industry practices
Contributing to ensuring the IT portfolio and program related decision making and management processes are as effective as possible.
Continually identify and manage IT-related business risks to reduce potential business impact
Reducing the risks associated with multiple disparate systems
2.6 Relationship to National Electricity Rules Capital Expenditure Objectives
The Project portfolio management Business Case meets the capital expenditure objectives under the
NER through improvements gained from the integration of systems and processes used to plan,
design and deliver projects in SA Power Networks. Table 4 below maps the contribution of this
initiative with the NER Capital Expenditure Objectives.
6 Information Technology Strategy 2013-17 p8

Business Case - Project Portfolio Management (PPM) Reasons
www.sapowernetworks.com.au Page 16 of 50
Table 4 Contribution to the National Electricity Rules capital expenditure objectives7
NER Capital Expenditure Objectives Contribution
Meet or manage expected demand for standard control services over the period
Improvements to the systems that support project, program & portfolio management across the organisation will provide the necessary uplift in the capability required to meet customer demand for SA Power Networks’ services without a material increase in resources. This initiative contributes to SA Power Networks’ management of demand for standard control services.
Comply with all regulatory obligations or requirements associated with the provision of standard control services
An integrated system provide holistic reporting and improves SA Power Networks’ ability to meet its reporting obligations under the National Electricity Rules and Performance Monitoring and Reporting requirements imposed by ESCOSA.
System improvements to service delivery (e.g.: maintenance planning, enhanced job scheduling) will reduce the duration of planned and unplanned outages and assist in meeting Guaranteed Service Level scheme obligations.
Maintain the quality, reliability and security of supply of standard control services provided by SA Power Networks
Integrated project portfolio management systems improves SA Power Networks’ ability to undertake the ‘right type of work; contributing to the maintenance of the security of supply.
Maintain the reliability and security of the distribution system through the supply of standard control services
Integrated project portfolio management systems improves SA Power Networks’ ability to undertake the ‘right type of work; contributing to the maintenance of the security of the distribution system.
2.7 Meeting the National Electricity Rules Capital Expenditure Criteria
The solution that meets the Project, Program & Portfolio Management initiative is demonstrated in
this business case to meet the NER capital expenditure criteria. Table 5 below maps the contribution
of this initiative with the NER capital expenditure criteria.
7 National Electricity Rules 6.5.7 (a)(1-4)

Business Case - Project Portfolio Management (PPM) Reasons
www.sapowernetworks.com.au Page 17 of 50
Table 5 Activities to Meet the National Electricity Rules expenditure objectives
National Expenditure Criteria Activity
Efficient cost of achieving the objective(s) in 2.3 above
This business case sets out the options considered to meet the deliverables of this initiative. The options consider a do nothing option which is ranked with two other options to demonstrate the efficiency of implementing the initiative.
KPMG have been used to undertake verification modelling to ensure the quality of the costing models used in the business case.
Costs that a prudent operator would require to achieve the objectives in 2.3 above
SA Power Networks has consulted with other electricity infrastructure organisations to identify and provide a benchmark against other distributors’ systems that provide resource scheduling and project portfolio management capabilities and the cost of implementing similar initiatives.
SA Power Networks has also used research conducted by Gartner Technology Research to identify solutions to meet the deliverables of this initiative.
Realistic expectation of demand forecast and cost inputs required to achieve the objectives in 2.3 above
Extensive consultation using the SA Power Networks Governance Process has been undertaken to ensure the expected benefits and costs have been fully scoped.
The cost of implementing this initiative has been calculated by independent external consultants, who are experts in this field, with particular skills and experience in the electricity utilities sector.
Business Case - Project Portfolio Management (PPM) Scope
www.sapowernetworks.com.au Page 18 of 50
3. Scope
This Business Case proposes to provide significant improvements with respect to the systems that
support the way SA Power Networks manages its network and non-network project, program and
portfolio functions. All of the options considered to provide this added functionality take into
account providing the following:
Project management
Project Portfolio management
Project Program management
Project scheduling
Resource capacity planning
Project estimating
For the purposes of this business case, the following definitions apply:
A program is a temporary and flexible group of related projects, and is normally established to co-
ordinate, direct and oversee the implementation of a set of related projects and activities in order to
deliver outcomes and benefits related to an organisation’s strategic objectives. A program of
projects aims to minimise risk, provide economies of scale, share resources and have common goals.
A program is a works management based group of projects.
A portfolio is a group of projects put together to achieve an organisation’s strategic objectives, and
are grouped together because they share the same processes, methods and technologies to manage
them, and are not necessarily a group of related projects which common goals.
This business case proposes to provide enhanced capability across the organisation to manage work
at a project, program and portfolio level.
This Business Case considers viable solutions to provide these functions and their integration so that
project planning and delivery can be applied consistently across the entire organisation. Central to
the initiative is the use of a common platform to enable an efficient integration without additional
resources to manage complex interdependencies of disparate systems.
Included in this business case is the change management associated with the new systems and its
integration with business processes.
The scope of this business case therefore is to demonstrate the prudency of implementing an
integrated project portfolio management system including a resource capacity planning system.
3.1 Scope Exclusions
The scope of this business case excludes the following:
1. A separate project is current underway to extract data that will be used to populate the
proposed project and portfolio management systems, and is outside the scope of this Business
Case. The effort and associated cost to bring that data into the proposed new systems is,
however, included in this scope.
3.2 Interdependencies
The initiatives covered by this business case have dependency interrelationships with the initiatives
covered in the following business cases:

Business Case - Project Portfolio Management (PPM) Scope
www.sapowernetworks.com.au Page 19 of 50
BC14 Enterprise Mobility;
BC01 CIS & CRM
BC02a Customer Facing Initiatives
BC04 Financial Management;
BC03 Enterprise Asset Management;
BC05a Supply Chain & Procurement;
BC09 SAP Foundations;
BC11 People & Culture;
BC32 RIN Reporting
BC21 Business Intelligence Enablement; and
BC10 Drawing Management Systems Consolidation.
2. While this business case has linkages to the above initiatives, the focus of this business case is
on the integration of systems to manage the project, program and portfolio area of work. These
are covered under the Integrated Resource Scheduling (EAM10) and Project & Portfolio
Management (EAM12) initiatives in the SAP Value Roadmap8.
8 SA Power Networks 7 Year SAP Value Roadmap, version 1.2, November 2013

Business Case - Project Portfolio Management (PPM) Business Options
www.sapowernetworks.com.au Page 20 of 50
4. Business Options 4.1 Option 1 – Do Nothing
The ‘Do Nothing’ option retains the current environment (status quo) with regards to the supporting
systems associated with the planning and delivery of the work across SA Power Networks’ network
and non-network project functions. The continuation of ‘business as usual’ will have the following
consequences:
1. Maintaining existing systems with a significant increase in the level of deliverable work is a
major risk to SA Power Networks and will result in either increased costs through the
requirement of materially higher staffing and contractor numbers and/or a deterioration in
customer service levels due to longer lead times for the delivery of projects and work.
2. Doing nothing will prevent providing customers with greater visibility about their service and
how any work being undertaken is likely to impact that service.
3. Continuing with a system that does not integrate with the core ERP system will make it more
difficult to share data across Finance and Estimating systems, which in turn will make it more
difficult to meet the regulator’s increasing demands for more detailed information (RIN’s).
4. This option does not align with the aspirations in SA Power Networks’ Strategic Plan and places
additional risk on the ability of the organisation to meet the work program of the current and
future regulatory control periods.
4.1.1 Option 1 Delivery Costs
Not applicable, as this option one does not implement any improvements to the systems and
processes currently being used. There are however, a number of intangible costs that are outlined in
4.1.8 Major Business Risks, and can be summarised as follows:
1. Loss of reputation to the business – by not being to deliver its capital works program, the
business runs the risk of not being able to meet customer service requirements, which could
lead to a loss of reputation.
2. Cost of an efficient service provider – employing additional resources to better manage work
will add to the cost of the capital work, which in turn will be passed on to the customers.
Implementing system solutions instead will provide a more cost effective way of delivery it work
program.
3. Inadequate systems to provide required information to the regulator – Do Nothing will mean SA
Power Networks does not have the data necessary to satisfy the increasingly detailed requests
for information from the regulator. Until now, there has been no need to record this level of
detail, so the organisation must now provide the systems to be able to do so.
It is difficult to quantify the cost of not being able to deliver on these requirements (especially in the
timeframe given to prepare this business case), and therefore no estimate has been provided.
4.1.2 Option 1 Delivery Cost Assumptions
No additional systems will be implemented to support the delivery of the work program.

Business Case - Project Portfolio Management (PPM) Business Options
www.sapowernetworks.com.au Page 21 of 50
4.1.3 Option 1 Opex Impact
The operational impact of the Do Nothing option is a combined IT and Non-IT operational labour uplift of $3.8M over the 2015-2020 Regulatory Control Period or $5.6M over the investment period 2014/15 to 2021/22. Table 6 Option 1 Opex Impact
Business Unit 2014/15
2015/16 2016/17 2017/18 2018/19 2019/20
Total 2015/16 - 2019/20
2020/21 2021/22
Total
IT Opex Impact -
0.034 0.034 0.034 0.034 0.034 0.170
0.034 0.034
0.237
Non-IT Opex Impact -
0.441 0.675 0.843 0.843 0.843 3.646
0.843 0.843
5.332
TOTAL OPEX -
0.475 0.709 0.877 0.877 0.877 3.815
0.877 0.877
5.569
4.1.4 Option 1 Opex Impact Cost Assumptions
1. No changes will be made to the underlying systems currently used for project, program or portfolio management.
2. Additional staffing resources for planning functions will be required across the corporate PMO, IT PMO and Network to maintain the ‘off-system’,
manually intensive methods of managing projects, programs and portfolios, to meet the demands of the environment SA Power Networks operates. This
includes complying with Regulatory Information Notices requirements and meeting customer expectations for more detailed information about the
supply and any work being undertaken that is likely to impact that supply.

Business Case - Project Portfolio Management (PPM) Business Options
www.sapowernetworks.com.au Page 22 of 50
4.1.5 Option 1 Positive Outcomes
There are no expected positive outcomes from maintaining the status quo.
4.1.6 Option 1 Expected Negative Outcomes
Table 7 Option 1 Expected Negative Outcomes
Negative Outcome Consequence (Value, Measure)
The cost of maintaining multiple off-system, non-integrated legacy systems
Staff costs necessary to manage the business processes and IT staff to manage systems.
Current systems not meeting demand from internal and external stakeholders leading to an increase in the backlog of maintenance programs
Increase in the use and associated cost of contractors, which will have a direct cost impact on capital expenditure projects.
Do nothing does not deliver the aspirations under the SA Power Networks Strategic Plan
Failure to meet KPI’s set to measure SA Power Networks’ performance against its strategic goals.
Costs of redundant and non-supported systems on failure
Increase in outages (GSL penalties).
Increased service interruptions Increase in the use of contractors and GSL penalties.
Increase in the number of calls to the customer service centre.
Decrease in the level of customer satisfaction against SA Power Networks benchmarks and compared to peers.
Inherent inefficiencies associated with multiple data conversions
Increase in staff, inaccurate and inconsistent data across multiple systems, and no ‘single version of the truth.’
4.1.7 Option 1 Timescale
Not applicable as this option is to do nothing.
4.1.8 Option 1 Major Business Risks
The following risk assessment has been conducted in accordance with the SA Power Networks’
corporate risk framework, including the application of the appropriate qualitative measures of
likelihood and consequence, and the resulting overall risk rating as defined in Appendix C. Major
business risks of not proceeding with this project are as follows.

Business Case - Project Portfolio Management (PPM) Business Options
www.sapowernetworks.com.au Page 23 of 50
Table 8 Major business risks of not proceeding with the project
Risk ID
Risk Description (Risk Line Item) Consequence Description
Inh
eren
t
Like
liho
od
Inh
eren
t C
on
seq
uen
ces
Ris
k R
atin
g
SA Power Networks fails to deliver Capital Expenditure Work Program
Failures in the network from inability to maintain assets appropriately;
Failure in network from inability to construct assets to meet demand;
Failure to meet customer service requirements.
Like
ly (
4)
Mo
der
ate
(3)
Hig
h (
7)
Work scheduling is manual and prone to error and inefficient allocation of SA Power Networks resources
Possible over/under scheduling of workers
Alm
ost
Cer
tain
(5
)
Min
imal
(1
)
Med
ium
(6
)
Fatigue management is manual Non-compliance with fatigue management rules
Like
ly (
4)
Mo
der
ate
(3)
Hig
h (
7)
Work scheduling is manual, leading to potential for incorrect technicians being assigned
Workers with incorrect qualifications, unlicensed or expired licensing may be assigned work, breaching work practice laws P
oss
ible
(3
)
Min
imal
(1
)
Low
(4
) Work scheduling is manual. This is
a complex task and could potentially be done incorrectly or inefficiently due to scheduler inexperience or lack of training
Incorrect scheduling and breaching compliance laws, as well as costly for the business.
Po
ssib
le (
3)
Min
or
(2)
Low
(5
)
Lack of integration between asset data and scheduling tools allowing incorrect asset classification
Incorrect asset classification and incorrect technician assigned, breaching safety and compliance rules. P
oss
ible
(3
)
Min
or
(2)
Low
(5
)
Scheduler technician job dissatisfaction using complex, error prone and manual processes
Dissatisfaction leading to poor retention rate, inexperienced schedulers and increased error rate. P
oss
ible
(3
)
Min
or
(2)
Low
(5
)

Business Case - Project Portfolio Management (PPM) Business Options
www.sapowernetworks.com.au Page 24 of 50
Risk ID
Risk Description (Risk Line Item) Consequence Description
Inh
eren
t
Like
liho
od
Inh
eren
t C
on
seq
uen
ces
Ris
k R
atin
g
Deterioration of service to customer
Increase in the number of calls to the customer contact centre about the progress of work being undertaken, adding extra workload.
Poorer customer service surveys and rankings, potentially leading to providing service below acceptable benchmark levels and against similar service providers
Po
ssib
le (
3)
Min
or
(2)
Low
(5
)
Inability to collect data required for Regulatory Reporting
Manual collection of data with no appropriate system to house the information will lead to data quality issues and increases time and effort to manage the data manually.
Like
ly (
4)
Mo
der
ate
(3)
Hig
h (
7)
4.2 Option 2 – Functionality Upgrade to Existing Processes and Systems
This option proposes changes to and integration of business processes and systems associated with
project planning and delivery and portfolio management through the functional upgrade of SA
Power Networks’ existing SAP ERP and associated systems. The added functionality will be provided
by using the following products:
SAP Portfolio and Project Management (PPM)
SAP Project Systems (PS)
SAP Multiresource Scheduling (MRS) and
ClickSchedule and ClickRoster.
Included in this option are the costs associated with the integration of these systems with other
systems including the SAP based estimating system (RealEst), SAP HR and SAP Financials. The change

Business Case - Project Portfolio Management (PPM) Business Options
www.sapowernetworks.com.au Page 25 of 50
management function associated with the integration of this option with the business processes is
also included in the estimate. ClickRoster is required for fatigue management.
This option will be completed by carrying out a number of interrelated projects that balances the
implementation in a controlled manner and manages risk to acceptable levels.
Consistent with SA Power Networks’ SAP Value Roadmap projects EAM10 and EAM129, this option
will deliver the following integration and functionality:
Deliver corporate visibility (7 year view) of the SA Power Networks program of work. The
project will establish a capability that will allow the organisation to identify, prioritise, balance
and monitor all work and resources.
Enable planning of maintenance requirements by planning jobs and resource requirements to
identify suitable resources with the right skills;
Enable integration of job scheduling for project, unplanned and planned work as well as
management of work more broadly through the systems;
Enable automatic work packaging for field workers and Asset inspectors in logical groupings
according to location and other configurable conditions;
Enable Resource Capacity Planning and work allocation for Field and Non-Field (network
planners, network project managers, delivery project managers, designers, etc.) workers, and
specialised fleet and equipment;
Enable inclusion of Fatigue Management to resource scheduling and planning;
Provide the systems support for the enhanced project management practices across the
organisation;
Implement a Project and Portfolio Management (PPM) solution for work program governance,
project management and resource management;
Realign Financial management of work in SAP existing Project System,;
Enable monitoring of investment and costs during the year and re- prioritisation if required;
RINS; resourcing of workforce; ability to complete annual forecast and complete program of
work; portfolio management and trends in actuals versus forecast;
Embed an integrated forecast capability that can be applied to all work.
9 Refer Appendix A. B

Business Case - Project Portfolio Management (PPM) Business Options
www.sapowernetworks.com.au Page 26 of 50
4.2.1 Option 2 Cost Summary
The following tables summarise the capital delivery and change management costs, opex uplift and total costs for Option 2. Option 2 will require total capital and operating costs of $10.0M over the investment period 2014/15 to 2021/22 or $6.6M over the 2015-2020 Regulatory Control Period. Table 9 Total Capital Costs by Business Unit ($M Real 2013/14)
Business Unit 2014/15
2015/16 2016/17 2017/18 2018/19 2019/20
Total 2015/16 - 2019/20
2020/21 2021/22
Total
IT Delivery and Change Mgmt 2.131
2.040 0.546 0.285 0.037 0.038 2.946
0.035 0.018
5.129
Non-IT Delivery and Change Mgmt -
0.600 0.183 0.066 - - 0.848
- -
0.848
TOTAL CAPITAL 2.131
2.640 0.729 0.350 0.037 0.038 3.794
0.035 0.018
5.978
Table 10 Total Opex Impact by Business Unit ($M Real 2013/14)
Business Unit 2014/15
2015/16 2016/17 2017/18 2018/19 2019/20
Total 2015/16 - 2019/20
2020/21 2021/22
Total
IT Opex -
0.403 0.531 0.603 0.619 0.620 2.776
0.620 0.620
4.017
Non-IT Opex -
- - - - - -
- -
-
TOTAL OPEX -
0.403 0.531 0.603 0.619 0.620 2.776
0.620 0.620
4.017
Table 11 Total Cost by Cost Type ($M Real 2013/14)
Business Unit 2014/15
2015/16 2016/17 2017/18 2018/19 2019/20
Total 2015/16 - 2019/20
2020/21 2021/22
Total
Total Capex 2.131
2.640 0.729 0.350 0.037 0.038 3.794
0.035 0.018
5.978
Total Opex -
0.403 0.531 0.603 0.619 0.620 2.776
0.620 0.620
4.017
TOTAL COST 2.131
3.043 1.260 0.954 0.656 0.658 6.570
0.655 0.638
9.995

Business Case - Project Portfolio Management (PPM) Business Options
www.sapowernetworks.com.au Page 27 of 50
4.2.2 Option 2 Delivery Costs
The table below is a summary of the capital project delivery and change management costs by project. Please refer to the Financial Assessment Sheet in Appendix A for a detailed view of these costs. For a view of the project costs by IT and non-IT, refer to Appendix Error! Reference source not found..
Table 12 Capital Delivery and Change Management Costs ($M Real 2013/14)
Project Name
2014/15
2015/16 2016/17 2017/18 2018/19 2019/20
Total 2015/16 - 2019/20
2020/21 2021/22
Total
PPM Click Integration -
0.355 0.119 - - - 0.474
- -
0.474
Integrated Resource Scheduling (EAM10) 1.914
0.630 0.029 - - - 0.659
- -
2.573
Project and Portfolio Management (EAM12) 0.217
- 0.349 0.322 - - 0.671
- -
0.888
MRS Integration -
0.995 - - - - 0.995
- -
0.995
PPM Integration -
0.660 0.222 - - - 0.882
- -
0.882
PPM Recurrent Upgrade -
- 0.009 0.028 0.037 0.038 0.112
0.035 0.018
0.165
TOTAL CAPITAL 2.131
2.640 0.729 0.350 0.037 0.038 3.794
0.035 0.018
5.978
4.2.3 Option 2 Delivery Cost Assumptions
1. Integration costs of $2.3M over CY 2015 and 2016 are included in the above costs.
2. The capital cost of the SAP modules, ClickSchedule and ClickRoster are based on:
SAP Project and Portfolio Management (PPM) – current estimates and forward estimates of Capital Expenditure and SAP supplier estimate.
SAP Project System (PS) –included as part of the overall cost of the corporate SAP ERP system and is not included separately in this cost.
SAP Multiresource Scheduling (MRS) - SAP supplier estimate.
ClickSchedule and ClickRoster – ClickSoftware supplier estimate. (additional to current Click Licencing)
The above costs also include the development, implementation, integration and change management costs associated with this option.
3. A provision for an IT Warranty period has been included in the Delivery Costs.

Business Case - Project Portfolio Management (PPM) Business Options
www.sapowernetworks.com.au Page 28 of 50
4. Change Management – these costs account for the effort involved to integrate new systems and business processes to ensure they align and provide the
expected benefits.
4.2.4 Option 2 Change Management Costs Assumptions
1. An Organisational Change Manager during delivery and post-delivery across the three business areas. 2. Change Management only includes costs related to the rollout of the new systems, not for all of the Program of Work initiatives.
4.2.5 Option 2 Opex Uplift
Table 13 Option 2 Opex Uplift ($M Real 2013/14)
Project Name
2014/15
2015/16 2016/17 2017/18 2018/19 2019/20
Total 2015/16 - 2019/20
2020/21 2021/22
Total
PPM Click Integration 0.000
0.067 0.103 0.118 0.124 0.124 0.537
0.124 0.124
0.785
Integrated Resource Scheduling (EAM10) 0.000
0.089 0.108 0.122 0.124 0.124 0.567
0.124 0.124
0.816
Project and Portfolio Management (EAM12) 0.000
0.089 0.108 0.122 0.124 0.124 0.567
0.124 0.124
0.816
MRS Integration 0.000
0.089 0.108 0.122 0.124 0.124 0.567
0.124 0.124
0.816
PPM Integration 0.000
0.067 0.103 0.118 0.124 0.124 0.537
0.124 0.124
0.785
TOTAL CAPITAL 0.000
0.403 0.531 0.603 0.619 0.620 2.776
0.620 0.620
4.017
4.2.6 Option 2 Opex Step Change Assumptions
The opex uplift costs include:
1. Annual software maintenance fees are included under recurrent services; and
2. The cost of SA Power Networks IT Technical Operations to provide support for the new systems.
Please refer to the Financial Assessment Sheet in Appendix A for a detailed view of these costs.

Business Case - Project Portfolio Management (PPM) Business Options
www.sapowernetworks.com.au Page 29 of 50
4.2.7 Option 2 Expected Positive Outcomes
The following positive outcomes are expected to be realised if this option is successfully embedded
in the business.
Table 14 Expected Positive Benefits
Outcome Type
Effect Outcome Description
Measure Date Outcome Expected
Value
Tangible Avoidance A lower number of staff needed to handle the increased scheduling and planning
Need less network planners compared to doing nothing
Incremental
from F15. Full
benefit after
F19
$908k
Intangible Direct Provide functionality to be able to capture information for RINs in a timely and accurate manner
Ability to meet Regulator’s deadline for responding to RINs
Incremental
from start of
F15, full
benefit after
F15
Avoidance of penalties for delay in providing RIN responses
Intangible Direct Ability to link customer to assets and financials via an integrated systems solution
No manual intervention required to integrate customer, financial and asset data.
More accurate and timely customer data
Incremental
from start of
F15, full
benefit after
F15
Greater reliability in the data coming from integrated systems
Improved level of customer service leading to greater customer satisfaction
Intangible Direct Ability to manage projects from small to large value and complexity without additional burden
Less administrative effort required to manage projects
Incremental
from start of
F15, full
benefit after
F15
Fewer resources required to manage projects
Intangible Indirect Ability to centralise the visibility of work for customers and assets
Customer accessible portal providing current service information
Incremental
from start of
F15, full
benefit after
F15
Greater customer satisfaction

Business Case - Project Portfolio Management (PPM) Business Options
www.sapowernetworks.com.au Page 30 of 50
Outcome Type
Effect Outcome Description
Measure Date Outcome Expected
Value
Intangible Direct Resource Scheduling: the most suitable people scheduled to jobs, taking into account skill-set, licenses and qualifications.
Faster throughput of scheduled jobs, less downtime.
Reduced risk of unqualified employee actioning work
Incremental
from start of
F15, full
benefit after
F15
More jobs completed
Safety compliance
Increased job satisfaction
Intangible Direct Resource Scheduling: travel times and fatigue management becoming fully integrated.
Compliance re worker fatigue management rules
Incremental
from start of
F15, full
benefit after
F15
Fatigue compliance
Safety compliance
Job satisfaction
Intangible Direct Resource Scheduling: Scheduling work to crews in geographical zones.
Network outage and maintenance response times;
Travel costs
Incremental
saving from
start of F15,
full benefit
after F15
Improvement in network job response KPI
Travel cost and time reduction
Fatigue compliance
Intangible Direct Resource scheduling: Scheduler job satisfaction from modern scheduling tools.
Increased scheduling throughput, increased retention rate.
Incremental
saving from
start of F15,
full benefit
after F15
Accurate scheduling
Faster scheduling
Increased retention rate
Intangible Direct Resource scheduling: Mobility scheduling allowing reschedule of work when required.
Lower Network outage response times due to rescheduling of personnel that may be nearby.
Fatigue management due to decreased travel times
Incremental
from start of
F15, full
benefit after
F15
Improvement in network job response KPI
Fatigue compliance
Intangible Direct Improved delivery of projects using integrated project and portfolio management systems and processes
An increase in % of Projects on budget, time and scope will increase
Some
improvement
end of F16,
full benefit
end of F17
onwards
Increase in the amount of capital works program that can completed using existing resource levels

Business Case - Project Portfolio Management (PPM) Business Options
www.sapowernetworks.com.au Page 31 of 50
Outcome Type
Effect Outcome Description
Measure Date Outcome Expected
Value
Intangible Direct Project and Portfolio management: Improved business forecasting, decision making and initiative selection.
Forecast accuracy;
Success of initiatives
Some
improvement
end of F16,
Full benefit
end of F17
onwards
More accurate allocation of resources
Intangible Direct Risk Management Improvement. Identify risks and manage earlier in the project lifecycle.
Project on time and budget
Some
improvement
at end of F16,
full benefit
end of F17
onwards
More projects on time and budget
Intangible Direct Improved Resource Demand Side Planning
The outcome of a rolling 7 Year program of work (Capex & Opex) drives significant benefits through the ability for the business to obtain more accurate Resource Demand Side Planning. This can only be achieved through accurate Estimation Processes and data (Compatible Units).
Incremental
saving from
start of F15,
full benefit
after F15
Improvement in network job response KPI
4.2.8 Option 2 Expected Negative Outcomes
Table 15 Expected disbenefits
Negative Outcome Consequence (Value, Measure)
Work needs to be undertaken to make sure accurate and reliable data is available to populate the new systems.
If the data used is not accurate and cannot be relied on, the integrity of the system will be in doubt, diminishing its value.
Acceptance of new systems by staff across the organisation
Investment in the new systems to not return the expected benefits.

Business Case - Project Portfolio Management (PPM) Business Options
www.sapowernetworks.com.au Page 32 of 50
4.2.9 Option 2 Timescale
SA Power Networks commenced its Program of Work initiative in 2011, which includes process re-
engineering, systems review, data extraction, estimating and resource scheduling. A number of
initiatives have already commenced and are currently under way:
Table 16 Option 2 Timescale – Current Initiatives
Timescale Activity Start Date End Date
Management of Work projects Q4 2011 Q1 2017
Resource Capacity Planning Q4 2011 Q2 2016
In terms of systems implementation, which is the focus of this business case, the high level timetable
is:
Table 17 Option 2 Timescale – System Initiatives
Timescale Activity Start Date End Date
PPM & MRS Implementation and Integration
Project, Portfolio Management (EAM12) Q4 2014 Q1 2017
PPM Integration Q4 2015 Q4 2015
Integrated Resource Scheduling (MRS) (EAM10) Q4 2014 Q1 2016
MRS Integration Q3 2015 Q3 2015
Click Integration Q4 2015 Q4 2015
Rollout to Business Areas
Rollout to Network Q2 2015 Q2 2016
Rollout to IT PMO Q3 2016 Q1 2017
Rollout to CPMO Q2 2017 Q1 2018
4.2.10 Option 2 Major Business Risks
The following risk assessment has been conducted in accordance with the SA Power Networks’
corporate risk framework, including the application of the appropriate qualitative measures of
likelihood and consequence, and the resulting overall risk rating as defined in Appendix C. Major
business risks of this option are detailed in the table below.

Business Case - Project Portfolio Management (PPM) Business Options
www.sapowernetworks.com.au Page 33 of 50
Table 18 Major business risks associated with Option
Risk ID
Risk Description (Risk Line Item) Consequence Description
Inh
eren
t
Like
liho
od
Inh
eren
t C
on
seq
uen
ces
Ris
k R
atin
g
Project risk, ie, typical risks associated with delivering initiatives using a standard project lifecycle approach.
Unacceptable scoring of measures against which the project is monitored, ie, Schedule, Scope, Quality, Risk Management and Cost P
oss
ible
(3
)
Mo
der
ate
(3)
Med
ium
(6
)
Insufficient collaboration with other Enterprise Asset Management initiatives.
EAM initiatives are expected to be rolled out across the organisation. If these initiatives are not implemented in conjunction with these initiatives, there is risk the EAM will not deliver the expected benefits.
Po
ssib
le (
3)
Mo
der
ate
(3)
Med
ium
(6
)
Underestimating the amount of Change Management involved with these initiatives.
There is currently no centralised PPM function that is developing or monitoring the entire program of work other than the Finance group which only has a Financial focus.
The change management around implementing these initiatives is therefore significant.
Like
ly (
6)
Mo
der
ate
(3)
Hig
h (
7)
Dependencies – lack of integration between PPM, finance and asset data not providing the expected visibility and level of detail.
Customer does not have access to its service details and potential impact of planned work
Detailed information required to complete RINs not provided by the system, potentially leading to delays or inability to satisfy those requests
Po
ssib
le (
3)
Min
or
(2)
LOW
(5
)

Business Case - Project Portfolio Management (PPM) Business Options
www.sapowernetworks.com.au Page 34 of 50
4.3 Option 3 – Implement a Multi-platform, Integrated Solution
Option 3 considers the integration of project portfolio management functions using multiple point
solutions. This option uses additional integration modules (SAP EPS Connect) and other discreet
systems to provide the required level of integration for comparison with Option 2.
To identify suitable alternative systems, SA Power Networks undertook market research through
using Gartner Technology Research’s Magic Quadrant10. The Magic Quadrants are a culmination of
research in a specific market and provide a view of the relative positions of the market's
competitors. By applying a graphical treatment and a uniform set of evaluation criteria, a Magic
Quadrant allows an assessment of the relevant technology providers.
Magic Quadrants provide a graphical competitive positioning of four types of technology providers,
where market growth is high and provider differentiation is distinct:
1. Leaders execute well against their current vision and are well positioned for tomorrow.
2. Visionaries understand where the market is going or have a vision for changing market rules,
but do not yet execute well.
3. Niche Players focus successfully on a small segment, or are unfocused and do not out-
innovate or outperform others.
4. Challengers execute well today or may dominate a large segment, but do not demonstrate
an understanding of market direction.
In terms of the most suitable solution provider to meet SA Power Networks’ requirements for this
Business Case, it is important to recognise the recommended solution provider primarily needs to
align to the organisation’s business goals, and may not necessarily be a market leader.
Project and Portfolio Management System
Utilising the Gartner Magic Quadrant results, SA
Power Networks identified Microsoft Project, Oracle
Primavera and Microsoft Project Server applications as
best fit alternate systems for the Project and Portfolio
Management System. The figure below shows that
Microsoft and Oracle are placed as leaders in PPM
solutions on the Magic Quadrant.
In this option, Oracle Primavera would serve as the
PPM system and would integrate with the SAP ERP
system via SAP Enterprise Project Connection (EPC).
Microsoft Project Server, Project Standard and Project
Professional would serve as the project management
system and would integrate with Primavera and the
SAP ERP via SAP EPC. Integration with RealEst is also considered in this option. There would be little
integration with the HR systems, finance systems, asset systems or the field services management
systems.
10 Gartner Magic Quadrant Reports – refer 8.5 References

Business Case - Project Portfolio Management (PPM) Business Options
www.sapowernetworks.com.au Page 35 of 50
Field Services Management
As in Option 2, SA Power Networks has
chosen ClickSoftware’s ClickSchedule,
ClickRoster and SAP MultiResource
Scheduling as the solution for an integrated
resource scheduling system. In the diagram
below, ClickSoftware is the leader in this field
and has focussed on the energy and utility
sectors. There is currently no Microsoft
product that fulfils the requirements of field
service management.
ClickSchedule, ClickRoster and SAP
MultiResource Scheduling also serves for
fatigue management and has also been
selected for Option 2 as its integration with
SAP ERP is provided.

Business Case - Project Portfolio Management (PPM) Business Options
www.sapowernetworks.com.au Page 36 of 50
4.3.1 Option 3 Cost Summary
The following tables summarise the capital delivery and change management costs, net opex uplift and total costs for Option 3. Option 3 will require total capital and operating costs of $12.8M over the investment period 2014/15 to 2021/22 or $7.8M over the 2015-2020 Regulatory Control Period. Table 19 Total Capital Costs by Business Unit ($M Real 2013/14)
Business Unit 2014/15
2015/16 2016/17 2017/18 2018/19 2019/20
Total 2015/16 - 2019/20
2020/21 2021/22
Total
IT Delivery and Change Mgmt 3.040
2.217 0.381 0.825 0.038 0.038 3.500
0.038 0.038
6.615
Non-IT Delivery and Change Mgmt -
0.705 0.107 0.093 - - 0.904
- -
0.904
TOTAL CAPITAL 3.040
2.922 0.488 0.918 0.038 0.038 4.404
0.038 0.038
7.519
Table 20 Total Opex Impact by Business Unit ($M Real 2013/14)
Business Unit 2014/15
2015/16 2016/17 2017/18 2018/19 2019/20
Total 2015/16 - 2019/20
2020/21 2021/22
Total
IT Opex 0.531
0.726 0.702 0.682 0.663 0.662 3.434
0.662 0.662
5.289
Non-IT Opex -
- - - - - -
- -
-
TOTAL OPEX 0.531
0.726 0.702 0.682 0.663 0.662 3.434
0.662 0.662
5.289
Table 21 Total Cost by Cost Type ($M Real 2013/14)
Business Unit 2014/15
2015/16 2016/17 2017/18 2018/19 2019/20
Total 2015/16 - 2019/20
2020/21 2021/22
Total
Total Capex 3.040
2.922 0.488 0.918 0.038 0.038 4.404
0.038 0.038
7.519
Total Opex 0.531
0.726 0.702 0.682 0.663 0.662 3.434
0.662 0.662
5.289
TOTAL COST 3.571
3.648 1.190 1.600 0.700 0.700 7.838
0.700 0.700
12.808
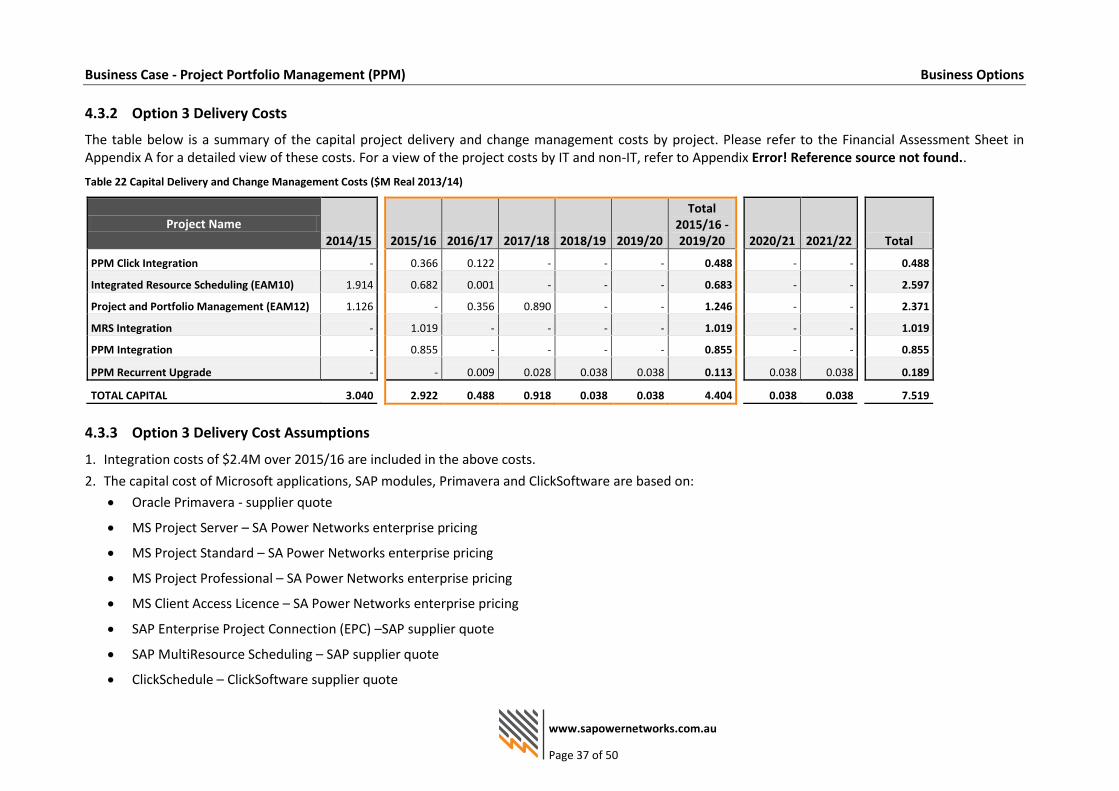
Business Case - Project Portfolio Management (PPM) Business Options
www.sapowernetworks.com.au Page 37 of 50
4.3.2 Option 3 Delivery Costs
The table below is a summary of the capital project delivery and change management costs by project. Please refer to the Financial Assessment Sheet in Appendix A for a detailed view of these costs. For a view of the project costs by IT and non-IT, refer to Appendix Error! Reference source not found..
Table 22 Capital Delivery and Change Management Costs ($M Real 2013/14)
Project Name
2014/15
2015/16 2016/17 2017/18 2018/19 2019/20
Total 2015/16 - 2019/20
2020/21 2021/22
Total
PPM Click Integration -
0.366 0.122 - - - 0.488
- -
0.488
Integrated Resource Scheduling (EAM10) 1.914
0.682 0.001 - - - 0.683
- -
2.597
Project and Portfolio Management (EAM12) 1.126
- 0.356 0.890 - - 1.246
- -
2.371
MRS Integration -
1.019 - - - - 1.019
- -
1.019
PPM Integration -
0.855 - - - - 0.855
- -
0.855
PPM Recurrent Upgrade -
- 0.009 0.028 0.038 0.038 0.113
0.038 0.038
0.189
TOTAL CAPITAL 3.040
2.922 0.488 0.918 0.038 0.038 4.404
0.038 0.038
7.519
4.3.3 Option 3 Delivery Cost Assumptions
1. Integration costs of $2.4M over 2015/16 are included in the above costs.
2. The capital cost of Microsoft applications, SAP modules, Primavera and ClickSoftware are based on:
Oracle Primavera - supplier quote
MS Project Server – SA Power Networks enterprise pricing
MS Project Standard – SA Power Networks enterprise pricing
MS Project Professional – SA Power Networks enterprise pricing
MS Client Access Licence – SA Power Networks enterprise pricing
SAP Enterprise Project Connection (EPC) –SAP supplier quote
SAP MultiResource Scheduling – SAP supplier quote
ClickSchedule – ClickSoftware supplier quote

Business Case - Project Portfolio Management (PPM) Business Options
www.sapowernetworks.com.au Page 38 of 50
The above costs also include the development, implementation, integration and change management costs associated with this option. Assumed also is a
3 year replacement on MS products.
3. A provision for an IT Warranty period has been included in the Delivery Costs.
4. Change Management – these costs account for the effort involved to integrate new systems and business processes to ensure they align and provide the
expected benefits.
5. Extra hardware is provided for increased usage of MS products.
4.3.4 Option 3 Change Management Costs Assumptions
3. An Organisational Change Manager during delivery and post-delivery across the three business areas. 4. Change Management only includes costs related to the rollout of the new systems, not for all of the Program of Work initiatives.
4.3.5 Option 3 Opex Impact
Table 23 Option 3 Opex Uplift by Project ($M Real 2013/14)
Project Name
2014/15
2015/16 2016/17 2017/18 2018/19 2019/20
Total 2015/16 - 2019/20
2020/21 2021/22
Total
PPM Click Integration 0.084
0.138 0.142 0.137 0.133 0.132 0.683
0.132 0.132
1.031
Integrated Resource Scheduling (EAM10) 0.112
0.147 0.140 0.136 0.132 0.132 0.688
0.132 0.132
1.064
Project and Portfolio Management (EAM12) 0.112
0.147 0.140 0.136 0.132 0.132 0.688
0.132 0.132
1.064
MRS Integration 0.112
0.147 0.140 0.136 0.132 0.132 0.688
0.132 0.132
1.064
PPM Integration 0.112
0.147 0.140 0.136 0.132 0.132 0.688
0.132 0.132
1.064
TOTAL CAPITAL 0.531
0.726 0.702 0.682 0.663 0.662 3.434
0.662 0.662
5.289
4.3.6 Option 3 Opex Impact Assumptions
The recurrent costs include:
1. Annual software maintenance fees derived from the latest Microsoft Price Lists publicly available for the appropriate modules that are required.
2. The cost of SA Power Networks IT Technical Operations to provide support for the new systems.
Please refer to the Financial Assessment Sheet in Appendix A for a detailed view of these costs.

Business Case - Project Portfolio Management (PPM) Business Options
www.sapowernetworks.com.au Page 39 of 50
4.3.7 Option 3 Expected Positive Outcomes
The objective of this suite of applications is to deliver the required level of integration as per Option
2 therefore the expected positive outcomes are the same as Option 2.
4.3.8 Option 3 Expected Negative Outcomes
The expected negative outcomes from this option relate to the amount of extra effort required by IT
to manage the disparate systems over time from successive and out of step updates. Table 24 Expected disbenefits
Negative Outcome Consequence (Value, Measure)
Additional effort involved in maintaining and supporting non-integrated systems.
Disparate systems will mean greater support and maintenance, and subsequent cost, due to inconsistent technologies, enhancements and upgrades from various vendors, and maintaining separate licence agreements.
Greater effort required to integrate systems when delivering the technology.
There will be greater cost involved in delivering the technology to ensure the disparate systems and correctly and reliably integrated to satisfy the business requirements and provide the expected benefits.
4.3.9 Option 3 Timescale
SA Power Networks commenced its Program of Work initiative in 2011, which includes process re-
engineering, systems review, data extraction, estimating and resource scheduling. A number of
initiatives have already commenced and are currently under way:
Table 25 Option 3 Timescale – Current Initiatives
Timescale Activity Start Date End Date
Management of Work projects Q4 2011 Q1 2017
Resource Capacity Planning Q4 2011 Q2 2016
In terms of systems implementation, which is the focus of this business case, the high level timetable
is:
Table 26 Option 3 Timescale – System Initiatives
Timescale Activity Start Date End Date
Project, portfolio and Program Management – implementation and configuration
Q12015 Q2 2016
Rollout to Network Q2 2015 Q2 2016
Rollout to IT PMO Q3 2016 Q1 2017
Rollout to CPMO Q2 2017 Q1 2018
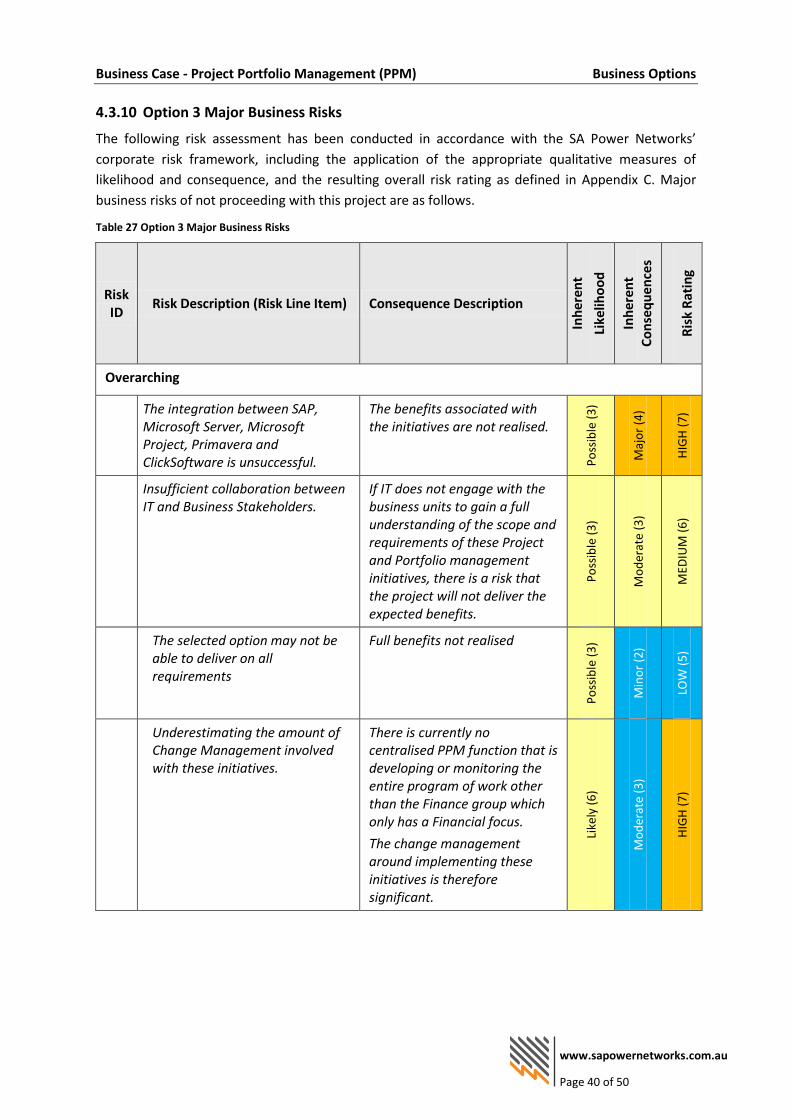
Business Case - Project Portfolio Management (PPM) Business Options
www.sapowernetworks.com.au Page 40 of 50
4.3.10 Option 3 Major Business Risks
The following risk assessment has been conducted in accordance with the SA Power Networks’
corporate risk framework, including the application of the appropriate qualitative measures of
likelihood and consequence, and the resulting overall risk rating as defined in Appendix C. Major
business risks of not proceeding with this project are as follows.
Table 27 Option 3 Major Business Risks
Risk ID
Risk Description (Risk Line Item) Consequence Description
Inh
eren
t
Like
liho
od
Inh
eren
t C
on
seq
uen
ces
Ris
k R
atin
g
Overarching
The integration between SAP, Microsoft Server, Microsoft Project, Primavera and ClickSoftware is unsuccessful.
The benefits associated with the initiatives are not realised.
Po
ssib
le (
3)
Maj
or
(4)
HIG
H (
7)
Insufficient collaboration between IT and Business Stakeholders.
If IT does not engage with the business units to gain a full understanding of the scope and requirements of these Project and Portfolio management initiatives, there is a risk that the project will not deliver the expected benefits.
Po
ssib
le (
3)
Mo
der
ate
(3)
MED
IUM
(6
)
The selected option may not be able to deliver on all requirements
Full benefits not realised
Po
ssib
le (
3)
Min
or
(2)
LOW
(5
)
Underestimating the amount of Change Management involved with these initiatives.
There is currently no centralised PPM function that is developing or monitoring the entire program of work other than the Finance group which only has a Financial focus.
The change management around implementing these initiatives is therefore significant.
Like
ly (
6)
Mo
der
ate
(3)
HIG
H (
7)

Business Case - Project Portfolio Management (PPM) Business Options
www.sapowernetworks.com.au Page 41 of 50
Risk ID
Risk Description (Risk Line Item) Consequence Description
Inh
eren
t
Like
liho
od
Inh
eren
t C
on
seq
uen
ces
Ris
k R
atin
g
Insufficient collaboration with Enterprise Asset Management initiatives.
EAM initiatives are expected to be rolled out across the organisation. If these initiatives are not implemented in conjunction with these Project and Portfolio management initiatives, there is risk the EAM will not deliver the expected benefits.
Po
ssib
le (
3)
Mo
der
ate
(3)
MED
IUM
(6
)
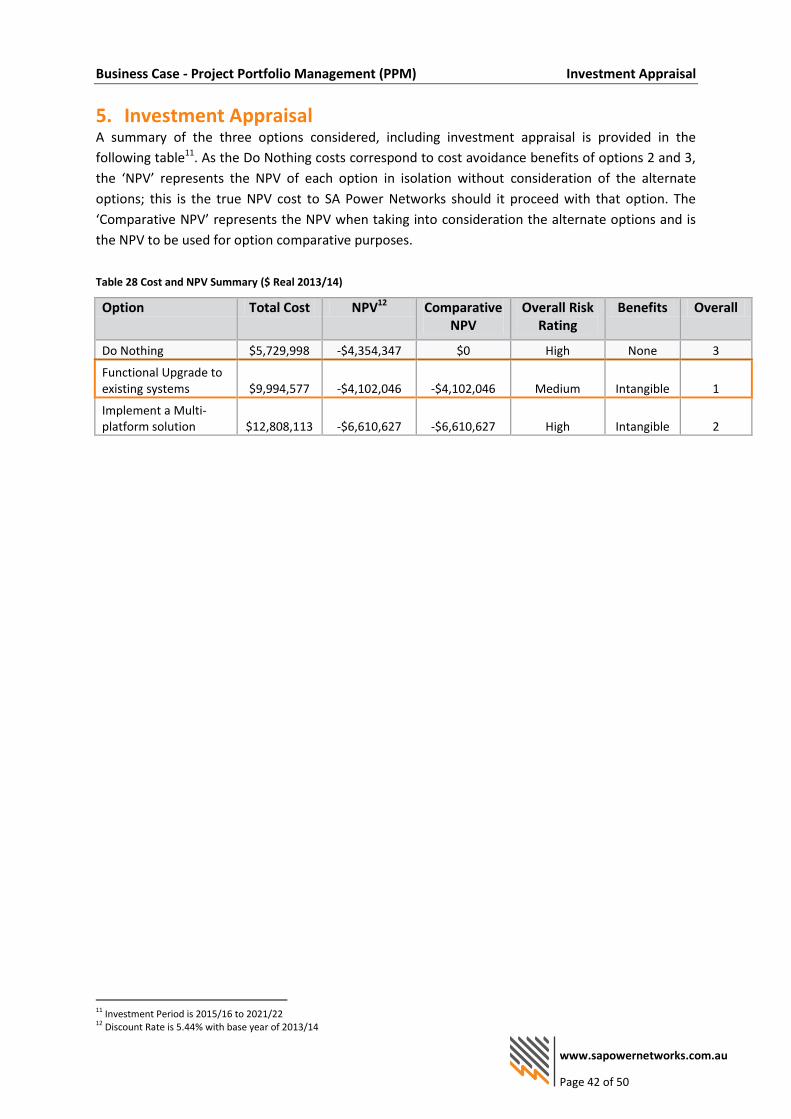
Business Case - Project Portfolio Management (PPM) Investment Appraisal
www.sapowernetworks.com.au Page 42 of 50
5. Investment Appraisal A summary of the three options considered, including investment appraisal is provided in the
following table11. As the Do Nothing costs correspond to cost avoidance benefits of options 2 and 3,
the ‘NPV’ represents the NPV of each option in isolation without consideration of the alternate
options; this is the true NPV cost to SA Power Networks should it proceed with that option. The
‘Comparative NPV’ represents the NPV when taking into consideration the alternate options and is
the NPV to be used for option comparative purposes.
Table 28 Cost and NPV Summary ($ Real 2013/14)
Option Total Cost NPV12 Comparative NPV
Overall Risk Rating
Benefits Overall
Do Nothing $5,729,998 -$4,354,347 $0 High None 3
Functional Upgrade to existing systems $9,994,577 -$4,102,046 -$4,102,046 Medium Intangible 1
Implement a Multi-platform solution $12,808,113 -$6,610,627 -$6,610,627 High Intangible 2
11 Investment Period is 2015/16 to 2021/22 12 Discount Rate is 5.44% with base year of 2013/14

Business Case - Project Portfolio Management (PPM) High Level Summary of Options
www.sapowernetworks.com.au Page 43 of 50
6. High Level Summary of Options
The options outlined in this Business Case are summarised in the following table:
Option 1 Option 2 Option 3
DO NOTHING
• Maintain status quo -
continue with current business processes and systems
FUNCTIONALITY UPGRADE TO EXISTING SYSTEMS
Enhance and upgrade existing SA Power Networks systems (SAP) to provide the following additional and integrated functionality:
• SAP Project Portfolio Management system;
• SAP Project Systems
• SAP MultiResource Scheduling system;
• ClickSchedule; and
• ClickRoster
IMPLEMENT MULTIPLATFORM SOLUTION
Enable business processes improvements associated with the program, project management and resource capacity planning as per Option 2 but through point solutions, identified through a Gartner Magic Quadrant and non-core systems such as:
• Microsoft Project
• SAP EPS Connect
• Microsoft Project Server
• Oracle Primavera
• SAP MultiResource Scheduling system
• ClickSchedule
• ClickRoster

Business Case - Project Portfolio Management (PPM) Recommendation
www.sapowernetworks.com.au Page 44 of 50
7. Recommendation
SA Power Networks recognises that in order to increase its capability to meet the demand for
services it must change the way it currently manages its program of work. This business case
therefore recommends Option 2 , that is, implement an integrated project portfolio management
system and resource planning system to provide an organisation-wide wide capability across the
program management, work planning, corporate portfolio management and IT portfolio
management functions using the organisation’s existing corporate SAP ERP system.
The key reasons for recommending this option are detailed in this Business Case, particularly Section
4.2, and can be summarised as follows:
1. This option builds on the foundation work already initiated by SA Power Networks and uses
the business’s existing core ERP system, which will result in a more integrated and cost
effective solution.
2. The initiatives satisfy the Corporate, Business Unit and IT strategic plans.
3. The initiatives satisfy the regulatory requirements for National Electricity Rules.
4. The successful implementation of this recommendation will enable SA Power Networks to
manage the demand for standard control services by enabling the timely, accurate, and cost
effective provision of materials and services to support network reliability, safety and
capacity.
5. All business units across SA Power Networks will be able to improve processes, which directly
benefits customers, suppliers, and regulatory bodies.
The recommendation is supported by comparing each of the options against the following criteria:
Criteria Option 1
Do Nothing
Option 2
Use Core Systems
Option 3
Use non-Core Systems
Cost ($) $5,729,998 $9,994,577 $12,808,113
NPV ($) -$4,354,347 -$4,102,046 -$6,610,627
Comparative NPV ($) $0 -$4,102,046 -$6,610,627
Overall Risk Rating HIGH MEDIUM HIGH
Benefits None Intangible Intangible
Alignment to Corporate Strategy & Programs
Alignment to IT Strategy & Programs
Relationship to NER Expenditure Objectives
Relationship to NER Expenditure Criteria
Meets Initiative(s) Scope

Business Case Project Portfolio Management (PPM) Document Authorisation and History
www.sapowernetworks.com.au Page 45 of 50
8. Document Authorisation and History 8.1 References
The following documents were referenced in completion of this document:
Ref Document Name Date Version Author
SA Power Networks 7 Year SAP Value Roadmap 15 Nov 13 1.2 SAP/ SA Power
Networks
IT Strategic Plan 2013 to 2017 18 Apr 13 1.1 SA Power Networks
AER Final Decision, SA Distribution Determination 2010/11 – 2014/15
May 2010 1 Australian
Energy Regulator
SA Power Networks Strategic Plan 2013-2017 November
2012 1
SA Power Networks
National Electricity Rules January
2014 60
Australian Energy Market
Commission
IT Project & Portfolio Management 2010, Magic Quadrant
July 2010 1 Gartner Inc.
Magic Quadrant for Field Service Management October
2012 1 Gartner Inc.
Gartner Magic Quadrant for Corporate Performance Management (CPM) Suites
February 2010
1 Gartner Inc.
8.2 Acronyms and Abbreviations
Acronym / Abbreviation Definition
KPI Key Performance Indicator
PPM Project & Portfolio Management
ITPMO Information Technology Portfolio Management Office
CPMO Corporate Project Management Office
AER Australian Energy Regulator
HR Human Resources
FTEs Full-time equivalent
ESCOSA Essential Services Commission of South Australia
RealEst SA Power Networks estimating system
SAP PS SAP Project System

Project Portfolio Management (PPM) - Business Case Cost Details
www.sapowernetworks.com.au Page 46 of 50
Acronym / Abbreviation Definition
SAP MRS SAP Multiresource Scheduling
SAP EPC SAP Enterprise Project Connect
ERP Enterprise Resource Planning
EAM Enterprise Asset Management
SAP PM SAP Plant Maintenance

Project Portfolio Management (PPM) - Business Case Cost Details
www.sapowernetworks.com.au Page 47 of 50
Appendix A COST DETAILSTable 29 Option 2 Capital and Operating Costs by Business Unit ($ Real 2013/14)
Project Name Bus Unit
Cost Type 2014/15
2015/16 2016/17 2017/18 2018/19 2019/20
2015/16 - 2019/20
2020/21 2021/22
Total
Click Integration IT Capex -
$293K $98K - - - $391K
- -
$391K
IT Opex -
$67K $103K $118K $124K $124K $537K
$124K $124K
$785K
Non-IT Capex -
$62K $21K - - - $83K
- -
$83K
Non-IT Opex -
- - - - - -
- -
-
Integrated Resource Scheduling (EAM10) IT Capex $1,914K
$502K $10K - - - $512K
- -
$2,427K
IT Opex -
$89K $108K $122K $124K $124K $567K
$124K $124K
$816K
Non-IT Capex -
$128K $18K - - - $147K
- -
$147K
Non-IT Opex -
- - - - - -
- -
-
Project and Portfolio Management (EAM12) IT Capex $217K
- $266K $257K - - $522K
- -
$739K
IT Opex -
$89K $108K $122K $124K $124K $567K
$124K $124K
$816K
Non-IT Capex -
- $84K $66K - - $149K
- -
$149K
Non-IT Opex -
- - - - - -
- -
-
MRS Integration IT Capex -
$761K - - - - $761K
- -
$761K
IT Opex -
$89K $108K $122K $124K $124K $567K
$124K $124K
$816K
Non-IT Capex -
$234K - - - - $234K
- -
$234K
Non-IT Opex -
- - - - - -
- -
-
PPM Integration IT Capex -
$484K $163K - - - $647K
- -
$647K
IT Opex -
$67K $103K $118K $124K $124K $537K
$124K $124K
$785K
Non-IT Capex -
$176K $60K - - - $235K
- -
$235K
Non-IT Opex -
- - - - - -
- -
-
PPM Recurrent Upgrade IT Capex -
- $9K $28K $37K $38K $112K
$35K $18K
$165K
IT Opex -
- - - - - -
- -
-
Non-IT Capex -
- - - - - -
- -
-
Non-IT Opex -
- - - - - -
- -
-
TOTAL IT $2,131K
$2,443K $1,078K $888K $656K $658K $5,722K
$655K $638K
$9,146K
TOTAL Non-IT -
$600K $183K $66K - - $848K
- -
$848K
TOTAL
$3,043K $1,260K $954K $656K $658K $6,570K
$655K $638K
$9,995K

Project Portfolio Management (PPM) - Business Case Cost Details
www.sapowernetworks.com.au Page 48 of 50
Table 30 Option 3 Capital and Operating Costs by Business Unit ($ Real 2013/14)
Project Name Bus Unit
Cost Type 2014/15
2015/16 2016/17 2017/18 2018/19 2019/20
2015/16 - 2019/20
2020/21 2021/22
Total
Click Integration IT Capex -
$301K $100K - - - $401K
- -
$401K
IT Opex $84K
$138K $142K $137K $133K $132K $683K
$132K $132K
$1,031K
Non-IT Capex -
$65K $22K - - - $87K
- -
$87K
Non-IT Opex -
- - - - - -
- -
-
Integrated Resource Scheduling (EAM10) IT Capex $1,914K
$530K $1K - - - $531K
- -
$2,445K
IT Opex $112K
$147K $140K $136K $132K $132K $688K
$132K $132K
$1,064K
Non-IT Capex -
$152K - - - - $152K
- -
$152K
Non-IT Opex -
- - - - - -
- -
-
Project and Portfolio Management (EAM12) IT Capex $1,126K
- $271K $797K - - $1,068K
- -
$2,193K
IT Opex $112K
$147K $140K $136K $132K $132K $688K
$132K $132K
$1,064K
Non-IT Capex -
- $85K $93K - - $178K
- -
$178K
Non-IT Opex -
- - - - - -
- -
-
MRS Integration IT Capex -
$775K - - - - $775K
- -
$775K
IT Opex $112K
$147K $140K $136K $132K $132K $688K
$132K $132K
$1,064K
Non-IT Capex -
$244K - - - - $244K
- -
$244K
Non-IT Opex -
- - - - - -
- -
-
PPM Integration IT Capex -
$611K - - - - $611K
- -
$611K
IT Opex $112K
$147K $140K $136K $132K $132K $688K
$132K $132K
$1,064K
Non-IT Capex -
$244K - - - - $244K
- -
$244K
Non-IT Opex -
- - - - - -
- -
-
PPM Recurrent Upgrade IT Capex -
- $9K $28K $38K $38K $113K
$38K $38K
$189K
IT Opex -
- - - - - -
- -
-
Non-IT Capex -
- - - - - -
- -
-
Non-IT Opex -
- - - - - -
- -
-
TOTAL IT $3,571K
$2,943K $1,084K $1,507K $700K $700K $6,934K
$700K $700K
$11,904K
TOTAL Non-IT -
$705K $107K $93K - - $904K
- -
$904K
TOTAL $3,571K
$3,648K $1,190K $1,600K $700K $700K $7,838K
$700K $700K
$12,808K

Project Portfolio Management (PPM) - Business Case SAP Value Roadmap Initiatives – SAP Foundation Business Case
Appendix B SAP VALUE ROADMAP INITIATIVES – SAP FOUNDATION BUSINESS CASE
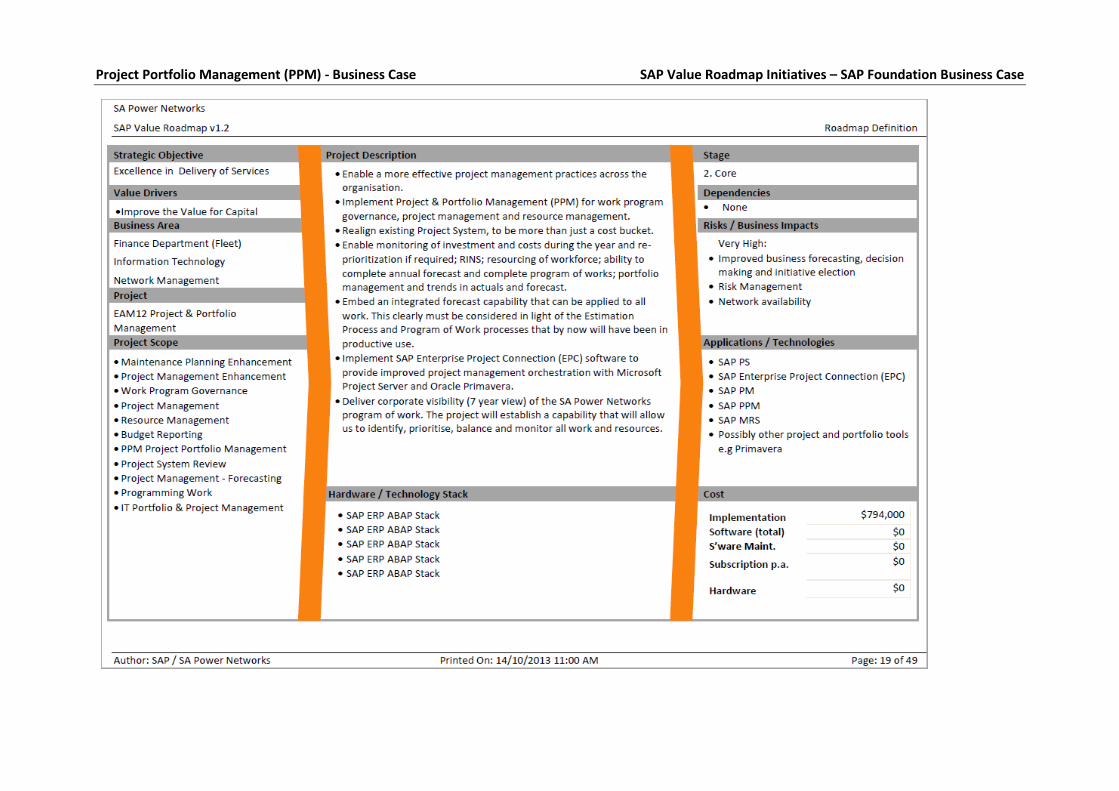
Project Portfolio Management (PPM) - Business Case SAP Value Roadmap Initiatives – SAP Foundation Business Case