attachment 1 insert page - new jerseyattachment 1 is confidential ... indicated 2011 and 2012...
TRANSCRIPT

Attachment 1
AGL Resources Inc.’s Tax Sharing Agreement
Attachment 1 is Confidential
PRELIMINARY PUBLIC COPY

Attachment 2
Elizabethtown Gas Company Form 1120 2008 - 2011
Attachment 2 is Confidential
PRELIMINARY PUBLIC COPY

Attachment 3
AGL Resources Inc. 2008 – 2011 Federal Consolidated Tax
Returns
Attachment 3 is Confidential
PRELIMINARY PUBLIC COPY

Attachment 4
Total Federal Income Taxes Paid By AGL Resources Inc.
2008 – 2011
Attachment 4 is Confidential
PRELIMINARY PUBLIC COPY

Attachment 5
Bonus Depreciation Taken By AGL Resources Inc.
Consolidated Tax Group 2002 – 2011
Attachment 5 is Confidential
PRELIMINARY PUBLIC COPY

Attachment 6
Alternative Minimum Tax Payments By
AGL Resources Inc.
2008 – 2011
Attachment 6 is Confidential
PRELIMINARY PUBLIC COPY

Attachment 7
AGL Resources Inc. Operating Loss Carryovers
Attachment 7 is Confidential
PRELIMINARY PUBLIC COPY
Attachment 8
AGL Resources Inc.’s
2012 Annual Report
PRELIMINARY PUBLIC COPY

Expanding Opportunities2012 Annual Report
aglresources.com
AG
L R
ES
OU
RC
ES
INC
. AN
NU
AL
RE
PO
RT
20
12
PRELIMINARY PUBLIC COPY
ILILILILILILOHOHOHOHOHOHOH
NYNYNYNYNYNYNY
VA
TN
TX GAGAGAGA
VIRGINIA BEACHVIRGINIA BEACH
CHATTANOOGACHATTANOOGA
BERKELEY HEIGHTSBERKELEY HEIGHTS
NAPERVILLENAPERVILLE
INININININININ
KYKYKYKYKYKYKY
PAPAPAPAPAPAPA
MAMAMAMAMAMAMA
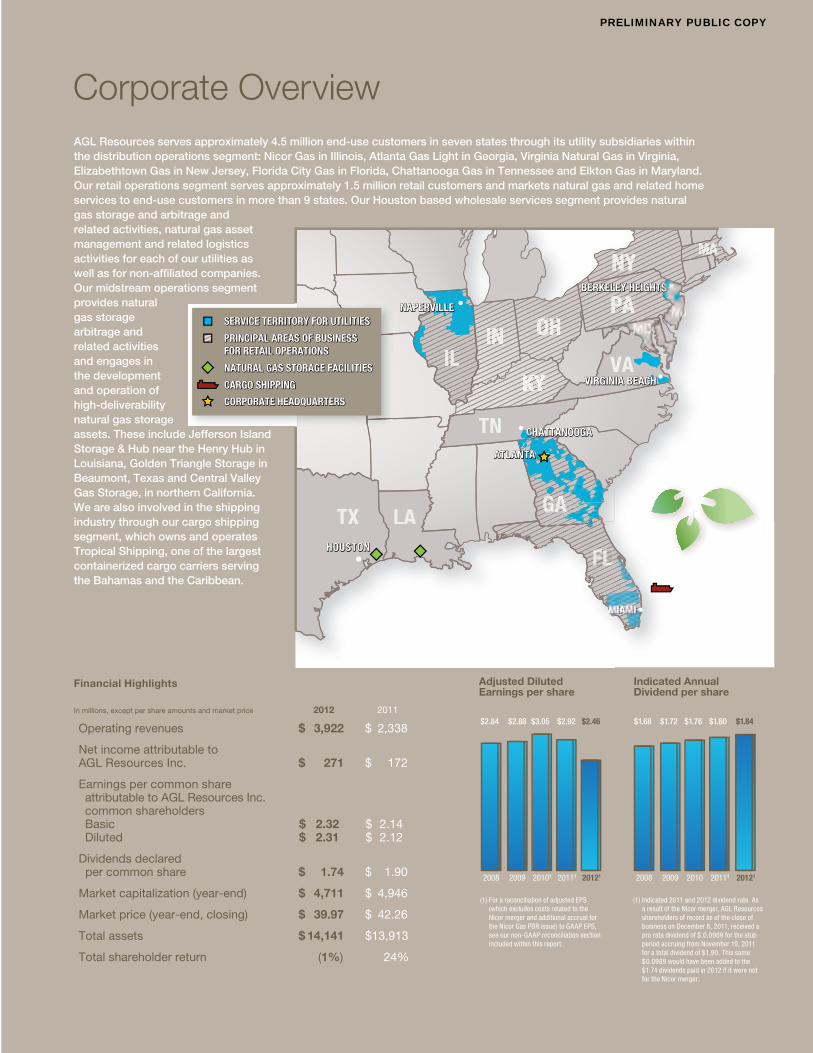
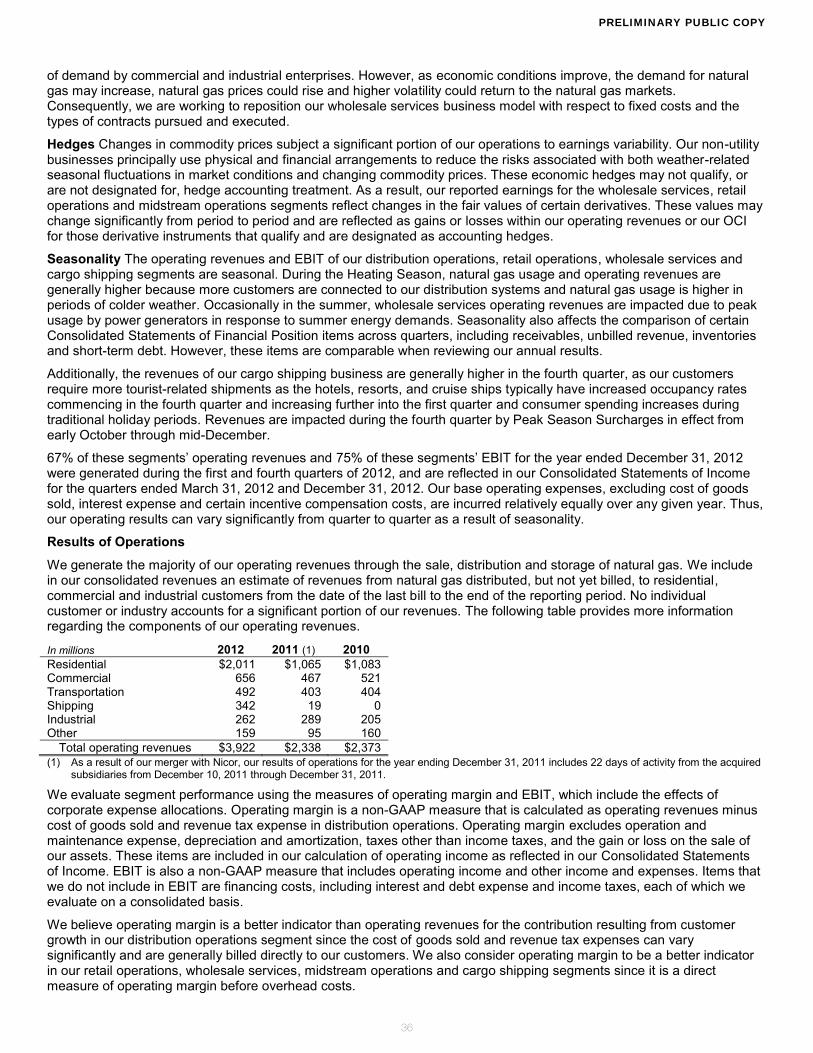
AGL Resources serves approximately 4.5 million end-use customers in seven states through its utility subsidiaries within the distribution operations segment: Nicor Gas in Illinois, Atlanta Gas Light in Georgia, Virginia Natural Gas in Virginia, Elizabethtown Gas in New Jersey, Florida City Gas in Florida, Chattanooga Gas in Tennessee and Elkton Gas in Maryland. Our retail operations segment serves approximately 1.5 million retail customers and markets natural gas and related home services to end-use customers in more than 9 states. Our Houston based wholesale services segment provides natural gas storage and arbitrage and related activities, natural gas asset management and related logistics activities for each of our utilities as well as for non-affiliated companies. Our midstream operations segment provides natural gas storage arbitrage and related activities and engages in the development and operation of high-deliverability natural gas storage assets. These include Jefferson Island Storage & Hub near the Henry Hub in Louisiana, Golden Triangle Storage in Beaumont, Texas and Central Valley Gas Storage, in northern California. We are also involved in the shipping industry through our cargo shipping segment, which owns and operates Tropical Shipping, one of the largest containerized cargo carriers serving the Bahamas and the Caribbean.
Financial Highlights In millions, except per share amounts and market price 2012 2011
Operating revenues $ 3,922 $ 2,338
Net income attributable to AGL Resources Inc. $ 271 $ 172
Earnings per common share attributable to AGL Resources Inc. common shareholders Basic $ 2.32 $ 2.14 Diluted $ 2.31 $ 2.12
Dividends declared per common share $ 1.74 $ 1.90
Market capitalization (year-end) $ 4,711 $ 4,946
Market price (year-end, closing) $ 39.97 $ 42.26
Total assets $ 14,141 $ 13,913
Total shareholder return (1%) 24%
Adjusted Diluted Earnings per share
Indicated Annual Dividend per share
0.0
0.5
1.0
1.5
2.0
2008 2009 20101 20111 20121
$2.84 $2.88 $3.05 $2.92 $2.46
2008 2009 2010 20111 20121
$1.68 $1.72 $1.76 $1.80 $1.84
(1) For a reconciliation of adjusted EPS (which excludes costs related to the Nicor merger and additional accrual for the Nicor Gas PBR issue) to GAAP EPS, see our non-GAAP reconciliation section included within this report.
(1) Indicated 2011 and 2012 dividend rate. As a result of the Nicor merger, AGL Resources shareholders of record as of the close of business on December 8, 2011, received a pro rata dividend of $.0.0989 for the stub period accruing from November 19, 2011 for a total dividend of $1.90. This same $0.0989 would have been added to the $1.74 dividends paid in 2012 if it were not for the Nicor merger.
0.0
0.5
1.0
1.5
2.0
2008 2009 20101 20111 20121
$2.84 $2.88 $3.05 $2.92 $2.46
2008 2009 2010 20111 20121
$1.68 $1.72 $1.76 $1.80 $1.84
PRINCIPAL AREAS OF BUSINESS FOR RETAIL OPERATIONSNATURAL GAS STORAGE FACILITIESNATURAL GAS STORAGE FACILITIESCARGO SHIPPINGCARGO SHIPPINGCORPORATE HEADQUARTERSCORPORATE HEADQUARTERS
PRINCIPAL AREAS OF BUSINESS FOR RETAIL OPERATIONS
SERVICE TERRITORY FOR UTILITIESSERVICE TERRITORY FOR UTILITIES
Comparison of Five-Year Cumulative Total Return*
The following graph compares the cumulative five-year total return provided shareholders on AGL Resources Inc’s common stock relative to the cumulative total returns of the S&P 500 index, and a customized peer group of twelve companies listed in footnote 1 below. An investment of $100 (with reinvestment of all dividends) is assumed to have been made in our common stock, in the peer group, and the index on 12/31/2007 and its relative performance is tracked through 12/31/2012.
1 There are twelve companies included in the customized peer group which are: Atmos Energy
Corp., Centerpoint Energy Inc., Integrys Energy Group Inc., New Jersey Resources Corp.,
NiSource Inc., Oneok Inc., Piedmont Natural Gas Company Inc., Sempra Energy, Southwest
Gas Corp., UGI Corp., Vectren Corp. and WGL Holdings Inc.
Annual Meeting
The 2013 annual meeting of shareholders will be held Tuesday, April 30, 2013, at AGL Resources’ corporate headquarters, Ten Peachtree Place, N.E., Atlanta, GA 30309.
ResourcesDIRECTTM
New investors may make an initial investment, and shareholders of record may acquire additional shares of our common stock, through ResourcesDIRECTTM without paying brokerage fees or service charges. Initial cash investments, quarterly cash dividends and/or optional cash purchases may be invested through the plan prospectus and enrollment materials. Contact our transfer agent at 800-468-9716 or visit our website at aglresources.com.
Holders of Common Stock, Stock Price and Dividend InformationAt January 31, 2013, there were 22,221 record holders of our common stock. Quarterly information concerning our high and low stock prices and cash dividends paid in 2012 and 2011 is as follows:
2012 Sales price of common stock Cash dividend per
Quarter ended High Low Close common share
March 31, 20121 $42.88 $38.42 $39.22 $0.36June 30, 2012 40.29 36.59 38.75 0.46September 30, 2012 41.95 38.45 40.91 0.46December 31, 2012 41.71 36.90 39.97 0.46 $1.74
2011 Sales price of common stock Cash dividend per
Quarter ended High Low Close common share
March 31, 2011 $39.91 $35.65 $39.84 $0.45June 30, 2011 42.34 38.58 40.71 0.45September 30, 2011 42.40 34.08 40.74 0.45December 31, 20111 43.69 37.95 42.26 0.55 $1.90
1 As a result of the Nicor merger, AGL Resources shareholders of record as
of the close of business on December 8, 2011, received a pro rata dividend
of $0.0989 for the stub period, accruing from November 19, 2011, which
increased the fourth quarter 2011 dividend and reduced the first quarter 2012
dividend by an equal amount. For presentation purposes the amount in the
table was rounded to $0.10.
We have historically paid dividends to common shareholders four times a year: March 1, June 1, September 1 and December 1. We have paid 261 consecutive quarterly dividends beginning in 1948. Our common shareholders may receive dividends when declared at the discretion of our Board of Directors, and payment of future dividends will depend on our future earnings, cash flow, financial requirements and other factors. In February 2013, we increased our quarterly dividend to $0.47 per share.
0
20
40
60
80
100
120
140
160
0
20
40
60
80
100
120
140
160
12/07 12/08 12/09 12/10 12/11 12/12
AGL ResourcesS&P 500Peer Group
12/07 12/08 12/09 12/10 12/11 12/12
AGL Resources Inc 100.00 87.59 107.40 110.62 136.73 135.22S&P 500© 100.00 63.00 79.67 91.67 93.61 108.59Peer Group 100.00 79.80 99.17 111.88 139.15 152.08
* $100 invested on 12/31/07 in stock or index, including reinvestment of dividends.
Fiscal year ending December 31.
Copyright© 2013 S&P, a division of The McGraw-Hill Companies Inc. All rights reserved.
The stock price performance included in this graph is not necessarily indicative of future stock price performance.
Stock Exchange Listing
Our common stock is traded on the New York Stock Exchange under the symbol “GAS” and quoted in The Wall Street Journal as “AGL Res.”
Corporate Overview
PRELIMINARY PUBLIC COPY
2012 Annual Report 1
Much of our focus in 2012 was on the integration of the recently acquired Nicor business into the AGL Resources portfolio of companies. We made excellent progress and achieved significant cost savings by deploying our shared services model across a broader customer base. While the integration is largely complete from a functional perspective, we will continue to leverage our scale and experience to offer new services to our customers and create value for our shareholders.
FINANCIAL RESULTSOur 2012 diluted GAAP earnings per share (EPS) were $2.31, compared to diluted GAAP EPS of $2.12 in 2011. Excluding expenses related to the Nicor merger, adjusted diluted EPS was $2.46 for 2012 compared to $2.92 for same the period in 2011. Our board of directors approved a 2% increase in the company’s dividend, putting us on track for an indicated annual dividend rate of $1.88 per share for 2013. We expect to main-tain our policy of increasing dividends and maintaining a payout ratio similar to our industry peers.
During the year, we continued to focus on maintaining strong, investment-grade credit ratings and a solid balance sheet. We deployed more than $780 million of capital investments throughout the year, with about 85% related to investment in our regulated utility business. More than 40% of our total utility capital expenditures were invested in support of our regulatory infrastructure programs, significantly minimizing the time between investment and regulatory recovery of those expenditures.
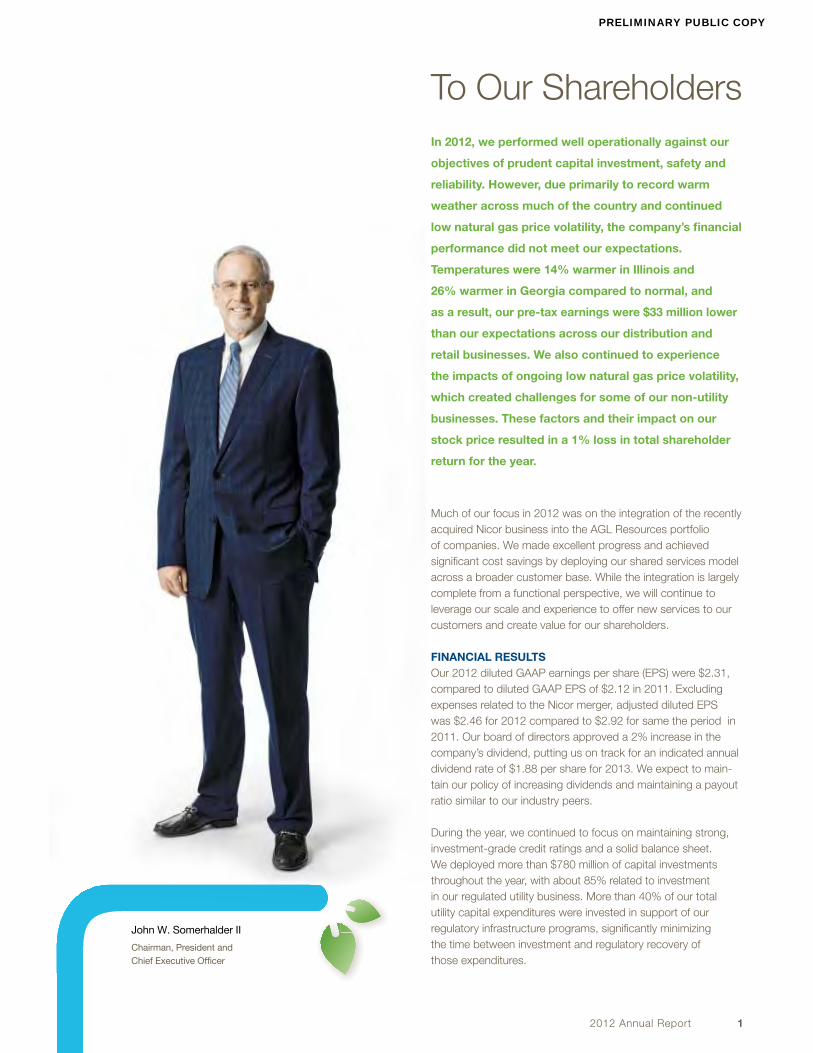
John W. Somerhalder II
Chairman, President and Chief Executive Officer
In 2012, we performed well operationally against our
objectives of prudent capital investment, safety and
reliability. However, due primarily to record warm
weather across much of the country and continued
low natural gas price volatility, the company’s financial
performance did not meet our expectations.
Temperatures were 14% warmer in Illinois and
26% warmer in Georgia compared to normal, and
as a result, our pre-tax earnings were $33 million lower
than our expectations across our distribution and
retail businesses. We also continued to experience
the impacts of ongoing low natural gas price volatility,
which created challenges for some of our non-utility
businesses. These factors and their impact on our
stock price resulted in a 1% loss in total shareholder
return for the year.
To Our Shareholders
PRELIMINARY PUBLIC COPY

2 AGL Resources Inc.
SIGNIFICANT ACHIEVEMENTSDISTRIBUTION OPERATIONSIn our distribution operations segment, which operates seven natural gas utilities in seven states, we continue to focus on being a leader with regard to pipeline safety, maintenance and system enhancements. During 2012, we replaced more than 280 miles of aging pipeline infrastructure across our footprint. The proper maintenance and operation of our distribution system is paramount to the health of our company, and we will continue to invest in these areas.
For example, in 2012 our Virginia Natural Gas utility received approval for an accelerated infrastructure replacement program. The five-year program will enable us to spend up to $105 million on system enhancements. We also have filed the Integrated Vintage Plastic Replacement Program, a new program under Atlanta Gas Light’s Strategic Infrastructure Development and Enhancement (STRIDE) program. This new program would replace aging plastic pipe with proposed capital investment of $275 million over the next three to four years. We anticipate receiving a ruling from the Georgia Public Service Commission in mid-2013.
We also achieved success in extending our system and promoting the use of natural gas in several new communities, particularly in Florida and Virginia. Natural gas prices have remained low for several years and, with the addition of domestically produced shale gas, we can expect abundant supplies in the years to come. As a result, current natural gas prices compare very favorably to other energy sources such as electricity and heating oil. These fundamentals work to our advantage as we work to attract new customers and retain existing customers.
We managed an excellent recovery effort in the wake of Superstorm Sandy. On our system in New Jersey, we performed more than 8,000 meter assessments, and we replaced or restored nearly 1,500 meters system-wide. Further, we deployed nearly 60 employees for mutual aid to support neighboring utilities in their restoration efforts.
We continue to promote the use of alternative fuels, such as compressed natural gas (CNG), across our service territories. In 2012, Atlanta Gas Light executed agreements with the City of Atlanta and three commercial operators to open five new CNG fueling stations throughout Georgia. We remain committed to the deployment of new technologies that promote the use of a clean-burning, abundant domestic resource across our service territories, and we will look to partner with a variety of constituencies in our communities to achieve these goals.
RETAIL OPERATIONSOur retail businesses continued their solid, stable performance in 2012. At SouthStar, which primarily serves customers in Georgia, we remain the market share leader, a position we have held since the natural gas market deregulated over a decade ago. With Georgia experiencing the warmest weather on record
in 2012, we successfully utilized a variety of asset management tools to offset lower customer usage and to optimize the commercial value of our storage and transportation assets.
We also focused efforts on integrating Nicor’s retail services businesses in 2012. The stage is set to roll out many of the warranty and protection products across the legacy AGL Resources footprint in 2013. Further, in early 2013 we acquired the resource services business previously owned by NiSource. This business provides home warranty solutions such as appliance repair and line protection services and complements our existing retail services business. We viewed this as an opportunity to essentially double the size of that business and to gain scale in a cost effective manner. We expect the transaction to be accretive to earnings in 2013.
WHOLESALE SERVICESOur wholesale services business remained challenged in 2012 on a GAAP-reported earnings basis, due primarily to low natural gas price volatility. However, the wholesale business created economic value in 2012 that we expect to realize in 2013. The business continues to be extremely important in managing many of our utility assets and has returned more than $200 million to customers under our asset management agreements over the last decade. We have structured our wholesale business as a low-risk energy marketer focused on serving our affiliate utilities, other utility companies, power gen-erators and producers. Though the wholesale services business is delivering lower earnings, consistent with our expectations in a low volatility environment, it provides us an option on higher earnings under improving wholesale market conditions and periods of greater volatility.
MIDSTREAM OPERATIONSWe completed construction of two natural gas storage facilities in 2012 – Central Valley Gas Storage and the second cavern of our Golden Triangle Storage facility. Our construction of new facilities is now complete and we anticipate capital expenditures related to the storage business to decrease in 2013 and the coming years. Our midstream operations business remains challenged due to low natural gas price volatility and narrow seasonal storage spreads, the same general factors that also
At AGL Resources, we are working hard to deliver natural gas to our customers whether for home use, business, industrial applications or clean-burning natural gas vehicles.
PRELIMINARY PUBLIC COPY

2012 Annual Report 3
have impacted our wholesale services business. Overall the market for storage remains weak, but we continue to focus on ways to optimize the value of our available capacity while not committing to long-term contracts at historically low prices. We remain optimistic that the market for storage will recover long-term as natural gas supply growth moderates and demand continues to grow resulting in a more balanced market.
CARGO SHIPPINGWe acquired our cargo shipping business as part of our acquisition of Nicor. Tropical Shipping has provided containerized cargo transportation services in the Bahamas and Caribbean regions for 50 years. Although this business has been challenged recently by the weak economic conditions that have persisted in those regions, we saw some modest improvement in 2012. Market share and vessel utilization have shown signs of improvement, and we will continue to focus our efforts in 2013 on improving the overall profitability of this business segment.
NATURAL GAS MARKET FUNDAMENTALSProduction of domestic natural gas from shale formations has increased from just under 2 trillion cubic feet (Tcf) in 2007 to almost 9 Tcf today. This bodes well for our industry and for low natural gas prices in the years to come. Currently, natural gas supplies nearly one-fourth of all energy used in the United States and that amount should increase in the future, thanks to natural gas being a low-cost, low-carbon fuel. In fact, consumption of natural gas is expected to increase 11% by 2030, according to the U.S. Department of Energy.
At AGL Resources, we are working hard to deliver natural gas to our customers whether for home use, business, industrial applications or clean-burning natural gas vehicles. Our regulated utilities serve 4.5 million customers and we operate 80,000 miles of distribution pipeline across seven states. Our retail, wholesale and midstream businesses round out our robust portfolio of natural gas assets, which can effectively meet the needs of a wide range of customers. We remain well-positioned to take advantage of our country’s increasing reliance on natural gas.
PRIORITIES FOR 2013Our overall business strategy for 2013 is consistent with the direction we have taken the company over the past decade. We will remain focused on efficient operations across all of our businesses, including offsetting natural inflationary pressures by spreading costs across a broader customer base and sizing our operations to properly reflect market challenges. Several of our specific business objectives are detailed as follows:
• Distribution operations: Invest necessary capital to enhance and maintain safety and reliability; remain a low-cost leader within the industry; opportunistically expand system and capitalize on potential customer conversions.
• Retail operations: Maintain margins in Georgia and Illinois while continuing to expand into other profitable retail markets; integrate our new retail services business and expand our overall market reach.
• Wholesale services: Maximize strong storage and transportation rollout value created in 2012; effectively perform on existing asset management agreements and expand customer base; bring cost structure in line with market fundamentals.
• Midstream operations: Optimize storage portfolio, including expiring contracts; pursue land-based LNG transportation opportunities.
• Cargo Shipping: Increase vessel utilization and improve margin per Twenty-foot Equivalent Unit; prudently deploy capital investment and diligently manage operating costs.
We provided 2013 earnings guidance in the range of $2.50 to $2.70 per diluted share, and an additional range of $2.40 to $2.50 per diluted share, excluding our wholesale services segment. Our wholesale services business often creates some volatility in our earnings due to the accounting and timing mismatch between when economic earnings are generated and GAAP earnings reported. We believe this more granular measure should allow our investors to better track our business performance as we progress through the year without this quarterly volatility clouding our results.
On behalf of the more than 6,000 employees of AGL Re-sources, we thank you for your investment in our company. We remain focused on creating value for our shareholders and building on our solid foundation as one of the nation’s leading natural gas providers.
Sincerely,
John W. Somerhalder II Chairman, President and Chief Executive Officer February 28, 2013
We provided 2013 earnings guidance in the range of $2.50 to We provided 2013 earnings guidance in the range of $2.50 to
We will remain focused on efficient operations across all of our businesses, including offsetting natural inflationary pressures by spreading costs across a broader customer base and sizing our operations to properly reflect market challenges.
PRELIMINARY PUBLIC COPY

Board of Directors
John W. Somerhalder II Chairman, President and Chief Executive Officer
Andrew W. Evans Executive Vice President and Chief Financial Officer
Henry P. Linginfelter Executive Vice President, Distribution Operations
* Committee Chair
1 Audit
2 Compensation and Management Development
3 Executive
4 Finance and Risk Management
5 Nominating, Governance and Corporate Responsibility
Sandra N. Bane 1,2
Retired Audit Partner, KPMG, LLPDirector since 2008
Thomas D. Bell, Jr. 2,4
Chairman of Mesa Capital Partners, LLCDirector since 2004
Norman R. Bobins 1,2
President and CEO of Norman Bobins Consulting, LLCDirector since 2011
Charles R. Crisp 2,4
Retired CEO and Director of Coral Energy, a subsidiary of Shell Oil CompanyDirector since 2003
Brenda J. Gaines 1,5
Retired President and CEO of Diners Club North America, a division of Citigroup Director since 2011
Arthur E. Johnson 3*,4,5
Lead Director of the Board of Directors of AGL Resources and Retired Senior Vice President, Lockheed Martin CorporationDirector since 2002
Wyck A. Knox, Jr. 1,5
Retired Partner in, Kilpatrick, Townsend & Stockton, LLP Director since 1998
Dennis M. Love 1,3,5*
President and CEO, Printpack, Inc.Director since 1999
Charles H. “Pete” McTier 1,5
Retired President of the Robert W. Woodruff Foundation, the Joseph B. Whitehead Foundation, the Lettie Pate Evans Foundation and the Lettie Pate Whitehead FoundationDirector since 2006
Dean R. O’Hare 1,5
Retired Chairman and Chief Executive Officer, The Chubb CorporationDirector since 2005
Armando J. Olivera 2,4
Retired President and CEO of Florida Power & Light CompanyDirector since 2011
John E. Rau 3,4,5
President and CEO of Miami CorporationDirector since 2011
James A. Rubright 2,3,4*
Chairman and CEO, RockTenn CompanyDirector since 2001
John W. Somerhalder II 3,4
Chairman, President and Chief Executive OfficerDirector since 2006
Bettina M. Whyte 2*,3,4
Managing Director and Senior Advisor, Alvarez & Marsal Holdings, LLCDirector since 2004
Henry C. Wolf 1*,2,3
Retired Vice Chairman and Chief Financial Officer of Norfolk Southern CorporationDirector since 2004
Corporate HeadquartersAGL Resources Inc., Ten Peachtree Place, N.E., Atlanta, GA 30309; 404-584-4000; website: aglresources.com.
Stock Exchange ListingOur common stock is traded on the New York Stock Exchange under the symbol “GAS” and quoted in The Wall Street Journal as “AGL Res.”
Transfer Agent and RegistrarWells Fargo serves as our transfer agent and registrar and can help with a variety of stock-related matters, including name and address changes; transfer of stock ownership; lost certificates; and Form 1099s.
Inquiries may be directed to: Wells Fargo Shareowner Services, P.O. Box 64874, St. Paul, MN 55164-0874; toll-free 800-468-9716; website: wellsfargo.com/shareownerservices.
Available InformatiomA copy of this Annual Report, as well as our Annual Report on Form 10-K, Quarterly Reports on Form 10-Q, Current Reports on Form 8-K, other reports that we file with or furnish to the Securities and Exchange Commission (SEC) and our recent news releases are available free of charge at our website, aglresources.com, as soon as reasonably practicable. The information contained on our website should not be considered part of this document and is not incorporated by reference.
Our Annual Report on Form 10-K includes the certifications of our chief executive officer and chief financial officer required by Sections 302 and 906 of the Sarbanes-Oxley Act of 2002. Additionally, we have filed the most recent annual CEO certification as required by Section 303A. 12(a) of the New York Stock Exchange Listed Company Manual pursuant to which our CEO certified to the NYSE that he was not aware of any violation by AGL Resources of the NYSE’s corporate governance listing standards.
Our corporate governance guidelines; our code of ethics for the CEO and senior financial officers; our code of conduct and ethics; and the charters of our Board committees also are available on our website.
The above information and any exhibit to our 2012 Form 10-K also will be furnished free of charge upon written request to our Investor Relations department at: Sarah Stashak, Director, Investor Relations, AGL Resources, Ten Peachtree Place, N.E., Atlanta, GA 30309; 404-584-4000; [email protected].
Institutional Investor InquiriesInstitutional investors and securities analysts should direct inquiries to: Sarah Stashak, Director, Investor Relations, AGL Resources, Ten Peachtree Place, N.E., Atlanta, GA 30309; 404-584-4000; [email protected].
GAAP ReconciliationYear Ended
December 31, 2012 2011 2010 Diluted earnings per share - as reported $2.31 $2.12 $3.00 Additional accrual for Nicor Gas PBR issue 0.04 0.00 0.00 Transaction costs of Nicor merger 0.11 0.80 0.05
Diluted earnings per share - as adjusted $2.46 $2.92 $3.05
Paul R. Shlanta Executive Vice President, General Counsel and Chief Ethics and Compliance Officer
Peter I. Tumminello Executive Vice President, Wholesale Services, and President, Sequent Energy Management
Melanie M. Platt Executive Vice President, Chief People Officer and President, AGL Resources Foundation
Shareholder Information
Executive Officers
4 AGL Resources Inc.
PRELIMINARY PUBLIC COPY

Georgia 58-2210952
5 AGL ResouRces inc. 2012 AnnuAl report
PRELIMINARY PUBLIC COPY
6
Forward-Looking Statements
76
PRELIMINARY PUBLIC COPY

6
Forward-Looking Statements
7
7 AGL ResouRces inc. 2012 AnnuAl report6
PRELIMINARY PUBLIC COPY

8
98
PRELIMINARY PUBLIC COPY

9
Our operating segments consist of the following five operating and reporting segments - distribution operations, retail operations, wholesale services, midstream operations, cargo shipping and one non-operating segment - other. These segments are consistent with how management views and manages our businesses. For additional information on our
to our consolidated financial statements under Item 8 herein.
Merger with Nicor
On December 9, 2011, we closed our merger with Nicor and created a combined company with increased scale and scope in the distribution, storage and transportation of natural gas. As a result, we are currently natural gas distribution company based on customer count. condition are reflected for the twelve months ended December 31, 2012, while our 2011 results include activity from December 10, 2011 through December 31, 2011. See Note 3 to our consolidated financial statements under Item 8 herein for more information on the impacts of the Nicor merger on our business.
Distribution Operations
Our distribution operations segment is the largest component of our business and includes seven natural gas local distribution utilities. These utilities construct, manage and maintain intrastate natural gas pipelines and distribution facilities and include:
Utility State Number of customers
(in thousands) Approximate miles of pipe
Nicor Gas Illinois 2,188 34,000 Atlanta Gas Light Georgia 1,541 32,300 Virginia Natural Gas Virginia 281 5,500 Elizabethtown Gas New Jersey 277 3,150 Florida City Gas Florida 104 3,450 Chattanooga Gas Tennessee 62 1,600 Elkton Gas Maryland 6 100
Total 4,459 80,100
Our primary focus in our distribution operations business is the safe and reliable delivery of natural gas to our end-users. In integrating Nicor Gas into our existing distribution operations, we focused on the standardization of operational processes and continue to focus on delivering superior customer service.
We experienced a 0.1% increase in our total number of customers in 2012, consistent with the 0.1% increase in 2011, excluding Nicor Gas. The customer count of Nicor Gas remained flat in 2012, compared to the year ended 2011. We anticipate customer growth trends to improve slightly in 2013 compared to 2012.
Competition and Customer Demand
All of our utilities face competition from other energy products. Our principal competitors are electric utilities and oil and propane providers serving the residential and commercial markets throughout our service areas. Additionally, the potential displacement or replacement of natural gas appliances with electric appliances is a competitive factor.
Competition for space heating and general household and small commercial energy needs generally occurs at the initial installation phase when the customer or builder makes decisions as to which types of equipment to install. Customers generally continue to use the chosen energy source for the life of the equipment. Customer demand for natural gas could be affected by numerous factors, including:
changes in the availability or price of natural gas and other forms of energy; general economic conditions; energy conservation; legislation and regulations; the capability to convert from natural gas to alternative fuels; weather; new commercial construction; and new housing starts.
We continue to develop and grow our business through our use of a variety of targeted marketing programs designed to attract new customers and to retain existing customers. These efforts include working to add residential customers, multifamily complexes and commercial customers who use natural gas for purposes other than space heating, as well as evaluating and launching new natural gas related programs, products and services to enhance customer growth, mitigate customer attrition and increase operating revenues.
9 AGL ResouRces inc. 2012 AnnuAl report8
PRELIMINARY PUBLIC COPY

10
Sources of Natural Gas Supply
Transportation
Supply
1110
PRELIMINARY PUBLIC COPY

11
has made sharing payments under these agreements totaling $207 million. The following table provides payments made by Sequent to our utilities under these agreements during the last three years.
Total amount received In millions 2012 2011 2010 Expiration Date Atlanta Gas Light $5 $9 $4 March 2017 Virginia Natural Gas 3 9 5 March 2016 Elizabethtown Gas 5 9 10 March 2014 Florida City Gas 1 2 1 March 2014 Chattanooga Gas 1 3 4 March 2014
Total $15 $32 $24
In March 2012, the Georgia Commission authorized the renewal of the asset management agreement between Atlanta Gas Light and Sequent. The renewed five-year agreement requires Sequent to pay minimum annual fees of $3 million and includes a slight increase in sharing levels associated with storage inventory activity.
Nicor Gas is our only utility that has not entered into an affiliated asset management agreement with Sequent. Accordingly, it purchases its gas supply under firm contracts from a number of different suppliers, typically using the North American Energy Standards Board standard contract. The transactions conducted under the contracts include firm base load supplies, firm daily swing supplies and spot market purchases. The agreements often include some form of index pricing, but purchases may also be made using negotiated pricing. A majority of the purchases specify the pipeline receipt point associated with capacity held by Nicor Gas, but some purchases are made on a city-gate delivered basis.
Utility Regulation and Rate Design
Rate Structures Our utilities operate subject to regulations and oversight of the state regulatory agencies in each of the states served by our utilities with respect to rates charged to our customers, maintenance of accounting records and various service and safety matters. Rates charged to our customers vary according to customer class (residential, commercial or industrial) and rate jurisdiction. These agencies approve rates designed to provide us the opportunity to generate revenues to recover all prudently incurred costs, including a return on rate base sufficient to pay interest on debt and provide a reasonable return for our shareholders. Rate base generally consists of the original cost of the utility plant in service, working capital and certain other assets, less accumulated depreciation on the utility plant in service and net deferred income tax liabilities, and may include certain other additions or deductions.
The natural gas market for Atlanta Gas Light was deregulated in 1997. Accordingly, Marketers, rather than a traditional utility, sell natural gas to end-use customers in Georgia and handle customer billing functions. The Marketers file their rates monthly with the Georgia Commission. As a result of operating in a deregulated environment, Atlanta Gas Light's role includes:
distributing natural gas for Marketers; constructing, operating and maintaining the gas system infrastructure, including responding to customer service
calls and leaks; reading meters and maintaining underlying customer premise information for Marketers; and planning and contracting for capacity on interstate transportation and storage systems.
Atlanta Gas Light earns revenue by charging rates to its customers based primarily on monthly fixed charges that are periodically adjusted. The Marketers add these fixed charges to customer bills. This mechanism, called a straight-fixed-variable rate design, volumetric or directly weather dependent.
With the exception of Atlanta Gas Light, the earnings of our regulated utilities can be affected by customer consumption patterns that are a function of weather conditions and price levels for natural gas. Specifically, customer demand substantially increases during the Heating Season when natural gas is used for heating purposes. We have various mechanisms, such as weather normalization at some of our utilities, which limit our exposure to weather changes within typical ranges in these
All of our utilities, excluding Atlanta Gas Light, are authorized to use natural gas cost recovery mechanisms that allow them to adjust their rates to reflect changes in the wholesale cost of natural gas and to ensure they recover all of the costs prudently incurred in purchasing gas for their customers. Since Atlanta Gas Light does not sell natural gas directly to its end-use customers, it does not need or utilize a natural gas cost recovery mechanism. However, Atlanta Gas Light does maintain inventory for the Marketers in Georgia and recovers the cost of this gas through recovery mechanisms approved by the Georgia Commission. In addition to natural gas recovery mechanisms, we have other cost recovery mechanisms, such as regulatory riders, which vary by utility but allow us to recover certain costs, such as those related to environmental remediation and energy efficiency plans.
11 AGL ResouRces inc. 2012 AnnuAl report10
PRELIMINARY PUBLIC COPY

12
Nicor Gas
Virginia Natural Gas
13
Environmental Remediation Costs
Capital Projects
Dollars in millions
Atlanta Gas Light
Virginia Natural Gas
1312
PRELIMINARY PUBLIC COPY

13
Environmental Remediation Costs
Capital Projects
Dollars in millions
Atlanta Gas Light
Virginia Natural Gas
13 AGL ResouRces inc. 2012 AnnuAl report12
PRELIMINARY PUBLIC COPY

14
Elizabethtown Gas
1514
PRELIMINARY PUBLIC COPY

15
Competition
Competition
Asset Management Transactions
15 AGL ResouRces inc. 2012 AnnuAl report14
PRELIMINARY PUBLIC COPY

16
Transportation Transactions
Park and Loan Transactions
Natural Gas Storage Inventory and Transactions
Natural Gas Price Volatility and Energy Marketing Activities
1716
PRELIMINARY PUBLIC COPY

17
(in millions)
17 AGL ResouRces inc. 2012 AnnuAl report16
PRELIMINARY PUBLIC COPY

18
In Bcf
Jefferson Island
Golden Triangle Storage
Central Valley
Magnolia
Horizon Pipeline
Competition
1918
PRELIMINARY PUBLIC COPY

19
Competition
Operations
19 AGL ResouRces inc. 2012 AnnuAl report18
PRELIMINARY PUBLIC COPY

20
2120
PRELIMINARY PUBLIC COPY

21
21 AGL ResouRces inc. 2012 AnnuAl report20
PRELIMINARY PUBLIC COPY

22
We may be exposed to certain regulatory and financial risks related to climate change and associated legislation and regulation.
Climate change is expected to receive increasing attention from the current federal administration, non-governmental organizations and legislators. Debate continues as to the extent to which our climate is changing, the potential causes of any change and its potential impacts. Some attribute global warming to increased levels of greenhouse gases, including carbon dioxide, which has led to significant legislative and regulatory efforts to limit greenhouse gas emissions.
Presently, there are no federally mandated greenhouse gas reduction requirements that directly affect our operations. However, there is the possibility of new legislative and regulatory proposals to address greenhouse gas emissions, which are in various phases of discussion or implementation. Absent new enabling legislation, in 2012 the United States Environmental Protection Agency has begun using provisions of the 1990 Clean Air Act Amendments to treat carbon dioxide as a pollutant to regulate existing sources of emissions, such as automobiles. Enhanced reporting and categorization of sources is now in place, but additional and potentially costly controls are currently not required in our operations.
The outcome of additional federal and state actions to address climate change could potentially result in new regulations, additional charges to fund energy efficiency activities or other regulatory actions, which in turn could:
result in increased costs associated with our operations, increase other costs to our business, affect the demand for natural gas (positively or negatively), and impact the prices we charge our customers.
Because natural gas is a fossil fuel with low carbon content, it is likely that future carbon constraints will create additional demand for natural gas, both for production of electricity and direct use in homes and businesses. The impact is already being seen in the power production sector due to both environmental regulations and low natural gas costs.
Any adoption by federal or state governments mandating a substantial reduction in greenhouse gas emissions could have far-reaching and significant impacts on the energy industry. We cannot predict the potential impact of such laws or regulations on our future consolidated financial condition, results of operations or cash flows.
Transporting and storing natural gas involves numerous risks that may result in accidents and other operating risks and costs.
Our gas distribution and storage activities involve a variety of inherent hazards and operating risks, such as leaks, accidents, including third party damages, and mechanical problems, which could cause substantial financial losses. In addition, these risks could result in serious injury to employees and non-employees, loss of human life, significant damage to property, environmental pollution and impairment of our operations, which in turn could lead to substantial losses to us. In accordance with customary industry practice, we maintain insurance against some, but not all, of these risks and losses. The location of pipelines and storage facilities near populated areas, including residential areas, commercial business centers and industrial sites, could increase the level of damages resulting from these risks. The occurrence of any of these events not fully covered by insurance could adversely affect our financial position and results of operations.
We face increasing competition, and if we are unable to compete effectively, our revenues, operating results and financial condition will be adversely affected, which may limit our ability to grow our business.
The natural gas business is highly competitive, increasingly complex, and we are facing increasing competition from other companies that supply energy, including electric companies, oil and propane providers and, in some cases, energy marketing and trading companies. In particular, the success of our retail businesses is affected by competition from other energy marketers providing retail natural gas services in our service territories, most notably in Illinois and Georgia. Natural gas competes with other forms of energy. The primary competitive factor is price. Changes in the price or availability of natural gas relative to other forms of energy and the ability of end-users to convert to alternative fuels affect the demand for natural gas. In the case of commercial, industrial and agricultural customers, adverse economic conditions, including higher natural gas costs, could also cause these customers to bypass or disconnect from our systems in favor of special competitive contracts with lower per-unit costs.
Our retail energy business markets fixed-price and fixed-bill contracts that protect customers against higher natural gas prices, or protect customers against both higher natural gas prices and colder weather. The sale of these fixed-price contracts may be adversely affected if natural gas prices are, or are perceived to be, low and stable.
Our retail services business faces risks in the form of price, convenience and service competition from other warranty and HVAC companies. Retail services also bears risk from potential changes in the regulatory environment, and in fact regulatory-change risk was incurred in late 2011. As a condition of the merger, Nicor Gas is no longer permitted to use its
offered by Nicor Services.
2322
PRELIMINARY PUBLIC COPY

23
23 AGL ResouRces inc. 2012 AnnuAl report22
PRELIMINARY PUBLIC COPY

24
2524
PRELIMINARY PUBLIC COPY

25
.
25 AGL ResouRces inc. 2012 AnnuAl report24
PRELIMINARY PUBLIC COPY

26 27
.
2726
PRELIMINARY PUBLIC COPY

27
.
27 AGL ResouRces inc. 2012 AnnuAl report26
PRELIMINARY PUBLIC COPY

28
We could be adversely affected by violations of the Foreign Corrupt Practices Act and similar worldwide anti-bribery laws.
Our international operations require us to comply with a number of U.S. and international laws and regulations, including those involving anti-bribery and anti-corruption. The Foreign Corrupt Practices Act (FCPA) generally prohibits United States companies and their intermediaries from making improper payments to foreign officials for the purpose of obtaining or maintaining business or obtaining an improper business benefit. Although our policies require compliance with these laws, we may be held liable for actions taken by our strategic or local partners in foreign jurisdictions, even though these partners may not be subject to the FCPA. Violations of these laws, or allegations of such violations, could disrupt our business and result in a material adverse effect on our business and results of operations, cash flows and financial condition.
We may pursue acquisitions, divestitures and other strategic transactions, the success of which may impact our results of operations, cash flows and financial condition.
In the past, we have pursued acquisitions to complement or expand our business, divestures and other strategic transactions. Such future transactions are part of our general strategic objectives and may occur. If we identify an acquisition candidate, we may not be able to successfully negotiate or finance the acquisition or integrate the acquired businesses with our existing business and services. Future acquisitions could result in potentially dilutive issuances of equity securities and the incurrence of debt and contingent liabilities, amortization expenses and substantial goodwill. We may be affected materially and adversely if we are unable to successfully integrate businesses that we acquire. Similarly, we may divest portions of our business, which may also have material and adverse effects.
Risks Related to Our Corporate and Financial Structure
We depend on our ability to successfully access the capital and financial markets. Any inability to access the capital or financial markets may limit our ability to execute our business plan or pursue improvements that we may rely on for future growth.
We rely on access to both short-term money markets (in the form of commercial paper and lines of credit) and long-term capital markets as a source of liquidity for capital and operating requirements not satisfied by the cash flow from our operations. If we are not able to access financial markets at competitive rates, our ability to implement our business plan and strategy will be negatively affected, and we may be forced to postpone, modify or cancel capital projects. Certain market disruptions may increase our cost of borrowing or affect our ability to access one or more financial markets. Such market disruptions could result from:
adverse economic conditions adverse general capital market conditions poor performance and health of the utility industry in general bankruptcy or financial distress of unrelated energy companies or Marketers significant decrease in the demand for natural gas adverse regulatory actions that affect our local gas distribution companies and our natural gas storage business terrorist attacks on our facilities or our suppliers or extreme weather conditions.
The amount of our working capital requirements in the near-term will primarily depend on the market price of natural gas and weather. Higher natural gas prices may adversely impact our accounts receivable collections and may require us to increase borrowings under our credit facilities to fund our operations.
While we believe we can meet our capital requirements from our operations and our available sources of financing, we can provide no assurance that we will continue to be able to do so in the future, especially if the market price of natural gas increases significantly in the near-term. The future effects on our business, liquidity and financial results due to market disruptions could be material and adverse to us, both in the ways described above, or in ways that we do not currently anticipate.
If we breach any of the financial covenants under our various credit facilities, our debt service obligations could be accelerated.
The AGL Credit Facility and the Nicor Gas Credit Facility contain financial covenants. If we breach any of the financial covenants under these agreements, our debt repayment obligations under them could be accelerated. In such event, we may not be able to refinance or repay all of our indebtedness, which would result in a material adverse effect on our business, results of operations and financial condition.
2928
PRELIMINARY PUBLIC COPY

29
29 AGL ResouRces inc. 2012 AnnuAl report28
PRELIMINARY PUBLIC COPY

30
3130
PRELIMINARY PUBLIC COPY

31
Our indebtedness following the merger is higher than our previous indebtedness, which could limit our operations and opportunities, make it more difficult for us to pay or refinance our debts and may cause us to issue additional equity in the future, which would increase the dilution of our shareholders or reduce earnings.
of the merger consideration and transactions expenses. Our total indebtedness as of December 31, 2012 was $4.9 billion (including $1.4 billion of short-term borrowings and $3.5 billion of long-term debt and other long-term obligations).
Our debt service obligations with respect to this increased indebtedness could have an adverse impact on our earnings and cash flows (which after the merger include the earnings and cash flows of Nicor) for as long as the indebtedness is outstanding.
This increased indebtedness could also have important consequences to shareholders. For example, it could:
make it more difficult for us to pay or refinance our debts as they become due during adverse economic and industry conditions because any decrease in revenues could cause us to not have sufficient cash flows from operations to make our scheduled debt payments
limit our flexibility to pursue other strategic opportunities or react to changes in our business and the industry in which we operate and, consequently, place us at a competitive disadvantage to competitors with less debt
require a substantial portion of our cash flows from operations to be used for debt service payments, thereby reducing the availability of our cash flow to fund working capital, capital expenditures, acquisitions, dividend payments and other general corporate purposes
result in a downgrade in the credit rating of our indebtedness, which could limit our ability to borrow additional funds or increase the interest rates applicable to our indebtedness
reduce the amount of credit available to us to support hedging activities result in higher interest expense in the event of increases in interest rates since some of our borrowings are, and
will continue to be, at variable rates.
Based upon current levels of operations, we expect to be able to generate sufficient cash on a consolidated basis to make all of the principal and interest payments when such payments are due under our existing credit agreements, indentures and other instruments governing our outstanding indebtedness, and under the indebtedness of Nicor and its subsidiaries that remained outstanding after the merger; but there can be no assurance that we will be able to repay or refinance such borrowings and obligations in future periods.
We are committed to maintaining and improving our credit ratings. In order to maintain and improve these credit ratings, we may consider it appropriate to reduce the amount of indebtedness outstanding. This may be accomplished in several ways, including issuing additional shares of common stock or securities convertible into shares of common stock, reducing discretionary uses of cash or a combination of these and other measures. Issuances of additional shares of common stock or securities convertible into shares of common stock would have the effect of diluting the ownership percentage that shareholders will hold in the combined company and might reduce the reported earnings per share. The specific measures that we may ultimately decide to use to maintain or improve our credit ratings and their timing will depend upon a number of factors, including market conditions and forecasts at the time those decisions are made.
ITEM 1B. UNRESOLVED STAFF COMMENTS
We do not have any unresolved comments from the SEC staff regarding our periodic or current reports under the Securities Exchange Act of 1934, as amended.
31 AGL ResouRces inc. 2012 AnnuAl report30
PRELIMINARY PUBLIC COPY

32
3332
PRELIMINARY PUBLIC COPY

33
PART II
PURCHASES OF EQUITY SECURITIES
Holders of Common Stock, Stock Price and Dividend Information
Our common stock is listed on the New York Stock Exchange under the ticker symbol GAS. At January 31, 2013, there were 22,221 record holders of our common stock. Quarterly information concerning our high and low stock prices and cash dividends paid in 2012 and 2011 is as follows:
Sales price of common stock
Cash dividend per common
Sales price of common stock
Cash dividend per common
Quarter ended: High Low Share Quarter ended: High Low share March 31, 2012 $42.88 $38.42 $0.36 March 31, 2011 $39.91 $35.65 $0.45 June 30, 2012 40.29 36.59 0.46 June 30, 2011 42.34 38.58 0.45 September 30, 2012 41.95 38.45 0.46 September 30, 2011 42.40 34.08 0.45 December 31, 2012 41.71 36.90 0.46 December 31, 2011 (1) 43.69 37.95 0.55 $1.74 $1.90
(1) As a result of the Nicor merger, AGL Resources shareholders of record as of the close of business on December 8, 2011, received a pro rata dividend of $0.0989 for the stub period, accruing from November 19, 2011. For presentation purposes the amount in the table was rounded to $0.10.
We have historically paid dividends to common shareholders four times a year: March 1, June 1, September 1 and December 1. We have paid 260 consecutive quarterly dividends beginning in 1948. Our common shareholders may
Analysis of Financial Condition and Results of Operations - Liquidity and Capital Resources - Cash Flow from Financing Activities - and payment of future dividends will depend on our future earnings, cash flow, financial requirements and other factors, some of which are noted below. In certain cases, our ability to pay dividends to our common shareholders is limited by the following:
our ability to satisfy our obligations under certain financing agreements, including debt-to-capitalization covenants, and
our ability to satisfy our obligations to any future preferred shareholders.
Under Georgia law, the payment of cash dividends to the holders of our common stock is limited to our legally available assets and subject to the prior payment of dividends on any outstanding shares of preferred stock. Our assets are not legally available for paying cash dividends if, after payment of the dividend:
we could not pay our debts as they become due in the usual course of business, or our total assets would be less than our total liabilities plus, subject to some exceptions, any amounts necessary to
satisfy (upon dissolution) the preferential rights of shareholders whose rights are superior to those of the shareholders receiving the dividends.
Securities Authorized for Issuance Under Equity Compensation Plans
See Part III, Item --
Issuer Purchases of Equity Securities
There were no purchases of our common stock by us and any affiliated purchasers during the three months ended December 31, 2012.
ITEM 6. SELECTED FINANCIAL DATA
Selected financial data about AGL Resources for the last five years is set forth in the table below. You should read the
Material changes from 2011 to 2012 and 2010 to 2011 are primarily due to the Nicor merger which closed on December 9, 2011. See Note 3 to our consolidated financial statements under Item 8 herein for additional merger related information.
33 AGL ResouRces inc. 2012 AnnuAl report32
PRELIMINARY PUBLIC COPY

34
Dollars and shares in millions, except per share amounts
3534
PRELIMINARY PUBLIC COPY

35
ITEM 7. OPERATIONS
Executive Summary
t natural gas-only distribution company based on customer count. Our regulated utility and non-regulated businesses are summarized below:
Seven regulated natural gas distribution companies providing natural gas services to approximately 4.5 million customers in Illinois, Georgia, Virginia, New Jersey, Florida, Tennessee and Maryland
Over 1 million retail customers in our unregulated businesses Physical wholesale gas business delivering approximately 5.5 Bcf of natural gas per day Natural gas storage facilities that provided approximately 31.8 Bcf of working gas storage capacity in 2012 One of the largest containerized cargo carriers in the Caribbean and Bahamas
The following table provides certain information on our segments, which changed as a result of the Nicor merger in 2011. See Note 13 to our consolidated financial statements under Item 8 herein for additional segment information.
EBIT Assets Capital Expenditures 2012 2011 2010 2012 2011 2010 2012 2011 2010 Distribution operations 84% 92% 70% 80% 79% 73% 83% 85% 70% Retail operations 18 21 21 4 4 3 1 1 1 Wholesale services 0 1 10 9 9 18 0 0 0 Midstream operations 2 2 1 5 5 6 8 8 25 Cargo shipping 1 0 n/a 3 3 n/a 1 0 n/aOther (5) (16) (2) (1) 0 0 7 6 4
Total 100% 100% 100% 100% 100% 100% 100% 100% 100% Legislative and regulatory update We continue to actively pursue a regulatory strategy that improves customer service and reduces the lag between our investments in infrastructure and the recovery of those investments through various rate mechanisms. If our rate design proposals are not approved, we will continue to work cooperatively with our regulators, legislators and others to create a framework that is conducive to our business goals and the interests of our customers and shareholders. In 2013, we anticipate resolution of the Nicor Gas PBR issue, for which we have accrued $72 million as potential refunds to our Illinois customers. Additionally, our pipeline replacement program is expected to be completed in 2013 and we will work to successfully achieve our targets with our other regulatory infrastructure programs. We expect to spend $212 million on these regulatory infrastructure programs in 2013. For more information on our regulatory items and capital projects, see I - Utility Regulation and Rate Design
Customer growth initiatives While there has been some improvement in the economic conditions within the areas we serve, we continue to feel the effect of a weak economy. We have experienced a slight customer gain in our distribution operations segment and a slight customer loss in our retail operations segment throughout 2012. We anticipate improved customer trends in 2013 compared to our 2012 results.
We use a variety of targeted marketing programs to attract new customers and to retain existing customers. These efforts include working to add residential customers, multifamily complexes and commercial customers who use natural gas for purposes other than space heating, as well as evaluating and launching new natural gas related programs, products and services to enhance customer growth, mitigate customer attrition and increase operating revenues. These programs generally emphasize natural gas as the fuel of choice for customers and seek to expand the use of natural gas through a variety of promotional activities.
Additionally, we intend to expand our retail services business in 2013 to include our service territories in Georgia, Virginia and Tennessee. We anticipate this expansion will provide growth opportunities in 2013 and in the future.
Natural gas price volatility Volatility in the natural gas market arises from a number of factors, such as weather fluctuations or changes in supply or demand for natural gas in different regions of the country. The volatility of natural gas commodity prices has a significant impact on our customer rates, our long-term competitive position against other energy sources and the ability of our wholesale services segment to capture value from location and seasonal spreads. During 2012 and 2011, the volatility of the daily Henry Hub spot market prices for natural gas in the United States has been significantly lower than it had been in prior years. This is the result of a robust natural gas supply, the weak economy, mild weather and ample storage. Our utility natural gas acquisition strategy is designed to secure sufficient supplies of natural gas to meet the needs of our utility customers and to hedge gas prices to effectively manage costs, reduce price volatility for our utility customers and maintain a competitive advantage. Additionally, our hedging strategies and physical natural gas supplies in storage enable us to reduce earnings risk exposure due to higher gas costs.
It is possible that natural gas prices will remain low for an extended period based on current levels of excess supply relative to market demand for natural gas, in part due to abundant sources of new shale natural gas reserves and the lack
35 AGL ResouRces inc. 2012 AnnuAl report34
PRELIMINARY PUBLIC COPY
36
In millions
37
In millions
3736
PRELIMINARY PUBLIC COPY
37
In millions
37 AGL ResouRces inc. 2012 AnnuAl report36
PRELIMINARY PUBLIC COPY

38
Interest expense
In millions
Income tax expense
Operating metrics
3938
PRELIMINARY PUBLIC COPY
39
39 AGL ResouRces inc. 2012 AnnuAl report38
PRELIMINARY PUBLIC COPY
40
Segment information
In millions
In millions
4140
PRELIMINARY PUBLIC COPY
41
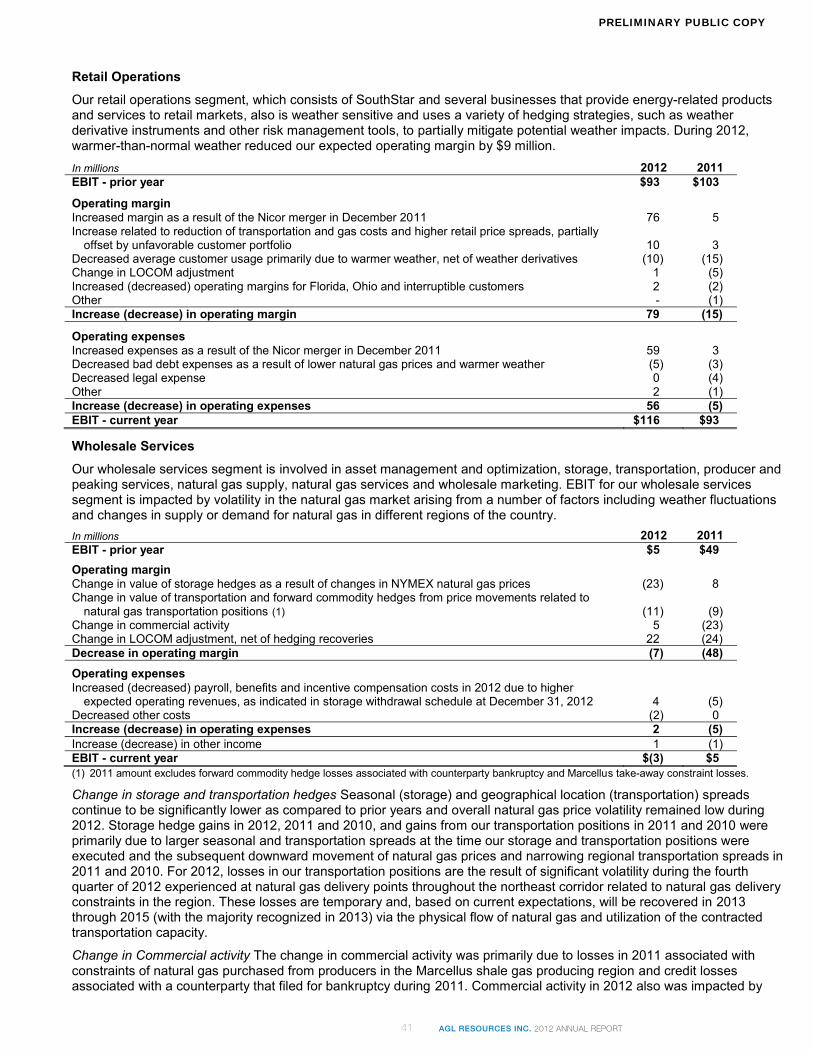
In millions
In millions
Change in storage and transportation hedges
Change in Commercial activity
41 AGL ResouRces inc. 2012 AnnuAl report40
PRELIMINARY PUBLIC COPY

42
In millions
In millions
4342
PRELIMINARY PUBLIC COPY

43
Overview
Credit Ratings
43 AGL ResouRces inc. 2012 AnnuAl report42
PRELIMINARY PUBLIC COPY

44
Default Provisions
45
December 31, 2012 2011 Short-term debt 16% 16% Long-term debt 43 43
Total debt 59 59 Equity 41 41
Total capitalization 100% 100%
Cash Flows
The following table provides a summary of our operating, investing and financing cash flows for the last three years.
In millions 2012 2011 2010 Net cash provided by (used in):
Operating activities $1,003 $451 $526 Investing activities (786) (1,339) (442) Financing activities (155) 933 (86)
Net increase (decrease) in cash and cash equivalents 62 45 (2) Cash and cash equivalent at beginning of period 69 24 26 Cash and cash equivalent at end of period $131 $69 $24
Cash Flow from Operating Activities We prepare our Consolidated Statements of Cash Flows using the indirect method. Under this method, we reconcile net income to cash flows from operating activities by adjusting net income for those items that impact net income but may not result in actual cash receipts or payments during the period. These reconciling items include depreciation and amortization, changes in derivative instrument assets and liabilities, deferred income taxes and changes in the Consolidated Statements of Financial Position for working capital from the beginning to the end of the period.
Year-over-year changes in our operating cash flows are primarily due to working capital changes within our distribution operations, retail operations and wholesale services segments resulting from the impact of weather, the price of natural gas, natural gas storage, the timing of customer collections, payments for natural gas purchases and deferred gas cost recoveries. The increase or decrease in the price of natural gas directly impacts the cost of gas stored in inventory.
2012 compared to 2011 Our increased cash from operating activities was $1,003 million, an increase of $552 million or 122% from 2011. The increase was primarily related to the recovery of working capital from the companies acquired in the December 2011 merger with Nicor. Cash provided by operations changed $89 million in derivative financial instrument assets and liabilities primarily a result of the change in forward NYMEX prices at wholesale services year-over-year and $70 million driven by a decrease in Sequent's park and loan gas transactions due to lower volumes and decreased prices.
on as a result of changes in forward NYMEX prices. These increases were partially offset by a decrease in recovery of working capital during 2012 as a result of warmer-than-normal weather. Our increased operating cash flow in 2012 was also impacted by a decrease in cash used for margin deposits of $94 million due to the change in cash collateral value on our hedged positions and a $121 million decrease in trade payables mainly due to lower natural gas prices and purchased volumes in 2012.
2011 compared to 2010 In 2011, our net cash flow provided from operating activities was $451 million, a decrease of $75 million or 14% from 2010. This decrease was primarily a result of merger-related expenses in 2011 and the payment of $22 million of Nicor deferred compensation plans and $12 million of Nicor financial advisor fees. Our gas and trade payables required $58 million more of cash compared to 2010, primarily related to our subsidiaries acquired as part of the Nicor merger. Additionally, we had a $69 million decrease in operating cash flow from loaned gas activities associated with park and loan gas transactions in part due to fewer opportunities resulting from a weakening of storage price differentials.
These decreases in our cash from operating activities were primarily due to Nicor Gas net inventory withdrawals of $89 million in the period after merger closing through December 31, 2011 and were partially offset by a $158 million increase in cash received from our inventories primarily driven by a lower average cost of gas inventory and lower volumes of gas inventory.
Cash Flow from Investing Activities The decrease in net cash used in investing activities was primarily a result of our $912 million payment for the cash portion of the purchase consideration, net of cash that was acquired in the Nicor merger in 2011. This was offset by an increase in PP&E expenditures of $355 million, the majority of which were within our distribution operations and midstream operations segments. Our estimated PP&E expenditures for 2013 and our actual PP&E expenditures incurred in 2012, 2011 and 2010 are shown within the following categories and are presented in the following table.
Distribution business - primarily includes new construction and infrastructure improvements
4544
PRELIMINARY PUBLIC COPY

45
December 31, 2012 2011 Short-term debt 16% 16% Long-term debt 43 43
Total debt 59 59 Equity 41 41
Total capitalization 100% 100%
Cash Flows
The following table provides a summary of our operating, investing and financing cash flows for the last three years.
In millions 2012 2011 2010 Net cash provided by (used in):
Operating activities $1,003 $451 $526 Investing activities (786) (1,339) (442) Financing activities (155) 933 (86)
Net increase (decrease) in cash and cash equivalents 62 45 (2) Cash and cash equivalent at beginning of period 69 24 26 Cash and cash equivalent at end of period $131 $69 $24
Cash Flow from Operating Activities We prepare our Consolidated Statements of Cash Flows using the indirect method. Under this method, we reconcile net income to cash flows from operating activities by adjusting net income for those items that impact net income but may not result in actual cash receipts or payments during the period. These reconciling items include depreciation and amortization, changes in derivative instrument assets and liabilities, deferred income taxes and changes in the Consolidated Statements of Financial Position for working capital from the beginning to the end of the period.
Year-over-year changes in our operating cash flows are primarily due to working capital changes within our distribution operations, retail operations and wholesale services segments resulting from the impact of weather, the price of natural gas, natural gas storage, the timing of customer collections, payments for natural gas purchases and deferred gas cost recoveries. The increase or decrease in the price of natural gas directly impacts the cost of gas stored in inventory.
2012 compared to 2011 Our increased cash from operating activities was $1,003 million, an increase of $552 million or 122% from 2011. The increase was primarily related to the recovery of working capital from the companies acquired in the December 2011 merger with Nicor. Cash provided by operations changed $89 million in derivative financial instrument assets and liabilities primarily a result of the change in forward NYMEX prices at wholesale services year-over-year and $70 million driven by a decrease in Sequent's park and loan gas transactions due to lower volumes and decreased prices.
on as a result of changes in forward NYMEX prices. These increases were partially offset by a decrease in recovery of working capital during 2012 as a result of warmer-than-normal weather. Our increased operating cash flow in 2012 was also impacted by a decrease in cash used for margin deposits of $94 million due to the change in cash collateral value on our hedged positions and a $121 million decrease in trade payables mainly due to lower natural gas prices and purchased volumes in 2012.
2011 compared to 2010 In 2011, our net cash flow provided from operating activities was $451 million, a decrease of $75 million or 14% from 2010. This decrease was primarily a result of merger-related expenses in 2011 and the payment of $22 million of Nicor deferred compensation plans and $12 million of Nicor financial advisor fees. Our gas and trade payables required $58 million more of cash compared to 2010, primarily related to our subsidiaries acquired as part of the Nicor merger. Additionally, we had a $69 million decrease in operating cash flow from loaned gas activities associated with park and loan gas transactions in part due to fewer opportunities resulting from a weakening of storage price differentials.
These decreases in our cash from operating activities were primarily due to Nicor Gas net inventory withdrawals of $89 million in the period after merger closing through December 31, 2011 and were partially offset by a $158 million increase in cash received from our inventories primarily driven by a lower average cost of gas inventory and lower volumes of gas inventory.
Cash Flow from Investing Activities The decrease in net cash used in investing activities was primarily a result of our $912 million payment for the cash portion of the purchase consideration, net of cash that was acquired in the Nicor merger in 2011. This was offset by an increase in PP&E expenditures of $355 million, the majority of which were within our distribution operations and midstream operations segments. Our estimated PP&E expenditures for 2013 and our actual PP&E expenditures incurred in 2012, 2011 and 2010 are shown within the following categories and are presented in the following table.
Distribution business - primarily includes new construction and infrastructure improvements
45 AGL ResouRces inc. 2012 AnnuAl report44
PRELIMINARY PUBLIC COPY

46
Regulatory infrastructure programs - programs that update or expand our distribution systems and liquefied natural gas facilities to improve system reliability and meet operational flexibility and growth. These programs include the pipeline replacement program and STRIDE at Atlanta Gas Light, SAVE at Virginia Natural Gas, and
Natural gas storage - underground natural gas storage at Golden Triangle Storage, Jefferson Island and Central
Valley Other - primarily includes cargo shipping, information technology and building and leasehold improvements
In millions 2013 (1) 2012 2011 (2) 2010 Distribution business $365 $371 $159 $159 Regulatory infrastructure programs 212 263 192 186 Natural gas storage 11 55 22 114 Other 106 93 54 51
Total $694 $782 $427 $510 (1) Estimated PP&E expenditures. (2) Only includes Nicor expenditures subsequent to the merger date of December 9, 2011.
Our PP&E expenditures were $782 million for the year ended December 31, 2012, compared to $427 million for the same period in 2011.The increase of $355 million, or 83% was primarily due to $188 million of PP&E expenditures at Nicor Gas and $31 million of PP&E expenditures at Central Valley, both of which were acquired through our merger with Nicor in December 2011. Additionally, capital expenditures increased $63 million for pipeline replacement projects, $21 million for i-SRP projects and $10 million for i-CGP projects at Atlanta Gas Light as well as $16 million for accelerated infrastructure replacement program projects at Virginia Natural Gas.
Our PP&E expenditures were $427 million for the year ended December 31, 2011, compared to $510 million for the same period in 2010. This decrease of $83 million, or 16%, was primarily due to a $98 million decrease in expenditures for the construction of the Golden Triangle Storage natural gas storage facility due to the completion of base infrastructure spending and completion of the first cavern. This was partially offset by capital expenditures of $13 million at Nicor Gas and $6 million at Central Valley that were incurred subsequent to merger closing.
Our estimated expenditures for 2013 include discretionary spending for capital projects principally within the distribution business, regulatory infrastructure programs, natural gas storage and other categories. We continually evaluate whether to proceed with these projects, reviewing them in relation to factors including our authorized returns on rate base, other returns on invested capital for projects of a similar nature, capital structure and credit ratings, among others. We will make adjustments to these discretionary expenditures as necessary based upon these factors.
Cash Flow from Financing Activities Our capitalization and financing strategy is intended to ensure that we are properly capitalized with the appropriate mix of equity and debt securities. This strategy includes active management of the percentage of total debt relative to total capitalization, appropriate mix of debt with fixed to floating interest rates (our variable debt target is 20% to 45% of total debt), as well as the term and interest rate profile of our debt securities.
On December 6, 2012, we entered into a ten-year, $200 million 1.78% fixed-rate forward-starting interest rate swap to hedge any potential interest rate volatility prior to an anticipated issuance of senior notes during the second quarter 2013. We have designated the forward-starting interest rate swap, which will mature on the debt issuance date, as a cash flow hedge. On September 6, 2012, we settled our $250 million fixed-rate to floating-rate interest rate swap related to the $300 million outstanding 6.4% senior notes due in July 2016. This settlement resulted in our receipt of a $17 million cash payment.
As of December 31, 2012, our variable-rate debt was $1.5 billion, or 32%, of our total debt, compared to $1.7 billion, or 36%, as of December 31, 2011. The decrease was primarily due to working capital requirements in 2011. As of December 31, 2012, our commercial paper borrowings of $1.4 billion were 4% higher than the same time last year, primarily a result of higher working capital requirements. For more information on our debt, see Note 8 to our consolidated financial statements under Item 8 herein.
Our cash used in financing activities was $155 million in 2012 compared to cash provided of $933 million in 2011. The decrease in net cash flow provided by financing activities of $1,088 million was primarily due to our $1.3 billion of long-term debt issued and increased commercial paper borrowings million in 2011.
Merger Financing On December 9, 2011, we closed our merger with Nicor. The total value of the consideration paid to Nicor common shareholders was $2.5 billion. Upon closing the merger, we assumed the first mortgage bonds of Nicor Gas, which at December 31, 2012 and 2011 had principal balances totaling $500 million and maturity dates between 2016 and 2038. These bonds were recorded at their estimated fair value of $599 million on the date the merger closed. Additionally, we assumed $424 million in short-term debt upon closing the merger.
During 2011, we secured the permanent debt financing we used to pay the cash portion of the purchase consideration. This included approximately $200 million from our $500 million in senior notes that were issued in March 2011, $500
4746
PRELIMINARY PUBLIC COPY

47
Short-term Debt
In millions
Long-term Debt
47 AGL ResouRces inc. 2012 AnnuAl report46
PRELIMINARY PUBLIC COPY

48
Noncontrolling Interest
Dividends on Common Stock
Treasury Shares
Shelf Registration
Contractual Obligations and Commitments
49
In millions
Standby letters of credit and performance / surety bonds.
Pension and other retirement obligations.
4948
PRELIMINARY PUBLIC COPY

49
In millions
Standby letters of credit and performance / surety bonds.
Pension and other retirement obligations.
49 AGL ResouRces inc. 2012 AnnuAl report48
PRELIMINARY PUBLIC COPY

50
Environmental Remediation Liabilities
5150
PRELIMINARY PUBLIC COPY

51
The following table provides more information on our former operating sites:
In millions Probabilistic model
cost estimates Engineering
estimates Amount recorded
Expected costs over next twelve months
Illinois $193 - $439 $50 $243 $32 New Jersey 116 - 203 6 122 13 Georgia and Florida 53 - 106 12 68 4 North Carolina n/a 11 11 8
Total $362 - $748 $79 $444 $57
Beyond 2013, these costs cannot be estimated and considerable variability remains in available estimates. Details of our environmental remediation costs are discussed in Note 2 and Note 11 to our consolidated financial statements under Item 8 herein.
Derivatives and Hedging Activities
The authoritative guidance to determine whether a contract meets the definition of a derivative instrument, contains an embedded derivative requiring bifurcation, or qualifies for hedge accounting treatment is numerous and complex. The treatment of a single contract may vary from period to period depending upon accounting elections, changes in our assessment of the likelihood of future hedged transactions or new interpretations of accounting guidance. As a result, judgment is required in determining the appropriate accounting treatment. In addition, the estimated fair value of derivative instruments may change significantly from period to period depending upon market conditions, and changes in hedge effectiveness may impact the accounting treatment.
The authoritative guidance related to derivatives and hedging requires that every derivative instrument (including certain derivative instruments embedded in other contracts) be recorded on the Consolidated Statements of Financial Position as either an asset or liability measured at its fair value. However, if the derivative transaction qualifies for and is designated as a normal purchase and normal sale, it is exempted from the fair value accounting treatment and is, instead, subject to traditional accrual accounting. We utilize market data or assumptions that market participants would use in pricing the asset or liability, including assumptions about risk and the risks inherent in the inputs of the valuation technique.
The guidance requires that changes in the derivatives fair value are recognized concurrently in earnings unless specific hedge accounting criteria are met. If the derivatives meet those criteria, the guidance allows a derivatives gains and losses to offset related results on the hedged item in the income statement in the case of a fair value hedge, or to record the gains and losses in OCI until the hedged transaction occurs in the case of a cash flow hedge. Additionally, the guidance requires that a company formally designate a derivative as a hedge as well as document and assess the effectiveness of derivatives associated with transactions that receive hedge accounting treatment.
Nicor Gas and Elizabethtown Gas utilize derivative instruments for the purchase of natural gas for customers. These derivatives are reflected at fair value and are not designated as hedges. Realized gains or losses on such instruments are included in the cost of gas delivered and are passed through directly to customers, subject to review by the applicable state regulatory commissions, and therefore have no direct impact on earnings. Unrealized changes in the fair value of these derivative instruments are deferred as regulatory assets or liabilities.
We use derivative instruments primarily to reduce the impact to our results of operations due to the risk of changes in the price of natural gas. The fair value of natural gas derivative instruments used to manage our exposure to changing natural gas prices reflects the estimated amounts that we would receive or pay to terminate or close the contracts at the reporting date, taking into account the current unrealized gains or losses on open contracts.
Additionally, as required by the authoritative guidance, we are required to classify our derivative assets and liabilities based on the lowest level of input that is significant to the fair value measurement. Our assessment of the significance of a particular input to the fair value measurement requires judgment, and may affect the valuation of fair value assets and liabilities and their placement within the fair value hierarchy. The determination of the fair value of our derivative instruments incorporates various factors required under the guidance. These factors include:
the credit worthiness of the counterparties involved and the impact of credit enhancements (such as cash deposits and letters of credit)
events specific to a given counterparty the impact of our nonperformance risk on our liabilities
We have recorded derivative instrument assets of $144 million at December 31, 2012 and $288 million at December 31, 2011. Additionally, we have recorded derivative liabilities of $38 million at December 31, 2012 and $110 million at December 31, 2011. We recorded gains on our Consolidated Statements of Income of $10 million in 2012 and losses of $24 million in 2011 and $46 million in 2010.
51 AGL ResouRces inc. 2012 AnnuAl report50
PRELIMINARY PUBLIC COPY

52
Impairment of Goodwill and Long-Lived Assets, including Intangible Assets Goodwill
Long-Lived Assets
5352
PRELIMINARY PUBLIC COPY

53
decrease from our current estimates. As of December 31, 2012, we estimate that approximately 15% of our future cash flows will be received over the next 10 years, an additional 20% over the next 10 years and approximately 65% in periods thereafter over the remaining useful lives of our storage facilities.
Contingencies
Our accounting policies for contingencies cover a variety of business activities, including contingencies for potentially uncollectible receivables, rate matters, and legal and environmental exposures. We accrue for these contingencies when our assessments indicate that it is probable that a liability has been incurred or an asset will not be recovered, and an amount can be reasonably estimated in accordance with authoritative guidance related to contingencies. We base our estimates for these liabilities on currently available facts and our estimates of the ultimate outcome or resolution of the liability in the future.
Actual results may differ from estimates, and estimates can be, and often are, revised either negatively or positively depending on actual outcomes or changes in the facts or expectations surrounding each potential exposure. Changes in the estimates related to contingencies could have a negative impact on our consolidated results of operations, cash flows or financial position. Our contingencies are further discussed in Note 11 to our consolidated financial statements under Item 8 herein.
Pension and Other Retirement Plans
Effective as of December 31, 2012, the and the Nicor Companies Pension and Retirement Plan (Nicor Plan) were merged with and into the AGL Resources Inc. Retirement Plan (AGL Plan). Our pension and other retirement plan costs and liabilities are determined on an actuarial basis and are affected by numerous assumptions and estimates. We annually review the estimates and assumptions underlying our pension and other retirement plan costs and liabilities and update them when appropriate. The critical actuarial assumptions used to develop the required estimates for our pension and other retirement plans include the following key factors:
assumed discount rates expected return on plan assets the market value of plan assets assumed mortality table assumed health care costs assumed compensation increases assumed rates of retirement assumed rates of termination
The discount rate is utilized in calculating the actuarial present value of our pension and other retirement obligations and our annual net pension and other retirement costs. When establishing our discount rate, with the assistance of our actuaries, we consider high-grade bond indices in developing a single equivalent discount rate for all of our plans. As of December 31, 2012, the single equivalent discount rate is derived by applying the appropriate spot rates based on high quality (AA or better) corporate bonds that have a yield higher than the regression mean yield curve, to the forecasted future cash flows in each year for each plan.
The expected long-term rate of return on assets is used to calculate the expected return on plan assets component of our annual pension and other retirement plans costs. We estimate the expected return on plan assets by evaluating expected bond returns, equity risk premiums, asset allocations, the effects of active plan management, the impact of periodic plan asset rebalancing and historical performance. We also consider guidance from our investment advisors in making a final determination of our expected rate of return on assets. To the extent the actual rate of return on assets realized over the
other retirement plan cost is not affected; rather, this gain or loss reduces or increases future pension or other retirement plan costs.
Equity market performance and corporate bond rates have a significant effect on our reported results. For the AGL pension plan, market performance affects our market-related value of plan assets (MRVPA), which is a calculated value and differs from the actual market value of plan assets. The MRVPA recognizes differences between the actual market value and expected market value of our plan assets and is determined by our actuaries using a five-year smoothing weighted average methodology. Gains and losses on plan assets are spread through the MRVPA based on the five-year smoothing weighted average methodology, which affects the expected return on plan assets component of pension expense.
In addition, differences between actuarial assumptions and actual plan experience are deferred and amortized into cost when the accumulated differences exceed 10% of the greater of the projected benefit obligation (PBO) or the MRVPA for the AGL pension plan. If necessary, the excess is amortized over the average remaining service period of active employees.
65
53 AGL ResouRces inc. 2012 AnnuAl report52
PRELIMINARY PUBLIC COPY

54
In millions
Income Taxes
5554
PRELIMINARY PUBLIC COPY

55
Distribution Operations
Retail Operations
55 AGL ResouRces inc. 2012 AnnuAl report54
PRELIMINARY PUBLIC COPY

56
Wholesale Services
Midstream Operations
Consolidated
In millions
In millions
In millions
In millions
Value-at-risk
57
In millions
Cargo Shipping
Distribution Operations
5756
PRELIMINARY PUBLIC COPY

57
In millions
Cargo Shipping
Distribution Operations
57 AGL ResouRces inc. 2012 AnnuAl report56
PRELIMINARY PUBLIC COPY
58
Retail Operations
Wholesale Services
5958
PRELIMINARY PUBLIC COPY

59
In millions
59 AGL ResouRces inc. 2012 AnnuAl report58
PRELIMINARY PUBLIC COPY

60
Internal Control - Integrated Framework
61
Internal Control - Integrated Framework
6160
PRELIMINARY PUBLIC COPY
61
Internal Control - Integrated Framework
61 AGL ResouRces inc. 2012 AnnuAl report60
PRELIMINARY PUBLIC COPY

62
In millions
6362
PRELIMINARY PUBLIC COPY

62
In millions
63
In millions, except share amounts
63 AGL ResouRces inc. 2012 AnnuAl report62
PRELIMINARY PUBLIC COPY

64
In millions, except per share amounts
6564
PRELIMINARY PUBLIC COPY

65
In millions
65 AGL ResouRces inc. 2012 AnnuAl report64
PRELIMINARY PUBLIC COPY

66
In millions, except per share amounts
6766
PRELIMINARY PUBLIC COPY

66
In millions, except per share amounts
67
In millions
67 AGL ResouRces inc. 2012 AnnuAl report66
PRELIMINARY PUBLIC COPY

68
Nicor Gas
Atlanta Gas Light
6968
PRELIMINARY PUBLIC COPY

69
In millions
Dollars in millions
69 AGL ResouRces inc. 2012 AnnuAl report68
PRELIMINARY PUBLIC COPY

70
Level 1
Level 2
Level 3
7170
PRELIMINARY PUBLIC COPY

71
Derivative Instruments
Fair Value Hierarchy
Netting of Cash Collateral and Derivative Assets and Liabilities under Master Netting Arrangements
Natural Gas Derivative Instruments
Distribution Operations
Retail Operations
71 AGL ResouRces inc. 2012 AnnuAl report70
PRELIMINARY PUBLIC COPY

72
Wholesale Services We purchase natural gas for storage when the current market price we pay to buy and transport natural gas plus the cost to store and finance the natural gas is less than the market price we can receive in the future, resulting in a positive net operating margin. We use NYMEX futures and OTC contracts to sell natural gas at that future price to substantially lock in the operating margin we will ultimately realize when the stored natural gas is sold. We also enter into transactions to secure transportation capacity between two delivery points in order to serve our customers and various markets. We use NYMEX futures and OTC contracts to capture the price differential or spread between the locations served by the capacity in order to substantially lock in the operating margin we will ultimately realize when we physically flow natural gas between the two delivery points. These contracts generally meet the definition of derivatives and are carried at fair value in our Consolidated Statements of Financial Position, with changes in fair value recorded in our Consolidated Statements of Income in the period of change. These contracts are not designated as hedges for accounting purposes.
The purchase, transportation, storage and sale of natural gas are accounted for on a weighted average cost or accrual basis, as appropriate, rather than on the fair value basis we utilize for the derivatives used to mitigate the natural gas price risk associated with our storage and transportation portfolio. Further, we incur monthly demand charges for the contracted storage and transportation capacity, and payments associated with asset management agreements and recognize these demand charges and payments in our Consolidated Statements of Income in the period they are incurred. This difference in accounting can result in volatility in our reported earnings, even though the economic margin is essentially unchanged from the date the transactions were consummated.
Debt
We estimate the fair value of debt using a discounted cash flow technique that incorporates a market interest yield curve with adjustments for duration, optionality and risk profile. In determining the market interest yield curve, we consider our currently assigned ratings for unsecured debt and the secured rating for the Nicor Gas first mortgage bonds.
Property, Plant and Equipment
A summary of our PP&E by classification as of December 31, 2012 and 2011 is provided in the following table.
In millions 2012 2011 Transportation and distribution $7,992 $7,579 Storage caverns 1,149 931 Shipping vessels and containers 145 146 Other 820 747 Construction work in progress 372 376
Total gross PP&E 10,478 9,779 Less accumulated depreciation 2,131 1,879
Total net PP&E $8,347 $7,900
Distribution Operations PP&E consists of property and equipment that is currently in use, being held for future use and currently under construction. We report PP&E at its original cost, which includes:
material and labor contractor costs construction overhead costs an allowance for funds used during construction (AFUDC) which represents the estimated cost of funds, from
both debt and equity sources, used to finance the construction of major projects and is capitalized in rate base for ratemaking purposes when the completed projects are placed in service
- the portion considered to be non-recoverable is recorded as depreciable PP&E while the portion considered to be recoverable is recorded as non-depreciable PP&E
We recognize no gains or losses on depreciable utility property that is retired or otherwise disposed, as required under the composite depreciation method. Such gains and losses are ultimately refunded to or recovered from customers through future rate adjustments. Our gas distribution utilities also hold property, primarily land; this is not presently used and useful in utility operations and is not in rate base. Upon sale, any gain or loss is recognized in other income.
Retail Operations, Wholesale Services, Midstream Operations, Cargo Shipping and Other PP&E includes property that is in use and under construction, and we report it at cost. We record a gain or loss for retired or otherwise disposed-of property. Natural gas in salt-dome storage at Jefferson Island and Golden Triangle Storage that is retained as pad gas is classified as non-depreciable PP&E and is carried at cost. Central Valley has two types of pad gas in its depleted reservoir storage facility. The first is non-depreciable PP&E, which is carried at cost, and the second is non-recoverable to which we have no contractual ownership.
7372
PRELIMINARY PUBLIC COPY
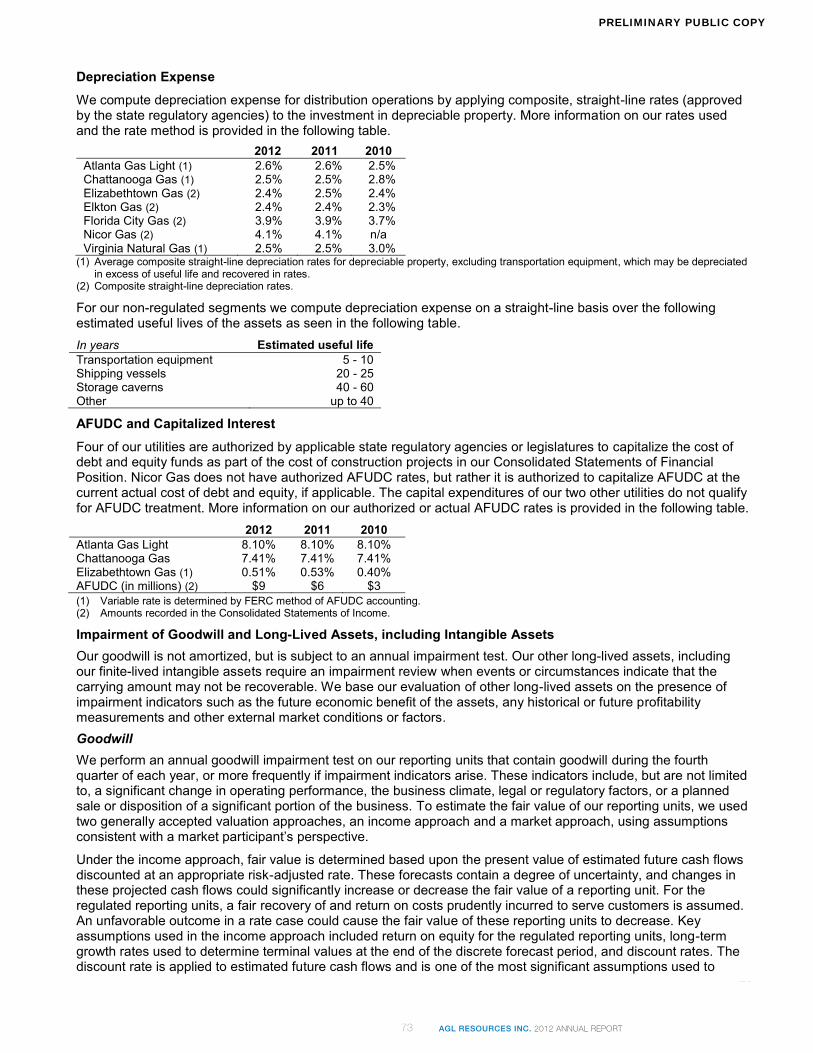
73
In years
Goodwill
73 AGL ResouRces inc. 2012 AnnuAl report72
PRELIMINARY PUBLIC COPY

74
Long-Lived Assets
Intangible Assets
Income Taxes
In millions
7574
PRELIMINARY PUBLIC COPY

75
Investment and Other Tax Credits
Accumulated Deferred Income Tax Assets and Liabilities
Regulatory Income Tax Liability
Income Tax Benefits
Uncertain Tax Positions
Tax Collections
Distribution operations
75 AGL ResouRces inc. 2012 AnnuAl report74
PRELIMINARY PUBLIC COPY

76
Revenue Taxes
Retail operations
Wholesale services
Midstream operations
Cargo shipping
Distribution operations
Retail operations
7776
PRELIMINARY PUBLIC COPY
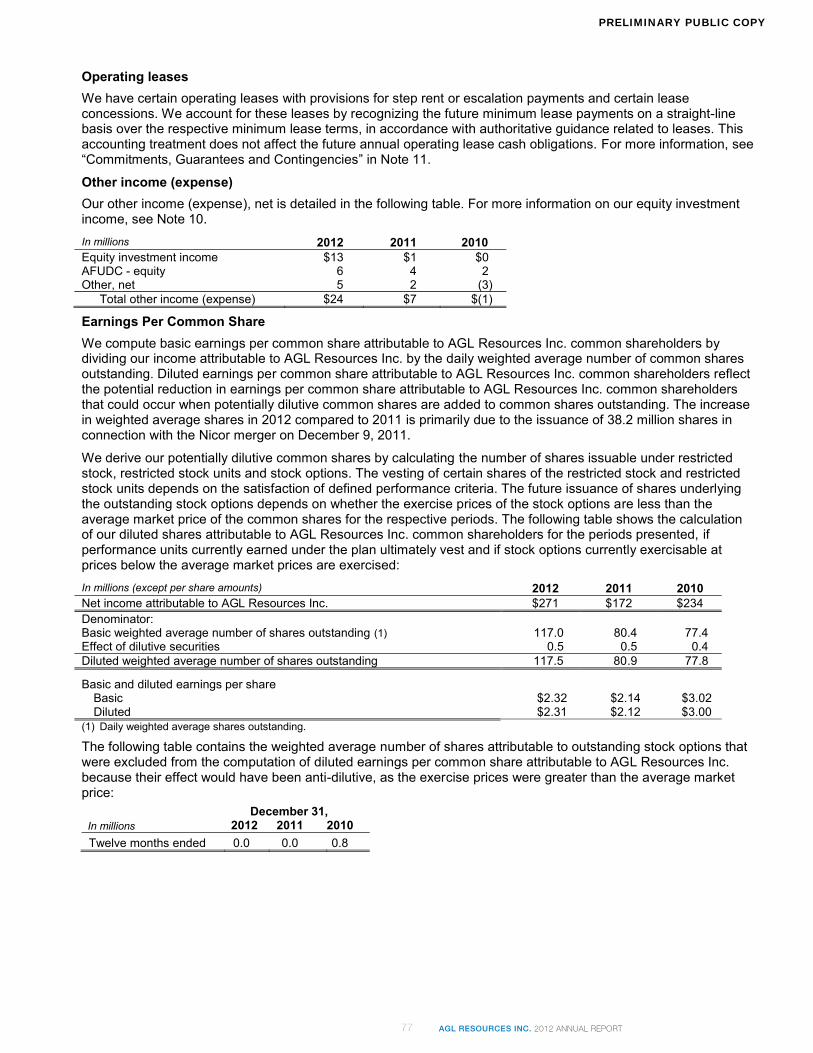
77
In millions
In millions (except per share amounts)
In millions
77 AGL ResouRces inc. 2012 AnnuAl report76
PRELIMINARY PUBLIC COPY

78
In millions
7978
PRELIMINARY PUBLIC COPY

79
Environmental Remediation Costs
Bad Debt Rider
Accumulated Removal Costs
Regulatory Infrastructure Programs
79 AGL ResouRces inc. 2012 AnnuAl report78
PRELIMINARY PUBLIC COPY

80
Marketers, the costs related to the program net of any cost savings from the program. All such amounts will be recovered through a combination of straight-fixed-variable rates and a pipeline replacement revenue rider. The regulatory asset has two components: (i) the revenues recognized to date that have not yet been recovered from customers through the rate riders, and (ii) the future expected costs to be recovered through the rate riders.
Atlanta Gas Light has recorded a current regulatory asset of $47 million, which represents the amount of recognized revenues expected to be collected from customers over the next 12 months. Atlanta Gas Light has also recorded a non-current asset of $167 million, which represents the expected future collection of revenues already recognized. The amounts recovered from the pipeline replacement revenue rider during the last three years were:
$51 million in 2012 $48 million in 2011 $45 million in 2010
As of December 31, 2012, Atlanta Gas Light had recorded a current liability of $121 million representing expected program expenditures for the next 12 months and no long-term liability.
Atlanta Gas Light capitalizes and depreciates the capital expenditure costs incurred from the pipeline replacement program over the life of the assets. Operation and maintenance costs are expensed as incurred. Recoveries, which are recorded as revenue, are based on a formula that allows Atlanta Gas Light to recover operation and maintenance costs in excess of those included in its current base rates, depreciation expense and an allowed rate of return on capital expenditures. In the near term, the primary financial impact to Atlanta Gas Light from the pipeline replacement program is reduced cash flow from operating and investing activities, as the timing related to cost recovery does not match the timing of when costs are incurred. However, Atlanta Gas Light is allowed the recovery of carrying costs on the under-recovered balance resulting from the timing difference.
The Georgia Commission has also approved Atlanta Gas Ligongoing pipeline replacement program, the new Integrated System Reinforcement Program (i-SRP) and the new Integrated Customer Growth Program (i-CGP). The purpose of the i-distribution system and liquefied natural gas facilities in Georgia, improve its system reliability and operational flexibility, and create a platform to meet long-term forecasted growth. Atlanta Gas Light will be required to file an updated ten-year forecast of infrastructure requirements under the i-SRP along with a new three-year construction plan every three years for review and approval by the Georgia Commission.
Under i-CGP, the Georgia Commission authorized Atlanta Gas Light to extend its pipeline facilities to serve customers without pipeline access and create new economic development opportunities in Georgia. The i-CGP was approved as a three-year pilot program under STRIDE, and all related costs will be recovered through a surcharge.
In 2009, the New Jersey BPU approved an enhanced infrastructure program for Elizabethtown Gas, which was
increasing infrastructure investments. In May 2011, spend an additional $40 million under this program before the end of 2012. Costs associated with the investment in this program are recovered through periodic adjustments to base rates. In July 2012, we filed for an extension of the program up to $135 million in additional spend over five years and we expect a ruling in the first half of 2013.
On June 25, 2012, the Virginia Commission approved SAVE, an accelerated infrastructure replacement program, which is expected to be completed over a five-year period. The program permits a maximum capital expenditure of $25 million per year, not to exceed $105 million in total. SAVE is subject to annual review by the Virginia Commission. We began recovering costs based on this program through a rate rider that was effective August 1, 2012.
Other Regulatory Assets and Liabilities Our recoverable pension and other retirement benefit plan costs are recoverable through base rates over the next 2 to 21 years, based on the remaining recovery period as designated by the applicable state regulatory commissions. This category also includes recoverable seasonal rates, which
se rates revenues on a straight-line basis as compared to the collection of the revenues over a seasonal pattern. These amounts are fully recoverable through base rates within one year.
Accounting for Retirement Benefit Plans
The authoritative guidance related to retirement benefits requires that we recognize the obligations related to each
Statements of Financial Position. The guidance futhat determine our funded status as of the end of the fiscal year. We are also required to recognize as a
8180
PRELIMINARY PUBLIC COPY

81
81 AGL ResouRces inc. 2012 AnnuAl report80
PRELIMINARY PUBLIC COPY

82
In millions, except per share price
In millions
8382
PRELIMINARY PUBLIC COPY

82
In millions, except per share price
In millions
83
In millions
In millions
In millions
In millions
83 AGL ResouRces inc. 2012 AnnuAl report82
PRELIMINARY PUBLIC COPY

84
In millions, except per share amounts
Pro forma financial information
In millions, except per share amounts
8584
PRELIMINARY PUBLIC COPY

84
In millions, except per share amounts
Pro forma financial information
In millions, except per share amounts
85
In millions
In millions
85 AGL ResouRces inc. 2012 AnnuAl report84
PRELIMINARY PUBLIC COPY

86
In millions
In millions
In millions
In millions
In millions
8786
PRELIMINARY PUBLIC COPY

86
In millions
In millions
In millions
In millions
In millions
87
Note 5 - Derivative Instruments
Derivative Instruments
Our risk management activities are monitored by our Risk Management Committee, which consists of members of senior management and is charged with reviewing and enforcing our risk management activities and policies. Our use of derivative instruments, including physical transactions, is limited to predefined risk tolerances associated with pre-existing or anticipated physical natural gas sales and purchases and system use and storage. We use the following types of derivative instruments and energy-related contracts to manage natural gas price, interest rate, weather, automobile fuel price and foreign currency risks:
forward, futures and options contracts financial swaps treasury locks weather derivative contracts storage and transportation capacity contracts foreign currency forward contracts
Certain of our derivative instruments contain credit-risk-related or other contingent features that could increase the payments for collateral we post in the normal course of business when our financial instruments are in net liability positions. As of December 31, 2012 and 2011 for agreements with such features, derivative instruments with liability fair values totaled $39 million and $110 million, respectively, for which we had posted no collateral to our counterparties. In addition, our energy marketing receivables and payables, which also have credit-risk-related or other contingent features, are discussed in Note 2. Our derivative instrument activities are included within operating cash flows as an adjustment to net income of $72 million in 2012, $(17) million in 2011 and $7 million in 2010.
On December 6, 2012, we entered into a ten-year, $200 million 1.78% fixed-rate forward-starting interest rate swap to hedge any potential interest rate volatility prior to an anticipated issuance of senior notes during the second quarter 2013. We have designated the forward-starting interest rate swap, which will mature on the debt issuance date, as a cash flow hedge.
In May 2011, we entered into interest rate swaps related to the $300 million outstanding of 6.4% senior notes due in July 2016 that effectively converted $250 million from a fixed rate to a variable rate obligation. On September 6, 2012 we settled this $250 million fixed-rate to floating-rate interest rate swap.
The fair values of our interest rate swaps were reflected as a long-term derivative asset of $3 million and no short-term liability at December 31, 2012 and a long-term derivative asset of $13 million and a short-term liability of $13 million at December 31, 2011. For more information on our debt, see Note 8.
The following table summarizes the various ways in which we account for our derivative instruments and the impact on our consolidated financial statements:
Accounting Treatment
Recognition and Measurement Statements of Financial Position Income Statement
Cash flow hedge Derivative carried at fair value Ineffective portion of the gain or loss on the derivative instrument is recognized in earnings
Effective portion of the gain or loss on the derivative instrument is reported initially as a component of accumulated OCI (loss)
Effective portion of the gain or loss on the derivative instrument is reclassified out of accumulated OCI (loss) and into earnings when the hedged transaction affects earnings
Fair value hedge Derivative carried at fair value Changes in fair value of the hedged item are recorded as adjustments to the carrying amount of the hedged item
Gains or losses on the derivative instrument and the hedged item are recognized in earnings. As a result, to the extent the hedge is effective, the gains or losses will offset and there is no impact on earnings. Any hedge ineffectiveness will impact earnings
Not designated as hedges
Derivative carried at fair value Realized and unrealized gains or losses on the derivative instrument are recognized in earnings
on derivative instruments are deferred as regulatory assets or liabilities until included in cost of goods sold
The gain or loss on these derivative instruments is reflected in natural gas costs and is ultimately included in billings to customers
87 AGL ResouRces inc. 2012 AnnuAl report86
PRELIMINARY PUBLIC COPY

88
Quantitative Disclosures Related to Derivative Instruments
In Bcf
Derivative Instruments on the Consolidated Statements of Financial Position
In millions
In millions
8988
PRELIMINARY PUBLIC COPY

88
Quantitative Disclosures Related to Derivative Instruments
In Bcf
Derivative Instruments on the Consolidated Statements of Financial Position
In millions
In millions
89
In millions
.
89 AGL ResouRces inc. 2012 AnnuAl report88
PRELIMINARY PUBLIC COPY

90
9190
PRELIMINARY PUBLIC COPY

91
Dollars in millions
91 AGL ResouRces inc. 2012 AnnuAl report90
PRELIMINARY PUBLIC COPY

92
Dollars in millions
Dollars in millions
In millions
9392
PRELIMINARY PUBLIC COPY

92
Dollars in millions
Dollars in millions
In millions
93
In millions
In millions
93 AGL ResouRces inc. 2012 AnnuAl report92
PRELIMINARY PUBLIC COPY

94
Note 7 - Stock-Based Compensation
General
The AGL Resources Inc. Omnibus Performance Incentive Plan, as amended and restated, and the Long-Term Incentive Plan (1999) provide for the grant of incentive and nonqualified stock options, stock appreciation rights, shares of restricted stock, restricted stock units, performance cash awards and other stock-based awards to officers and key employees. Under the Omnibus Performance Incentive Plan, as of December 31, 2012, the number of shares issuable upon exercise of outstanding stock options, warrants & rights is 823,200 shares. Under the Long-Term Incentive Plan (1999) as of December 31, 2012, the number of shares issuable upon exercise of outstanding stock options, warrants & rights is 1,184,890 shares. The maximum number of shares available for future issuance under the Omnibus Performance Incentive Plan is 4,609,105 shares, which includes 1,657,910 shares previously available under the Nicor Inc. 2006 Long term incentive plan, as amended, pursuant to NYSE rules. No further grants will be made from the Long-Term Incentive Plan (1999) except for reload options that may be granted pursuant to the terms of certain outstanding options.
Accounting Treatment and Compensation Expense
We measure and recognize stock-based compensation expense for our stock-based awards over the requisite service period in our financial statements based on the estimated fair value at the date of grant for our stock-based awards using the modified prospective method. These stock awards include:
stock options stock awards performance units (restricted stock units, performance share units and performance cash units).
Performance-based stock awards and performance units contain market conditions. Stock options, restricted stock awards and performance units also contain a service condition.
We estimate forfeitures over the requisite service period when recognizing compensation expense. These estimates are adjusted to the extent that actual forfeitures differ, or are expected to materially differ, from such estimates. The authoritative guidance requires excess tax benefits to be reported as a financing cash inflow. The difference between the proceeds from the exercise of our stock-based awards and the par value of the stock is recorded within premium on common stock.
We have granted incentive and nonqualified stock options with a strike price equal to the fair market value on the date of the grant. Fair market value is defined under the terms of the applicable plans as the closing price per share of AGL Resources common stock for the trading day immediately preceding the grant date, as reported in The Wall Street Journal. Stock options generally have a three-year vesting period. The following table provides additional information on compensation costs and income tax benefits and excess tax benefits related to our cash and stock-based compensation awards.
In millions 2012 2011 2010 Compensation costs (1) $9 $14 $11 Income tax benefits (1) 1 1 2 Excess tax benefits (2) 1 1 2 (1) Recorded in our Consolidated Statements of Income. (2) Recorded in our Consolidated Statements of Financial Position.
Incentive and Nonqualified Stock Options
The stock options we granted generally expire 10 years after the date of grant. Participants realize value from option grants only to the extent that the fair market value of our common stock on the date of exercise of the option exceeds the fair market value of the common stock on the date of the grant.
As of December 31, 2012, we had no unrecognized compensation costs related to stock options and this amount was immaterial as of December 31, 2011. Cash received from stock option exercises for 2012 was $7 million, and the income tax benefits from stock option exercises were $1 million. Cash received from stock option exercises for 2011 was $11 million, and the income tax benefit from stock option exercises was $1 million. The following tables summarize activity related to stock options for key employees and non-employee directors. As used in the table, intrinsic value for options means the difference between the current market value and the grant price.
9594
PRELIMINARY PUBLIC COPY

95
Restricted Stock Units
95 AGL ResouRces inc. 2012 AnnuAl report94
PRELIMINARY PUBLIC COPY

96
Performance Share Unit Awards
In millions
Stock Awards Non-Employee Directors
Restricted Stock Awards Employees
9796
PRELIMINARY PUBLIC COPY

96
Performance Share Unit Awards
In millions
Stock Awards Non-Employee Directors
Restricted Stock Awards Employees
97
Dollars in millions
Commercial Paper Programs
AGL Credit Facility
Nicor Gas Credit Facility
97 AGL ResouRces inc. 2012 AnnuAl report96
PRELIMINARY PUBLIC COPY

98
Current Portion of Long-term Debt and Capital Leases
(in millions)
Senior Notes
(in millions)
Interest Rate Swaps
9998
PRELIMINARY PUBLIC COPY

99
First Mortgage Bonds As a result of the merger, we acquired the first mortgage bonds of Nicor Gas, which at December 31, 2012 and 2011 had principal balances totaling $500 million. Nicor Gas has issued first mortgage bonds through the public and private placement markets.
Gas Facility Revenue Bonds We are party to a series of loan agreements with the New Jersey Economic Development Authority (NJEDA) under which the NJEDA has issued a series of gas facility revenue bonds. These gas revenue bonds are issued by state agencies or counties to investors, and proceeds from the issuance are then loaned to us.
Financial and Non-Financial Covenants
The AGL Credit Facility and the Nicor Gas Credit Facility each include a financial covenant that requires us to maintain a ratio of total debt to total capitalization of no more than 70% at the end of any fiscal month; however, our goal is to maintain these ratios at levels between 50% and 60%. These ratios, as calculated in accordance with the debt covenants, include standby letters of credit and surety bonds and exclude accumulated OCI items related to non-cash pension adjustments, other post-retirement benefits liability adjustments and accounting adjustments for cash flow hedges. Adjusting for these items, the following table contains our debt-to-capitalization ratios for the periods presented, which are within our required and targeted ranges.
AGL Resources Nicor Gas December 31, December 31, 2012 2011 2012 2011 Debt-to-capitalization ratio 58% 58% 55% 60%
The credit facilities contain certain non-financial covenants that, among other things, restrict liens and encumbrances, loans and investments, acquisitions, dividends and other restricted payments, asset dispositions, mergers and consolidations and other matters customarily restricted in such agreements.
Default Provisions
Our credit facilities and other financial obligations include provisions that, if not complied with, could require early payment or similar actions. The most important default events include:
a maximum leverage ratio insolvency events and nonpayment of scheduled principal or interest payments acceleration of other financial obligations change of control provisions
We have no triggering events in our debt instruments that are tied to changes in our specified credit ratings or our stock price and have not entered into any transaction that requires us to issue equity based on credit ratings or other triggering events. We were in compliance with all existing debt provisions and covenants, both financial and non-financial, as of December 31, 2012 and 2011.
Preferred Securities
At December 31, 2012 and 2011, we had 10 million shares of authorized, unissued Class A junior participating preferred stock, no par value, and 10 million shares of authorized, unissued preferred stock, no par value.
99 AGL ResouRces inc. 2012 AnnuAl report98
PRELIMINARY PUBLIC COPY

100
In millions
101100
PRELIMINARY PUBLIC COPY

101
Note 10 - Non-Wholly Owned Entities
Variable Interest Entities
On a quarterly basis we evaluate all of our owner interests to determine if they represent a variable interest entity (VIE) as defined by the authoritative accounting guidance on consolidation, and if so, which party is the primary beneficiary. We have determined that SouthStar, a joint venture owned by us and Piedmont, is the only VIE for which we are the primary beneficiary, which requires us to consolidate its assets, liabilities and Statements of Income. Earnings from SouthStar in 2012, 2011 and 2010 were allocated entirely in accordance with the ownership interests. We account for our ownership of SouthStar in accordance with authoritative accounting guidance which is fully described within Note 2.
SouthStar markets natural gas and related services under the trade name Georgia Natural Gas to customers primarily in Georgia, and under various other trade names to customers in Ohio, Florida and New York. The primary risks associated with SouthStar are discussed in our risk factors included in Item 1A.
The following table illustrates the effect that our 2009 purchase of an additional 15% ownership percentage, which became effective in January 2010, had on our equity.
In millions Premium on
common stock Accumulated other comprehensive loss Total
Purchase of additional 15% ownership interest $(51) $(1) $(52)
Our conclusion that SouthStar is a VIE resulted from our equal voting rights with Piedmont not being proportional to our economic obligation to absorb 85% of losses or residual returns from the joint venture. Following are additional fsignificantly impact its performance.
Operations
Our wholly owned subsidiary, Atlanta Gas Light, provides the following services in accordance with Georgia
maintains and expands the natural gas infrastructure in Georgia markets the benefits of natural gas, performs outreach to residential and commercial developers, offers
maintain and expand its residential, commercial and industrial customers in its largest market, Georgia
Liquidity and capital resources
natur
SouthStar utilizes the AGL Capital commercial paper program for its liquidity and working capital SouthStar
has adequate liquidity and working capital resources
Back office functions
in accordance with our services agreement, we provide services to SouthStar with respect to accounting, information technology, credit and internal controls
SouthStar
instruments and receivables from its customers. SouthStar also has receivables from us due to its participation in
ial as of December 31, 2012 and 2011
paper program.
As of December 31, 2012long-term assets and other deferred debits, long-term liabilities and other deferred credits by $129 million.
her contractual commitments and obligations, including operating leases and agreements with third party providers, do not contain terms that would trigger material financial obligations in the event that such contracts were terminated. As a result, our maximum exposure to a loss at SouthStar is considered to be
101 AGL ResouRces inc. 2012 AnnuAl report100
PRELIMINARY PUBLIC COPY

102
In millions
In millions
Triton
Horizon Pipeline
In millions
103102
PRELIMINARY PUBLIC COPY

102
In millions
In millions
Triton
Horizon Pipeline
In millions
103
In millions
103 AGL ResouRces inc. 2012 AnnuAl report102
PRELIMINARY PUBLIC COPY
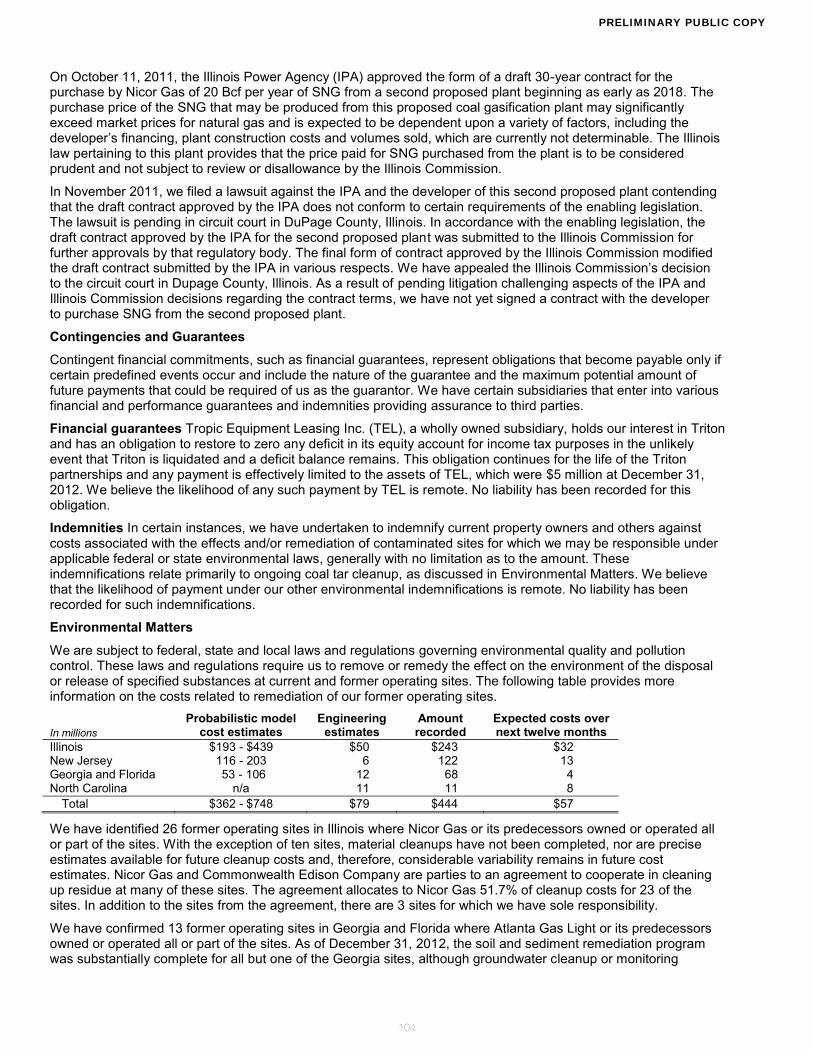
104
In millions
105104
PRELIMINARY PUBLIC COPY

104
In millions
105
105 AGL ResouRces inc. 2012 AnnuAl report104
PRELIMINARY PUBLIC COPY
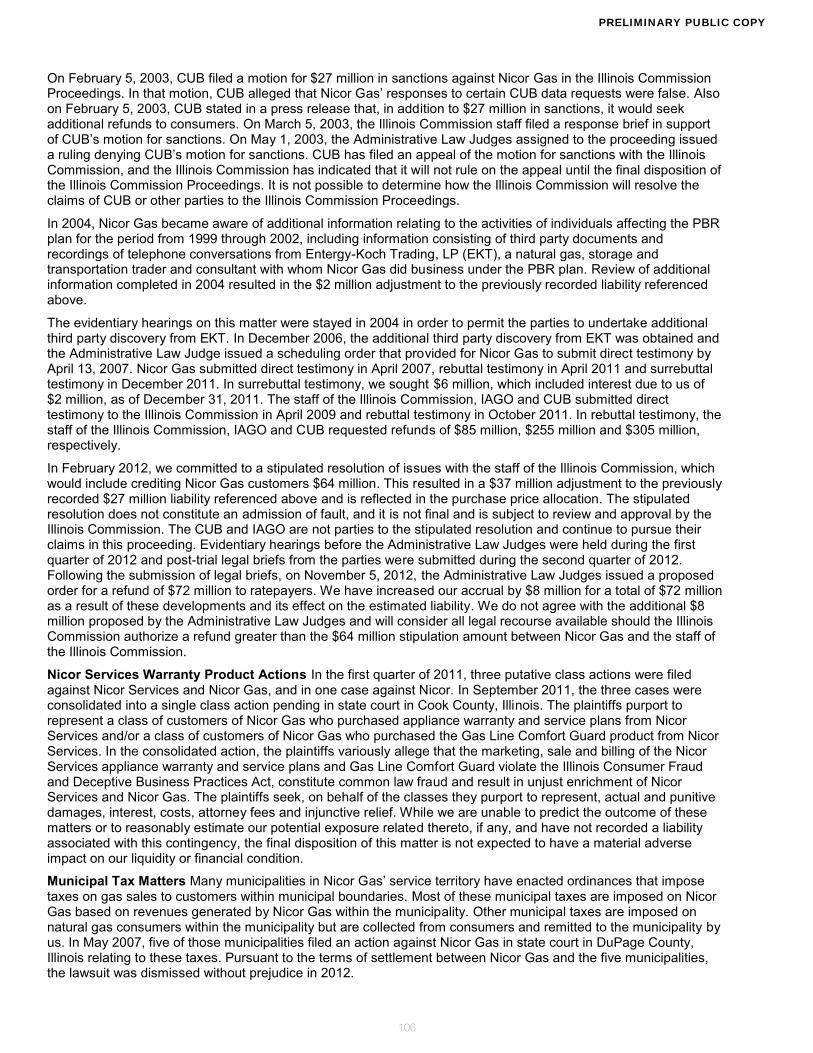
106
107106
PRELIMINARY PUBLIC COPY

107
In millions
In millions
107 AGL ResouRces inc. 2012 AnnuAl report106
PRELIMINARY PUBLIC COPY

108
In millions
109108
PRELIMINARY PUBLIC COPY

109
In millions
109 AGL ResouRces inc. 2012 AnnuAl report108
PRELIMINARY PUBLIC COPY

110
In millions
In millions
111
In millions
In millions, except per share amounts
2012
In millionsDistributionoperations
Retailoperations
Wholesaleservices
Midstreamoperations
Cargoshipping
Other and intercompany
eliminations (4) ConsolidatedOperating revenues from external parties
$2,710 $733 $58 $78 $342 $1 $3,922
Intercompany revenues (1) 167 2 30 0 0 (199) 0 Total operating revenues 2,877 735 88 78 342 (198) 3,922
Operating expenses Cost of goods sold 1,221 488 38 32 208 (196) 1,791Operation and maintenance 642 114 48 19 109 (11) 921Depreciation and amortization 351 13 2 14 22 13 415Nicor merger expenses (2) 0 0 0 0 0 20 20 Taxes other than income taxes 140 4 4 5 6 6 165
Total operating expenses 2,354 619 92 70 345 (168) 3,312 Operating income (loss) 523 116 (4) 8 (3) (30) 610 Other income 9 0 1 2 11 1 24EBIT $532 $116 $(3) $10 $8 $(29) $634
Identifiable and total assets (3) $11,320 $511 $1,218 $720 $464 $(92) $14,141 Goodwill $1,640 $122 $0 $14 $61 $0 $1,837 Capital expenditures $649 $8 $3 $62 $7 $53 $782
2011
In millions Distributionoperations
Retailoperations
Wholesaleservices
Midstreamoperations
Cargoshipping
Other and intercompany
eliminations (4) Consolidated Operating revenues from
external parties $1,451 $702 $95 $70 $19 $1 $2,338
Intercompany revenues (1) 146 0 3 0 0 (149) 0 Total operating revenues 1,597 702 98 70 19 (148) 2,338 Operating expenses
Cost of goods sold 625 534 41 33 12 (148) 1,097 Operation and maintenance 362 71 48 15 7 (2) 501Depreciation and amortization 160 2 1 10 1 12 186Nicor merger expenses (2) 0 0 0 0 0 57 57 Taxes other than income taxes 44 2 3 3 0 5 57
Total operating expenses 1,191 609 93 61 20 (76) 1,898 Operating income (loss) 406 93 5 9 (1) (72) 440Other income 6 0 0 0 1 0 7EBIT $412 $93 $5 $9 $0 $(72) $447
Identifiable and total assets (3) $11,020 $501 $1,214 $635 $481 $62 $13,913 Goodwill $1,586 $124 $2 $16 $77 $8 $1,813Capital expenditures $365 $2 $1 $35 $0 $24 $427
111110
PRELIMINARY PUBLIC COPY

111
In millions
In millions, except per share amounts
111 AGL ResouRces inc. 2012 AnnuAl report110
PRELIMINARY PUBLIC COPY

112
113
113112
PRELIMINARY PUBLIC COPY

113
113 AGL ResouRces inc. 2012 AnnuAl report112
PRELIMINARY PUBLIC COPY

114
ITEM 13. CERTAIN RELATIONSHIPS AND RELATED TRANSACTIONS AND DIRECTOR INDEPENDENCE - Director
- ubsequent amendment referred to in Item 10 above. All such information
that is provided in the Proxy Statement is incorporated herein by reference.
ITEM 14. PRINCIPAL ACCOUNTING FEES AND SERVICES
The information required by this item will be set forth un 2 - Ratification of the Appointment of PricewaterhouseCoopers LLP as Our Independent Registered Public Accounting Firm for 2013Statement or subsequent amendment to referred to in Item 10 above. All such information that is provided in the Proxy Statement is incorporated herein by reference. PART IV ITEM 15. EXHIBITS, FINANCIAL STATEMENT SCHEDULES (a) Documents Filed as Part of This Report. (1) Financial Statements Included in Item 8 are the following:
Report of Independent Registered Public Accounting Firm Consolidated Statements of Financial Position as of December 31, 2012 and 2011 Consolidated Statements of Income for the years ended December 31, 2012, 2011 and 2010 Consolidated Statements of Comprehensive Income (Loss) for the years ended December 31, 2012, 2011 and
2010 Consolidated Statements of Equity for the years ended December 31, 2012, 2011 and 2010 Consolidated Statements of Cash Flows for the years ended December 31, 2012, 2011 and 2010 Notes to Consolidated Financial Statements
(2) Financial Statement Schedules Financial Statement Schedule II. Valuation and Qualifying Accounts - Allowance for Uncollectible Accounts and Income Tax Valuations for Each of the Three Years in the Period Ended December 31, 2012. Schedules other than those referred to above are omitted and are not applicable or not required, or the required information is shown in the financial statements or notes thereto.
(3) Exhibits Where an exhibit is filed by incorporation by reference to a previously filed registration statement or report, such registration statement or report is identified in parentheses. The Commission file number reference for any exhibit incorporated by reference is 001-14174, unless otherwise indicated. 2.1 Agreement and Plan of Merger, as amended, among AGL Resources Inc., Apollo Acquisition Corp., Ottawa
Acquisition LLC and Nicor Inc., dated December 6, 2010 (Exhibit 2.1, AGL Resources Inc. Form 8-K filed December 7, 2010).
2.2 Waiver entered into as of February 4, 2011, by and among AGL Resources Inc., Apollo Acquisition Corp. and Nicor Inc. (Exhibit 2.1, AGL Resources Inc. Form 8-K filed February 9, 2011).
3.1 Amended and Restated Articles of Incorporation of AGL Resources Inc., filed December 9, 2011, with the Secretary of State of the state of Georgia (Exhibit 3.1, AGL Resources Inc. Form 8-K filed December 13, 2011).
3.2 Bylaws of AGL Resources Inc., as amended on July 31, 2012 (Exhibit 3.1, AGL Resources Inc. Form 8-K filed August 6, 2012).
4.1 Specimen form of Common Stock certificate (Exhibit 4.1, AGL Resources Inc. Form 10-Q for the fiscal quarter ended September 30, 2007).
4.2.a Specimen AGL Capital Corporation 6.00% Senior Notes due 2034 (Exhibit 4.1, AGL Resources Inc. Form 8-K filed September 27, 2004).
4.2.b Form of Guarantee of AGL Resources Inc. dated as of September 27, 2004 regarding the AGL Capital Corporation 6.00% Senior Notes due 2034 (Exhibit 4.3, AGL Resources Inc. Form 8-K filed September 27, 2004).
4.3.a Specimen AGL Capital Corporation 4.95% Senior Notes due 2015 (Exhibit 4.1, AGL Resources Inc. Form 8-K filed December 21, 2004).
4.3.b Form of Guarantee of AGL Resources Inc. dated as of December 20, 2004 regarding the AGL Capital Corporation 4.95% Senior Notes due 2015 (Exhibit 4.3, AGL Resources Inc. Form 8-K filed December 21, 2004).
115114
PRELIMINARY PUBLIC COPY

115
115 AGL ResouRces inc. 2012 AnnuAl report114
PRELIMINARY PUBLIC COPY

116
Director Compensation Contracts, Plans and Arrangements
Executive Compensation Contracts, Plans and Arrangements
117116
PRELIMINARY PUBLIC COPY

116
Director Compensation Contracts, Plans and Arrangements
Executive Compensation Contracts, Plans and Arrangements
117
117 AGL ResouRces inc. 2012 AnnuAl report116
PRELIMINARY PUBLIC COPY

118
119118
PRELIMINARY PUBLIC COPY

118 119
119 AGL ResouRces inc. 2012 AnnuAl report118
PRELIMINARY PUBLIC COPY

120
121
Chairman, President and Chief Executive Officer
121120
PRELIMINARY PUBLIC COPY

120
121
Chairman, President and Chief Executive Officer
121 AGL ResouRces inc. 2012 AnnuAl report120
PRELIMINARY PUBLIC COPY

122
122
PRELIMINARY PUBLIC COPY

Exhibit 31.1 �– Certification of John W. Somerhalder II pursuant to Rule 13a �– 14(a)
CERTIFICATIONS
I, John W. Somerhalder II, certify that:
1. I have reviewed this annual report on Form 10-K of AGL Resources Inc.; 2. Based on my knowledge, this report does not contain any untrue statement of a material fact or omit to state a
material fact necessary to make the statements made, in light of the circumstances under which such statements were made, not misleading with respect to the period covered by this report;
3. Based on my knowledge, the financial statements, and other financial information included in this report,
fairly present in all material respects the financial condition, results of operations and cash flows of the registrant as of, and for, the periods presented in this report;
4. The registrant's other certifying officer and I are responsible for establishing and maintaining disclosure
controls and procedures (as defined in Exchange Act Rules 13a-15(e) and 15d-15(e)) and internal control over financial reporting (as defined in Exchange Act Rules 13a-15(f) and 15d-15(f)) for the registrant and have:
(a) Designed such disclosure controls and procedures, or caused such disclosure controls and procedures to be designed under our supervision, to ensure that material information relating to the registrant, including its consolidated subsidiaries, is made known to us by others within those entities, particularly during the period in which this report is being prepared;
(b) Designed such internal control over financial reporting, or caused such internal control over financial reporting to be designed under our supervision, to provide reasonable assurance regarding the reliability of financial reporting and the preparation of financial statements for external purposes in accordance with generally accepted accounting principles;
(c) Evaluated the effectiveness of the registrant�’s disclosure controls and procedures and presented in this report our conclusions about the effectiveness of the disclosure controls and procedures, as of the end of the period covered by this report based on such evaluation; and
(d) Disclosed in this report any change in the registrant�’s internal control over financial reporting that occurred during the registrant�’s most recent fiscal quarter (the registrant�’s fourth fiscal quarter in the case of an annual report) that has materially affected, or is reasonably likely to materially affect, the registrant�’s internal control over financial reporting; and
5. The registrant's other certifying officer and I have disclosed, based on our most recent evaluation of internal
control over financial reporting, to the registrant's auditors and the audit committee of the registrant's board of directors (or persons performing the equivalent functions):
(a) All significant deficiencies and material weaknesses in the design or operation of internal control over financial reporting which are reasonably likely to adversely affect the registrant's ability to record, process, summarize and report financial information; and
(b) Any fraud, whether or not material, that involves management or other employees who have a significant role in the registrant's internal control over financial reporting.
Date: February 6, 2013 /s/ John W. Somerhalder II Chairman, President and Chief Executive Officer
123 AGL ResouRces inc. 2012 AnnuAl report
PRELIMINARY PUBLIC COPY

Exhibit 31.2 �– Certification of Andrew W. Evans pursuant to Rule 13a �– 14(a)
CERTIFICATIONS
I, Andrew W. Evans, certify that:
1. I have reviewed this annual report on Form 10-K of AGL Resources Inc.; 2. Based on my knowledge, this report does not contain any untrue statement of a material fact or omit to state a
material fact necessary to make the statements made, in light of the circumstances under which such statements were made, not misleading with respect to the period covered by this report;
3. Based on my knowledge, the financial statements, and other financial information included in this report,
fairly present in all material respects the financial condition, results of operations and cash flows of the registrant as of, and for, the periods presented in this report;
4. The registrant's other certifying officer and I are responsible for establishing and maintaining disclosure
controls and procedures (as defined in Exchange Act Rules 13a-15(e) and 15d-15(e)) and internal control over financial reporting (as defined in Exchange Act Rules 13a-15(f) and 15d-15(f)) for the registrant and have:
(a) Designed such disclosure controls and procedures, or caused such disclosure controls and procedures to be designed under our supervision, to ensure that material information relating to the registrant, including its consolidated subsidiaries, is made known to us by others within those entities, particularly during the period in which this report is being prepared;
(b) Designed such internal control over financial reporting, or caused such internal control over financial reporting to be designed under our supervision, to provide reasonable assurance regarding the reliability of financial reporting and the preparation of financial statements for external purposes in accordance with generally accepted accounting principles;
(c) Evaluated the effectiveness of the registrant�’s disclosure controls and procedures and presented in this report our conclusions about the effectiveness of the disclosure controls and procedures, as of the end of the period covered by this report based on such evaluation; and
(d) Disclosed in this report any change in the registrant�’s internal control over financial reporting that occurred during the registrant�’s most recent fiscal quarter (the registrant�’s fourth fiscal quarter in the case of an annual report) that has materially affected, or is reasonably likely to materially affect, the registrant�’s internal control over financial reporting; and
5. The registrant's other certifying officer and I have disclosed, based on our most recent evaluation of internal
control over financial reporting, to the registrant's auditors and the audit committee of the registrant's board of directors (or persons performing the equivalent functions):
(a) All significant deficiencies and material weaknesses in the design or operation of internal control over financial reporting which are reasonably likely to adversely affect the registrant's ability to record, process, summarize and report financial information; and
(b) Any fraud, whether or not material, that involves management or other employees who have a significant role in the registrant's internal control over financial reporting.
Date: February 6, 2013 /s/ Andrew W. Evans Executive Vice President and Chief Financial Officer
124
PRELIMINARY PUBLIC COPY

CA
LA
MD
ILOH
NY
FL
VA
TN
TX GA
NJ
VIRGINIA BEACHVIRGINIA BEACH
CHATTANOOGACHATTANOOGA
BERKELEY HEIGHTSBERKELEY HEIGHTS
NAPERVILLENAPERVILLE
IN
KY
PA
MA
AGL Resources serves approximately 4.5 million end-use customers in seven states through its utility subsidiaries within the distribution operations segment: Nicor Gas in Illinois, Atlanta Gas Light in Georgia, Virginia Natural Gas in Virginia, Elizabethtown Gas in New Jersey, Florida City Gas in Florida, Chattanooga Gas in Tennessee and Elkton Gas in Maryland. Our retail operations segment serves approximately 1.5 million retail customers and markets natural gas and related home services to end-use customers in more than 9 states. Our Houston based wholesale services segment provides natural gas storage and arbitrage and related activities, natural gas asset management and related logistics activities for each of our utilities as well as for non-affiliated companies. Our midstream operations segment provides natural gas storage arbitrage and related activities and engages in the development and operation of high-deliverability natural gas storage assets. These include Jefferson Island Storage & Hub near the Henry Hub in Louisiana, Golden Triangle Storage in Beaumont, Texas and Central Valley Gas Storage, in northern California. We are also involved in the shipping industry through our cargo shipping segment, which owns and operates Tropical Shipping, one of the largest containerized cargo carriers serving the Bahamas and the Caribbean.
Financial Highlights In millions, except per share amounts and market price 2012 2011
Operating revenues $ 3,922 $ 2,338
Net income attributable to AGL Resources Inc. $ 271 $ 172
Earnings per common share attributable to AGL Resources Inc. common shareholders Basic $ 2.32 $ 2.14 Diluted $ 2.31 $ 2.12
Dividends declared per common share $ 1.74 $ 1.90
Market capitalization (year-end) $ 4,711 $ 4,946
Market price (year-end, closing) $ 39.97 $ 42.26
Total assets $ 14,141 $ 13,913
Total shareholder return (1%) 24%
Adjusted Diluted Earnings per share
Indicated Annual Dividend per share
0.0
0.5
1.0
1.5
2.0
2008 2009 20101 20111 20121
$2.84 $2.88 $3.05 $2.92 $2.46
2008 2009 2010 20111 20121
$1.68 $1.72 $1.76 $1.80 $1.84
(1) For a reconciliation of adjusted EPS (which excludes costs related to the Nicor merger and additional accrual for the Nicor Gas PBR issue) to GAAP EPS, see our non-GAAP reconciliation section included within this report.
(1) Indicated 2011 and 2012 dividend rate. As a result of the Nicor merger, AGL Resources shareholders of record as of the close of business on December 8, 2011, received a pro rata dividend of $.0.0989 for the stub period accruing from November 19, 2011 for a total dividend of $1.90. This same $0.0989 would have been added to the $1.74 dividends paid in 2012 if it were not for the Nicor merger.
0.0
0.5
1.0
1.5
2.0
2008 2009 20101 20111 20121
$2.84 $2.88 $3.05 $2.92 $2.46
2008 2009 2010 20111 20121
$1.68 $1.72 $1.76 $1.80 $1.84
PRINCIPAL AREAS OF BUSINESS FOR RETAIL OPERATIONSNATURAL GAS STORAGE FACILITIESNATURAL GAS STORAGE FACILITIESCARGO SHIPPINGCARGO SHIPPINGCORPORATE HEADQUARTERSCORPORATE HEADQUARTERS
PRINCIPAL AREAS OF BUSINESS FOR RETAIL OPERATIONS
SERVICE TERRITORY FOR UTILITIESSERVICE TERRITORY FOR UTILITIES
Comparison of Five-Year Cumulative Total Return*
The following graph compares the cumulative five-year total return provided shareholders on AGL Resources Inc’s common stock relative to the cumulative total returns of the S&P 500 index, and a customized peer group of twelve companies listed in footnote 1 below. An investment of $100 (with reinvestment of all dividends) is assumed to have been made in our common stock, in the peer group, and the index on 12/31/2007 and its relative performance is tracked through 12/31/2012.
1 There are twelve companies included in the customized peer group which are: Atmos Energy
Corp., Centerpoint Energy Inc., Integrys Energy Group Inc., New Jersey Resources Corp.,
NiSource Inc., Oneok Inc., Piedmont Natural Gas Company Inc., Sempra Energy, Southwest
Gas Corp., UGI Corp., Vectren Corp. and WGL Holdings Inc.
Annual Meeting
The 2013 annual meeting of shareholders will be held Tuesday, April 30, 2013, at AGL Resources’ corporate headquarters, Ten Peachtree Place, N.E., Atlanta, GA 30309.
ResourcesDIRECTTM
New investors may make an initial investment, and shareholders of record may acquire additional shares of our common stock, through ResourcesDIRECTTM without paying brokerage fees or service charges. Initial cash investments, quarterly cash dividends and/or optional cash purchases may be invested through the plan prospectus and enrollment materials. Contact our transfer agent at 800-468-9716 or visit our website at aglresources.com.
Holders of Common Stock, Stock Price and Dividend InformationAt January 31, 2013, there were 22,221 record holders of our common stock. Quarterly information concerning our high and low stock prices and cash dividends paid in 2012 and 2011 is as follows:
2012 Sales price of common stock Cash dividend per
Quarter ended High Low Close common share
March 31, 20121 $42.88 $38.42 $39.22 $0.36June 30, 2012 40.29 36.59 38.75 0.46September 30, 2012 41.95 38.45 40.91 0.46December 31, 2012 41.71 36.90 39.97 0.46 $1.74
2011 Sales price of common stock Cash dividend per
Quarter ended High Low Close common share
March 31, 2011 $39.91 $35.65 $39.84 $0.45June 30, 2011 42.34 38.58 40.71 0.45September 30, 2011 42.40 34.08 40.74 0.45December 31, 20111 43.69 37.95 42.26 0.55 $1.90
1 As a result of the Nicor merger, AGL Resources shareholders of record as
of the close of business on December 8, 2011, received a pro rata dividend
of $0.0989 for the stub period, accruing from November 19, 2011, which
increased the fourth quarter 2011 dividend and reduced the first quarter 2012
dividend by an equal amount. For presentation purposes the amount in the
table was rounded to $0.10.
We have historically paid dividends to common shareholders four times a year: March 1, June 1, September 1 and December 1. We have paid 261 consecutive quarterly dividends beginning in 1948. Our common shareholders may receive dividends when declared at the discretion of our Board of Directors, and payment of future dividends will depend on our future earnings, cash flow, financial requirements and other factors. In February 2013, we increased our quarterly dividend to $0.47 per share.
0
20
40
60
80
100
120
140
160
0
20
40
60
80
100
120
140
160
12/07 12/08 12/09 12/10 12/11 12/12
AGL ResourcesS&P 500Peer Group
12/07 12/08 12/09 12/10 12/11 12/12
AGL Resources Inc 100.00 87.59 107.40 110.62 136.73 135.22S&P 500© 100.00 63.00 79.67 91.67 93.61 108.59Peer Group 100.00 79.80 99.17 111.88 139.15 152.08
* $100 invested on 12/31/07 in stock or index, including reinvestment of dividends.
Fiscal year ending December 31.
Copyright© 2013 S&P, a division of The McGraw-Hill Companies Inc. All rights reserved.
The stock price performance included in this graph is not necessarily indicative of future stock price performance.
Stock Exchange Listing
Our common stock is traded on the New York Stock Exchange under the symbol “GAS” and quoted in The Wall Street Journal as “AGL Res.”
Corporate Overview
PRELIMINARY PUBLIC COPY

Expanding Opportunities2012 Annual Report
aglresources.com
AG
L R
ES
OU
RC
ES
INC
. AN
NU
AL
RE
PO
RT
20
12
PRELIMINARY PUBLIC COPY

Attachment 9
Footnotes to AGL Resources Inc.’s Financial Statements Setting Forth
Federal Income Taxes In Annual Reports
2004 - 2012
PRELIMINARY PUBLIC COPY

PRELIMINARY PUBLIC COPY

PRELIMINARY PUBLIC COPY

PRELIMINARY PUBLIC COPY

PRELIMINARY PUBLIC COPY

PRELIMINARY PUBLIC COPY
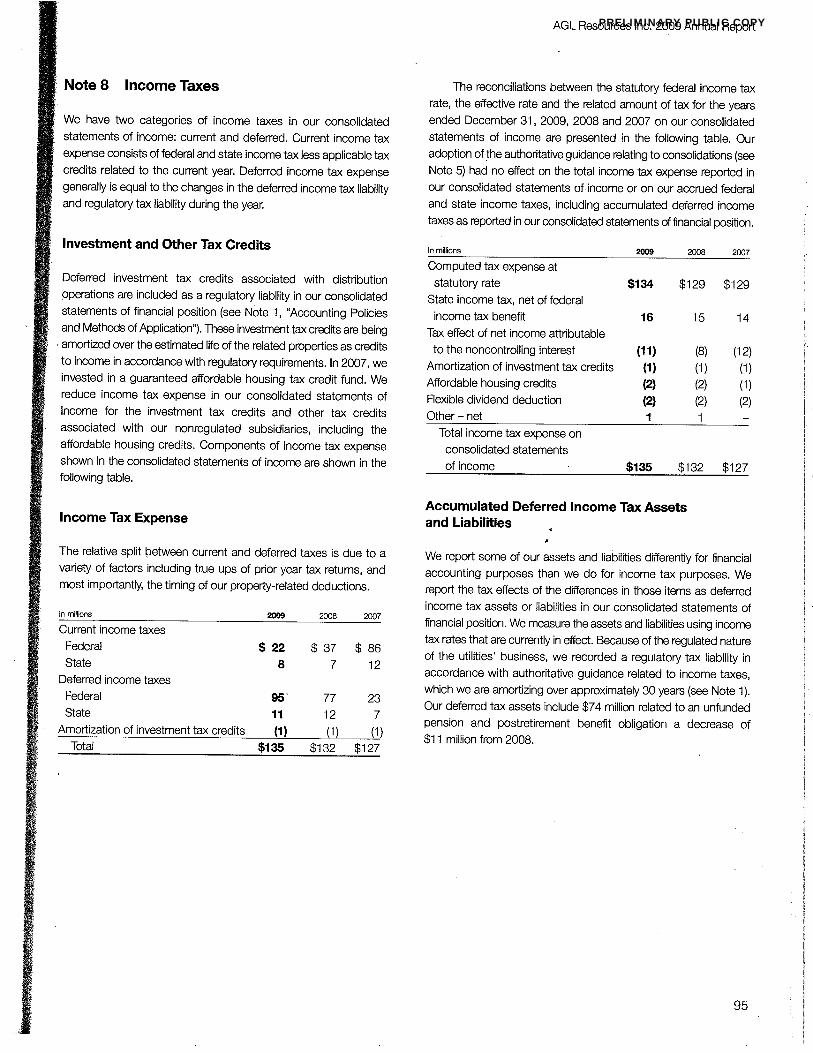
PRELIMINARY PUBLIC COPY

PRELIMINARY PUBLIC COPY
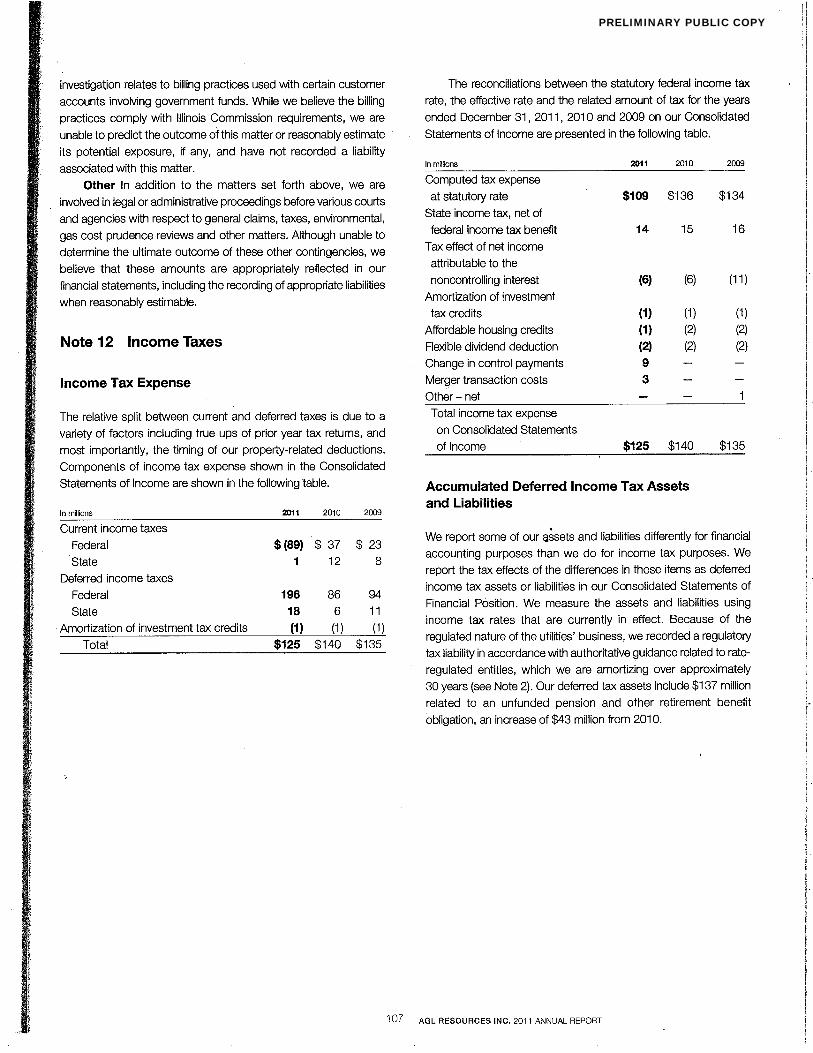
PRELIMINARY PUBLIC COPY

PRELIMINARY PUBLIC COPY