atomic-scale determination of surface facets in gold …ematweb.cmi.ua.ac.be/emat/pdf/1854.pdf ·...
TRANSCRIPT

LETTERSPUBLISHED ONLINE: 21 OCTOBER 2012 | DOI: 10.1038/NMAT3462
Atomic-scale determination of surface facets ingold nanorodsBart Goris1, Sara Bals1*, Wouter Van den Broek1,3, Enrique Carbó-Argibay2, Sergio Gómez-Graña2,Luis M. Liz-Marzán2 and Gustaaf Van Tendeloo1
It is widely accepted that the physical properties of nanostruc-tures depend on the type of surface facets1,2. For Au nanorods,the surface facets have a major influence on crucial effectssuch as reactivity and ligand adsorption and there has beencontroversy regarding facet indexing3,4. Aberration-correctedelectron microscopy is the ideal technique to study the atomicstructure of nanomaterials5,6. However, these images corre-spond to two-dimensional (2D) projections of 3D nano-objects,leading to an incomplete characterization. Recently, muchprogress was achieved in the field of atomic-resolution electrontomography, but it is still far from being a routinely usedtechnique. Here we propose a methodology to measure the3D atomic structure of free-standing nanoparticles, which weapply to characterize the surface facets of Au nanorods. Thismethodology is applicable to a broad range of nanocrystals,leading to unique insights concerning the connection betweenthe structure and properties of nanostructures.
A thorough understanding of the atomic structure of free-standing nanocrystals and the formation of facets at their surfaceis required to optimize their properties. For Au nanocrystals, itis known that the catalytic and optical properties can be tunedin a reproducible manner by controlling their morphology7,8.Surface morphologies of nanocrystals can be characterized inthree dimensions using electron tomography9–11, but often theresolution is insufficient to allow a straightforward characterizationof the crystallographic planes at the surface. Significant progress,pushing the resolution in three dimensions to the atomic level,has recently been achieved12–14. On the basis of a limited numberof high-angle annular dark-field scanning transmission electronmicroscopy (HAADF-STEM) images, a 3D reconstruction at theatomic scale could be obtained for aAg nanoparticle with a diameterof approximately 3 nm, which was embedded in an Al matrix.These results were obtained using advanced statistical parameterestimation and so-called discrete tomography12. This approach wasbased on the assumption that all atom positions are fixed on a gridand this has been shown to be a good starting point to obtain uniqueinsights concerning the formation of nanoparticles. However, forlarger particles it becomes more challenging or impossible to countthe atoms in a column in a straightforward manner. Therefore,other approaches should be explored. The use of prior knowledgein such 3D reconstruction techniques should be avoided to enablean unbiased and direct indexation of the surface facets. Recently,the atomic-scale reconstruction of a distorted icosahedral multiplytwinnedAunanoparticle with a diameter of∼10 nmwas reported14.Although not all atoms could be located in this reconstruction,valuable information concerning lattice parameters and grains
1Electron Microscopy for Materials Research (EMAT), University of Antwerp, Groenenborgerlaan 171, 2020 Antwerp, Belgium, 2Departamento de QuímicaFísica, Universidade de Vigo, 36310 Vigo, Spain, 3Institute for Experimental Physics, Ulm University, Albert-Einstein-Allee 11, 89081 Ulm, Germany.*e-mail: [email protected].
inside the particle could be obtained. It must be noted however that55 images were required to obtain this 3D reconstruction.
Here, we propose a compressive-sensing-based 3D reconstruc-tion algorithm, which enables us to completely characterize the3D atomic lattice of free-standing Au nanorods. On the basis ofa limited number of HAADF-STEM projection images, a high-quality 3D reconstruction of the atomic structure is obtainedwithout the use of any prior knowledge. From the final recon-struction, the surface facets of the rods can be characterized witha high precision. In addition, imperfections at the atomic scaleand surface relaxation are studied. We applied our approach toAu nanorods, which have important applications in the field ofnanoplasmonics, but the methodology is applicable to a widevariety of nanostructures.
As a result of their well-defined anisotropy and the interactionbetween shape and optical response, Au nanorods have beenstudied extensively3,4,15. We investigated Au nanorods, obtainedby seed-mediated growth in aqueous solution, assisted by thesurfactant cetyltrimethylammonium bromide (CTAB) and Ag+ions16. In addition, as Au nanorods prepared by seeded growthin the presence of a gemini surfactant were recently used for theanalysis of nanorod crystallography3, we also studied these forcomparison. More details concerning the synthesis procedure canbe found in the Methods. Electron tomography at relatively lowmagnification in combination with electron diffraction was used todetermine the overall morphology of the rods. The details of thisprocedure are discussed in the Methods. The results are presentedin Fig. 1a,b, revealing a facetedmorphology for both types of rod, inagreement with previous reports3,4,17. However, the resolution thatcan be obtained at this magnification prevents correct indexing ofthe side facets of these reconstructions.
These observations are complemented by intensity profilesacquired from high-resolution HAADF-STEM images. HAADF-STEM yields a signal that is proportional to the thickness of thespecimen and to the atomic mass of the atoms in the sample18–20.In this case, the HAADF-STEM intensity therefore corresponds toa thickness profile of the Au nanorods. For both types of nanorod,a HAADF-STEM image is acquired along a [110] zone axis asshown in Fig. 1c,e. The intensity profile acquired along the directionperpendicular to the major axis is shown in Fig. 1f,h. These resultssuggest that the morphology of the rod grown with CTAB ismainly composed of {110} and {100} facets as illustrated by thecorrespondence with themodel in Fig. 1d,g, in agreement with earlycharacterization17. This analysis also indicates that the morphologyof the rods grown with the gemini surfactant deviates from thismodel structure, as recently reported3.
930 NATURE MATERIALS | VOL 11 | NOVEMBER 2012 | www.nature.com/naturematerials
© 2012 Macmillan Publishers Limited. All rights reserved

NATURE MATERIALS DOI: 10.1038/NMAT3462 LETTERS
[001] [001]
8 nm 8 nm
3 nm 3 nm
C grid
CTAB Gemini
[110][110]
CTAB Gemini
[110]Electron beam
Inte
nsity
(a.
u.)
1
3 6 9 12Distance (nm)
150
Inte
nsity
(a.
u.)
1
0
1
Inte
nsity
(a.
u.)
03 6 9 12
Distance (nm)0 15
a b
c d e
f g h
Figure 1 | Comparison between Au nanorods grown with CTAB and gemini surfactants. a,b, 3D visualizations of tomographic reconstructions of bothtypes of nanorod. Crystal facets are visible in both tomographic reconstructions. c–e, High-resolution HAADF-STEM projections of both nanorods orientedalong the [110] direction. f,g, The intensity profile acquired from the first projection (f) corresponds to a model where the morphology is composed of {110}and {100} facets (d,g). h, The intensity profile acquired from the projection of the rod grown with the gemini surfactant clearly shows a deviation fromthis model.
The analysis described above presents a first step towardsthe full 3D characterization of the morphology of the nanorods.Next, four different high-resolution HAADF-STEM images wereacquired along different zone axes ([100], [110], [010] and [1̄10])for nanorods prepared using the CTAB surfactant and nanorodsgrown with the gemini surfactant. After alignment of the images,they are used as an input for a tomographic reconstructionalgorithm based on compressive sensing21,22. Compressive sensingis a technique specialized in finding a solution that has a sparserepresentation to a set of linear equations. Recently, the advantagesof using compressive sensing for electron tomography weredemonstrated for reconstructions with nanoscale resolution23,24.For 3D reconstructions at the atomic scale, it is valid toexploit the sparsity of the object (and its 3D reconstruction)as only a limited number of voxels contain an atom and mostvoxels correspond to vacuum. Using this prior knowledge ina tomographic reconstruction algorithm will result in a more
reliable atomic-scale reconstruction as compared with moreconventional reconstruction algorithms such as the simultaneousiterative reconstruction technique25 (SIRT). Another advantage isthat because of the sparsity incorporated in the reconstructionalgorithm, a very limited number of projections is sufficient tocreate a faithful reconstruction of the atomic lattice. It shouldbe noted that although we assume the object to be sparse, noassumptions aremade concerning the positions of the atoms.
In a conventional SIRT algorithm, one starts with a first 3D re-construction that is re-projected along the directions of the originalacquisition angles. The difference between the (2D) re-projectionsand the original (2D) projections is called the projection error.When using SIRT, this projection error is iteratively minimized byadding the reconstructed projection error to the previous interme-diate reconstruction. Mathematically, a tomographic reconstruc-tion corresponds to reconstructing an object x starting from itsprojections b, which are acquired by a projection operator A. The
NATURE MATERIALS | VOL 11 | NOVEMBER 2012 | www.nature.com/naturematerials 931
© 2012 Macmillan Publishers Limited. All rights reserved

LETTERS NATURE MATERIALS DOI: 10.1038/NMAT3462
a b
{101}
{101}
{100}
{110} {110}{010} {010}
{011}
{011}
[001] [001]
[100] [100]
[010] [010]
{250}
{520}
CTAB Gemini
Figure 2 | 3D reconstruction of Au nanorods. a, Three orthogonal slices through the reconstruction of a nanorod grown with CTAB, showing individualatom positions. It can be seen that {110} and {100} facets compose the morphology of the rod. The tip is rounded, with clear terraces at the {101} planes.b, Three corresponding slices through a reconstruction of a nanorod synthesized with the gemini surfactant. For this rod a more rounded morphology of thecross-section is observed including {520} facets. The facets composing the tip of the nanorod are comparable to these of the nanorod grown with CTAB.
tomographic reconstruction then often corresponds to iterativelysolving the followingminimization problem.
x̂ = argminx‖Ax−b‖22
In the compressive-sensing algorithm employed in this work,an additional penalty parameter λ is introduced leading to asimultaneous minimization of the projection error and the L1-norm of the object (that is, the sum of the absolute values of all thevoxels in the reconstructed object)26:
x̂ = argminx
[‖Ax−b‖22+λ‖x‖1
]The reliability of the reconstruction algorithm is confirmed bysimulations as shown in the Supplementary Information. All atoms,and therefore also all surface facets, can be recovered in thissimulation experiment.
This reconstruction algorithmwas applied to the high-resolutionHAADF-STEM images for both types of Au nanorod. Moreinformation on the practical implementation can be found inthe Methods. A visualization of the final result is presented inFig. 2a,b, where orthogonal slices through the 3D reconstruction ofthe rods synthesized with the CTAB and the gemini surfactant arepresented, respectively.
From the reconstruction presented in Fig. 2a, it can be directlyconcluded that the cross-section of the rod grown with CTABis bound by alternating {100} and {110} planes, as proposedpreviously17. This is in agreement with the HAADF-STEM profilespresented in Fig. 1. From the 3D reconstruction presented inFig. 2b, the facets of the rod grown using the gemini surfactant canbe characterized as {520} planes. These facets were also observedin a previous study3 where high-resolution transmission electronmicroscopywas performed onAunanorods standing perpendicularon the support grid. As can be observed in Fig. 2, the tip of bothnanorods has a rounded morphology with well-defined terracescorresponding to {110} facets.
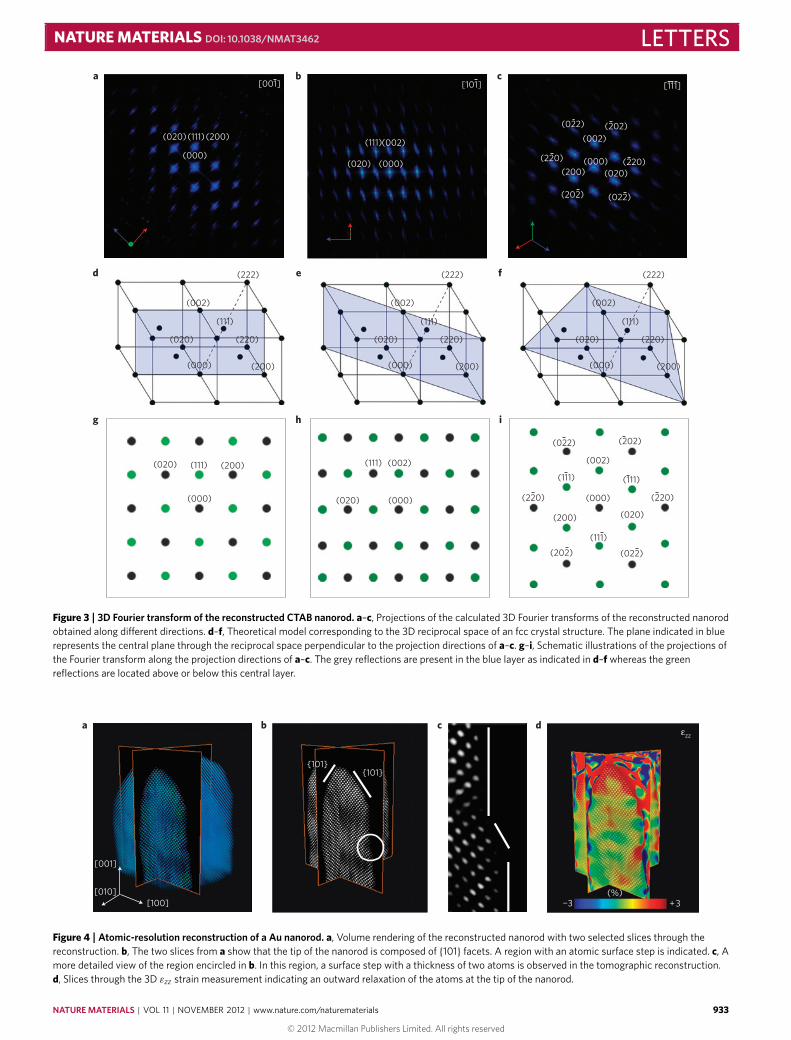
For the reconstruction obtained for the nanorod grown usingCTAB, a 3D Fourier transform was calculated. Projections fromthis Fourier transform are shown in Fig. 3a–c. An animated viewof the 3D Fourier transform can be found in the SupplementaryInformation. The projections of the Fourier space along the
[100], [110] and [111] directions are in good agreement with thetheoretical models for a face-centred-cubic (fcc) crystal lattice,which are illustrated in Fig. 3d–i. A 3D model of the reciprocallattice is illustrated in Fig. 3d–f whereas projections of the reciprocallattice are presented in Fig. 3g–i. The correspondence between themodel and the experimental Fourier transform of the tomographicreconstruction is remarkable because no prior knowledge aboutthe crystal structure was used during the reconstruction process.The ability to characterize the boundary facets at the atomic scaleis of great importance to understand the growth, reactivity andadsorption properties of these nanorods. In fact, observation ofdifferent types of boundary facet for nanorods obtained throughslightly different synthetic procedures raises further questionsregarding nanocrystal growth and stability.
Although the facets composing the morphology can be clearlyrecognized in the final reconstructions, also more detailed infor-mation at the atomic scale can be extracted from the reconstruction.Figure 4c, corresponding to amore detailed viewof Fig. 4a,b, revealsthe presence of an atomic surface step with a thickness of twoatomic layers. This surface terrace is located at a {001} side facetand it is clear that this step will have an impact on the surfaceenergy andmany related nanoscale phenomena, including catalytic,mechanical and electronic properties27,28.
It is important to note that the atom positions are not assumedto be fixed during the reconstruction process. Therefore, thereconstruction presented in Fig. 2 can serve as a starting pointto investigate strain in three dimensions. Here, we apply thegeometrical phase analysis (GPA) to a 3D reconstruction ratherthan to a 2D projection of a 3D object29,30. More details on theapproach and its reliability can be found in the methodologysection, whereas the reliability of the approach is discussed, on thebasis of simulation experiments, in the Supplementary Information.By selecting three reflections for GPA analysis, we obtain the full3D εzz strain field, which is presented in Fig. 4d. A referenceregion where no strain is present was selected in the middle ofthe nanorod. This implies that all strain measurements are relativewith respect to this reference region. The colour code in Fig. 4dcorresponds to the strain in the nanorod and is scaled between−3% (blue) and +3% (red). The error on these measurementsis estimated through simulation experiments (as explained in theSupplementary Information) and equals ±1.3%. It is likely that
932 NATURE MATERIALS | VOL 11 | NOVEMBER 2012 | www.nature.com/naturematerials
© 2012 Macmillan Publishers Limited. All rights reserved
NATURE MATERIALS DOI: 10.1038/NMAT3462 LETTERS
[001] [101]
(022)
[111]
(020)(111)
(000)
(200)(002)(111)
(202)(002)
(000)(200) (020)
(220)
(022)(202)
(220)
(222)
(002)
(111)
(220)(020)
(200)(000)
(000)
(222)
(002)
(111)
(220)(020)
(200)(000)
(222)
(002)
(111)
(111)
(220)(020)
(200)(000)
(111)(020) (200)
(200)
(111) (002)
(022) (202)
(002)
(000)
(020)
(111)
(111)
(220)
(022)(202)
(220)(000)(020)
a b c
d e f
g h i
(000)(020)
Figure 3 | 3D Fourier transform of the reconstructed CTAB nanorod. a–c, Projections of the calculated 3D Fourier transforms of the reconstructed nanorodobtained along different directions. d–f, Theoretical model corresponding to the 3D reciprocal space of an fcc crystal structure. The plane indicated in bluerepresents the central plane through the reciprocal space perpendicular to the projection directions of a–c. g–i, Schematic illustrations of the projections ofthe Fourier transform along the projection directions of a–c. The grey reflections are present in the blue layer as indicated in d–f whereas the greenreflections are located above or below this central layer.
[010]
[001]
[100]
{101}
¬3 +3(%)
εzz
{101}
a b c d
Figure 4 | Atomic-resolution reconstruction of a Au nanorod. a, Volume rendering of the reconstructed nanorod with two selected slices through thereconstruction. b, The two slices from a show that the tip of the nanorod is composed of {101} facets. A region with an atomic surface step is indicated. c, Amore detailed view of the region encircled in b. In this region, a surface step with a thickness of two atoms is observed in the tomographic reconstruction.d, Slices through the 3D εzz strain measurement indicating an outward relaxation of the atoms at the tip of the nanorod.
NATURE MATERIALS | VOL 11 | NOVEMBER 2012 | www.nature.com/naturematerials 933
© 2012 Macmillan Publishers Limited. All rights reserved

LETTERS NATURE MATERIALS DOI: 10.1038/NMAT3462
because of this uncertainty the strain field in the centre of thenanorod shows slight deviations from the equilibrium value. Thecorresponding reconstructed atomic lattice is shown in Fig. 4a,b.Figure 4a shows a 3D rendering, whereas in Fig. 4b orthoslicesthrough the reconstruction are presented. This atomic-scale 3Dreconstruction in combination with the 3D εzz strain field providesunique information about the relationship between the atomiclattice and the intrinsic strain present in the nanorod. For example,it is clear that the tip of the nanorod is (approximately 3%)positively strained at its end. The measured anisotropy present inthe εzz strainmapmay be of importance towards understanding theoptical properties of the nanorods1,31.
Using high-resolution HAADF-STEM projection images thefcc crystal lattice of the Au nanorods has been reproducedwithout prior knowledge of the atomic structure. In this waythe side facets of the rods have been precisely determined. Usingour approach, 3D strain measurements can be obtained andcorrelated to the atomic lattice of a nano-object. Although themethodology proposed is applied only to pure Au nanorods,it clearly opens perspectives for the 3D atomic visualizationof different nanomaterials, including intermetallics, core–shellnanoparticles and bimetallic nanocrystals. Further options are the3D measurement of surface relaxation at nanomaterials, hopefullyleading to a better understanding of the opto-electronic propertiesof some of these materials.
MethodsSample preparation. Au nanorods were synthesized using the well-knownseeded-growth method16. Au nanorods with {520} boundary facets were preparedby overgrowth in the presence of a gemini surfactant, as recently reported32. Thenanorods were then dispersed in H2O, deposited on a C grid and plasma cleanedwith a H2/O2 gas mixture for 15 s.
Low-magnification tomography. A low-magnification HAADF-STEM tilt serieswas acquired in the HAADF-STEM mode as described previously. The tiltangles for the CTAB-synthesized rod ranged from −75◦ to +60◦ with a 5◦ tiltincrement. For the nanorod grown with gemini, the tilt series ranges between−72◦ and +74◦ with an increment of 2◦ between two successive tilt angles.Alignment of the tilt series was done using a combination of cross-correlationmethods in FEI Inspect3D and a manual alignment performed in the IMODsoftware33. The reconstruction was performed with a total variation minimizationreconstruction algorithm to minimize artefacts in the reconstruction23. Beforeimage acquisition, an electron diffraction pattern was recorded to facilitate indexingof the final reconstructions.
HAADF-STEM imaging. HAADF-STEM imaging was performed at anaberration-corrected cubed FEI Titan 50-80 operated at 300 kV. During the tiltexperiments, the investigated samples were mounted on a motorized rotationtomography Fischione 2040 holder. This holder can both rotate the sample in planeand tilt the sample over an angular range of±75◦ enabling us to reach four differentmajor zone axes. The four zone axes that are used correspond to the [100], the[110], the [010] and the [1̄10] axis. A probe semi convergence angle of 21.4 mradwas used during the acquisition. The HAADF detector was mounted at a cameralength of 110mm to guarantee incoherent imaging of the Au nanorod. To reducesample drift during the experiment, the specimen holder was allowed to relax aftereach tilting step for several minutes before image acquisition.
High-resolution tomography. The 3D atomic lattice of the Au nanorodsis determined using a compressive-sensing-based reconstruction algorithmwhere four HAADF-STEM projections are used as input. Alignment of theimages was done by calculating the centre of mass in each projection asproposed previously14. The reconstructions were calculated on the basis of theiterative compressive-sensing algorithm as explained above. This algorithmwas implemented in Matlab using a penalty parameter λ of 0.5. Earlierwork and simulation experiments showed that this is a suitable value23. Tominimize remaining fanning artefacts for the reconstruction shown in Fig. 2b,a convolution in Fourier Space was carried out with the reconstruction shownin Fig. 1b. More details on the implementation and simulation experimentsconfirming the validity of this reconstruction technique are provided in theSupplementary Information.
GPA. 3D GPA was implemented in Matlab by selecting three reciprocal latticepoints. During the 3D GPA analysis, a Gaussian selection window was used withsuch a diameter that the spatial resolution of the strain determination equals 1 nm.
Received 29 June 2012; accepted 17 September 2012;published online 21 October 2012
References1. Pecharroman, C., Perez-Juste, J., Mata-Osoro, G., Liz-Marzan, L. M. &
Mulvaney, P. Redshift of surface plasmonmodes of small gold rods due to theiratomic roughness and end-cap geometry. Phys. Rev. B 77, 035418 (2008).
2. Chang, L. Y., Barnard, A. S., Gontard, L. C. & Dunin-Borkowski, R. E.Resolving the structure of active sites on platinum catalytic nanoparticles.Nano. Lett. 10, 3073–3076 (2010).
3. Carbo-Argibay, E. et al. The crystalline structure of gold nanorodsrevisited: Evidence for higher-index lateral facets. Angew. Chem. Int. Ed.49, 9397–9400 (2010).
4. Katz-Boon, H. et al. Three-dimensional morphology and crystallography ofgold nanorods. Nano Lett. 11, 273–278 (2011).
5. Batson, P. E., Dellby, N. & Krivanek, O. L. Sub-ångstrom resolution usingaberration corrected electron optics. Nature 418, 617–620 (2002).
6. Erni, R., Rossell, M. D., Kisielowski, C. & Dahmen, U. Atomic-resolutionimaging with a Sub-50-pm electron probe. Phys. Rev. Lett. 102, 096101 (2009).
7. Valden, M., Lai, X. & Goodman, D. W. Onset of catalytic activity of goldclusters on titania with the appearance of nonmetallic properties. Science 281,1647–1650 (1998).
8. Grzelczak, M., Perez-Juste, J., Mulvaney, P. & Liz-Marzan, L. M. Shape controlin gold nanoparticle synthesis. Chem. Soc. Rev. 37, 1783–1791 (2008).
9. Midgley, P. A. &Dunin-Borkowski, R. E. Electron tomography and holographyin materials science. Nature Mater. 8, 271–280 (2009).
10. Midgley, P. A. & Weyland, M. 3D electron microscopy in the physical sciences:The development of Z-contrast and EFTEM tomography. Ultramicroscopy 96,413–431 (2003).
11. Midgley, P. A., Ward, E. P. W., Hungria, A. B. & Thomas, J. M.Nanotomography in the chemical, biological and materials sciences.Chem. Soc. Rev. 36, 1477–1494 (2007).
12. Van Aert, S., Batenburg, K. J., Rossell, M. D., Erni, R. & Van Tendeloo, G.Three-dimensional atomic imaging of crystalline nanoparticles. Nature 470,374–377 (2011).
13. Bals, S. et al. Three-dimensional atomic imaging of colloidal core-shellnanocrystals. Nano. Lett. 11, 3420–3424 (2011).
14. Scott, M. C. et al. Electron tomography at 2.4-ångström resolution. Nature483, 444–447 (2012).
15. Perez-Juste, J., Pastoriza-Santos, I., Liz-Marzan, L. M. & Mulvaney, P. Goldnanorods: Synthesis, characterization and applications. Coordin. Chem. Rev.249, 1870–1901 (2005).
16. Nikoobakht, B. & El-Sayed, M. A. Preparation and growth mechanism ofgold nanorods (NRs) using seed-mediated growth method. Chem. Mater. 15,1957–1962 (2003).
17. Wang, Z. L., Mohamed, M. B., Link, S. & El-Sayed, M. A. Crystallographicfacets and shapes of gold nanorods of different aspect ratios. Surf. Sci. 440,L809–L814 (1999).
18. Hartel, P., Rose, H. & Dinges, C. Conditions and reasons for incoherentimaging in STEM. Ultramicroscopy 63, 93–114 (1996).
19. Krivanek, O. L. et al. Atom-by-atom structural and chemical analysis byannular dark-field electron microscopy. Nature 464, 571–574 (2010).
20. Nellist, P. D. & Pennycook, S. J. The principles and interpretation ofannular dark-field Z-contrast imaging. Adv. Imag. Elect. Phys. 113,147–203 (2000).
21. Candes, E. J. & Wakin, M. B. An introduction to compressive sampling.IEEE Signal Proc. Mag. 25, 21–30 (2008).
22. Donoho, D. L. Compressed sensing. IEEE Trasns. Inform. Theory 52,1289–1306 (2006).
23. Goris, B., Van den Broek, W., Batenburg, K. J., Mezerji, H. H. & Bals, S.Electron tomography based on a total variation minimization reconstructiontechnique. Ultramicroscopy 113, 120–130 (2012).
24. Saghi, Z. et al. Three-Dimensional morphology of iron oxide nanoparticleswith reactive concave surfaces. A compressed sensing-electron tomography(CS-ET) approach. Nano Lett. 11, 4666–4673 (2011).
25. Gilbert, P. Iterative methods for the three-dimensional reconstruction of anobject from projections. J. Theoret. Biol. 36, 105–117 (1972).
26. Kim, S. J., Koh, K., Lustig, M., Boyd, S. & Gorinevsky, D. An interior-pointmethod for large-scale l(1)-regularized least squares. IEEE J-Stsp 1,606–617 (2007).
27. Seo, J. et al. Transmission of topological surface states through surface barriers.Nature 466, 343–346 (2010).
28. Alivisatos, A. P. Semiconductor clusters, nanocrystals, and quantum dots.Science 271, 933–937 (1996).
29. Hytch, M. J., Snoeck, E. & Kilaas, R. Quantitative measurement ofdisplacement and strain fields from HREM micrographs. Ultramicroscopy 74,131–146 (1998).
30. Johnson, C. L. et al. Effects of elastic anisotropy on strain distributions indecahedral gold nanoparticles. Nature Mater. 7, 120–124 (2008).
934 NATURE MATERIALS | VOL 11 | NOVEMBER 2012 | www.nature.com/naturematerials
© 2012 Macmillan Publishers Limited. All rights reserved

NATURE MATERIALS DOI: 10.1038/NMAT3462 LETTERS31. Ouyang, G., Zhu, W. G., Sun, C. Q., Zhu, Z. M. & Liao, S. Z. Atomistic origin
of lattice strain on stiffness of nanoparticles. Phys. Chem. Chem. Phys. 12,1543–1549 (2010).
32. Guerrero-Martinez, A., Perez-Juste, J., Carbo-Argibay, E., Tardajos, G. &Liz-Marzan, L. M. Gemini-surfactant-directed self-assembly of monodispersegold nanorods into standing superlattices. Angew. Chem. Int. Ed. 48,9484–9488 (2009).
33. Kremer, J. R., Mastronarde, D. N. & McIntosh, J. R. Computer visualization ofthree-dimensional image data using IMOD. J. Struct. Biol. 116, 71–76 (1996).
AcknowledgementsWe thank A. Rosenauer from IFP, Bremen, for the use of the STEMsim program and A.Béché from FEI for his technical advice. The work was supported by the Flemish Fundfor Scientific Research (FWO Vlaanderen) through a PhD research grant to B.G. G. VanTendeloo acknowledges financial support from the European Research Council (ERCAdvanced Grant 24691—COUNTATOMS). L.M.L-M. acknowledges financial supportfrom the European Research Council (ERC Advanced Grant 267867—PLASMAQUO).The authors appreciate financial support from the European Union under the Seventh
Framework Program (Integrated Infrastructure Initiative N. 262348 European SoftMatter Infrastructure, ESMI). The authors also acknowledge financial support from theFlemish Hercules 3 programme for large infrastructure.
Author contributionsB.G. and S.B. performed the experiments and analysed the 3D reconstructions, B.G.and W.V.d.B. developed the reconstruction algorithm, E.C-A., S.G-G. and L.M.L-M.carried out particle synthesis and interpreted the results, G.V.T. contributed to themethodology, the interpretation and to the redaction. All the authors read andcommented on the paper.
Additional informationSupplementary information is available in the online version of the paper. Reprints andpermissions information is available online at www.nature.com/reprints. Correspondenceand requests for materials should be addressed to S.B.
Competing financial interestsThe authors declare no competing financial interests.
NATURE MATERIALS | VOL 11 | NOVEMBER 2012 | www.nature.com/naturematerials 935
© 2012 Macmillan Publishers Limited. All rights reserved