atomic force microscopy cantilever simulation by finite
TRANSCRIPT

Atomic force microscopy cantilever simulation by finiteelement methods for quantitative atomic force acousticmicroscopy measurements
F.J. Espinoza BeltránCentro de Investigación y Estudios Avanzados del IPN. Unidad Querétaro, 76001 Querétaro,Qro., México; and Hamburg University of Technology, Advanced Ceramics Group,21073 Hamburg, Germany
J. Muñoz-Saldañaa) and D. Torres-TorresCentro de Investigación y Estudios Avanzados del IPN. Unidad Querétaro,76001 Querétaro, Qro., México
R. Torres-MartínezCentro de Investigación en Ciencia Aplicada y Tecnología Avanzada del IPN. Unidad Querétaro,76040, Querétaro, Qro., México
G.A. SchneiderHamburg University of Technology, Advanced Ceramics Group, 21073 Hamburg, Germany
(Received 14 March 2006; accepted 10 August 2006)
Measurements of vibrational spectra of atomic force microscopy (AFM) microprobesin contact with a sample allow a good correlation between resonance frequencies shiftsand the effective elastic modulus of the tip-sample system. In this work we use finiteelement methods for modeling the AFM microprobe vibration considering actualfeatures of the cantilever geometry. This allowed us to predict the behavior of thecantilevers in contact with any sample for a wide range of effective tip-samplestiffness. Experimental spectra for glass and chromium were well reproduced for thenumerical model, and stiffness values were obtained. We present a method to correlatethe experimental resonance spectrum to the effective stiffness using realistic geometryof the cantilever to numerically model the vibration of the cantilever in contact with asample surface. Thus, supported in a reliable finite element method (FEM) model,atomic force acoustic microscopy can be a quantitative technique for elastic-modulusmeasurements. Considering the possibility of tip-apex wear during atomic forceacoustic microscopy measurements, it is necessary to perform a calibration procedureto obtain the tip-sample contact areas before and after each measurement.
I. INTRODUCTION
Atomic force microscopy (AFM) has become in thepast years one of the most useful microscopic tools forimaging the surface topography at nanoscale level ofseveral types of materials, whereby it is an essential tech-nique for nanotechnology. AFM is very sensitive formeasuring interaction forces between the AFM micro-probe and the sample.1–3 The simplest interaction be-tween the AFM microprobe and the sample is the me-chanical contact, but it is possible to introduce in a con-trolled way several additional interaction forces,including electric and magnetic fields. For modulated
forces4 acting on the microprobe–sample contact, it ispossible to increase the sensitivity of the measurement,including high-frequency excitations. Heterodyne con-verter procedures combined with lock-in amplifiers al-low amplifying very low signals, due to the interactionbetween AFM microprobe and the sample, for a fre-quency range from some kHz to several MHz.5 Atomicforce acoustic microscopy (AFAM) is a high-frequencyforce modulation AFM technique that provides stiffnessmapping of surfaces. A piezoelectric transducer attachedto the AFM microprobe holder or located in the bottomof the sample generates an ultrasonic mechanical signalwhen the microprobe is in contact with the sample. Vi-brational spectra of the cantilever-sample system provideresonance peaks whose frequencies values are relatedwith the geometry of the microprobe, and mechanicalproperties (elastic modulus, Poisson ratio) of probe and
a)Address all correspondence to this author.e-mail: [email protected]
DOI: 10.1557/JMR.2006.0379
J. Mater. Res., Vol. 21, No. 12, Dec 2006 © 2006 Materials Research Society3072

sample. An AFAM scanning image obtained for a fixedexcitation frequency near some resonance shows micro-scopic details of the surface stiffness of the sample.
In the AFAM technique, the following important as-pects should be considered before experiments are per-formed. The cantilever stiffness must be chosen accord-ing to the sample stiffness, so that the vibration of themicroprobe-sample system represents contributions ofboth materials. Secondly, sufficiently large static forcesacting on the cantilever are necessary to discard wateradherence in the contact area (or some small electrostaticcharge effects) but short enough to avoid plastic defor-mation of the sample so that Hertz theory for contact canbe used. On the other hand the condition of high appliedforces may result in undesirable nanoindentation effectson the sample leading to a much more complex system tobe quantified. When working with a high static deflectionof the cantilever to get strong output signals an undesir-able movement of the cantilever, consisting of a combi-nation of horizontal bending and torsional deformation ispresent.4 These aspects have seriously limited the ana-lytic description of the experimental cantilever vibrationphenomena.5–10 For instance, Rabe et al.5 reported acomparison between experiment and theory for a rectan-gular cantilever in free vibration and demonstrated thatthe flexural vibration theory is able to describe AFMcantilever vibrations in the frequency range from100 kHz to 10 MHz. Calculations showed that the first 4to 10 modes can be excited with high amplitude conclud-ing that the higher modes are well suited for sensingpurposes.5 In another contribution these authors carriedout quantitative image analysis of free torsional and flex-ural vibration modes of rectangular cantilevers (excitedin the frequency range of 100 kHz to 3 MHz) using anoptical Michelson heterodyne interferometer.11 A com-parison of the experimental resonance frequencies of themodes to theoretical models has been undertaken. Itshowed that irregular geometry of the cantilever stronglyinfluences the vibrational behavior of the cantilever. Ithas been demonstrated that coupling due to geometricaland mass asymmetries account for a number of reso-nances besides the standard flexural and torsional modes.Furthermore, these authors concluded that the geometryof the cantilevers plays a dominant role for a successfuldescription of the vibration of the cantilever and sug-gested that a numerical approach, such as finite elementanalysis may lead to better agreement with experimentand improve the understanding of the various contribu-tions to the cantilever eigenmodes.
Few reports on finite element method (FEM) of AFMcantilever beams under free vibrations12–14 and related toforce modulation microscopy12–15 have been reported inthe literature. For instance Drobek et al.13 modeled byfinite element analysis the V-shaped cantilever as used inforce modulation microscopy to get a reliable description
of the mechanical behavior of the system. The method ofovertone AFM was applied to Al–Ni–Fe quasi-crystalsurfaces to distinguish between different metallurgicalphases and different crystallographic orientations of thequasi-crystalline grains in an ingot.13 Further on, Arineroet al.12 used a one-dimensional finite element model fora vibrating rectangular cantilever beam in contact mode,based on a classic finite element scheme. These authorsdemonstrated that the mode of excitation of the beamstrongly influences the cantilever’s frequency responsein the contact mode.12
Thus, the AFM cantilever geometry and its elasticproperties must be known to discern from the tip-samplecontact-mechanics the appropriate elastic modulus of thesample. Kopycinska-Müller et al.16 performed a studywith scanning electron microscopy on the changes suf-fered by the tip apex during AFAM measurements. Theyfound that tip apex, which is usually assumed like aspherical hemisphere, frequently suffers wearing leadingeventually to a flat shape with a larger contact area.
This paper is an effort to combine in a finite elementnumerical model with characteristics of the free andcoupled tip-sample cantilever vibrations. The irregulargeometry of commercial cantilevers, its elastic modulusand density are taken into account to explore the imagingconditions in atomic force acoustic microscopy. Adhe-sion and friction are not introduced in the finite elementmodel considering only a high static external force as aguarantee of the applicability of Hertz theory.
II. EXPERIMENTAL
A. Characterization of the cantilever
FEM simulations were carried out using the recon-struction of the geometry of the beam and the tip of acommercial cantilever model FESP (Veeco Corporation,Santa Barbara, CA) with the nominal dimensions of225 �m length, 28 �m width, and 3 �m thickness, tipradius of 10–15 nm, spring constant k* of 1–5 N/m, andresonant frequency of 75 kHz.17 Furthermore, theYoung’s modulus of the cantilever silicon material isreported to be 1.69 × 10¹¹ N/m2, with a Poisson ratio of0.278, and a mass density of 2330 kg/m3. The Young’smodulus Etip and the Poisson ratio vtip of silicon sensortip are 1.3098 × 10¹¹ N/m2 and 0.181, respectively.5 Thetwo are different because of their different orientation.
The chemical composition and real geometrical di-mensions of three FESP cantilevers were characterizedby an Environmental Scanning Electron Microscopy(Philips Environmental SEM-EDAX). Several micro-graphs from different views of the cantilever were re-corded at different magnifications (400×–200×) using thesecondary electron detector, with an acceleration voltageof 5 kV. Image analysis of the micrographs was done
F.J. Espinoza Beltrán et al.: AFM cantilever simulation by finite element methods for quantitative AFAM measurements
J. Mater. Res., Vol. 21, No. 12, Dec 2006 3073

using the ImageJ software18 based on a previous calibra-tion of the SEM magnifications in a 500 �m grid withsquare elements of 10 �m. Measurements of the freevibration of the commercial FESP cantilevers were car-ried out in the range from 0–4.0 MHz in an atomic forcemicroscope (AFM) (Nanoscope IV, Dimension 3100,Veeco USA, Santa Barbara, CA).
B. Simulation by the finite element method
The purpose of the modal analysis is to determine thenatural frequencies and the overall vibrational behaviorof the cantilever system both for the free vibrations andin contact with a material. The modal analysis problem issolved by means of the classic problem of eigenvalues,which is described in detail in literature.
Using analysis of the harmonic response the behaviorof the cantilever in a defined range of frequencies wascalculated and used to obtain the amplitude and the phaseof the cantilevers vibration at a given point on its surface.The maximal and minimal amplitudes are identified inthe graph as the resonances and antiresonances of thecantilever, respectively. The harmonic analysis allowsone to predict the vibrational spectra of the free cantile-ver or of the cantilever-sample interaction, and to verifysome other effects of its forced vibrations. The differen-tial equation system that represents mathematically thediscretized physical model to be solved is:
�M�d2�x�
dt2+ �K��x� = �F�sin�� t� , (1)
where [K] and [M] are the stiffness and mass matrixesand [F] is the amplitude of the external force, which isoscillating at the frequency �.
Finite element software19 (ANSYS-ENGINEERINGANALYSIS SYSTEM, University Introductory, RE-LEASE 9.0) was used to build a cantilever and tip modelapplying 15262 elements of the type Solid95. This ele-ment is defined by 20 nodes having three degrees offreedom per node: translations in the nodal x, y, and zdirections. Further on, modal and harmonic analysis wereundertaken. To match the AFM conditions the simulatedbeam was inclined 15° relative to the sample surface. Theresults of the numerical simulation of the free vibrationof the FESP cantilevers were eventually compared withthe experimental measurements.
Tip-sample contact interactions were simulated withthree COMBIN14 elements. The application of these el-ements is represented in three dimensions with lines withthe origin in the tip end. This element works as both aspring and damping to produce the different vibrationmodes of the cantilever in contact with a sample surface.The excitation of the cantilever was simulated by apply-ing a harmonic force F sin (�t) on the fixed end of the
cantilever representing the piezoelectric excitation of theAFM cantilever at the chip where the cantilever is sus-pended. The magnitude of the force applied to the can-tilever (in air) is around 50–1000 nN in the -y direction.Nonlinear behavior like plastic deformation or creep be-havior of the contact problem was not simulated.
III. RESULTS AND DISCUSSION
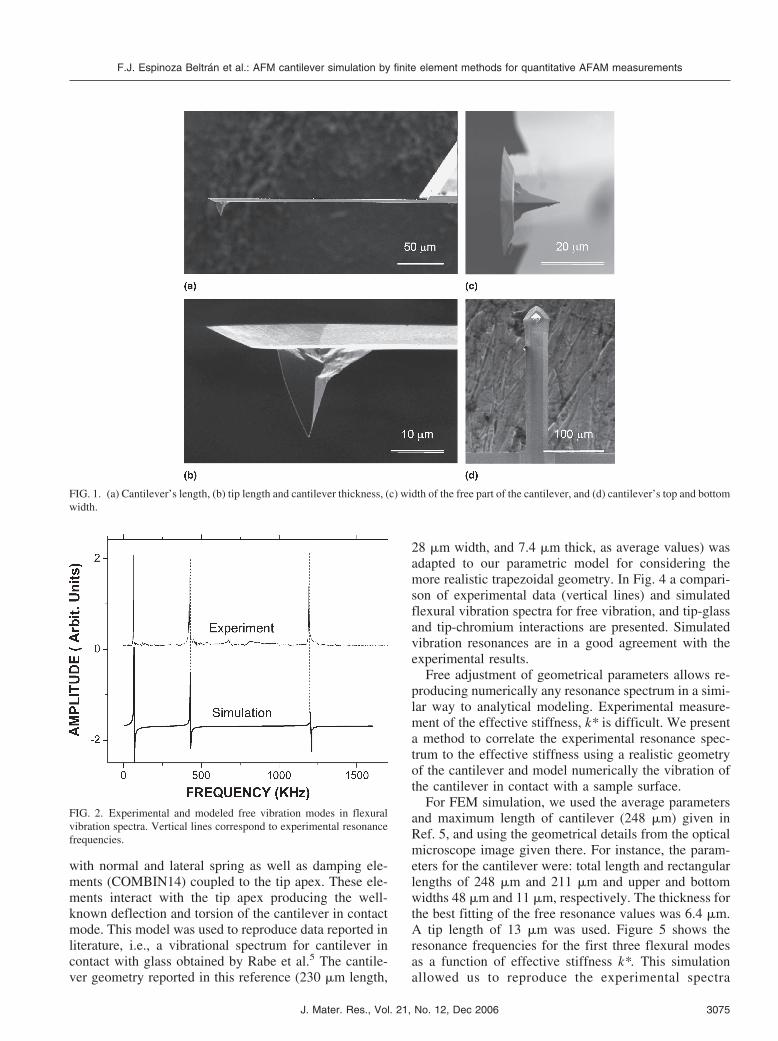
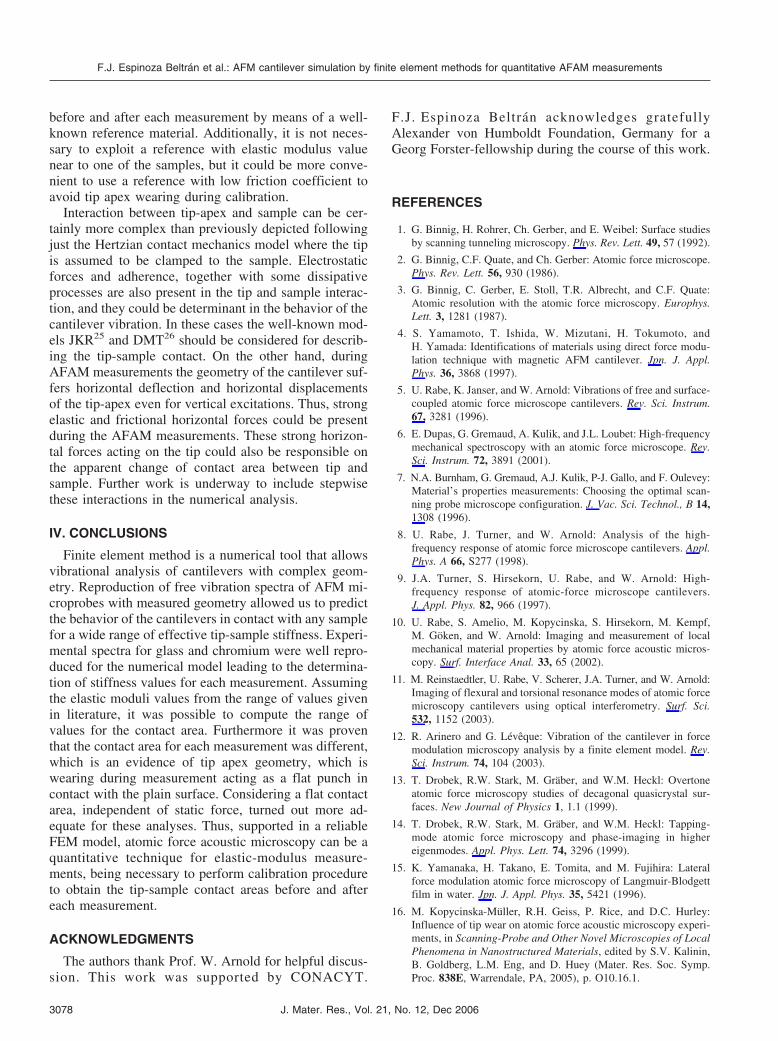
Representative scanning electron micrographs of thecharacterized cantilevers are shown in Fig. 1. Imageanalysis of these micrographs leads to a very good ap-proximation of the dimensions of the used FESP canti-lever. For instance, one of the cantilevers is 250 �m inlength having a trapezoidal cross-section with widths of34.7 �m and 19.4 �m, while the thickness varied be-tween 2.9 �m and 3.1 �m. The free vibration resonancespectrum simulated by the harmonic analysis comparedto the experimental measurements is shown in Fig. 2.FEM simulations of the modal analysis for the first sixnatural eigenmodes for a freely vibrating cantilever areshown in Fig. 3. These eigenmodes were obtained usinga cantilevers thickness value of 2.919 �m. In Fig. 3 themodal shapes, displayed by each mode the lateral, fron-tal, and isometric views with a dashed line indicating theundeformed cantilever can be observed. Thus, from theFEM simulation one can unambiguously identify thetype of the cantilever oscillations. Flexural oscillationsoccur in the (a) first, (b) second, (e) fifth, and (f) sixthresonance frequency. Moreover lateral oscillations occurin the (c) third resonance frequency, and finally torsionaloscillations are present in the (d) fourth resonance fre-quency. The simulated resonance frequencies of theseeigenmodes are also summarized in Table I. A compari-son of the simulated values with the experimental meas-urements shows a very good matching. For instance, thefirst torsional mode, the second and the third flexural areall within 1% in respect to the experimental data. Theremainder of the vibrational eigenmodes shows differ-ences between 1–7% for the first flexural and lateralmodes and the fourth flexural mode. These results indi-cate that the previous characterization of the cantileversgeometry allowed an excellent simulation of the cantile-ver behavior under free vibration.
We also carried out simulation analysis on the influ-ence of the different geometric parameters on the vibra-tion varying for instance the thickness of the cantilever.It is clear that the variations in cantilever vibration aremostly correlated to the thickness since cantilever stiff-ness is strongly dependent on this parameter.
From the harmonic analysis and an experimental spec-trum of resonance of a cantilever-sample interaction, thecontact stiffness, k*, can be derived. As mentioned be-fore, to get a realistic simulation of the physical phenom-enon of the contact tip-sample, we developed a model
F.J. Espinoza Beltrán et al.: AFM cantilever simulation by finite element methods for quantitative AFAM measurements
J. Mater. Res., Vol. 21, No. 12, Dec 20063074
with normal and lateral spring as well as damping ele-ments (COMBIN14) coupled to the tip apex. These ele-ments interact with the tip apex producing the well-known deflection and torsion of the cantilever in contactmode. This model was used to reproduce data reported inliterature, i.e., a vibrational spectrum for cantilever incontact with glass obtained by Rabe et al.5 The cantile-ver geometry reported in this reference (230 �m length,
28 �m width, and 7.4 �m thick, as average values) wasadapted to our parametric model for considering themore realistic trapezoidal geometry. In Fig. 4 a compari-son of experimental data (vertical lines) and simulatedflexural vibration spectra for free vibration, and tip-glassand tip-chromium interactions are presented. Simulatedvibration resonances are in a good agreement with theexperimental results.
Free adjustment of geometrical parameters allows re-producing numerically any resonance spectrum in a simi-lar way to analytical modeling. Experimental measure-ment of the effective stiffness, k* is difficult. We presenta method to correlate the experimental resonance spec-trum to the effective stiffness using a realistic geometryof the cantilever and model numerically the vibration ofthe cantilever in contact with a sample surface.
For FEM simulation, we used the average parametersand maximum length of cantilever (248 �m) given inRef. 5, and using the geometrical details from the opticalmicroscope image given there. For instance, the param-eters for the cantilever were: total length and rectangularlengths of 248 �m and 211 �m and upper and bottomwidths 48 �m and 11 �m, respectively. The thickness forthe best fitting of the free resonance values was 6.4 �m.A tip length of 13 �m was used. Figure 5 shows theresonance frequencies for the first three flexural modesas a function of effective stiffness k*. This simulationallowed us to reproduce the experimental spectra
FIG. 1. (a) Cantilever’s length, (b) tip length and cantilever thickness, (c) width of the free part of the cantilever, and (d) cantilever’s top and bottomwidth.
FIG. 2. Experimental and modeled free vibration modes in flexuralvibration spectra. Vertical lines correspond to experimental resonancefrequencies.
F.J. Espinoza Beltrán et al.: AFM cantilever simulation by finite element methods for quantitative AFAM measurements
J. Mater. Res., Vol. 21, No. 12, Dec 2006 3075

reported in Ref. 5, both for free and contact vibration ofthe AFM microprobe with glass and chromium using thesame cantilever geometry. From this figure it is observ-able that using a suitable geometry (and mechanical pa-rameters) the reproduction of the free vibration allowsalso to predict with a very good approximation the can-tilever vibration in contact with any sample leading to theeffective stiffness, k*, for the contact between the AFMtip and glass and chromium. Intersections of horizontallines, corresponding to resonance frequencies of free vi-bration (solid), tip-glass contact (dash) and tip-chromium(solid-dot), with the predicted curves allowed obtainingthe values showed in Table II. For glass the averagevalue of k* is 3.194 × 10³ N/m and a standard deviationof 653 N/m, which corresponds to an error of about20.5%. In a similar way, for chromium the effective stiff-ness error is about 40.3%. Please note that in Fig. 5 theresonance frequencies for mode 1 have an inherent higherror for the effective stiffness higher than 1000 N/m,due to the fact that these points are in the upper flatregion of the curve. Ignoring the stiffness value frommode 1 in the average of stiffness leads to more accept-able values of stiffness. Doing this, the corresponding
k* values are (3.66 ± 0.03) × 103 N/m for glass and (12.47± 0.88) × 103 N/m for chromium being the standard devia-tions 0.8% and 7.0% for glass and chromium, respectively.
The combined elastic modulus can be determined fromthe contact stiffness if the contact area between the AFMtip and sample is known. Contact areas can be obtainedfrom a calibration procedure using a reference material.For instance in nanoindentation procedures it is of com-mon practice to use an indirect method for determiningarea functions. A series of indentations at varying maxi-mum loads on standard test specimens whose elasticmoduli and Poisson ratio are known were undertaken.Since we do not have plastic deformation of the materialin the contact area due to the limited stiffness of anAFAM cantilever, such a procedure can not be per-formed. It has been reported in the literature that forAFAM measurements the contact area changes duringthe measurement.16 To have a reliable method to obtainthe contact area is the main challenge for AFAM meas-urements. A good approximation can be done by usingthe Hertz equations approximating the contact between asphere and a flat surface.
The elastic moduli of the samples vary from
FIG. 3. The finite-element simulations were processed with by using 15262 elements of the type Solid95. (a) First, (b) second, (c) third,(d) fourth, (e) fifth, and (f) sixth eigenmodes of the cantilever free vibration.
TABLE I. Experimental and calculated resonance frequencies of a single crystal silicon cantilever with the average dimensions: 250 �m length,30 �m width and 2.919 �m. The width is the mean value of the upper and the lower width of the trapezoid. For the calculations a Young’s modulusE of silicon cantilever 1.69 × 10¹¹ N/m2, Poisson ratio of 0.278, and the mass density is 2330 kg/m3, the Young’s modulus and Poisson ratio ofsilicon sensor tip are 1.3098 × 10¹¹ N/m2 and 0.181, respectively were used.6
Cantilever First flexural mode Second flexural modeFirst lateral
modeFirst torsional
modeThird flexural
modeFourth flexural
mode
Experimentally observedfrequency (kHz) 65.6 421.5 697.7 1066.4 1192.6 2343.4
Simulated (kHz) 67.0 422.0 649.8 1066.4 1183.5 2316.8
F.J. Espinoza Beltrán et al.: AFM cantilever simulation by finite element methods for quantitative AFAM measurements
J. Mater. Res., Vol. 21, No. 12, Dec 20063076

30–90 GPa (for glass) and from 132–253 GPa (for chro-mium).5 Thus, using the Hertz theory,20 and consideringthe AFM tip as a spherical hemisphere apex with curva-ture R, the relation between k* and the combined elasticmodulus E* is:
k* = �36E*2 FR , (2)
where F is the static force applied on the cantilever. ForE* the following expression holds:
1
E*= �1 − �Si
2
ESi� + �1 − �sample
2
Esample� . (3)
The ranges of values for R obtained (5.3–8.9 and 78.0–131.9 �m, for glass and chromium, respectively), by us-ing Eqs. (4) and (5) and Table II, and F � 500 nN are faraway to be real for the case of a rigid AFM tip in contactwith a flat rigid surface. Now, if we consider wearingproduced by the AFAM measurement the tip apex couldbe better represented as a flatted apex. Thus, assuming aflattened circular area of the tip apex with radius a, as thecontact area between tip and sample, the relation betweenk* and E* is
k* = 2aE* . (4)Here a does not change as a function of the applied
force F to the cantilever, but F should be higher thanattractive or repulsive forces. The computed range ofvalues obtained for the contact radius a are 33.0–42.8 nmfor glass, and 68.5–89.0 nm for chromium. The differ-ence in contact areas is remarkable. This difference canbe explained from a lighter wear process in the formermaterial leading to less damage of the tip.
An accepted procedure to predict the mechanical prop-erties of materials by AFAM is the use of a materialreference having an elastic modulus close to the expectedfor the analyzed sample.21,22 Hitherto was a constantcontact area assumed but it has been proven that itchanges during each AFAM measurement.16 Similar re-sults were reported by Passeri et al.23 by supposing thatfor normal loads higher than a critical value the cantile-ver tip acts as a flat punch indenting a plain surface. Thecontinuous changing of the contact area does not allowthe reproducibility of exactly the same resonance fre-quencies and experimental resonance spectrum. A muchlower wear rate of the tip apex can be obtained for AFMtips covered by a diamond coating.24 Wearing of thecontact area with the AFAM measurement should notreally be a problem if there are calibration procedures
TABLE II. Effective stiffness for tip-sample (glass and chromium) contact obtained by finite element simulation.
SampleFlexural 1k* (N/m)
Flexural 2k* (N/m)
Flexural 3k* (N/m)
Averagek* (N/m)
Averagea
k* (N/m)
Glass 2.27 × 10³ 3.68 × 10³ 3.63 × 10⁴ (3.19 ± .65) × 103 (3.66 ± .03) × 103
Chromium 2.72 × 10⁴ 1.34 × 10⁴ 1.16 × 10⁴ (1.74 ± .70) × 104 (1.25 ± .09) × 104
aAverage of stiffness values obtained from flexural modes 2 and 3.
FIG. 4. Flexural vibration spectra showing a comparison between ex-perimental and simulated cantilever and tip coupled to glass.5 Thefinite-element simulation was processed by using 2131 elements of thetype Solid95 and by 3 elements type COMBIN14.
FIG. 5. Resonance frequencies as a function of tip-sample effectivestiffness for the first flexural vibrations for the cantilever used forRabe et al.5 Vertical lines correspond to experimental tip apex-glassand tip apex-chromium contacts. Horizontal lines correspond to: freevibration (solid lines), tip-glass contact (dash lines), and tip-chromiumcontact (solid-dot lines).
F.J. Espinoza Beltrán et al.: AFM cantilever simulation by finite element methods for quantitative AFAM measurements
J. Mater. Res., Vol. 21, No. 12, Dec 2006 3077
before and after each measurement by means of a well-known reference material. Additionally, it is not neces-sary to exploit a reference with elastic modulus valuenear to one of the samples, but it could be more conve-nient to use a reference with low friction coefficient toavoid tip apex wearing during calibration.
Interaction between tip-apex and sample can be cer-tainly more complex than previously depicted followingjust the Hertzian contact mechanics model where the tipis assumed to be clamped to the sample. Electrostaticforces and adherence, together with some dissipativeprocesses are also present in the tip and sample interac-tion, and they could be determinant in the behavior of thecantilever vibration. In these cases the well-known mod-els JKR25 and DMT26 should be considered for describ-ing the tip-sample contact. On the other hand, duringAFAM measurements the geometry of the cantilever suf-fers horizontal deflection and horizontal displacementsof the tip-apex even for vertical excitations. Thus, strongelastic and frictional horizontal forces could be presentduring the AFAM measurements. These strong horizon-tal forces acting on the tip could also be responsible onthe apparent change of contact area between tip andsample. Further work is underway to include stepwisethese interactions in the numerical analysis.
IV. CONCLUSIONS
Finite element method is a numerical tool that allowsvibrational analysis of cantilevers with complex geom-etry. Reproduction of free vibration spectra of AFM mi-croprobes with measured geometry allowed us to predictthe behavior of the cantilevers in contact with any samplefor a wide range of effective tip-sample stiffness. Experi-mental spectra for glass and chromium were well repro-duced for the numerical model leading to the determina-tion of stiffness values for each measurement. Assumingthe elastic moduli values from the range of values givenin literature, it was possible to compute the range ofvalues for the contact area. Furthermore it was proventhat the contact area for each measurement was different,which is an evidence of tip apex geometry, which iswearing during measurement acting as a flat punch incontact with the plain surface. Considering a flat contactarea, independent of static force, turned out more ad-equate for these analyses. Thus, supported in a reliableFEM model, atomic force acoustic microscopy can be aquantitative technique for elastic-modulus measure-ments, being necessary to perform calibration procedureto obtain the tip-sample contact areas before and aftereach measurement.
ACKNOWLEDGMENTS
The authors thank Prof. W. Arnold for helpful discus-sion. This work was supported by CONACYT.
F.J. Espinoza Beltrán acknowledges gratefullyAlexander von Humboldt Foundation, Germany for aGeorg Forster-fellowship during the course of this work.
REFERENCES
1. G. Binnig, H. Rohrer, Ch. Gerber, and E. Weibel: Surface studiesby scanning tunneling microscopy. Phys. Rev. Lett. 49, 57 (1992).
2. G. Binnig, C.F. Quate, and Ch. Gerber: Atomic force microscope.Phys. Rev. Lett. 56, 930 (1986).
3. G. Binnig, C. Gerber, E. Stoll, T.R. Albrecht, and C.F. Quate:Atomic resolution with the atomic force microscopy. Europhys.Lett. 3, 1281 (1987).
4. S. Yamamoto, T. Ishida, W. Mizutani, H. Tokumoto, andH. Yamada: Identifications of materials using direct force modu-lation technique with magnetic AFM cantilever. Jpn. J. Appl.Phys. 36, 3868 (1997).
5. U. Rabe, K. Janser, and W. Arnold: Vibrations of free and surface-coupled atomic force microscope cantilevers. Rev. Sci. Instrum.67, 3281 (1996).
6. E. Dupas, G. Gremaud, A. Kulik, and J.L. Loubet: High-frequencymechanical spectroscopy with an atomic force microscope. Rev.Sci. Instrum. 72, 3891 (2001).
7. N.A. Burnham, G. Gremaud, A.J. Kulik, P-J. Gallo, and F. Oulevey:Material’s properties measurements: Choosing the optimal scan-ning probe microscope configuration. J. Vac. Sci. Technol., B 14,1308 (1996).
8. U. Rabe, J. Turner, and W. Arnold: Analysis of the high-frequency response of atomic force microscope cantilevers. Appl.Phys. A 66, S277 (1998).
9. J.A. Turner, S. Hirsekorn, U. Rabe, and W. Arnold: High-frequency response of atomic-force microscope cantilevers.J. Appl. Phys. 82, 966 (1997).
10. U. Rabe, S. Amelio, M. Kopycinska, S. Hirsekorn, M. Kempf,M. Göken, and W. Arnold: Imaging and measurement of localmechanical material properties by atomic force acoustic micros-copy. Surf. Interface Anal. 33, 65 (2002).
11. M. Reinstaedtler, U. Rabe, V. Scherer, J.A. Turner, and W. Arnold:Imaging of flexural and torsional resonance modes of atomic forcemicroscopy cantilevers using optical interferometry. Surf. Sci.532, 1152 (2003).
12. R. Arinero and G. Lévêque: Vibration of the cantilever in forcemodulation microscopy analysis by a finite element model. Rev.Sci. Instrum. 74, 104 (2003).
13. T. Drobek, R.W. Stark, M. Gräber, and W.M. Heckl: Overtoneatomic force microscopy studies of decagonal quasicrystal sur-faces. New Journal of Physics 1, 1.1 (1999).
14. T. Drobek, R.W. Stark, M. Gräber, and W.M. Heckl: Tapping-mode atomic force microscopy and phase-imaging in highereigenmodes. Appl. Phys. Lett. 74, 3296 (1999).
15. K. Yamanaka, H. Takano, E. Tomita, and M. Fujihira: Lateralforce modulation atomic force microscopy of Langmuir-Blodgettfilm in water. Jpn. J. Appl. Phys. 35, 5421 (1996).
16. M. Kopycinska-Müller, R.H. Geiss, P. Rice, and D.C. Hurley:Influence of tip wear on atomic force acoustic microscopy experi-ments, in Scanning-Probe and Other Novel Microscopies of LocalPhenomena in Nanostructured Materials, edited by S.V. Kalinin,B. Goldberg, L.M. Eng, and D. Huey (Mater. Res. Soc. Symp.Proc. 838E, Warrendale, PA, 2005), p. O10.16.1.
F.J. Espinoza Beltrán et al.: AFM cantilever simulation by finite element methods for quantitative AFAM measurements
J. Mater. Res., Vol. 21, No. 12, Dec 20063078

17. Digital Instruments Veeco Metrology: Force Modulation Manual,Santa Barbara, CA, 93117(805), 957 (1999).
18. W. Rasband: Research Services Branch, National Institute ofMental Health, Bethesda, MD.
19. ANSYS: ANSYS Theory Reference Manual, 9th ed., Version 5.5,(SAS IP, Inc., Canonsburg, PA, 1998).
20. K. Johnson: Contact Mechanics, (Cambridge University Press,England, 1987).
21. U. Rabe, S. Amelio, M. Kopycinska, S. Hirsekorn, M. Kempf,M. Göken, and W. Arnold: Imaging and measurement of localmechanical material properties by atomic force acoustic micros-copy. Surf. Interface Anal. 33, 65 (2002).
22. M. Muraoka: Sensitivity-enhanced atomic force acoustic micro-scopy with concentrated-mass cantilevers. Nanotechnology 16,542 (2005).
23. D. Passeri, A. Bettucci, M. Germano, M. Rossi, A. Alippi,S. Orlanducci, and M.L. Terranova and M. Ciavarella: Effect oftip geometry on local indentation modulus measurement viaatomic force acoustic microscopy technique. Rev. Sci. Instrum. 76,093904 (2005).
24. S.V. Kalinin, B.J. Rodriguez, J. Shin, S. Jesse, V. Grichko,T. Thundat, A.P. Baddorf, and A. Gruverman: Bioelectromechani-cal imaging by scanning-probe microscopy: Galvani’s experimentat the nanoscale. Ultramicroscopy 106, 334 (2006).
25. K.L. Johnson, K. Kendall, and A.D. Roberts: Surface energy andcontact of elastic solids. Proc. R. Soc. London A 324, 301 (1971).
26. B.V. Derjaguin, V.M. Muller, and Yu.P. Toporov: Effect of con-tact deformations on the adhesion of particles. J. Colloid InterfaceSci. 53(2), 314 (1975).
F.J. Espinoza Beltrán et al.: AFM cantilever simulation by finite element methods for quantitative AFAM measurements
J. Mater. Res., Vol. 21, No. 12, Dec 2006 3079