atmospheric pressure chemical ionization sources used in the
TRANSCRIPT

PNNL-19261
Prepared for the U.S. Department of Energy Under Contract DE-AC05-76RL01830
ATMOSPHERIC PRESSURE CHEMICAL IONIZATION SOURCES USED IN THE DETECTION OF EXPLOSIVES BY ION MOBILITY SPECTROMETRY M. J. Waltman May 2010

DISCLAIMER This report was prepared as an account of work sponsored by an agency of the United States Government. Neither the United States Government nor any agency thereof, nor Battelle Memorial Institute, nor any of their employees, makes any warranty, express or implied, or assumes any legal liability or responsibility for the accuracy, completeness, or usefulness of any information, apparatus, product, or process disclosed, or represents that its use would not infringe privately owned rights. Reference herein to any specific commercial product, process, or service by trade name, trademark, manufacturer, or otherwise does not necessarily constitute or imply its endorsement, recommendation, or favoring by the United States Government or any agency thereof, or Battelle Memorial Institute. The views and opinions of authors expressed herein do not necessarily state or reflect those of the United States Government or any agency thereof. PACIFIC NORTHWEST NATIONAL LABORATORY operated by BATTELLE for the UNITED STATES DEPARTMENT OF ENERGY under Contract DE-AC05-76RL01830 Printed in the United States of America Available to DOE and DOE contractors from the Office of Scientific and Technical Information,
P.O. Box 62, Oak Ridge, TN 37831-0062; ph: (865) 576-8401 fax: (865) 576-5728
email: [email protected] Available to the public from the National Technical Information Service, U.S. Department of Commerce, 5285 Port Royal Rd., Springfield, VA 22161
ph: (800) 553-6847 fax: (703) 605-6900
email: [email protected] online ordering: http://www.ntis.gov/ordering.htm
This document was printed on recycled paper.
(9/2003)

ATMOSPHERIC PRESSURE CHEMICAL IONIZATION SOURCES USED IN THE
DETECTION OF EXPLOSIVES BY ION MOBILITY SPECTROMETRY
by
Melanie Jean Waltman
Submitted in partial fulfillment of the requirements for the degree of
Doctor of Philosophy in Chemistry
New Mexico Tech
Department of Chemistry
Socorro, NM
May 2010
ABSTRACT
Explosives detection is a necessary and wide spread field of research. From large
shipping containers to airline luggage, numerous items are tested for explosives every
day. In the area of trace explosives detection, ion mobility spectrometry (IMS) is the
technique employed most often because it is a quick, simple, and accurate way to test
many items in a short amount of time. Detection by IMS is based on the difference in
drift times of product ions through the drift region of an IMS instrument. The product
ions are created when the explosive compounds, introduced to the instrument, are
chemically ionized through interactions with the reactant ions. The identity of the
reactant ions determines the outcomes of the ionization process. This research
investigated the reactant ions created by various ionization sources and looked into ways
to manipulate the chemistry occurring in the sources.
The ionization source most utilized in IMS instruments is 63Ni. It is a very reliable
and well understood source, but due to safety and regulatory concerns non-radioactive
sources are being put to use. One non-radioactive source already implemented into IMS
instruments is corona discharge. The predominant reactant ion observed in a point-to-
plane corona discharge occurs at m/z 60 in clean air. There have been multiple references
in the literature to the identity of this ion with some disagreement. It was postulated to be
either CO3- or N2O2
-. The identity of this ion is important as it is a key to the ionization of
analytes. The ion at m/z 60 was determined here to be CO3- through the use of 18O labeled
oxygen. Further confirmation was provided through MS/MS studies. An example of the
importance of knowing the reactant ion identity was the ionization of nitroglycerine (NG)

with CO3- which produced the adduct NG·CO3
-. This adduct formation was similar to the
ionization of NG with NO3- and Cl- reactant ions that also formed adducts with NG. The
fragmentation patterns of these adducts provides insight into the charge distribution. The
fragmentation of the NG·NO3- adduct produced the nitrate ion whereas fragmentation of
the NG·Cl- adduct also produced the nitrate ion indicating that the charge resided
predominantly with the nitrate in both complexes. However, the fragmentation of
NG·CO3- yielded CO3
-. This indicates that CO3- has a relatively high electron affinity,
higher than that of chlorine and likely close to that of the nitrate ion.
As part of this research a new atmospheric pressure ionization (API) source was
developed, characterized and compared to commonly used API sources with both mass
spectrometry and ion mobility spectrometry. The source, a distributed plasma ionization
source (DPIS), consisted of two electrodes of different sizes separated by a thin glass
slide. Application of a high RF voltage across the electrodes generated plasma in air
yielding both positive and negative ions. The positive ions generated were similar to
those created in a conventional point-to-plane corona discharge ion source, being mass
identified as solvated protons of general formula (H2O)nH+, with (H2O)2H+ as the most
abundant reactant ion. The negative reactant ions produced were mass identified
primarily as CO3-, NO3
-, NO2-, O3
- and O2- of various relative intensities. The
predominant ion and relative ion ratios varied depending upon source construction and
supporting gas flow rates. A few compounds including drugs, explosives and amines
were selected to evaluate the new ionization source. A lifetime experiment was run to test
the stability of the source. The source was operated continuously for three months and

although surface deterioration was observed visually, the source continued to produce
ions at a rate similar that of the initial conditions.
The ions created in a discharge were dependent upon experimental conditions. It
was postulated that the change in ions was caused by reactions with neutral species O3
and NO2. In an effort to better understand the formation of negative reactant ions in air
produced by an atmospheric pressure corona discharge source, the neutral vapors
generated by a corona discharge were introduced in varying amounts into the ionization
region of an ion mobility spectrometer/mass spectrometer containing a 63Ni ionization
source. With no discharge gas, the predominant ions were O2- , however, upon the
introduction of low levels of discharge gas the NO2- ion quickly became the dominant
species. As the amount of discharge gas increased, the appearance of CO3- was observed
followed by the appearance of NO3-. At very high discharge gas levels, NO3
- species
became effectively the only ion present and appeared as two peaks in the IMS spectrum,
NO3- and the NO3
-·HNO3 adduct, with separate mobilities. RDX was examined in order
to investigate the ionization properties with these three primary ions. It was found that
RDX forms a strong adduct with both NO2- and NO3
- with reduced mobility values of
1.49 and 1.44 cm2V-1s-1, respectively. No adduct was observed for RDX with CO3-
although this adduct has been observed with a corona discharge mass spectrometer. It is
believed that this adduct, although formed, does not have a sufficiently long lifetime
(greater than 10 ms) to be observed in an ion mobility spectrometer.
Many explosives form product ions via adduct formation. Thus, ion identities and
subsequent mobility values will change based upon reactant ion identity. Thermal
stability of the product ion, sensitivity and selectivity can be altered by the selection of

the reactant ion. This study investigated the use of O2-, Cl-, NO2
-, and NO3- reactant ions
for explosive ionization. It was shown that NG, PETN, RDX and tetryl form adducts with
chloride and nitrate reactant ions. RDX forms nitrite adducts with NO2- reactant ions and
in the presence of O2- RDX also forms the nitrite adduct via a 2-step process by first
forming the nitrite ion. When O2- or NO2
- is the reactant ion NG forms the nitrate ion and
subsequently produces the NG-nitrate adduct. Tetryl fragments to form (tetryl-NO2)- with
O2- and NO2
- reactant ions. TNT is ionized by proton abstraction with O2-, Cl-, and NO2
-
reactant ions. However, when NO3- ions are present TNT is not ionized. Because of the
high electron affinity of the nitrate ion, many compounds will not ionize in its presence.
The use of nitrate reactant ions result in a reduction of ions created from background
interferents while allowing the ionization of selected explosive compounds, making the
nitrate ion a good candidate as a selective reactant ion species. The reduced mobility
values from mass identified ion mobility peaks are provided for a variety of product ions
observed resulting from combinations of the explosives and the reactant ions
investigated.
Key words: atmospheric pressure chemical ionization (APCI), ion mobility spectrometry
(IMS), mass spectrometry, CO3-, corona discharge, distributed plasma ionization source
(DPIS), explosives detection

ii
ACKNOWLEDGEMENTS
I would like to thank my advisor, Dr. Robert Ewing, for his guidance and
allowing me work in two of his labs. I am appreciative to Dr. Michael Heagy who took
care of some things for me when I was not in New Mexico. Thank you to the rest of my
committee, Dr. Larry Werbelow, Dr. Michael Pullin, and Dr. Navid Mojtabai, for their
time. I am very grateful to Debbie Wallace, who helped with all the paperwork and
answered lots of questions.
Thank you to Dr. Herb Hill, Prahba Dwivedi, and Christina Crawford for their
collaboration in this research and allowing us to visit their lab and use their instruments.
Thank you to my husband, Douglas, my family, and my friends for their years of support,
and thanks to God for getting me through this.

iii
TABLE OF CONTENTS
Page
List of tables iv
List of figures v
List of abbreviations x
Chapter 1 – Introduction 1
Chapter 2 – Production and Utilization of CO3- Produced by a Corona Discharge
for Atmospheric Chemical Ionization
11
Chapter 3 –Characterization of a Distributed Plasma Ionization Source (DPIS)
for Ion Mobility Spectrometry and Mass Spectrometry
24
Chapter 4 – Mechanisms for Negative Reactant Ion Formation of Air in an
Atmospheric Pressure Corona Discharge
40
Chapter 5 –Atmospheric Pressure Chemical Ionization of Explosives 59
Chapter 6 – Conclusions 73
References 78

iv
LIST OF TABLES
Page
Table 1.1: Electron affinities of typical reactant ions observed at API conditions
Ranges collected from the NIST web page from multiple sources.
7
Table 4.1: Negative ion reaction rate constants 52
Table 4.2: Reaction times for reactions 1-7 with varying concentrations of [NO2]
= [O3] as indicated
54
Table 6.1: Kos and mass values for explosive product ions seen in IMS spectra.
Data in brackets is from WSU, all other from PNNL.
75

v
LIST OF FIGURES
Page
Figure 1.1: Schematic of an ion mobility spectrometer 2
Figure 1.2: Example spectrum from an IMS 4
Figure 1.3: Drawings of explosives with common name and extended name 9
Figure 2.1: Mass spectra of background ions generated (A) in air at
atmospheric pressure with a 63Ni ionization source and (B) from a
corona discharge ionization in synthetic air at atmospheric pressure
15
Figure 2.2 MS/MS of collision induced dissociation of m/z 60 showing only
fragment ion of 16 (O-)
17
Figure 2.3: Mass spectra of the corona discharge with N2 and 5mL of oxygen
(A) with regular oxygen and (B) with 18O labeled oxygen
19
Figure 2.4: Mass spectrum of 63Ni with 18O2 20
Figure 2.5: MS/MS of the m/z 62 ion from the 18O labeled oxygen 21
Figure 2.6: Mass spectra of nitroglycerine (A) from a DPIS ionization source,
(B) from a corona discharge ionization source and (C) from a corona
discharge with carbon tetrachloride
22
Figure 2.7: MS/MS of nitroglycerine (A) from a DPIS ionization source (m/z
289, NG·NO3), (B) from a corona discharge ionization source (m/z 287,
NG·CO3) and (C) from a corona discharge with carbon tetrachloride
m/z 262, NG·Cl-)
23
Figure 3.1: The distributed plasma ion source, DPIS consisting of a 19x19 mm
microscope slide cover with 1.2 µm thick titanium coating completely
26

vi
covering the bottom side (large electrode) and 4mm disc on top (small
electrode). (A) is the DPIS shown in an open configuration wires were
connected to each electrode (B) is the enclosed DPIS contained in a
Teflon cylinder.
Figure 3.2: A side view of the electric field gradient simulation of the DPIS
with the large electrode on the left side and the small electrode on the
right. Lines show the equipotential voltage contours produced by the
source.
30
Figure 3.3: Magnified images over 33 days of the continuous operation of the
DPIS. Photograph of the small electrode (A) prior to use, (B) after 6
days, (C) after 16 days and (D) after 33 days.
32
Figure 3.4: Ion mobility spectra of positive background ions produced by (A)
corona discharge and (B) open DPIS from ionization of ambient air.
33
Figure 3.5: Ion mobility spectra of 2, 4-lutidine produced by (A) corona
discharge and (B) open DPIS. IMS peaks of the protonated water
reactant ions and protonated monomer ions of the 2, 4-lutidine are
shown at mobility values of 2.70 and 1.95 cm2 V-1 s-1, respectively.
34
Figure 3.6: Single ion monitored (SIM) ion mobility spectra of
methamphetamine (m/z 150), caffeine (m/z 195), and 2, 4-lutidine (m/z
108) using the open DPIS.
35
Figure 3.7: Mass spectra of negative ions generated in purified air with 63Ni,
point-to-plane corona, open DPIS, and enclosed DPIS.
36
Figure 3.8: IMS spectra of negative ions produced by the atmospheric pressure 38

vii
ionization of clean air at ambient temperature with 63Ni and an
enclosed DPIS.
Figure 3.9: Mass spectra of RDX (mw=222). Ionization of RDX with the (A)
enclosed DPIS and (B) point-to-plane corona discharge.
39
Figure 4.1: A diagram of the Nalgene bottle used for the Static and Dynamic
Container experiments. The Static Container was prepared by first by
flushing the container with the desired gas, then stopping the flow and
withdrawing an aliquot with a syringe. The Dynamic Container used a
continuous flow of gas and the outlet was interfaced to the IMS.
45
Figure 4.2: A diagram of the Continuous Flow Tube apparatus consisting of a
1/4” stainless steel Swagelok cross. The discharge occurs at the center
of this cross where two 0.026” diameter metal wires meet separated by
a glass slide. A continuous stream of purified air passes over the
discharge and a fraction of the effluent is presented to the inlet of the
IMS
46
Figure 4.3: IMS-F spectra of (a) zero air, (b) 2 mL of gas sampled from the
Static Container with zero air after 1 minute discharge and (c) 2 mL of
gas sampled from the Static Container with O2 after 1 minute discharge
48
Figure 4.4: (a) ion mobility spectrum and (b) mass spectrum of 2 mL of gas
sampled from the Static Container with zero air after the discharge was
operated for 5 minutes
49
Figure 4.5: IMS spectra of discharge gas from the Continuous Flow Tube
collected with the electron multiplier in the mass spectrometer. The
50

viii
IMS-EM, displayed on top, shows the total ion current followed by
selected ion monitoring of m/z 32, 46, 60 and 62 in order from top to
bottom
Figure 4.6: IMS peak intensities at increasing discharge times. The source was
operated at a 50% duty cycle with 40 mL/min continuous flow of zero
air through the Dynamic Container and into the IMS
52
Figure 4.7: IMS-F spectra of discharge gas from the Continuous Flow Tube
with (a) no discharge, (b) low flow, (c) medium flow and (d) high flow
56
Figure 4.8: IMS-F spectra of RDX with different ion chemistries generated
from varying levels of discharge gas from the Continuous Flow Tube
(a) low flow, (b) medium flow and (c) high flow
58
Figure 5.1: IMS Spectra (PCP) of reactant ion peaks generated from a 63Ni
ionization source at 110°C. A) Air showing only O2- B) addition of
carbon tetrachloride producing Cl-, C) low concentrations of neutral
vapors (ozone and NOx) generated in a DPIS producing NO2- and D)
higher concentrations of neutral vapors (ozone and NOx) generated in a
DPIS ionization source producing NO3- and HNO3·NO3
- ions.
64
Figure 5.2: Mass spectra (API-III) of clean dry air at ambient temperatures A)
using the enclosed DPIS ionization source producing NO3- at m/z 62,
B) using point-to-plane corona discharge source producing CO3- at m/z
60, C) using point to plane corona discharge with the addition of
carbon tetrachloride producing predominantly Cl- at m/z 35 and 37.
65
Figure 5.3: IMS spectra (PCP) of 10 ng RDX with a variety of reactant ion 67
ix
species as shown in Figure 5.1 A) O2-, B) Cl-, C) NO2
- and D) NO3-
and HNO3·NO3-.
Figure 5.4: IMS spectra with the same data as in Figure 5.3 with the x-axis
plotted as 1/Ko.
68
Figure 5.5: Mass spectra (API-III) of RDX at atmospheric pressure with a
variety of reactant ion species as shown in Figure 5.2 with RIPs of A)
NO3-, B) CO3
-, and C) Cl-.
69
Figure 5.6: Three dimensional IMS and MS spectra (WSU) of PETN with
DPIS ionization source at 110°C showing NO3- as reactant ion and the
PETN·NO3- adduct at m/z 378 and approximately 18.5ms.
71
Figure 5.7: IMS/MS spectra (PCP) of tetryl at 110 °C with O2-: an IMS spectra
showing reactant ion peak, an IMS-EM, and a IMS-SIM of m/z 241.
72

x
LIST OF ABBREVIATIONS
A ampere
APCI atmospheric pressure chemical ionization
amu atomic mass unit
CID collisionally induced dissociation
DPIS distributed plasma ionization source
eV electron volt
IMS ion mobility spectrometry
IMS-EM IMS spectra with electron multiplier detector
IMS-F IMS spectra with faraday plate detector
IMS-SIM IMS with single ion monitoring
MS mass spectrometry
m/z mass-to-charge ratio
NG nitroglycerin
NIST National Institute of Science and Technology
PETN pentaerythritol tetranitrate
RF radio frequency
RIP reactant ion peak
RDX 1,3,5-trinitro-1,3,5-triazacyclohexane
SIM single ion monitoring
Tetryl 2,4,6-trinitrophenyl-N-methylnitramine
TNT trinitrotoluene

xi
TOF-MS time-of-flight mass spectrometry
UHP ultra high purity
V volts
VDC volts direct current
WSU Washington State University

1
CHAPTER 1
INTRODUCTION
The detection of explosives is a matter of great concern to both the military and
civilian sectors. Applications include safeguarding travel, locating hidden mines,
scanning mail, and monitoring contaminated sites [1]. Many analytical techniques
including liquid chromatography, gas chromatography, chemiluminescence, ion mobility
spectrometry, mass spectrometry, and various spectroscopic methods have been used in
trace explosives detection [2]. Each method has its own advantages and drawbacks, yet
ion mobility spectrometry (IMS) stands apart from the rest as a field deployable
technique. A significant reason why IMS is readily used in the field is that it operates at
atmospheric pressure and thus does not require vacuum pumps like mass spectrometry
does. Since air can be used as the supporting gas, gas cylinders are not required. Because
of these factors IMS is a lightweight, portable, field deployable instrument. It is also a
relatively low cost instrument that offers real time analysis; a single run on an IMS takes
only milliseconds with a normal scan requiring less than 10 seconds. Due to its ease of
use, reliability, and ruggedness, IMS is the most widely used technique for trace detection
of explosives for both airports and the military [3].
1. Ion Mobility Spectrometry
Ion mobility spectrometry works on the basis that the ions of different chemicals
will have different mobilities allowing for detection and identification. The mobility of an
ion is determined by its drift velocity (dependent upon its size and charge) in a weak

2
electric field at atmospheric pressure. This difference in mobility between compounds
allows for their separation, and thus detection. Figure 1.1 is a diagram of an ion mobility
spectrometer.
Figure 1.1: Schematic of an ion mobility spectrometer.
First, the sample is ionized in the reaction region. When the ion shutter opens it
allows a narrow packet of ions into the drift region. The packet is separated into groups
of similar ions that drift at a constant velocity through the electric field against the flow
of the drift gas. The speed of ion movement is much faster than the speed of the gas flow.
The ions separate based upon size, with smaller ions traveling faster than larger ions. The
drift gas keeps the drift region free of neutral analyte molecules and thus prevents
reactions from occurring in the drift region causing distortions in the spectra. The drift
velocity of an ion is given by [4]:
vd =K E
where K is the mobility of the ion packets and E is the applied electric field. Typical drift
velocities for ions of low mass (14 to 500amu) in weak electric fields (150-300V/cm) are
Reaction Region Drift Region
Ion source
Ion shutter
Detector
Drift Rings
ApertureGrid
Reaction Region Drift Region
Ion source
Ion shutter
Detector
Drift Rings
ApertureGrid

3
1-10m/s at ambient pressure with temperatures from 25-250oC [5]. The mobility of an ion
packet is given by:
K = (3/16) [(1.602x10⁻¹⁹z/No) (2π/µkT)1/2(1/ΩD)],
where z is the charge of the ion, No is the number density of the drift gas, µ is the reduced
mass of the ion-drift gas pair, k is the Boltzmann’s constant, T is the operating
temperature (in Kelvin), and ΩD is the ion-neutral average cross section. As can be seen
from the equation, mobility is affected not only by the mass of ions, but by their shape
and size. Because of this, ions with the same mass but different functional groups can
have different mobilities.
After the ion packets make it through the drift region, they go through the
aperture grid to the faraday plate detector. As the packets hit the detector a current flow is
created and amplified then converted to voltage and reported as the instrument response.
An example of a typical IMS spectrum is shown in Figure 1.2. Peak A is the
reactant ion peak (RIP), peak D is the product ion peak, and peaks B and C are fragments
of the product ion. Mobilities for the peaks would be calculated from the drift time based
on instrument parameters. The mobilities are normalized to 760 Torr and 273 K to give
the reduced mobility, Ko:
Ko = K (P/760) (273/T) [4].
Reduced mobility values are independent of instrumental or environmental parameters
and are specific for an analyte ion. The reduced mobility values can be used for
compound identification from different instruments or different environmental
conditions.
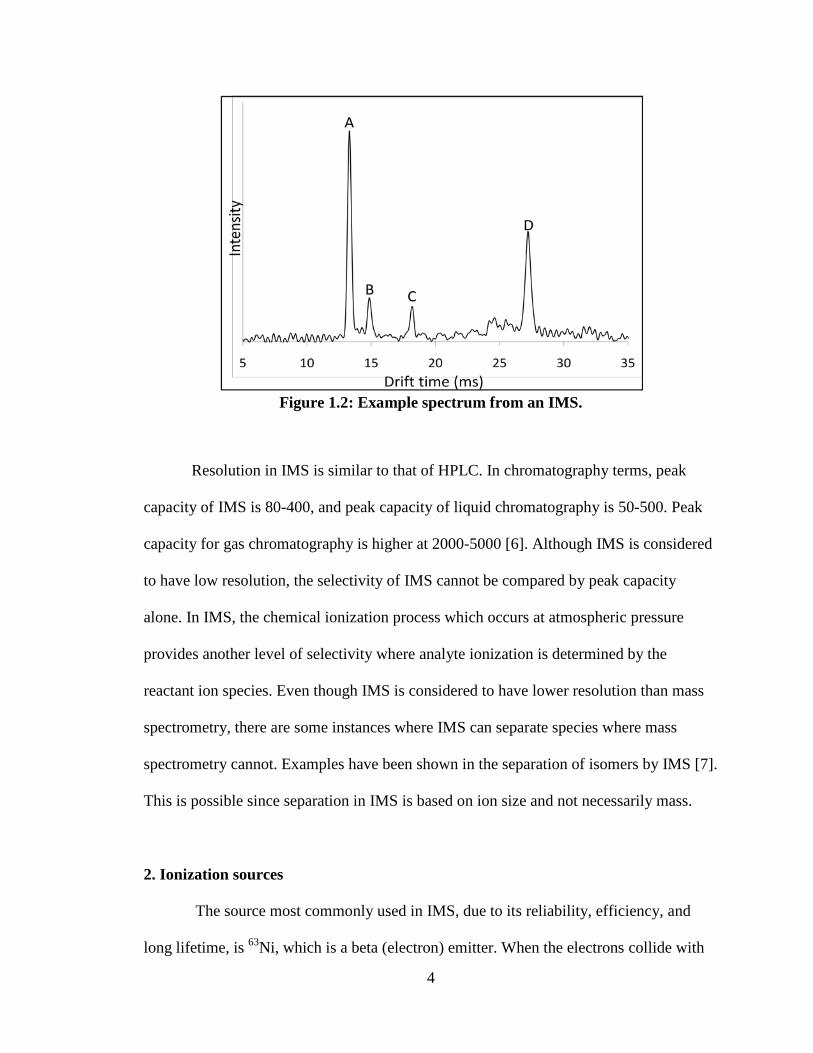
4
Figure 1.2: Example spectrum from an IMS.
Resolution in IMS is similar to that of HPLC. In chromatography terms, peak
capacity of IMS is 80-400, and peak capacity of liquid chromatography is 50-500. Peak
capacity for gas chromatography is higher at 2000-5000 [6]. Although IMS is considered
to have low resolution, the selectivity of IMS cannot be compared by peak capacity
alone. In IMS, the chemical ionization process which occurs at atmospheric pressure
provides another level of selectivity where analyte ionization is determined by the
reactant ion species. Even though IMS is considered to have lower resolution than mass
spectrometry, there are some instances where IMS can separate species where mass
spectrometry cannot. Examples have been shown in the separation of isomers by IMS [7].
This is possible since separation in IMS is based on ion size and not necessarily mass.
2. Ionization sources
The source most commonly used in IMS, due to its reliability, efficiency, and
long lifetime, is 63Ni, which is a beta (electron) emitter. When the electrons collide with

5
air molecules at ambient pressure, ions are formed along with more free electrons of
lower energy. This continues until the electrons are at near thermal energies.
N2 + e- → N2+ + 2e-
In positive polarity, ions are formed through a series of reactions shown below that result
in the formation of protonated water clusters H+(H2O)n [8].
N2+ + 2N2 → N4
+ +N2
N4+ + H2O → H2O+ + 2N2
H2O+ + H2O → H3O+ + OH
H3O+ + H2O + N2 ↔ H+(H2O)2 + N2
H+(H2O)2 + H2O + N2 ↔ H+(H2O)3 +N2
This reservoir of positive ions contains the reactant ions available for chemical
ionization of an analyte. In chemical ionization, some analytes, such as explosives, ionize
more efficiently with negative reactant ions. Negative reactant ions are formed when the
thermalized electrons are captured by oxygen in three-body collisions:
O2 + e- + M → O2- + M
O2- + H2O + M ↔ O2
-(H2O) + M
O2-H2O + H2O + M ↔ O2
-(H2O)2 + M
creating a reservoir of O2-(H2O)n ions.
Although 63Ni is normally used in IMS, there are regulatory and safety issues
associated with radioactive sources, and thus alternative ionization sources are desired if
they can have equal reliability. Therefore, there have been several investigations into the
development of non-radioactive sources for atmospheric pressure chemical ionization
(APCI) to be used with ion mobility spectrometry (IMS) and mass spectrometry (MS),

6
including electrospray [9], photoionization [10] and corona discharge [11]. Electrospray
ionization requires the use of solvents, pumps, an additional power supply and a heating
element for desolvation of ions produced and is predominantly used for liquid and non-
volatile samples [9]. Photoionization requires the use of an extra power supply and a
discharge lamp and provides selective ionization. For example alcohols can be ionized
with a 10.6 eV discharge lamp [10]. Corona discharge sources require an additional
power supply. Of these sources; corona discharge appears to provide the most similar
ionization properties to that of 63Ni sources [11].
A primary disadvantage of the corona discharge source for use with IMS is the
degradation in performance and eventual failure due to erosion at the discharge point
[12,13] (typically the tip of a needle or fine wire). Despite these shortcomings, the desire
for a non-radioactive source for IMS has led to the development of corona discharge
ionization sources for IMS. For instance, a commercial hand-held IMS with a corona
discharge ionization source is currently available from Smiths Detection (Watford, UK)
[14]. In corona discharge, the creation of negative reactant ions is different than those
created from 63Ni sources. Corona discharge sources typically produce nitrite and nitrate
ions with limited reactivity due to their inherently high electron affinities [11]. One of the
goals in the development of IMS systems with corona discharge ionization sources was to
produce reactant ions similar to those generated with a 63Ni source, mainly O2- ions. To
achieve this, a pulsed corona was explored [11] as was adding a counter-current flow to
the source region [15]. It is believed that ozone and NOx generated in the discharge cause
the production of nitrite and nitrate ions. Providing a short pulse or counter-current flow
resulted in a decrease in the amount of neutral ozone or NOx, which enabled O2- reactant

7
ions to persist in the reaction region. In addition to the nitrite and nitrate ions, corona
discharge sources have also been shown to produce O2-, O3
- and an anion at m/z 60 along
with hydrates of these ions [16,17].
Differences in the reactivity that exist between the assortment of ions that can be
produced from a variety of ionization sources needs to be understood for the development
of reliable instruments. Since the ionization of explosives, pesticides, blister agents and
other chemicals rely on negative atmospheric pressure chemical ionization, the identity of
the negative reactant ions will affect subsequent product ion formation. Changes to the
ionization mechanism of the products such as charge transfer, proton abstraction or
adduct formation can lead to changes in sensitivity or ion identity. For example, if the
ionization mechanism is charge transfer, relative electron affinities between the reactant
ion and the analyte will determine the potential for ionization to occur. The ranges of
electron affinities for the various anions discussed are provided in Table 1.1. IMS relies
on mobility as the means for identification and changes to ion identity will change the
mobility values and subsequent detection algorithms.
Molecule Electron affinity
Cl 3.6 eV
O2 0.40-1.3 eV
O3 1.8-2.5 eV
NO2 1.8-3.9 eV
NO3 3.7-3.9 eV
CO3 1.8-3.5 eV Table 1.1: Electron affinities of typical reactant ions observed at API
conditions. Ranges collected from the NIST web page from multiple sources. [18]

8
3. Explosives ionization
The explosive compounds examined in this research are observed predominantly
as negative ions due to their high electronegativities. These explosive compounds ionize
in many different ways, the four most common are as follows.
Proton abstraction M + O2- → (M-H)- + HO2
Electron transfer M + O2- → M- + O2
Adduct formation M + O2- → M∙O2
-
Fragmentation M + O2- → X- + (M-X) + O2
TNT ionizes by electron transfer into TNT-, and by proton abstraction (TNT-H)- and by
fragmentation (TNT-NO2)- [19]. Explosives like RDX first ionize by the production of
NO2- groups which in turn form adducts with neutral RDX molecules to create RDX·NO2
-
[20]. In these situation, the nitrite ion and its adduct are observed in the IMS spectra.
Some other explosives such as tetryl are not well characterized or discussed in the
literature. Figure 1.3 displays drawings and names of some common explosives.

9
Figure 1.3: Drawings of explosives with common name and extended name.
4. Purpose of research
This dissertation consists of four separate, but related, research experiments
(chapters) which were conducted in order to probe the chemistry involved in the
ionization of explosives by APCI sources. Chapters 3 and 4 have previously been
published, and chapters 2 and 5 are in preparation for publication. They are placed in the
order in which the experiments were performed.
In order to properly understand the ionization of explosives in an IMS, the
reactant ions formed in the ionization process must be identified. Chapter 2 establishes
the identity of an important reactant ion created in a point-to-plane corona discharge
source and how it differs from the ions created in a 63Ni source. Along these lines,
Chapter 3, Waltman MJ, Dwivedi P, Hill HH, Blanchard WC, Ewing RG, Talanta 2008,
77, 249, describes a distributed plasma ionization source (DPIS) which is a newly

10
developed source. Ions created using the DPIS differ from ions formed in both 63Ni and
corona discharge sources.
Chapter 4, Ewing RG, Waltman MJ, International Journal for Ion Mobility
Spectrometry 2009, 12, 65, discusses the investigation of ionization kinetics involved in
forming the reactant ions in a discharge source. Understanding the paths taken to produce
the ions detected in an IMS enables parameters to be adjusted to select specific reactant
ions. The use of specific reactant ions can improve the detection of explosives providing
better reliability and selectivity.
Chapter 5 examines the negative ionization processes involved in the ionization of
explosive compounds with a variety of reactant ion species. An assortment of explosives,
some well characterized and some not previously reported in the literature, are
investigated with these reactant ions. The ions produced by atmospheric pressure
ionization are identified by mass spectrometry. Reduced mobility values for the variety of
ions generated were measured and compared to literature values where available. The
goal was to obtain an understanding of ion formation processes to determine optimal
ionization parameters. Another goal was to find the best reactant ion species available for
selective ionization of explosive compounds. This research compares explosives of
different functional groups in their response to multiple ionization sources in an IMS
instrument.

11
CHAPTER 2
PRODUCTION AND UTILIZATION OF CO3- PRODUCED BY A CORONA
DISCHARGE FOR ATMOSPHERIC PRESSURE CHEMICAL IONIZATION
We have observed in API-MS studies of negative ions generated in air with a
point-to-plane corona discharge that the predominant ion observed under normal
operating conditions and gas flows is an ion at m/z 60. A nominal mass of 60 could occur
with an ion containing either 1 carbon and 3 oxygen atoms or 2 nitrogen and 2 oxygen
atoms. With the limits of resolution in a quadrupole system, it is impossible to tell the
difference between CO3- and N2O2
-. There is some uncertainty in the literature as to the
identity of the ion at m/z 60 formed at atmospheric pressure with a corona discharge,
being either CO3-, or N2O2
-. Many studies have indicated the formation of CO3- with
mechanisms for the formation involving O3- and CO2 although many of these were
performed at sub-ambient pressures (5-27kPa) [16]. Other studies have shown the
generation of N2O2- anion by electron beam ionized free jet expansion or pulsed electric
discharge of O2 and N2, pure N2O, and NO and argon [21,22]. Through pulsed
photoelectron spectroscopy three distinguishable forms of N2O2- were observed including
O2-·N2, O-·N2O, or NO-·NO. This was noted by Dono et al. while looking at the
abatement of VOCs by corona discharge [23]. Dono et al. noted the dilemma in ion
identity mentioned above and they favored (NO)2- since NO is a known product of
discharges in air. Further studies of corona discharges have discussed the production N2O
along with ozone [24] lending to the possibility of the formation of either CO3- or N2O2
-.
Siegel noted the presence of the m/z 60 and recognized that it could have been CO3- but

12
believed it was an adduct of O2- with N2 [25]. The goal of this study was to definitively
identify m/z 60 ion created in a corona discharge in air.
Experimental
Chemicals and Gases
UHP nitrogen, UHP argon and oxygen were obtained from Matheson Trigas,
(Albuquerque, NM). Zero air was generated from a pure air generator from Puregas, LLC
(Broomfield, Colorado). 18O labeled oxygen, 95% purity, was obtained from Cambridge
Isotope Laboratories, Inc. (Andover, MA). Nitroglycerine (NG) standard was obtained
from Cerilliant (Round Rock, TX) at 1000 μg/mL in acetonitrile and working solutions
were diluted in methanol to 1:10 for concentrations of 100 ng/μL. Carbon tetrachloride
was from Fisher Scientific.
Instrumentation
The atmospheric pressure ionization triple quadrupole mass spectrometer used in
these studies was an API-III (Sciex, Rexdale, Ontario). Data was collected on a
Macintosh Quadra 400 using API-Tune software provided with the instrument. It was
operated with the factory heated nebulizer probe and a corona discharge ionization
source. Typical interface voltages (IN) were between -300 and -600 VDC. The negative
corona discharge current was set at 3 µA. The other lens voltages were as follows:
Pinhole (OR) = -35, R0 = -30, R1 = -27, R2 = 45, R3 = 70. Argon was used as the
collision gas for collision induced dissociation (CID) studies. Nitrogen was used as the

13
auxiliary and curtain gases with flows of 2000mL/min and 400mL/min, respectively.
Oxygen was added to the nebulizer port at a rate of 5mL/min.
To obtain spectra generated with a 63Ni ionization source, the corona needle was
removed and a cylindrical 63Ni source housed within a Teflon block was placed at the end
of the nebulizer probe. Sample flow from the heated nebulizer passed through the 63Ni
source towards the inlet of the mass spectrometer. The source was floated -400 VDC
below the interface voltage so that anions would move from the 63Ni source towards the
mass spectrometer. For MS/MS operations argon was used as the collision gas with a
collision gas thickness of 125x1012 molecules cm-2. The voltage measured between OR
and R2, which determines the energy of the ion entering the collision cell, was 80V.
Aside from the point-to-plane corona and the 63Ni ionization sources, another
discharge sources was used to investigate the ionization of NG. This source, a distributed
plasma ion source (DPIS), is described in detail elsewhere [26]. It consisted of a 19
mm×19 mm microscope slide cover that was 0.018 mm thick. One side of the slide cover
was completely coated with titanium (large electrode), while the other side had a 4 mm
disk of titanium in the center (small electrode). The titanium was sputtered onto the glass
cover to an approximate thickness of 1.2 μm. Wires were attached to each electrode and
connected to a lab built power supply that provided an approximately 6 kV peak to peak
RF voltage at a frequency of 100 kHz. The glass slide cover was placed between a copper
washer and a Teflon cylinder 32 mm o.d., 13 mm i.d. and 10 mm thick. The large
electrode on the slide cover was placed on the copper washer so the small electrode was
in the center of the Teflon cylinder. The cylinder, source and copper washer were held

14
together by four nylon screws. Similar to the 63Ni ionization source, the DPIS was placed
on the end of the nebulizer and floated -400 VDC below the interface voltage.
Solutions of 100 μL of methanol containing 10ug of NG were added to the glass
liner of the heated nebulizer while at ambient temperature and no gas flow. After the
solvent was allowed to evaporate, the nebulizer heater was turned on (set point of 150 ºC)
to desorb the explosive. At this time the auxiliary and nebulizer flows were turned on at
rates of 500ml/min and 100ml/min, respectively. Significant quantities of NG remained
in the ionization region and were persistent in the spectra for approximately 10-20
minutes. Each spectrum collected was the result of approximately 25 scans (averaged).
Results and Discussion
Representative mass spectra of ions generated at atmospheric pressure of dry air
are displayed in Figure 2.1. Figure 2.1A represents ions formed with a 63Ni source and
Figure 2.1B ions formed with a point-to-plane corona discharge ionization source.
Predominant ions generated with 63Ni include O2-, O2
-·H2O and O2-·CO2 at m/z of 32, 50
and 76 amu, respectively. Typical ions generated with the point-to-plane corona
discharge are shown at m/z 32, 48 and 60 which are O2-, O3
- and the ion presumed to be
either CO3- or N2O2
-. The ion observed at m/z 60 is the largest ion with O3- being only
15% and O2- only 5% of the intensity of this peak under conditions of discharge current =
-3 µA, curtain flow of 400 mL/min, auxiliary flow of 400 mL/min and nebulizer flow of
100 mL/min.

15
Figure 2.1: Mass spectra of background ions generated (A) in air at atmospheric pressure with a 63Ni ionization source and (B) from a corona discharge ionization
source in synthetic air at atmospheric pressure.
A variety of conditions for corona discharge, including discharge current and gas
flow rates, were varied to observe the effects on the relative abundances of the ions
formed. The ranges for conditions are as follows: discharge current 1 µA to 5 µA; curtain
gas 300 mL/min to 2000 mL/min; and sample gas 800 mL/min to 5600 mL/min which
was the sum of the auxiliary and nebulizer gasses. Ion intensities at masses of 32, 46, 48,
50, 60, 62, and 76 were monitored under the various conditions. In almost all cases m/z
60 was the most prevalent ion. The relative intensities of the ions varied with changes to
the flow and the discharge current. For example, with the sample gas fixed at 800mL/min
and the discharge set at 5µA, at low curtain gas flow of 300 mL/min ions at m/z 46, 48
and 62 were about as intense as the 60 ion. However, as the curtain gas flow increased

16
from 300 to 2000 mL/min m/z 48, 6,2 and 46 decreased relative to the 60 ion. This is
likely due to the dilution of ozone and NOx produced in the discharge with increased
flows. Similar observations were noted by Ross and Bell [15]. The opposite behavior was
noted upon increasing the discharge current while gas flows were held constant yielding a
subsequent increase in m/z 46, 48 and 62. Previous studies with a dielectric barrier
discharge source showed that enclosing the source caused a shift in the predominant ion
from m/z 60 to 62 indicating the formation the nitrate ion [26]. It was postulated that
placing the source in an enclosure allowed concentrations of ozone and NOx to increase
which produced nitrate as the principal ion. In APCI chemistry, the ions that appear
range from m/z 32 to 60 to 62 and intensities of these ions depend upon experimental
conditions. However, in commercial APCI mass spectrometers using a point-to-plane
corona discharge in clean air, the ion at m/z 60 appears to dominate the spectra.
Knowing the identity of the m/z 60 is important for understanding the subsequent
ionization of analytes. One possible way of identifying the peak at m/z 60 would be to
look at the isotopic abundances of C, N, and O by measuring the ratios of M, M+1, and
M+2 to determine the number of carbon, nitrogen and oxygen atoms present. If the ion at
m/z 60 was CO3- then values (percent of the ion at m/z 60) of m+1 = 1.19% and
m+2=0.62% would be expected. If the ion was N2O2- then values of m+1 = 0.81% and
m+2 = 0.41% would be expected. Actual values of M+1 and M+2 were 25.63% and
6.89%, respectively, as shown in Figure 2.1B, which are much higher percentages than
those predicted from isotopic abundances alone and must result from contributions of
other ionic species such as NO3- at m/z 62.

17
Collisionally induced dissociation in a tandem mass spectrometer was another
method attempted to elucidate the structure and composition of m/z 60. It was hoped that
the daughter ions would give insight into the identity of the parent ion. As shown in
Figure 2.2, the only ion produced from the fragmentation of m/z 60 is the ion at m/z 16,
O- ion. Although this provided some information, it did not help in identifying the ion at
m/z 60 since it is possible that this ion could be generated from the fragmentation of
either CO3- or N2O2
-.
Figure 2.2: MS/MS of collision induced dissociation of m/z 60 showing only fragment
ion of 16 (O-).
Since the creation of the various ions occurs in air, predominantly containing
nitrogen and oxygen, the use of isotopically labeled oxygen or nitrogen was considered.
Upon using 18O labeled oxygen, the ion at m/z 60 would shift two mass units for every
18O atom present in the ion. Due to the cost of this gas and the high flow rates normally
used in the API source, the flows were modified in an attempt to use as little oxygen as
possible and yet maintain the same observed ionization chemistry. Zero air was replaced
with UHP nitrogen and the source was purged with nitrogen (at a flow rate of 2 L/min)
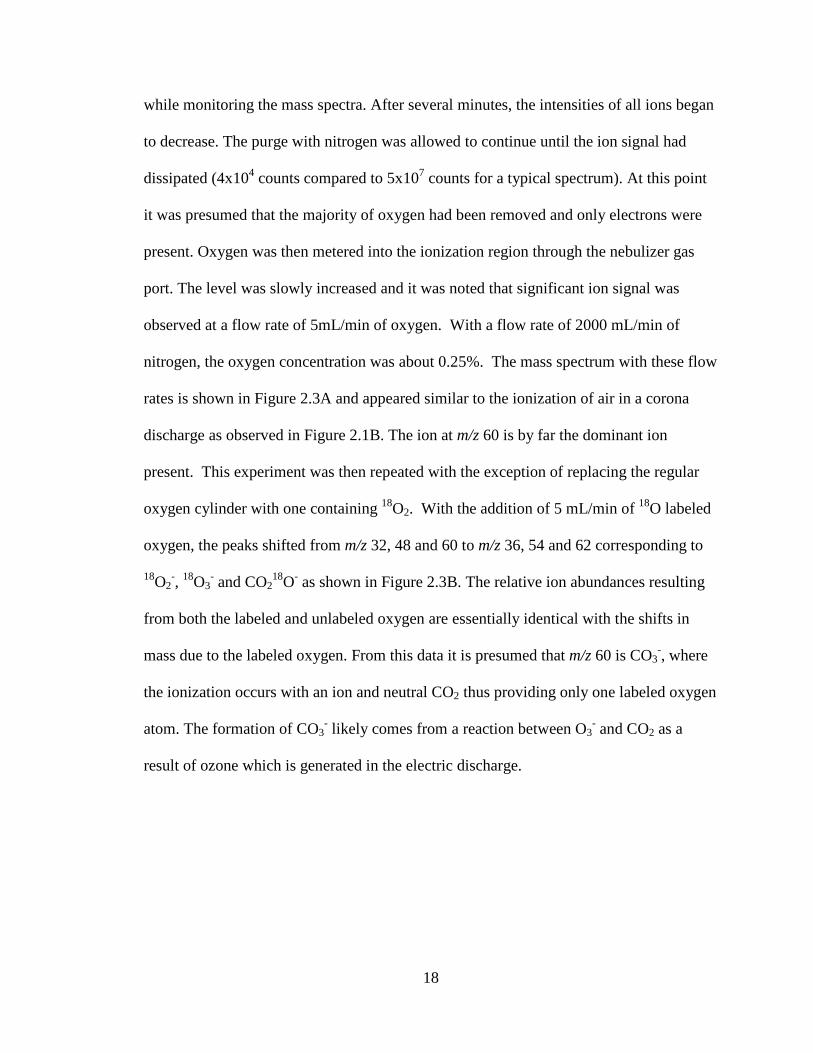
18
while monitoring the mass spectra. After several minutes, the intensities of all ions began
to decrease. The purge with nitrogen was allowed to continue until the ion signal had
dissipated (4x10⁴ counts compared to 5x10⁷ counts for a typical spectrum). At this point
it was presumed that the majority of oxygen had been removed and only electrons were
present. Oxygen was then metered into the ionization region through the nebulizer gas
port. The level was slowly increased and it was noted that significant ion signal was
observed at a flow rate of 5mL/min of oxygen. With a flow rate of 2000 mL/min of
nitrogen, the oxygen concentration was about 0.25%. The mass spectrum with these flow
rates is shown in Figure 2.3A and appeared similar to the ionization of air in a corona
discharge as observed in Figure 2.1B. The ion at m/z 60 is by far the dominant ion
present. This experiment was then repeated with the exception of replacing the regular
oxygen cylinder with one containing 18O2. With the addition of 5 mL/min of 18O labeled
oxygen, the peaks shifted from m/z 32, 48 and 60 to m/z 36, 54 and 62 corresponding to
18O2-, 18O3
- and CO218O- as shown in Figure 2.3B. The relative ion abundances resulting
from both the labeled and unlabeled oxygen are essentially identical with the shifts in
mass due to the labeled oxygen. From this data it is presumed that m/z 60 is CO3-, where
the ionization occurs with an ion and neutral CO2 thus providing only one labeled oxygen
atom. The formation of CO3- likely comes from a reaction between O3
- and CO2 as a
result of ozone which is generated in the electric discharge.

19
Figure 2.3: Mass spectra of the corona discharge with N2 and 5mL of oxygen (A)
with regular oxygen and (B) with 18O labeled oxygen.
The corona needle was replaced by the 63Ni source while maintaining the same
flows using labeled oxygen. Figure 2.4 shows the results of using 18O labeled oxygen
with the 63Ni ionization source. As expected, the ions at m/z 32, 50 and 76 shifted to m/z
36, 54 and 80 corresponding to 18O2-, H2O 18O2
- and CO218O2
-. The CO2 is likely present
as an impurity in the gas streams themselves or from small diffusion from the
surrounding room air. The presence of CO2 even in relatively pure gas streams is
expected at small levels (low ppmv range), similar to low ppmv amounts of water in zero
air. Globally averaged concentration of CO2 in air is around 383ppmv [27] and is
generally higher in urban areas and room air can be up to 10 times higher than

20
background levels, thus the presence of a CO2 is expected and is attributed to the
formation of CO3-.
Figure 2.4: Mass spectrum of 63Ni with 18O2.
In order to confirm the ion identity of m/z 60 as CO3-, MS/MS fragmentation was
performed on m/z 62 that was formed with the labeled oxygen in the corona discharge.
Fragment ions were produced at m/z 16 and 18 as shown in Figure 2.5. The abundance of
m/z 16 to 18 is approaching a 2:1 ratio, inferring the identity as C16O218O-. In contrast,
fragmentation of NO3- (m/z 62) produced different ions at m/z 32 and 46 which are O2
-
and NO2-. This indicates that the ion at m/z 62 formed in a corona discharge with labeled
oxygen is different than the nitrate ion formed at m/z 62 in a corona discharge in air. This
fragmentation pattern can be compared to the fragmentation displayed in Figure 2.2 of
m/z 60 which shows only m/z 16 as a fragment. These fragmentation patterns along with
the use of 18O labeled oxygen confirmed the identity of the m/z 60 ion as CO3-, likely
produced from a reaction between 18O3- and CO2.

21
Figure 2.5: MS/MS of the 62 ion from the 18O labeled oxygen.
To emphasize the importance of understanding the reactant ion chemistry and its
role on product ion formation, the ionization of nitroglycerin (NG) was explored with a
variety of reactant ions. For example with a distributed plasma ion source (DPIS) the
only reactant ion was nitrate ion. Upon the introduction of NG to the ionization region an
adduct between Nitrate and NG was formed as shown in Figure 2.6A. The spectrum only
contains NO3- at m/z 62 and NG·NO3
- at m/z 289. With a point to plane corona where the
main ion was CO3-, addition of NG provided a more complex spectrum displayed in
Figure 2.6B. In this spectrum many ions are evident including: NO2-, CO3
-, NO3- and
adducts NG·CO3- and NG·NO3
-. Although CO3- is the predominant reactant ion, O2
- and
O3- are also present and thought to interact with NG to produce NO2
- and NO3-
observable in the spectrum. When NG was added in the presence of a chloride ion, the
NG·Cl- adduct was formed, as shown in Figure 2.6C, at m/z 262 and 264. Nitrate and
nitrite ions are also observed in the presence of the chloride reactant ion, and thought to
result from complex, multistep ionization processes occurring in the discharge region.

22
Figure 2.6: Mass spectra of nitroglycerine (A) from a DPIS ionization source, (B) from a corona discharge ionization source and (C) from a corona discharge with
carbon tetrachloride.
Collision induced dissociation of the adducts of NO3-, CO3
- and 35Cl- with NG
were performed to investigate the fragment ions produced. These MS/MS spectra are
displayed in Figure 2.7. Fragmentation of NG·CO3- produces m/z 60 (B) where
fragmentation of NG·NO3- produces the NO3
- ion (A). The fact that CO3- is the only
fragment of the NG·CO3- adduct may indicate a high electron affinity of CO3
-, ranking it
close to that of NO3- (3.7-3.9 eV). In the NIST Webbook [18], electron affinity values for
CO3- range from 1.8-3.5 eV with later references indicating higher values. The
fragmentation pattern here indicates the charge resides with CO3- and tends to support the

23
high values listed. It is noteworthy that under similar fragmentation conditions, the
chloride adduct fragments into multiple ions, NO3-, NO2
- and Cl-, with NO3- being the
largest fragment peak (C). In IMS studies [28] it was shown that the chloride adduct of
NG, when heated in an IMS above about 130ºC, fragments to only provide the nitrate ion.
This was believed to be due to the high electron affinity of the nitrate (higher than that of
chloride). However the fragmentation pattern shown here is different, possibly indicating
a different mechanism i.e. in the IMS studies fragmentation occurs via thermal
decomposition and here it is collisionally induced. This indicates that direct comparisons
between the mass spectral data and the IMS data may not be directly correlated.
Figure 2.7: MS/MS of nitroglycerine (mw = 227) (A) from a DPIS ionization source (m/z 289, NO3 adduct), (B) from a corona discharge ionization source (m/z 287, CO3 adduct) and (C) from a corona discharge with carbon tetrachloride (m/z 262, 35Cl-
adduct).

24
CHAPTER 3
CHARATERIZATION OF A DISTRIBUTED PLASMA IONIZATION SOURCE
(DPIS) FOR ION MOBILITY SPECTROMETRY AND MASS SPECTROMETRY
This current work describes the development of a different type of corona
discharge ionization source that involves placing an RF voltage across two electrodes in
contact with and on opposite sides of a dielectric. This source is referred to as a
distributed plasma ionization source (DPIS) and preliminary results have been presented
previously [29,30]. A recent publication describes another ionization source that also uses
an alternating voltage placed across a dielectric material, referred to as a dielectric barrier
discharge ionization source that was developed for surface ionization of explosives [31].
Differences in this configuration are that a solid sample was placed on the dielectric
surface attached to a flat copper electrode, and the other electrode, a hollow tube with a
gas stream directed at the sample surface, was placed a few millimeters away.
This paper discusses the development of the DPIS that involves placing a high-
voltage, alternating current, across a dielectric to produce plasma. Reactant ions formed
in the plasma then ionizes sample vapors that are introduced into the ionization region.
The potential advantages of this source over a conventional point-to-plane corona
discharge are in the longevity of operation and inherent physical stability obtained by
fixing both electrodes to a solid surface. This study involves investigations into various
configurations of the source, an analysis of the positive and negative reactant ions
produced and subsequent ionization of selected compounds characterized by IMS and
MS.

25
Experimental
Source design
The distributed plasma ion source (DPIS) [29,32] can be of any shape and it
simply requires two electrodes of dissimilar size separated by a dielectric. The DPIS used
in this study was constructed with a 19mm X 19mm microscope slide cover that was
0.018mm thick (Perfect Parts Company, Baltimore, MD). One side of the slide cover was
completely coated with titanium (referred to as the large electrode), while the other side
had a 4mm disk of titanium in the center (referred to as the small electrode). The titanium
was sputtered onto the glass cover to an approximate thickness of 1.2 µm (Figure 3.1A).
Wires were attached to each electrode and connected to a lab built power supply that
provided an approximately 6kV peak to peak RF voltage at a frequency of 100 kHz and
was battery powered allowing the source and electronics to float to the desired DC
voltage. Application of this RF voltage across the two electrodes separated by the
dielectric caused the production of a plasma that was evident by a blue glow around the
outer edge of the small electrode.
The source was operated in two different physical configurations identified as open
and enclosed. The open source configuration consisted of only the glass slide cover with
wires connected to the electrodes using silver conductive paint (M.G. Chemicals in
Toronto, Ont., Canada) and is shown in Figure 3.1A. The glass slide was positioned
parallel to the interface plate of the mass spectrometer with the small electrode
approximately 1 cm in front of and facing the instrument’s orifice. For the enclosed
source configuration, shown in Figure 3.1B, the glass slide cover was placed between a
copper washer and a Teflon cylinder 32 mm o.d., 13 mm i.d. and 10 mm thick. The large

26
electrode on the slide cover was placed on the copper washer so the small electrode was
in the center of the Teflon cylinder. One wire was attached to the bottom of the copper
washer via a metal nut and a second wire was fastened to the small electrode with silver
conductive paint. The cylinder, source and copper washer were held together by four
nylon screws. A 5mm hole was placed into the side of the cylinder and an 8 mm wedge
(shown on the bottom of the cylinder in Figure 3.1) was cut out opposite the hole. The
enclosed source was oriented so that the slide cover was perpendicular to the interface
plate and the opening of the wedge was 1cm away from and facing the orifice. Air flow
passed through the hole, across the small electrode and through the wedge towards the
orifice of the mass spectrometer.
Figure 3.1: The distributed plasma ion source, DPIS consisting of a 19x19 mm
microscope slide cover with 1.2 µm thick titanium coating completely covering the bottom side (large electrode) and 4mm disc on top (small electrode). (A) the DPIS
shown in an open configuration wires were connected to each electrode (B) the enclosed DPIS contained in a Teflon cylinder.

27
IMS-QMS
The instrument used in the positive ion study was an ion mobility spectrometer
interfaced to a quadrupole mass spectrometer (IMS-QMS) constructed at Washington
State University (WSU, Pullman, WA). The basic design of the instrument can be
obtained elsewhere [33,34]. IMS operating conditions were as follows: IMS drift tube
length: 24.7cm; drift tube temperature: 200oC; atmospheric pressure: 690 torr; drift gas:
N2; drift gas flow rate: ~1000ml/min; voltage on the target screen 10.48kV; voltage on
the ion gate 8.97kV; distance between the target screen and the DPIS ~2cm. The DPIS
was floated to a voltage of 14.0kV
The IMS was interfaced to a model 150-QC ABB Extrel (Pittsburgh, PA)
quadrupole MS (m/z range of 0-4000 amu) via a 40-µm pinhole interface. The output
signal from the MS detector (electron multiplier) was further amplified by a Keithley
model 427 amplifier (Keithley Instruments, Cleveland, OH) and then sent to either the
MS data acquisition system or IMS acquisition system. Merlin software (ABB Extrel,
Pittsburgh, PA) was utilized for all mass spectral analysis and mass spectrometer control.
For the IMS gating and data acquisition, the electronic controls were built at Washington
State University. The data acquisition and IMS gate-control software employed was
Labview-based (National Instruments, Austin, TX, PC Card# PCI-M01-16XE-10,
Windows 2000) and modified at Washington State University. Ion mobility spectra were
obtained in two ways: full scan or single ion monitoring (SIM). In the full scan mode of
operation an IMS spectrum of all ions generated is obtained with the MS serving as an
ion transfer region between the IMS and the detector. In the SIM mode of operation, an

28
IMS spectrum of preselected ions is obtained with the MS used as an ion filter for ions of
specific m/z between the IMS and the detector.
APCI/MS/MS
The mass spectrometer used to investigate the DPIS in the negative ion mode was
a PE Sciex API-III triple quadrupole mass spectrometer (Thornhill, Ont., Canada) with a
point-to-plane corona discharge ionization source. The corona discharge needle was
removed from the factory supplied heated nebulizer APCI source. The DPIS was
interfaced to the mass spectrometer by pressing the 5 mm hole in the Teflon housing of
the DPIS around the glass tube protruding from the heated nebulizer. Sample flow from
the heated nebulizer passed across the surface of the DPIS towards the inlet of the mass
spectrometer. The DPIS was floated to -400 VDC below the interface voltage so that
anions would move from the source towards the mass spectrometer. Typical interface
voltages were between -300 and -600 VDC.
IMS
The ion mobility spectrometer used in the negative ion study was a Phemto-Chem
MMS 160 IMS (PCP Inc, West Palm Beach, FL). Operating conditions were as follows:
IMS reaction region: 5cm; drift tube length: 10 cm; drift tube temperature: 25.6oC;
atmospheric pressure: 646 torr; drift gas: purified air; drift gas flow rate: 550mL/min;
electric field: 200 V/cm; DPIS floating at 3000 VDC; The DPIS was placed about 2 cm
in front of the reaction region.
29
Chemicals
UHP Nitrogen (99.999% pure) obtained from Matheson Tri-gas, Albuquerque,
NM was used as the plenum gas in the Sciex MS. Purified air obtained from a Zero Air
Generator (Puregas, Broomfield, CO) was used as the nebulizer gas for the APCI/MS/MS
and for the drift gas in the PCP IMS. In the positive ion investigations, preheated counter
flowing drift gas (N2; 99.99% pure) at a flow rate of ~900mL/min was introduced at the
end of the IMS drift region after passing through a moisture trap (Aldrich Chemical Co.
Inc. (Milwaukee, WI, 53201, U.S.A.).
RDX, PETN and NG standards were obtained from Cerilliant (Round Rock, TX)
at 1000 μg/mL in acetonitrile and working solutions were diluted in methanol to 1:10 for
concentrations of 100 ng/uL. 50 μL (5 μg) of the dilution was added to the heated
nebulizer (cold). After the solvent was allowed to evaporate with the temperature off,
heat was applied to the nebulizer (to 150 ºC) to desorb the explosive. Auxiliary and
nebulizer flows were at 500mL/min and 100mL/min, respectively. Significant quantities
of RDX remained and were persistent in the spectra for approximately 10-20 minutes.
Each spectrum was the result of approximately 25 scans (averaged). Caffeine, 2,4-
lutidine and methamphetamine were obtained from Aldrich Chemical Co. Inc.
(Milwaukee, WI, 53201, U.S.A.) and were classified as ACS reagent grade with ≥ 99 %
purity.
30
Results and Discussion
Electric potential modeling
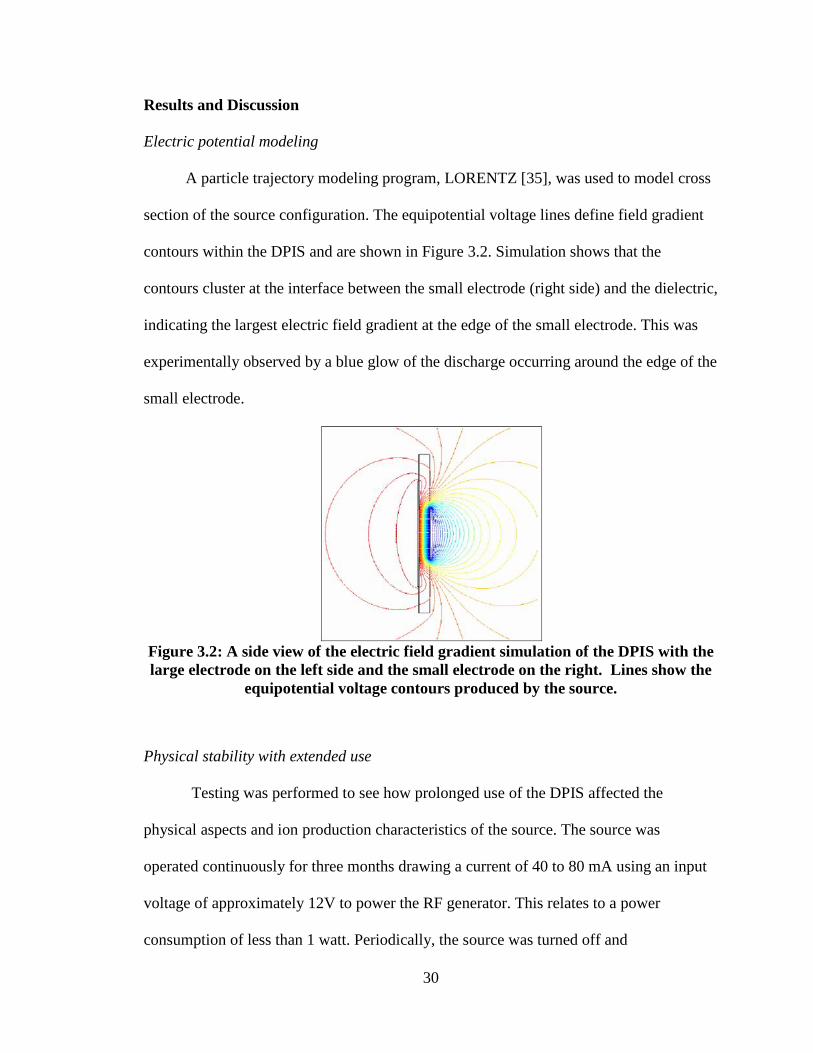
A particle trajectory modeling program, LORENTZ [35], was used to model cross
section of the source configuration. The equipotential voltage lines define field gradient
contours within the DPIS and are shown in Figure 3.2. Simulation shows that the
contours cluster at the interface between the small electrode (right side) and the dielectric,
indicating the largest electric field gradient at the edge of the small electrode. This was
experimentally observed by a blue glow of the discharge occurring around the edge of the
small electrode.
Figure 3.2: A side view of the electric field gradient simulation of the DPIS with the large electrode on the left side and the small electrode on the right. Lines show the
equipotential voltage contours produced by the source.
Physical stability with extended use
Testing was performed to see how prolonged use of the DPIS affected the
physical aspects and ion production characteristics of the source. The source was
operated continuously for three months drawing a current of 40 to 80 mA using an input
voltage of approximately 12V to power the RF generator. This relates to a power
consumption of less than 1 watt. Periodically, the source was turned off and

31
photographed under a microscope (Leica, DME, Leica Microsystems inc., Buffalo, NY)
with an overall magnification of 40x. Figure 3.3 shows the magnified small electrode at 4
intervals encompassing about 1 month of continuous operation: (A) prior to operation,
(B) after 6 days, (C) after 16 days, and (D) after 33 days. The small circular electrode, as
seen in Figure 3.1, mostly fills the square with an attached wire partially visible from the
bottom left with a bead of silver paint as seen at the center. After 6 days of continuous
operation, surface deterioration became apparent as seen by the ring surrounding the
outer edge of the small electrode where the discharge occurs. Figure 3.3C is a photograph
of the source after 16 days of continuous operation; note that the corrosion had increased
as evident by the broader ring. After 33 days significant corrosion over the entire surface
of the source was observed; however, the source was still producing ions. The source was
operated for an additional 2 months and a blue glow was still visible when the experiment
was halted. In all our experience with operating various configurations of the DPIS,
whenever a blue glow was observed, subsequent ions were detectable by the mass
spectrometer.

32
Figure 3.3: Magnified images over 33 days of the continuous operation of the DPIS. Photograph of the small electrode (A) prior to use, (B) after 6 days, (C) after 16 days
and (D) after 33 days.
Positive Ions in DPIS
Ions generated by the open DPIS were introduced into the IMS-QMS and IMS
spectra were acquired by operating the quadrupole mass spectrometer in either single ion
mode (SIM) or full scan where the quadrupoles were operated in RF only and passed all
ions through to the detector. Each IMS spectrum illustrated was an average of 200 IMS
spectra. Background ions produced by the ionization of air were mass identified as
(H2O)nH+ with m/z 37 ion (n=2) as the most abundant ion. Ion mobility spectra of
background ions produced by point-to-plane corona discharge (A) and open DPIS (B) are
shown in Figure 3.4. Intensity of ions observed by the open DPIS was approximately
two-thirds of that observed with corona discharge under identical experimental conditions
with the exception of the physical location of the sources. The DPIS was positioned
~2cm away from the target screen of the IMS whereas the corona discharge needle was

33
~0.5 cm away from the target screen. The difference in intensities between the sources
could be due to the difference in ion transfer efficiency from the source to the
spectrometer because of the relative source-spectrometer distances and/or electric field.
The drift time of the positive reactant ions was 13.23 ms with Ko value of 2.70 cm2V-1s-1.
Figure 3.4: Ion mobility spectra of positive background ions produced by (A) corona
discharge and (B) open DPIS from ionization of ambient air.
Ionization of 2, 4-lutidine, caffeine and methamphetamine was achieved by
positioning a plastic strip (3mm wide, 1mm thickness), on the tip of which each of the
analytes were deposited, in the space between the IMS target screen and the ionization
source. Figure 3.5 illustrates the ion mobility spectra of 2, 4-lutidine acquired in full scan
mode of operation of the IMS-QMS with corona discharge (A) and open DPIS (B). IMS
response peaks for reactant ions and protonated 2, 4-lutidine monomer (m/z 108) were
observed.

34
Figure 3.5: Ion mobility spectra of 2, 4-lutidine produced by (A) corona discharge
and (B) open DPIS. IMS peaks of the protonated water reactant ions and protonated monomer ions of the 2, 4-lutidine are shown at mobility values of 2.70
and 1.95 cm2 V-1 s-1, respectively.
Figure 3.6 shows the ion mobility spectra of caffeine (mol wt: 194),
methamphetamine (mol wt: 149) and lutidine (mol wt: 107) acquired in SIM mode of
operation with the IMS-QMS and the open DPIS as the ion source. Dominant ions
observed in the IMS for caffeine, methamphetamine and lutidine were the protonated
molecular ions of each at m/z values of 195, 150, and 108, respectively. Except for an
increase in intensities of the peaks, the analytes ionized by corona discharge were similar
to those generated by the open DPIS. The reduced mobility values (Ko) of the analytes
were calibrated against the Ko value of 2, 4-lutidine as 1.95 cm2V-1s-1 and were measured
to be: caffeine 1.54 cm2V-1s-1 and methamphetamine 1.63 cm2V-1s-1.

35
Figure 3.6: Single ion monitored (SIM) ion mobility spectra of methamphetamine
(m/z 150), caffeine (m/z 195), and 2, 4-lutidine (m/z 108) using the open DPIS.
Negative Ions in DPIS
Negative ions generated in clean air were investigated with the API-III mass
spectrometer. The negative reactant ions were created using a variety of ionization
sources including a 63Ni foil, the factory installed point-to-plane corona discharge, the
open DPIS and the enclosed DPIS. The DPIS and 63Ni ionization sources were all
floating at about -400V below the interface potential. Representative spectra from each
source are shown in Figure 3.7. The atmospheric pressure ionization of air by 63Ni
produced O2- and O2
-·CO2. The conventional corona discharge ionization source
produced predominantly CO3- in air. The DPIS in an open configuration produced CO3
-
ions similar to those from the corona discharge source. The enclosed DPIS source
produced mainly NO3- ions.

36
Figure 3.7: Mass spectra of negative ions generated in purified air with 63Ni, point-
to-plane corona, open DPIS, and enclosed DPIS.
Increasing flow rates to the corona discharge source of an IMS have been shown
previously to shift the reactant ion chemistries to favor the production of O2- [15,36].
Ross and Bell [15], using a reversed high flow (100-500 mL/min) in a continuous corona
discharge in air at atmospheric pressure, showed that concentrations of O3-, CO3
-, and
NO3- decreased, and the ions observed were O2
- and O2-·CO2, similar to the reactant ions
from a 63Ni source at atmospheric pressure. When the reverse flow rate was reduced to ≤
50 mL/min or changed to the forward direction at high flows (250-500mL/min) CO3- was
the predominant ion observed. Other ions produced under these conditions included O3-
and NO3-. Nitrate became the predominant ion at lower forward flow rates (50-
200mL/min). The shift from O2- to CO3
- to NO3- occurs due to the buildup of neutrals in
the discharge region, including O3 and NOx, along with other air contaminants such as

37
CO2. The formation of CO3- may result from a reaction of CO2 with O3
-. Subsequent
reactions involving NOx yield the NO3- ion. With the DPIS in an open configuration,
ozone is produced and the CO3- is the predominant ion. The enclosed DPIS allows NOx to
concentrate in the source thus generating NO3- as the major reactant ion.
Ion mobility spectra of air obtained using a 63Ni source and an enclosed DPIS are
shown in Figure 3.8. The reactant ion appearing from the 63Ni source at ambient
temperature with a reduced mobility value of 2.17 cm2V-1s-1 was inferred to be O2- [37].
The reactant ion for the DPIS appeared to the right of the peak generated from the 63Ni
source under similar conditions. It had a reduced mobility value of 1.98 cm2V-1s-1 and
was believed to be NO3- as observed with the Sciex mass spectrometer. Other
investigations have shown the nitrate peak appearing to the right of the O2- reactant ion
[38,39]. In an IMS with an O2- mobility value of 2.57 cm2V-1s-1, NO3
- was found at 2.46
cm2V-1s-1 [38]. Although the mobility values reported do not match those given here, the
previous values were measured between 110 ºC and 150 ºC, and shifts toward higher
mobility could be due to desolvation of the reactant ions. The peak intensity in the spectra
from the DPIS is 5-6 times lower than that with 63Ni as ion source. This was due to a loss
in ion transmission through the DPIS interface to the IMS and not to lower ion currents
being generated. Another interesting note is the lack of other peaks in the spectra. This is
believed to result from the relatively high electron affinity and non-reactivity of NO3-.
The mass spectra of the enclosed DPIS source showed a similar result with NO3- as the
dominant peak and relatively few minor peaks compared to the other ionization sources.
Since negative ionization processes mainly involve electron transfer, proton abstraction

38
or adduct formation between the reactant ion and the analyte, the identity of the reactant
ions will impact the ionization of analytes.
Figure 3.8: IMS spectra of negative ions produced by the atmospheric pressure ionization of clean air at ambient temperature with 63Ni and an enclosed DPIS.
One of the major applications of IMS is in the detection of explosives.
Commercial ion mobility spectrometers utilize a 63Ni source with a chloride dopant for
explosives detection. Under these conditions, RDX ionizes by forming an adduct ion
(RDX·Cl)- with the chloride ion [40]. In the absence of the chloride dopant, RDX ionizes
by first producing NO2- and at higher concentrations of RDX the (RDX·NO2)- adduct is
formed [41]. Mass spectrum obtained from the ionization of RDX in the presence of the
CO3- reactant ion is shown in Figure 3.9B. The CO3
- ion was generated from a corona
discharge source. Upon introduction of the RDX (mw=222) to the corona discharge
source the NO2- is formed along with the most intense peak at m/z of 268 which is the
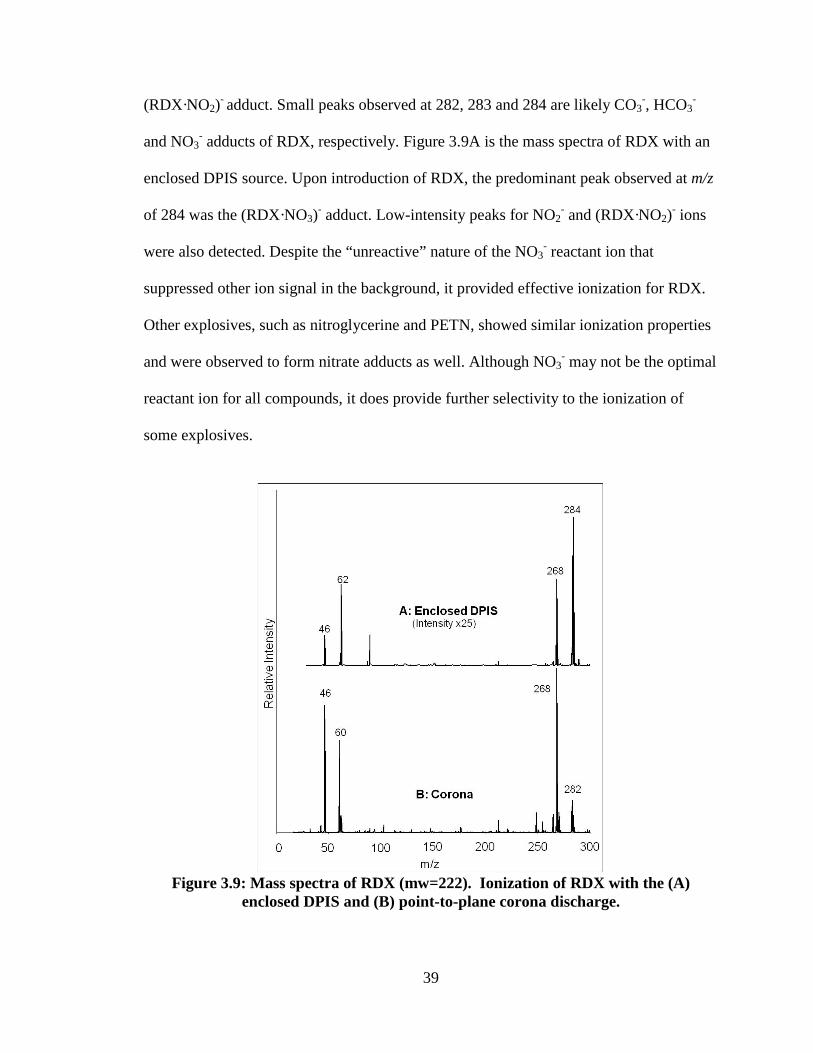
39
(RDX·NO2)- adduct. Small peaks observed at 282, 283 and 284 are likely CO3-, HCO3
-
and NO3- adducts of RDX, respectively. Figure 3.9A is the mass spectra of RDX with an
enclosed DPIS source. Upon introduction of RDX, the predominant peak observed at m/z
of 284 was the (RDX·NO3)- adduct. Low-intensity peaks for NO2- and (RDX·NO2)- ions
were also detected. Despite the “unreactive” nature of the NO3- reactant ion that
suppressed other ion signal in the background, it provided effective ionization for RDX.
Other explosives, such as nitroglycerine and PETN, showed similar ionization properties
and were observed to form nitrate adducts as well. Although NO3- may not be the optimal
reactant ion for all compounds, it does provide further selectivity to the ionization of
some explosives.
Figure 3.9: Mass spectra of RDX (mw=222). Ionization of RDX with the (A)
enclosed DPIS and (B) point-to-plane corona discharge.
40
CHAPTER 4
MECHANISMS FOR NEGATIVE REACTANT ION FORMATION IN AN
ATMOSPHERIC PRESSURE CORONA DISCHARGE
APCI of air with a point-to-plane corona discharge in mass spectrometry has been
shown to produce CO3- ions as the predominant reactant ion along with smaller amounts
of O3-, NO2
-, NO3- and O2
- [16,17,42]. The production of these ions appears to be related
to the generation of NOx and ozone from a discharge in air. The composition of clean
(nonurban) tropospheric air is predominantly nitrogen (78%), oxygen (21%) and argon
(0.9%) and also contains high levels of CO2 (355 ppm) [43]. The primary neutrals
generated in a discharge in air include NOx (NO & NO2) and O3, and to a lesser extent
N2O. [24, 44] The presence of these neutrals along with electrons generated in the source
causes the production of CO3-. As the concentrations of ozone and NOx increase, the
formation of NO3- ions are observed. The production of NO3
- ions was specifically noted
in the development of a distributed plasma ion source (DPIS) [26]. When this source was
enclosed inside a cylinder, the subsequent ions observed by a mass spectrometer were
exclusively NO3- ions.
Since the identity of the reactant ions plays a significant role in the resulting
product ions, it is imperative that the ionization processes occurring in the IMS source be
well understood and predictable. In an effort to further the use of corona discharge
ionization with IMS, a detailed examination of the discharge ion source products was
conducted. This was achieved by extracting neutrals generated in a discharge source and
introducing them, in a controlled manner, into an IMS containing a 63Ni ionization
source. As a consequence, the ion chemistry and desired selectivity could be attained.

41
The motivation of this effort was to investigate the ion formation as related to the
presence of NOx and ozone in the ionization region and relate the appearance of these
ions to published reaction rates and gas composition for various pertinent reactions.
Experimental
Instrumentation
An ion mobility spectrometer interfaced to a triple quadrupole mass spectrometer
IMS/MS/MS model MMS 160 (PCP Inc, West Palm Beach, FL) was used in these
experiments and has been described in detail elsewhere [45]. This instrument contains a
63Ni ionization source. Operating conditions were as follows: IMS reaction region: 5 cm;
IMS drift tube length: 10 cm; IMS drift tube temperature: 140 oC; IMS pressure: 750 torr;
drift gas: air at 600 mL/min; carrier gas: air at 100 mL/min; electric field: 3000 V total or
200 V/cm; gate width: 200 µs. The interface region, pumped by a mechanical rough
pump, was maintained at a pressure of 280 millitorr. Data collection and instrument
control were performed using a PC operating with MS Dos version 6.00 and using KEY 3
version 1.21 software (Keystone Applications). Four types of spectra were obtained with
this system including: normal mass spectra (MS); ion mobility spectra with the Faraday
plate at the end of the drift region (IMS-F); ion mobility spectra with the electron
multiplier (IMS-EM); and ion mobility spectra with selected ion monitoring (IMS-SIM).
The mass spectra were collected by operating the IMS with the ion gates fully open. The
IMS-F spectra were used to measure drift times and subsequent calculation of the
reduced mobility values (Ko) [5] reported in this paper. Calculated reduced mobility
values measured throughout the experiments remained constant and varied only slightly,

42
on the order of 0.01 cm2 V-1 s-1. This reproducibility was achieved by maintaining
constant temperature and moisture conditions throughout this study. IMS-EM spectra,
which used the electron multiplier from the mass spectrometer as the detector while the
quadrupoles were operated to pass all ions, produced essentially identical spectra
compared with IMS-F with the exception of a shift of approximately 0.5 ms to longer
drift times. This delay is attributed to the time required for the ions to pass through the
interface region and the mass spectrometer, and variances in the shift are due to
differences in ion mobility. To identify the drift time of an ion with a specific m/z, an
IMS-SIM was collected by setting the quadrupoles to pass a specific m/z while
monitoring the drift time. The drift time of this ion could then be compared to the drift
times from the IMS-EM and from this correlated to the IMS-F to link m/z to a specific
reduced mobility value.
Chemicals / Gases
Zero air was produced from compressed house air and passed through a Pure Air
Generator model CO2RP140 (Domnick Hunter, Charlotte, NC). Manufacturer’s
specifications were < 1 ppm CO2, < 0.003 ppm non-methane hydrocarbons and a dew
point of -70 oC. The actual water concentration was measured to be < 20 ppmv as
determined by a Moisture Image Series I Hygrometer (GE Panametrics, Billerica, MA).
UHP Helium was obtained from Oxarc (Pasco, WA). O2 (99.998%) was obtained from
Matheson Gas Products, Inc. (Newark, CA). RDX at 0.1 mg/mL in 50% methanol 50%
acetonitrile was acquired from AccuStandard (New Haven, CT).

43
Experimental Setup
Neutral vapors (O3 and NOx) generated from a discharge source were introduced
at varying concentrations into the IMS containing a 63Ni ionization source using a
reactant gas chamber in which the delivery rate of atmospheric gasses to the IMS could
be controlled. The ions produced by the 63Ni source were monitored with both the IMS
and the MS. The goal of this investigation was to better understand the process in which
reactant ions are formed in a discharge ionization source compared to that of 63Ni. In
order to accomplish this, three separate configurations of the reactant gas chamber were
utilized: a Static Container, a Dynamic Container and a Continuous Flow Tube.
The discharge source used for both the Static and Dynamic Container experiments
was a distributed plasma ion source (DPIS) described in detail elsewhere [26]. It
consisted of a 19 mm × 19 mm microscope slide cover that was 0.018 mm thick. One
side of the slide cover was completely coated with titanium (large electrode), while the
other side had a 4 mm disk of titanium in the center (small electrode). The titanium was
sputtered onto the glass cover to an approximate thickness of 1.2 µm. Wires were
attached to each electrode and connected to a lab built power supply that provided an
approximately 6 kV peak to peak RF voltage at a frequency of 100 kHz. The glass slide
cover was placed between a copper washer and a Teflon cylinder 32 mm o.d., 13 mm i.d.
and 10 mm thick. The large electrode on the slide cover was placed on the copper washer
so the small electrode was in the center of the Teflon cylinder. The cylinder, source and
copper washer were held together by four nylon screws. Although the original design of

44
this source was so that it could be located in front of a mass spectrometer, it was used
here for generating ozone and NOx in air.
The Static Container, shown in Figure 4.1, consisted of a 500 mL Nalgene bottle
with electrical leads that passed through the side of the bottle and connected the DPIS to
the power supply. Purified air or oxygen was introduced through a 1/8” Teflon tube near
the top of the bottle. The DPIS was operated continuously for specified amounts of time
and then gas samples were taken from the bottle for evaluation by a syringe through a
small hole near the bottom of the bottle and injected into the inlet of the IMS.
For the Dynamic Container, the Static Container was modified for continuous
flow by placing a second 1/8” tube in the bottom of the bottle shown in part b of Figure
4.1. Purified air was added through the tube in the top of the bottle and the effluent out
the bottom that was connected to the inlet of the IMS. This allowed for continuous
monitoring of gases produced during operation of the DPIS, which was operated at a 50%
duty cycle (5 s on 5 s off).

45
Figure 4.1: A diagram of the Nalgene bottle used for the Static and Dynamic
Container experiments. The Static Container was prepared by first by flushing the container with the desired gas, then stopping the flow and withdrawing an aliquot
with a syringe. The Dynamic Container used a continuous flow of gas and the outlet was interfaced to the IMS.
The Continuous Flow Tube was configured to allow near real-time control of the
ozone and NOx concentrations by placing the discharge in a relatively low volume
Swagelok cross. A discharge was established in the center of the 1/4” Swagelok stainless
steel cross as shown in Figure 4.2. Two 0.026” diameter metal wires housed inside
telescoping Teflon tubing (1/16”, 1/8” and 1/4”) were placed into two opposite openings
of the cross. This provided a nearly gas tight seal and allowed for the electrical isolation
of the wires. The wires were brought together in the center of the Swagelok cross and
separated by ~ 3x19 mm section of a 0.018 mm thick glass microscope slide cover that
was held in positioned by the two wires. The power supply used to operate the DPIS was

46
connected to these two wires and a discharge occurred at the point where the wires
contacted the dielectric. Zero air, at a rate of about 150 mL/min, was introduced into one
of the remaining openings of the cross perpendicular to the wires and flowed parallel to
the slide cover, then out the opposing opening. The outlet flow was split with a tee and
two metering valves so that part of the effluent (typically a few mL) went to the inlet of
the IMS and the remainder was vented.
Figure 4.2: A diagram of the Continuous Flow Tube apparatus consisting of a 1/4”
stainless steel Swagelok cross. The discharge occurs at the center of this cross where two 0.026” diameter metal wires meet separated by a glass slide. A continuous stream of purified air passes over the discharge and a fraction of the effluent is
presented to the inlet of the IMS.
The original IMS inlet consisted of a 1/8” Swagelok fitting used for vapor
introduction. In order to introduce a sample of RDX while adding effluent from the
discharge source, this inlet was modified to include the addition of a 1/8” tee so that a
wire could be inserted into the heated portion of the IMS inlet. The air flow from the
discharge came in via the arm of the tee so the air could flow across the wire and into the

47
IMS ionization region carrying both the RDX sample and the discharge effluent. About 1
µL of a solution containing 30 ng RDX in methanol/acetonitrile was placed on the tip of
the wire and the solvent was allowed to evaporate before the wire was inserted into the
inlet.
Results and Discussion
The Static Container was designed to test if neutrals (ozone and NOx), generated
in a plasma, could be added to a standard IMS ionization region containing 63Ni and
produce the types of ions generated in a corona discharge ionization source. The resulting
spectra are shown in Figure 4.3, with Figure 4.3a representing clean IMS-F spectrum of
zero air. The DPIS was operated for 1 minute in the flask that had previously been purged
for several minutes with purified air. The DPIS was then shut off and a 2 mL sample of
air was extracted with a 3 mL disposable syringe and injected into the IMS. The resulting
spectrum is displayed in Figure 4.3b. The smaller peak on the left was identified as NO2-
and the larger peak as O2- using the IMS-SIM mode of operation (data not shown). Note
the slight increase in the NO2- ion and subsequent decrease of the O2
- ion with the
addition of gas from the discharge source. This indicates that low levels of gasses from
the discharge source lead to the production of NO2- ions within the 63Ni ionization source
of the IMS indicating that NO2 is generated in the discharge. To determine if this was
indeed the case and that the addition of ozone in the presence of air in the 63Ni source
would not produce NO2-, the study was repeated in the absence of nitrogen in the
discharge region. The flask was purged for several minutes with helium to remove the air
and then it was purged with oxygen. The discharge was again operated for 1 minute and a

48
2 mL sample of gas from the flask was added to the IMS. The resulting spectrum is
shown in Figure 4.3c. The intensity of the NO2- peak in Figure 4.3c is less than the NO2
-
peak in Figure 4.3a and 4.3b. First it appears that NO2 is not generated with the discharge
in a nitrogen free environment since the NO2- peak is even lower than the background
NO2- peak. It is possible that ozone may play a role in the ionization region, possibly
reacting with NO2-, producing other ions seen as small peaks to the left of NO2
- and the
right of O2-.
Figure 4.3: IMS-F spectra of (a) zero air, (b) 2 mL of gas sampled from the Static
Container with zero air after 1 minute discharge and (c) 2 mL of gas sampled from the Static Container with O2 after 1 minute discharge.
Similar to the conditions used to produce Figure 4.3, the Static Container was
flushed with purified air and then the DPIS was operated for a longer period of 5 minutes.

49
A 2 mL sample of gas from the Static Container was introduced into the IMS and the
resulting spectrum is shown in Figure 4.4a. The ions observed by the MS, as shown in
Figure 4.4b, were O2-, NO2
-, CO3- and NO3
- observed at m/z values of 32, 46, 60 and 62
respectively. The position of these ions is indicated in the mobility spectra in Figure 4.4a
and were determined using the mass spectrometer.
Figure 4.4: (a) ion mobility spectrum and (b) mass spectrum of 2 mL of gas sampled
from the Static Container with zero air after the discharge was operated for 5 minutes.
To link these ions with the respective peaks in the ion mobility spectra, IMS-SIM
scans of m/z 32, 46, 60 and 62 were acquired and compared to an IMS-EM spectrum. The

50
IMS-EM spectrum is shown in Figure 4.5a and the IMS-SIM scans of m/z of 46, 60 and
62 are shown in Figure 4.5 c, d and e, respectively and were collected with 10 mL/min of
150 mL/min discharge gas added to the ionization source. The IMS-SIM of m/z 32,
shown in Figure 4.5b, is from zero air with no discharge and shows where the O2- ion
appears in the mobility spectra as a reference. Reduced mobility values from the IMS-F
spectra were calculated to be 2.83, 2.65, 2.61 and 2.56 cm2 V-1 s-1 for NO2-, CO3
- , O2-
and NO3- , respectively.
Figure 4.5: IMS spectra of discharge gas from the Continuous Flow Tube collected with the electron multiplier in the mass spectrometer. The IMS-EM, displayed on
top, shows the total ion current followed by selected ion monitoring of m/z 32, 46, 60 and 62 in order from top to bottom.
In order to monitor the spectra directly as the concentration of ozone and NOx
increased, the Dynamic Container was used. A continuous flow of 40 mL/min passed

51
through the bottle and was added to the inlet of the IMS containing a 63Ni ionization
source. In Figure 4.6, the x-axis represents the duration of time the discharge source was
operated within the bottle. The increase in operation time of the discharge source
correlates to an increase in the concentration of ozone and NO2. Figure 4.6 is a plot of the
various peak intensities for each specific ion species indicated. The intensities at the
locations of each ion species, indicated in Figure 4.4a and identified by mass
spectrometry in Figure 4.5, were plotted against the time of discharge operation. The
transition from O2- to NO2
- to CO3- and finally to NO3
- was observed. The NO3- ion
became the predominant peak at about 60 seconds and nearly the only peak after about
160 seconds. Plotting the spectra in this manner shows the transition between species that
may overlap in the mobility spectra. Specifically O2- and CO3
- have essentially the same
mobility under these experimental conditions. In Figure 4.6 this shift is observed in the
discontinuity seen between the curves for O2- and CO3
-. Although this peak appears at the
same mobility, further investigation of the mass spectra indicated O2- was dominant early
on in the experiment, but it quickly disappeared from the spectra at the onset of the
nitrate, nitrite and CO3- ions.

52
Figure 4.6: IMS peak intensities at increasing discharge times. The source was
operated at a 50% duty cycle with 40 mL/min continuous flow of zero air through the Dynamic Container and into the IMS.
The chemical reactions, displayed in Table 4.1, in conjunction with estimated gas
concentrations of [N2]=1.4x1019 cm-3, [O2]=3.7x1018 cm-3and [CO2]=1.8x1012 cm-3 (0.1
ppmv) at 140oC and 750 torr were used to calculate reaction times. These reaction times
along with ion residence times within the IMS are used to explain the relative intensities
of ions observed in Figure 4.6.
Chemical Reaction Rate constant Reaction
e- + O2 + N2 → O2- + N2 k = 1.0x10⁻³¹ cm6/s (1)
O2- + NO2 → NO2
- + O2 k = 2.0x10⁻⁹ cm3/s (2)
O2- + O3 → O3
- + O2 k = 6.0x10⁻¹⁰ cm3/s (3)
O3- + NO2 → NO2
- + O3 k = 7.0x10⁻¹⁰ cm3/s (4)
O3- + CO2 → CO3
- + O2 k = 5.5x10⁻¹⁰ cm3/s (5)
CO3- + NO2 → NO3
- + CO2 k = 2.0x10⁻¹⁰ cm3/s (6)
NO2- + O3 → NO3
- + O2 k = 1.2x10⁻¹⁰ cm3/s (7)
Table 4.1: Negative Ion Reaction Rate Constants [46].

53
An example calculation of reaction time is provided for the capture of an electron by
oxygen in air from reaction 1. Other reaction times were calculated in a similar manner
using given or estimated neutral concentrations.
e- + O2 + N2 → O2- + N2 k = 1.0x10⁻³¹ cm6/s
Reaction time = 1 / (k [O2] [N2])
= 1 / (1.0x10⁻³¹ cm6/s [3.7x1018 cm-3] [1.4x1019 cm-3])
= 1.9x10⁻⁷ s or 190 ns
The estimate of the concentration for CO2 at 0.1 ppmv was based upon the manufacture’s
suggestions of dry air contents <1 ppmv as discussed in the experimental section and was
assumed to be constant. This concentration was not independently measured and it is
recognized that it could be higher due to diffusion of room air into the system through
sample introduction. The amount of NO2 and ozone generated was unknown, however it
seems reasonable that the amount would continue to increase as the source is operated for
longer periods of time. To establish a starting point for calculations, the concentrations of
nitrogen dioxide and ozone were set to be equal and three concentrations corresponding
to 0.01, 0.02 and 0.1 ppmv were used to compare subsequent reaction times. The
calculated reaction times under these conditions are provided in Table 4.2.

54
Concentrations of NO2 = O3
Reaction 1.8x1011 cm-3 (0.01ppm) 3.5x1011 cm-3 (0.02ppm) 1.8x1012 cm-3 (0.1ppm)
1 190 ns 190 ns 190 ns
2 2.8 ms 1.4 ms 0.28 ms
3 9.3 ms 4.8 ms 0.93 ms
4 7.9 ms 4.1 ms 0.79 ms
5 1.0 ms 1.0 ms 1.0 ms
6 28 ms 14 ms 2.8 ms
7 46 ms 24 ms 4.6 ms
Table 4.2: Reaction times for reactions 1-7 with varying concentrations of [NO2] = [O3] as indicated.
With the exception of the electrons, the ions formed here had drift times on the
order of between 10-15 ms in a 10 cm drift region. The ionization region is 5 cm, thus ion
residence times within this region are on the order of about 5 ms. Reaction (1) is always
ongoing and fast, occurring in about 190 ns. In air the O2- ion is the major ion observed,
often along with a peak at m/z 76 corresponding to O2-·CO2. With the introduction of NO2
and O3, the O2- generated by reaction (1) has the opportunity to react to form the NO2 and
O3, as shown in reactions (2) and (3). At the selected concentrations of 0.01 ppmv for the
second column in Table 2, the reaction time to form NO2- occurs in less than 3ms and
should be observed in the IMS spectra. All other reaction times are slow, with the
exception of reaction (5), compared to the time scale of the IMS, and reaction (5)
depends first upon the production of O3- in reaction 3 and thus should not occur in the
experimental time scale. This trend is observed in the first 30 seconds in Figure 4.5. As
the concentration of ozone and NO2 increases, NO2- continues to increase and reaches a
peak at around 35 seconds. This is also the point where CO3- and NO3
- begin to form. The

55
intensity of the NO2- peak drops off as NO2
- reacts with increasing levels of ozone
forming NO3-. The nitrate ion can also be formed with the reaction of CO3
- and NO2. In
either case the final ion formed is the nitrate ion which dominates the spectra at high
concentrations of neutrals generated in the discharge. O3- does not appear in the IMS
spectra under any conditions. This results from the reaction times for equations 4 and 5
being faster than the reaction times for the formation of O3-. Once O3
- is formed under
these conditions it will quickly react with either CO2 or NO2 to form CO3- or NO2
-. Even
at a conservative estimated concentration of CO2 (0.1 ppmv) the reaction rate with O3- is
about 1 ms and thus O3- should not survive the transit time in the IMS.
Based on the observation that as the concentration of neutrals generated in an
electric discharge increase and the ions formed transition from NO2- to CO3
- to NO3-, an
attempt was made to establish a method to maintain a stable level of a particular ion. For
this purpose the Continuous Flow Tube design was created. The small volume, flow rates
and split ratio allowed for controlled and continuous introduction of neutral ozone and
NO2 into the inlet of the IMS. With the continuous flow tube, three different flow rates
were used to establish the desired predominant ion. A split flow of about 10 mL from the
original 150 mL passing through the source was added to the inlet of the IMS and was
considered a “medium” flow rate. Slight adjustments of ± a few mL/min altered the
observed ions and for distinction are labeled low, medium and high flow rates. The
resulting spectra are shown in Figure 4.7 with (a) no discharge, (b) low flow, (c) medium
flow and (d) high flow. With no discharge gases the O2- ion is the predominant and nearly
only peak present. At low flows the NO2- ion is essentially the only peak present. At
medium flow settings the NO2-, CO3
- and NO3- were all present with CO3
- being the

56
highest. At high flow rates the observed ions are almost exclusively either NO3- or the
nitric acid cluster with NO3-. With this new design, the ions remained relatively stable for
several minutes allowing for introduction of samples to investigate ionization chemistry
with different reactant ions.
Figure 4.7: IMS-F spectra of discharge gas from the Continuous Flow Tube with (a)
no discharge, (b) low flow, (c) medium flow and (d) high flow.
An attempt was made to investigate the changes to the ionization chemistry of an
explosive, RDX, which is known to ionize via the formation of adducts with nitrite and
chloride anions [19]. Approximately 30 ng of RDX was introduced with each of the three
reactant ion chemistries displayed in Figure 4.7 and the results for RDX are shown in
Figure 4.8. With nitrite chemistry shown in Figure 4.8a, the RDX·NO2- adduct is formed

57
with a reduced mobility value of 1.49 cm2 V-1 s-1. Even when the CO3- ion is the
predominant ion, the adduct RDX·CO3-, is not observed as shown in Figure 4.8b. This
adduct has been seen with a corona discharge mass spectrometer in our laboratory but
was not observed in the IMS spectra nor in the mass spectra alone (data not shown). This
adduct is believed to have too short of a lifetime to survive the transit time of several
milliseconds through the drift tube of the IMS. RDX appears to form a stable adduct with
nitrate ions as observed in Figure 4.8c with a reduced mobility values for RDX·NO3- of
1.436 cm2V-1s-1. Even though the nitrate anion appears as two separate peaks, with the
predominant ion the nitric acid adduct, the RDX·NO3- adduct readily forms indicating a
stronger interaction with the RDX by displacement of HNO3. RDX is a good example of
how changing the reactant ion species can provide different product ions with unique
mobility values.

58
Figure 4.8: IMS-F spectra of RDX with different ion chemistries generated from varying levels of discharge gas from the Continuous Flow Tube (a) low flow, (b)
medium flow and (c) high flow.

59
CHAPTER 5
ATMOSPHERIC PRESSURE CHEMICAL IONIZATION OF EXPLOSIVES
Explosives ionize differently based on their functional groups. For example,
nitrotoluenes will ionize via electron attachment or by proton abstraction with O2- or Cl-
[19]. In the presence of O2-, nitroamines or nitrate esters typically ionize to produce
nitrite and nitrate ions followed by autoionization producing adducts of the analyte with
NO2- or NO3
-[20]. Since this is a 2-step process it is less efficient than single step
ionization. The addition of chloride reagent ions enhanced the sensitivity for the detection
of nitroamine or nitrate ester by producing a M·Cl- adduct [48]. Some other explosives
such as tetryl are not well characterized or discussed in the literature.
The purpose of this research was to investigate the ionization properties of various
explosives with a variety of reactant ions. The use of different reactant ions may improve
selectivity by either suppressing background contamination or by moving the IMS peak
to a different location through the formation of a different adduct. Further, some
explosive adducts fragment at elevated temperatures and it is postulated that different
adducts may be stable at higher temperatures.
Experimental
Chemicals
Chemical standards nitroglycerin (NG), PETN, RDX, tetryl, and TNT were
obtained from AccuStandard (New Haven, CT) at 100 μg/mL in acetonitrile. Working

60
solutions were made by successive dilution of stock solutions with methanol (Fisher
Scientific, Pittsburg, PA). Carbon tetrachloride was also from Fisher Scientific.
PCP IMS/MS/MS
An ion mobility spectrometer interfaced to a triple quadrupole mass spectrometer
IMS/MS/MS model MMS 160 (PCP Inc, West Palm Beach, FL) was used in these
experiments. This instrument contains a 63Ni ionization source. Operating conditions
were as follows: IMS reaction region: 5cm; IMS drift tube length: 10 cm; IMS drift tube
temperature: 110oC; IMS pressure: 750 torr; drift gas: air at 600 ml/min; carrier gas: air at
100 ml/min; electric field: 3000 V total or 200 V/cm; gate width: 200 us. The interface
region, pumped by a mechanical rough pump, was maintained at a pressure of 280
millitorr. Zero air was produced from compressed house air and passed through a Pure
Air Generator model CO2RP140 (Domnick Hunter, Charlotte, NC). Data collection and
instrument control were performed using a PC operating with MS Dos version 6.00 and
using KEY 3 version 1.21 software (Keystone Applications). Four types of spectra were
obtained with this system including: normal mass spectra; ion mobility spectra with the
Faraday plate at the end of the drift region (IMS-F); ion mobility spectra with the electron
multiplier (IMS-EM); and ion mobility spectra with selected ion monitoring (IMS-SIM).
The mass spectra were collected by operating the IMS with the ion gates fully open. The
IMS-F spectra were used to measure drift times and subsequent calculation of the
reduced mobility values (Ko) reported in this paper. IMS-EM spectra, which used the
electron multiplier from the mass spectrometer as the detector while the quadrupoles
were operated to pass all ions, produced essentially identical spectra compared with IMS-

61
F with the exception of a shift of approximately 0.5ms to longer drift times. This delay is
attributed to the time required for the ions to pass through the interface region and the
mass spectrometer, and variances in the shift are due to differences in ion mobility. To
identify the drift time of an ion with a specific m/z, an IMS-SIM was collected by setting
the quadrupoles to pass a specific m/z while monitoring the drift time. The drift time of
this ion could then be compared to the drift times from the IMS-EM and from this
correlated to the IMS-F to link m/z to a specific reduced mobility value.
For analyte introduction into the PCP, a dilute solution of the analyte was
deposited on a wire and the solvent was allowed to evaporate. The wire was then placed
in the IMS so the sample desorbed off of the wire into the instrument. NG, RDX, tetryl,
and TNT were run on this instrument. The O2- reactant ion was the standard reactant ion
produced with a 63Ni ionization source operated in air. The production of a chloride
reactant was accomplished by introducing carbon tetrachloride into the system from a
diffusion tube inside of a vessel through which air was flowing into the instrument.
Nitrite and nitrate reactant ions were produced by introducing neutral vapors generated
from a DPIS contained in a Swagelok stainless steel cross and the levels of NO2- and
NO3- were maintained by varying the gas flows from the DPIS into the IMS source. This
device was described in detail elsewhere [47]. The NO2- reactant ion was created with the
DPIS operated at about 4kV and NO3- at about 7.5kV. A flow of about 100 mL/min from
DPIS was added to the IMS and varied slightly to obtain the desired ions.

62
WSU IM-TOFMS
Another instrument used for this study was an IM-TOFMS constructed at
Washington State University (WSU, Pullman) and consisted of an ion mobility
spectrometer interfaced to a time-of-flight mass spectrometer. The basic design of the
instrument can be obtained elsewhere [49,50]. IMS operating conditions were as follows:
IMS drift tube length: 15cm; drift tube temperature: 200oC for RDX, 110oC for other
explosives; atmospheric pressure: ~690 torr; drift gas: N2; drift gas flow rate:
~1000ml/min; voltage on the target screen 10.12kV; voltage on the ion gate 8.82kV. A
63Ni ionization source was used.
The IMS was connected with the TOFMS by a high pressure interface with a
300µm pinhole from the IMS to the interface and a 300µm skimmer from the interface to
the TOFMS. The interface was at 1.7 Torr and the MS at 4x10⁻⁶ Torr. Analyte
introduction into the IM-TOFMS was accomplished via microtubing and a syringe pump
at 2μl/min. NG, PETN, RDX, and tetryl were run on this instrument. Methylene chloride
was added to the solutions when a chloride as a reactant ion was desired. For the nitrate
reactant ion, the DPIS, located in a dynamic chamber described elsewhere, [47] was used.
API-III MS
The atmospheric pressure ionization triple quadrupole mass spectrometer used in
these studies was an Sciex API-III (Thornhill, Ont., Canada). Data was collected on a
Macintosh Quadra 400 using API-Tune software provided with the instrument. Typical
interface voltages (IN) were between -300 and -600 VDC. The negative corona discharge
current was set at 3 µA. The other lens voltages were as follows: Pinhole (OR) = -35, R0

63
= -30, R1 = -27, R2 = 45, R3 = 70. UHP Nitrogen (99.999% pure, Matheson Tri-gas,
Albuquerque, NM) was used as the auxiliary and curtain gases with flows of
2000mL/min and 400mL/min, respectively. Purified air obtained from a Zero Air
Generator (Puregas, Broomfield, CO) was used as the nebulizer gas and argon was used
as the collision gas for collision induced dissociation (CID) studies. For CO3- studies the
instrument was operated with the factory corona discharge ionization source. For NO3-
studies the DPIS was placed on the end of the nebulizer probe as discussed in previous
work [26]. Carbon tetrachloride was added to samples for a chloride reactant ion. NG,
PETN, RDX, tetryl, and TNT were run on this instrument. Samples were deposited into
the nebulizer, the solvent allowed to evaporate, then heater and gas flow turned on to
desorb sample and direct it into the MS.
Results and discussion
The negative reactant ions produced in a 63Ni source in air are mainly O2-. In an
electric discharge, such as corona discharge or DPIS, air breaks down to form ozone and
NOx. The reactant ions formed in the presence of ozone and NOx are NO2-, CO3
- and
NO3- along with some O2
- and O3-, and the predominant ion was determined based upon
the concentration of ozone and NOx. It was shown that as the concentration increased the
reactant ions shifted from O2- NO2
- CO3- NO3
- [47]. Figures 5.1 and 5.2 show
spectra of negative reactant ions for multiple sources on different instruments. IMS (PCP)
spectra of reactant ion peaks of O2-, Cl-, NO2
-, and NO3- are displayed in Figure 5.1 A, B,
C and D, respectively. The reduced mobility values for O2-, Cl-, NO2
-, and NO3- at 110 °C
are 2.33, 2.73, 2.52, and 2.41 cm2V-1s-1. There is also a large HNO3·NO3- peak with a

64
reduced mobility of 2.09 cm2V-1s-1 in Figure 5.1D. This nitrate-nitric acid adduct is
observed when the DPIS is operated at high voltages and nitric acid is thought to result
from reactions in the plasma with NO3- and trace amounts of water in the air.
Figure 5.1: IMS Spectra (PCP) of reactant ion peaks generated from a 63Ni ionization source at 110°C. A) Air showing only O2
- B) addition of carbon tetrachloride producing Cl-, C) low concentrations of neutral vapors (ozone and
NOx) generated in a DPIS producing NO2- and D) higher concentrations of neutral
vapors (ozone and NOx) generated in a DPIS ionization source producing NO3- and
HNO3·NO3- ions.
Figure 5.2 shows mass spectra (API-III) of reactant ions from a DPIS source with the
major ion of NO3- at m/z 62 (Figure 5.2A), a corona discharge source with the major ion
of CO3- at m/z 60 (Figure 5.2B), and a corona discharge source with carbon tetrachloride
added providing the major chloride ion at m/z 35 and 37 (Figure 5.2C). The ability to
specifically produce a given reactant ion by varying ionization parameters such as

65
voltage, flow, or through the introduction of a dopant chemical allows for the study of the
ionization patterns of explosive molecules with each individual reactant ion.
Figure 5.2: Mass spectra (API-III) of clean dry air at ambient temperatures A)
using the enclosed DPIS ionization source producing NO3- at m/z 62, B) using point-
to-plane corona discharge source producing CO3- at m/z 60, C) using point to plane
corona discharge with the addition of carbon tetrachloride producing predominantly Cl- at m/z 35 and 37.
The ionization properties of the explosives NG, RDX, TNT, PETN and Tetryl
were investigated with reactant ions of O2-, Cl-, NO2
-, CO3- and NO3
-. The goal was to
understand how each explosive compound ionizes and which reactant ion species may
provide the optimal ionization characteristics. Another objective was to determine if any
of the reactant ion species exhibited selective ionization properties. The ideal selective
ionization would be preferential ionization of an explosive compound with little or no
ionization of background contamination. Discussed below are the ionization outcomes of

66
each individual explosive with a variety of reactant ions. The explosive product ion
identities were confirmed by mass spectrometry and the reduced mobility values obtained
by IMS results are provided.
Nitroglycerine, when ionized by O2-, produces an NG·NO3
- adduct. This occurs
first by the electron transfer from O2- followed by dissociative electron attachment with
NG where a nitrate ion is formed. These nitrate ions then further react with other NG
molecules to form NG·NO3-. Since this ionization mechanism is a two-step process it is
less efficient than direct ionization. In a point-to-plane corona discharge ionization source
CO3- is the major reactant ions formed as part of the ionization of air. Upon the
introduction of NG to the corona discharge, the adduct NG·CO3- is formed along with
NO3- and NG·NO3
-. When a chloride ion is introduced as the reactant ion, the adduct
NG·Cl- is observed. When NO2-, produced by the DPIS ionization source, was used as the
reactant ion the nitrite adduct was not observed but NG·NO3- was created. This was
thought to occur since the electron affinity of NO2- is much lower than NO3
-, CO3- or Cl-
and the ionization process is then similar to the two-step process observed with O2-
where ionization of NG produces NG·NO3-. When NO3
-, produced by the DPIS, was used
as the reactant ion NG·NO3- is the only adduct produced.
RDX ionizes similar to the ionization of NG by forming adducts or fragments.
The difference with RDX is that it has NO2 groups instead of NO3 groups that can
fragment by dissociative electron attachment to form nitrite ions. These nitrite ions then
form adducts with RDX producing the product ions, RDX·NO2-. This is the main product
ion observed for the ionization of RDX when O2-, NO2
- or CO3- are used as the reactant
ions. When chloride is used as the reactant ion, RDX·Cl- is the only product ion

67
observed. When a DPIS with reactant ion NO3- is used, the RDX·NO3
- adduct is
observed. The RDX product ions produced with a variety of reactant ions are evident in
IMS and MS spectra displayed in Figures 5.3, 5.4, and 5.5.
Figure 5.3: IMS spectra (PCP) of 10 ng RDX with a variety of reactant ion species
as shown in Figure 5.1 A) O2-, B) Cl-, C) NO2
- and D) NO3- and HNO3·NO3
-.

68
Figure 5.4: IMS spectra with the same data as in Figure 5.3 with the x-axis plotted
as 1/Ko.
The IMS spectra of RDX displayed in Figure 5.3 and 5.4 are the same data. The
difference between the figures is that in Figure 5.3 the x-axis is provided as drift time in
milliseconds whereas in Figure 5.4 it is given as 1/Ko. Although the data were collected
at the same temperature, they were collected on different days with small variations in
atmospheric pressure. The reduced mobility values are normalized to both temperature
and atmospheric pressure. Thus, Figure 5.4 is a more accurate representation of the
separation between the various RDX adduct ions. The vertical line displayed in both of
these figures is for reference only and centers on the RDX·NO2- ion. Another interesting
feature observable in both the mass spectra and the IMS spectra is when NO3- is used as
the reactant ion species. Note the reduction in background peaks other than the NO3- and

69
the RDX·NO3- ions in Figures 5.3D, 5.4D and 5.5A. These spectra appear to be less
complex indicating some selectivity in the ionization of RDX with the nitrate reactant
ion.
Figure 5.5: Mass spectra (API-III) of RDX at atmospheric pressure with a variety of
reactant ion species as shown in Figure 5.2 with RIPs of A) NO3-, B) CO3
-, and C) Cl-.
Some explosives, like TNT, do not produce adducts. TNT either ionizes by
electron attachment or by proton abstraction. The ionization of TNT by O2-, Cl-, NO2
-,
and CO3- produced the proton abstracted species, (TNT-H)-. This is typical of nitro
aromatic explosives like TNT where the NO2 groups are attached to a benzene ring, and
so are more stable than the NO2 and NO3 groups from RDX and NG. The hydrogen on
70
the methyl group is more acidic than the ring hydrogens and thus is the site for proton
abstraction. In the DPIS with NO2- as the reactant ion, (TNT-NO)- was also produced,
possibly due to a complex and energetic ionization environment containing a variety of
reactive species such as ozone. In the corona discharge with CO3-, TNT- was also
produced. This was performed on the API-III mass spectrometer where the ionization
occurred right in front of the pinhole and the ion residences times are much shorter than
those in an IMS. An interesting event occurred when NO3- ions were used to ionize TNT.
The nitrate ion does not appear to ionize TNT, neither by electron transfer nor by proton
abstraction. This could be due to the very high electron affinities of the nitrate ion. In the
API-III mass spectrometer when the DPIS was used and produced only the nitrate ion, no
product ions for TNT were observed. A similar investigation was undertaken with the
PCP IMS/MS/MS using the DPIS to generate neutral vapors and introduce these into the
63Ni ionization source to produce the nitrate reactant ion. When 5 ng of TNT was
introduced into the IMS only small amounts of (TNT-H)- were observed in the presence
of the nitrate reactant ion. The fact that some (TNT-H)- was observed is likely due to the
complex ionization occurring within the ionization region. If the TNT reacts with ions,
such as O2- prior to them forming NO3
- then the proton abstracted TNT could be
produced. The reduction of the TNT response in the presence of the nitrate ion was
confirmed by adding the same 5 ng of TNT in the presence of chloride ions. When the
chloride reactant ions were present, 5 ng of TNT produce relative peak intensities of
634000 +/- 93000 compared to those of 224000 +/- 16000 for the nitrate reactant ion.
These were both done in triplicate. The ionization of TNT here reveals two important
conclusions, 1) the nitrate ion can be used as a selective reactant ion and 2) the ionization

71
processes occurring the ionization source are complex since the source contains a variety
of ions. To take full advantage of the selective ionization process, other methods need to
be developed to segregate the analyte from the ionization source so that specific
interactions with a single reactant ion can occur.
PETN has the same chemical functionality as NG and ionizes in a similar fashion.
PETN when ionized with chloride reactant ions produces PETN·Cl-. When nitrate was the
reactant ion, PETN·NO3- was the product ion as can be seen in the 3-D graph from WSU
in Figure 5.6. IMS peaks A and B are reactant ions NO3- and NO3
-(HNO3). Both are
shown at m/z 62 because NO3-(HNO3) fragments easily. IMS peak D is the adduct which
is m/z 378 as noted by the intense peak with the asterisk. When run on the API-III MS
with corona discharge the only product ion formed is PETN·CO3-.
Figure 5.6: Three dimensional IMS and MS spectra (WSU) of PETN with DPIS
ionization source at 110°C showing NO3- as reactant ion and the PETN·NO3
- adduct at m/z 378 and approximately 18.5ms.

72
Tetryl has a similar structure to TNT as it has NO2 groups attached to a benzene
ring, so the groups are not expected to fragment. It does however have a NO2 group
attached to nitrogen that is connected to the ring. This is the NO2 believed to fragment in
order to create the (tetryl-NO2)- ion seen when tetryl is ionized with O2-, NO2
-, and CO3-.
Figure 5.7 shows an IMS spectrum of tetryl with O2- as the reactant ion and (tetryl-NO2)-
as the product ion. Below the IMS in the figure are an IMS-EM and an IMS-SIM of m/z
241 for mass identification. A small tetryl·CO3- adduct is also seen in the corona
discharge. When chloride was the reactant ion tetryl·Cl- was produced. When NO3- was
the reactant ion tetryl·NO3- was produced.
Figure 5.7: IMS/MS spectra (PCP) of tetryl at 110 °C with O2
-: an IMS spectra showing reactant ion peak, an IMS-EM, and an IMS-SIM of m/z 241.

73
CHAPTER 6
CONCLUSIONS
The goals of this research were to form an understanding of the ion formation
processes occurring at atmospheric pressure in a discharge source, to investigate the
ionization of explosives with various reactant ions, and to find the best reactant ion
species available for selective ionization of explosive compounds. Better understanding
of the ionization processes will lead to more accurate detection of explosives and the
ability to adapt to the detection of new explosive threats.
The major ion in a commercial corona discharge ionization source is m/z 60, and
the identity of it was previously inconclusive. By use of 18O labeled gas and MS/MS, it
was determined that the m/z 60 ion created in a point-to-plane corona discharge is CO3-.
Knowing the identity of this major ion aids in the understanding of explosives ionization
in a corona discharge. If corona discharge is to be a viable alternative to radioactive
ionization sources, the reactant ions created and product ions produced need to be well
understood. For example, when NG is ionized in a corona discharge source, a NG·CO3-
adduct is formed. This ion fragments into only CO3-, which shows CO3
- has a high
electron affinity. If the clusters produced by ionization by CO3- are thermally stable, it
could prove a useful tool for the ionization of explosives.
As part of this research a new source, the distributed plasma ionization source
(DPIS), was developed and investigated. Like the corona discharge the DPIS is an
alternative to radioactive ionization sources. The advantages of the DPIS over point-to-
plane corona discharge are in the simplicity and ruggedness of its design. The DPIS can

74
also be modified to fit nearly any configuration necessary for interfacing to an instrument
for use. A lifetime study of the DPIS showed that it could be run constantly for 3 months
and still produces a significant amount of ions. The positive ions created in the DPIS
were similar to those created with a 63Ni ionization source. The negative ions created
were dependent upon the source configuration, voltages and gas flows. In the open
configuration ions were similar to the point-to-plane corona discharge ions, with CO3- as
the predominant ion. In the enclosed configuration NO3- was the predominant ion. This
reactant ion species has not previously been utilized in IMS and could prove a valuable
means of ionizing explosives.
While using a DPIS, and varying gas flow, a shift in the reactant ion species from
O2- NO2
- CO3- NO3
- was seen in an IMS. The shift is believed to occur due to
increased concentrations of O3 and NO2 in the source region. The DPIS was placed in a
container to allow neutrals to build up and bleed into the IMS, and spectra were taken at
regular intervals to record the reactant ion intensities. Manipulation of the ionization
process became possible when a DPIS was situated inside a Swagelok cross allowing for
precise control of gas flow, and thus ozone and NOx gas concentrations, delivered into a
63Ni ionization source within an IMS. By controlling gas flows, specific ions were
formed. Low flows resulted in a NO2- reactant ion, which changed to CO3
-, then to NO3-
at high flows. The ability to choose the reactant ion in an IMS facilitated the study the
ionization process of explosives and the ability to probe for the most selective ionization
process.
The various reactant ions were used to ionized explosives to determine a variety
of product ions and obtain reduced mobilities from IMS. Nitrate and chloride form

75
adducts with NG, PETN, RDX, and tetryl. Tetryl fragments to (tetryl-NO2)- with both O2-
and NO2- as reactant ions. RDX forms an adduct with NO2
- as a reactant ion, but with an
O2- reactant ion RDX undergoes a multistep reaction in which it fragments (NO2
- comes
off) and creates an RDX·NO2- adduct. NG undergoes a similar multistep reaction with O2
-
and NO2- as reactant ions, except it forms a NG·NO3
- adduct. TNT does not form adducts
with any of the reactant ions, but instead ionizes via proton abstraction to give (TNT-H)-
in most cases. When NO3- is used as the reactant ion with TNT, no ionization occurs.
Although this may or may not be a desired outcome, it does provide an example of
selective ionization. When nitrate is the predominant ion, the spectrum appears to have
less noise than when other reaction ions are present. The reduced mobility values from
IMS spectra of all product ions observed are listed in Table 6.1 along with their masses.
These values represent mass identified mobility spectra collected under carefully
controlled experimental conditions and can be used for comparison purposes to other
IMS instruments.
O2
- Cl- NO2
- NO3
- Expl (MW) Ko m/z Ko m/z Ko m/z Ko m/z NG (227) 1.37 289 1.46
[1.43] 262 1.38 289 1.37
[1.35] 289
PETN (316) [1.23] 351 [1.17] 378 RDX (222) 1.46 268 1.50
[1.50] 257 1.47 268 1.42
[1.42] 284
TNT (227) 1.56 226 1.58 226 1.56 226 TNT (227) 1.62 197 Tetryl (287) 1.47
[1.48] 241 1.33
[1.31] 322 1.48 241 1.29
[1.27] 349
Table 6.1: Reduced mobilities with mass identification of product ion peaks from multiple explosives. Data in brackets is from WSU, all else from PNNL.

76
Future work
The next step in implementation of the DPIS is to build an IMS instrument with
the DPIS as its source. Another challenge will be to establish the sample introduction in
such a manner that the analyte will interact only with the desired reactant ions and not be
ionized with the variety of ions produced in the plasma. Ideally this IMS containing a
DPIS will be interfaced to a mass spectrometer to enable mass identification of the ions
observed in the IMS.
Being able to interchange the ionization source in the IMS with other ionization
sources, such as 63Ni and point-to-plane corona discharge, would give the ability to find
the optimal conditions for each source. Conditions that should be varied include drift tube
length, gas flows, and voltage gradient. The length of the drift tube determines the
distance the ions have to separate. If the tube is too short the ion peaks will overlap, but
if it is too long the peaks will be too wide due to diffusion. The voltage gradient across
the drift tube is important because it determines how quickly the ions move through the
tube. A wider variety of explosives could also be investigated. Explosives with different
functional groups should be studied with multiple sources to understand their ionization
process and determine the best instrument parameters for their detection.
The final plan is to develop a multi-tube IMS. In a multi-tube IMS each tube will
have a different ionization source, which will cause the chemistry of each tube to be
distinct from the others, thus creating different product ions when samples are introduced.
The idea behind this arrangement is that if a sample has to go through two or more
separate ionization processes, then it forms two or more distinct ions, giving more

77
information for the detection algorithm. The more information the alogorithm has, the
more accurate the assessment of the sample will be.

78
REFERENCES
[1] Yinon J, Trends in Analytical Chemistry 2002, 21, 292.
[2] Moore DS, Review of Scientific Instruments. 2004, 75, 2499.
[3] Eiceman GA, Stone JA, Analytical Chemistry. 2004, 391A.
[4] Creaser CS, Griffiths JR, Bramwell CJ, Noreen S, Hill CA, Thomas CLP, The
Analyst, 2004, 129, 984.
[5] Eiceman GA, Karpas Z. Ion Mobility Spectrometry, 2nd ed. Taylor & Francis, Boca
Raton, 2005.
[6] Poole CF. The Essence of Chromatography. Elsevier, Amsterdam, 2003.
[7] Wu C, Klasmeier J, Hill HH, Rapid Comm. Mass Spectrom., 1999, 13, 1138.
[8] Dzidic I, Carroll DI, Stillwell RN, Horning EC, Analytical Chemistry, 1976, 48,
1763.
[9] Wittmer D, Luckenbill BK, Hill HH, Chen YH, Analytical Chemistry 1994, 66, 2348.
[10] Sielemann S, Baumbach JI, Schmidt H, Pilzecker P, Analytica Chimica Acta, 2001,
431, 293.
[11] Hill, CA, Thomas, CLP, The Analyst, 2003, 128, 55.
[12] Dindosova D, Skalny JD, Acta Phys. Univ. Comenianae, 1992, 33, 77.
[13] Barnes HT, Shaw AN, Zeleny J, Proceedings of the Royal Society of London.
Series A, Containing Papers of a Mathematical and Physical Character 1909, 82,
36.
79
[14] Taylor SJ, Piper LJ, Conner JA, FitzGerald , Adams JH, Harden CS, Shoff DB,
Davis DM, Ewing R,. International Journal for Ion Mobility Spectrometry, 1998,
1, 58.
[15] Ross SK, Bell AJ, International Journal of Mass Spectrometry, 2002, 218, L1.
[16] Skalny JD, Mikoviny T, Matejcik S, Mason NJ, International Journal of Mass
Spectrometry, 2004, 223, 317.
[17] Gravendeel B, de Hoog FJ, J. Phys. B: At. Mol. Phys. 1987, 20, 6337.
[18] http://webbook.nist.gov
[19] Ewing RG, Atkinson DA, Eiceman GA, Ewing GJ, Talanta, 2001, 54, 515.
[20] Khayamian T, Tabrizchi M, Jafari MT Talanta, 2003, 59, 327.
[21] Osborn DL, Leahy DJ, Cyr DR, Neumark DM, J. Chem. Phys. 1996, 13, 5026.
[22] Posey LA, Johnson MA, J. Chem. Phys. 1988, 88, 5383.
[23] Dono A, Paradisi C, Scorrano G, Rapid Comm. Mass Spectrom. 1997, 11, 1687.
[24] Brandvold DK, Martinez P, Atmospheric Environment 1988, 22, 2477.
[25] Siegel MW, Fite WL, J. Phys. Chem. 1976, 80, 2871.
[26] Waltman MJ, Dwivedi P, Hill HH, Blanchard WC, Ewing RG, Talanta 2008, 77,
249.
[27] http://cdiac.ornl.gov/trends/co2/sio-mlo.html
[28] Miller CJ, Ewing RG, 55th ACS Northwest Regional Meeting (NORM) “Thermal
Stability Study of Nitroglycerin and Structurally Related Chemicals” June 2000.
[29] Ewing RG, Blanchard WC, Crawford MJ, Pittsburg Conference, Orlando, FL,
March 2005.

80
[30] Kaplan K, Hill HH, Gordon Research Conference-Detecting Illicit Substances:
Explosives & Drugs, Les Diablerets, Switzerland, August 2005.
[31] Na N, Zhang C, Zhao MX, Zhang SC, Yang CD, Fang X, Zhang XR, Journal of
Mass Spectrometry 2007, 42, 1079.
[32] Blanchard WC, U.S. patent 7,157,721, 2007.
[33] Wu C, Siems WF, Asbury GR, Hill HH, Analytical Chemistry 1998, 70, 4929.
[34] Asbury GR, Hill HH, Journal of Microcolumn Separations 2000, 12, 172.
[35] LORENTZ, supplied by Integrated Engineering Software, Winnipeg, Manitoba,
Canada.
[36] Blanchard WC, Bacon T, Waltman MJ, Ewing RG, 15th International
Conference on Ion Mobility Spectrometry, Honolulu, HI, July 2006.
[37] Spangler GE, Carrico JP, International Journal of Mass Spectrometry and Ion
Physics 1983, 52, 267.
[38] Spangler GE, Carrico JP, Campbell DN, Journal of Testing and Evaluation 1985,
13, 234.
[39] Wernlund RF, Cohen MJ, Kindel RC, New Concept Symposium and Workshop on
Detection and Identification of Explosives, Reston, VA, 1978.
[40] Asbury GR, Klasmeier J, Hill HH, Talanta 2000, 50, 1291.
[41] Huang SD, Kolaitis L, Lubman DM, Applied Spectroscopy 1987, 41, 1371.
[42] Skalny JD, Horvath G, Mason NJ, Journal of Optoelectronics and Advanced
Materials 2007, 9, 887.
[43] Hobbs PV. Introduction to Atmospheric Chemistry, Cambridge University
Press, Cambridge, 2000.

81
[44] Brandvold DK, Martinez P, Dogruel D, Atmospheric Environment 1989, 23, 1881.
[45] Ewing RG, Eiceman GA, Harden, CS, Stone, JA. International Journal of Mass
Spectrometry, 2006, 255-256, 76.
[46] Bowers MT ed. Gas Phase Ion Chemistry Vol. 1, Academic Press, New York, 1979.
[47] Ewing RG, Waltman MJ, International Journal for Ion Mobility Spectrometry 2009,
12, 65.
[48] Lawrence AH, Neudorfl P, Analytical Chemistry 1988, 60, 104.
[49] Steiner, WE, Clowers BH, et. al. Rapid Comm. Mass Spectrom. 2001, 15, 2221.
[50] Crawford CL, Boudries H, et. al. Analytical Chemistry, 2010, 82, 387.