atmospheric no2 concentration measurements using differential absorption lidar technique
TRANSCRIPT
Vol.9 No.I Advances in Atmospheric Sciences February 1992
Atmospheric NO2 Concentration Measurements
Using Differential Absorption Lidar Technique
P.C.S. Devara and P. Ernest Raj
Indian Institute of Tropical Meteorology, Pune - 411 008, India
Received March 14. 1991; revised June 5, 1991
ABSTRACT
Using the Differential Absorption Lidar (DIAL) technique, two types of approaches, namely, reflection from
retroreflector/topographic target and backscatter from atmosphere, are available for studying remotely the atmos-
pheric NO, concentration. The Argon ion lidar system at the Indian Institute of Tropical Meteorology (IITM),
Pune, India has been used for the measurements by following both the path-averaged and range-resolved ap-
proaches. For the former, a topographic target (hill) is used for determining path-averaged surface concentration. In
the latter, spectral properties of atmospheric attenuation is used for making range-resolved measurements in the sur-
face layer. The results of the observations collected by following both approaches are presented. The average
surface NO 2 concentration was found to vary between 0.01 and 0.105 ppm and the range-resolved measurements
exhibited higher values suggesting treatment of the lidar data for scattering and extinction effects due to atmospheric
aerosols and air molecules, and atmospheric lurbulcnce. Certain modifications that are suggested to the experimental
set-up, data acquisition and analysis to improve the measurements are briefly described.
I. INTRODUCTION
Atmospheric nitrogen dioxide (NO,) constitutes and important gaseous pollutant in the
group of nitrogen oxides (NOx = NO+NO2) which are primarily emitted as nitric oxide (NO).
The study of NO2 is important as it plays a significant role in producing negative
environmental effects such as acid rain generation and forest damage (NRC, 1977). Urban
environments, where the emissions from vehicles contribute maximum to the production
of NO2 , will be affected greatly by these pollutants, and the resultant adverse effects of air
pollution may lead to primary health problems, possible long term changes in the global cli-
mate and in UV radiation levels. Also, NO2 influences 03 in the troposphere and strato-
sphere, and it can be used as a convenient indicator for studying the photo-chemistry and
dynamics of those regions (Wang et al., 1986; Sinyakov and spektorov, 1987). Along with the
natural sources such as stratospheric oxidation of nitrous oxide (N20), lightning, soil emis-
sions and oceans, anthropogenic production through fossil fuel combustion and biomass
burning appear to be the major sources of NOx while major sinks being wet and dry deposi-
tion (WMO, 1985; Singh, 1987).
Of the various optical methods, Differential Absorption Lidar (DIAL) has been recog-
nized to be a versatile method for remote determination of atmospheric NO2 (Rothe et al.,
1974; Fredriksson and Hertz, 1984; Galle et al., 1988; Devara, 1989). Other acronyms some-
times encountered in the literature which are nearly synonymous with DIAL are DASE for
'Differential Absorption and Scattering of Energy' and DAS for 'Differential Absorption and
Scattering'. An Argon ion lidar system has been developed at the IITM, Pune (an urban sta-
tion), India for remote sounding of atmospheric aerosols and trace gases. This lidar has been
74 Advances in Atmospheric Sciences Vol.9
used for making path-averaged DIAL measurements of surface level atmospheric NO 2 con- centration at this location during 1987-1988 (Devara and Ernest Raj, 1989). Subsequently, attempts have been made to utilize the system for obtaining range-resolved observations of NO 2 in the bottom layer of the atmosphere. This paper initially gives a brief review of the DIAL method for the measurement of atmospheric gas constituents and then presents the de- tails of the experimental set-up and preliminary results of the range-resolved measurements. Based on the recent developments in the theory of the DIAL method for the estimation of atmospheric gas concentrations and the associated systematic and random errors, certain modifications to the experimental ,arrangement, measurement procedure and data reduction algorithms are being undertaken for the improvement of results and they are indicated at the end of the paper�9
!I. DIAL METHOD
DIAL is an approach that makes use of absorption in the atmosphere to infer the con- centration of trace species. In this method laser wavelength is altered between an on-reso- nance ().ON) and neighbouring off-resonance (2oft:) for the particular molecule under investi- gation. Then, lidar-observed surface-reflected energy at the two wavelengths can be inter- preted interms of column content or path-averaged gas concentration and the lidar-observed range-resolved atmospheric backscatter at the two wavelengths can be interpreted interms of gas concentration profiles.
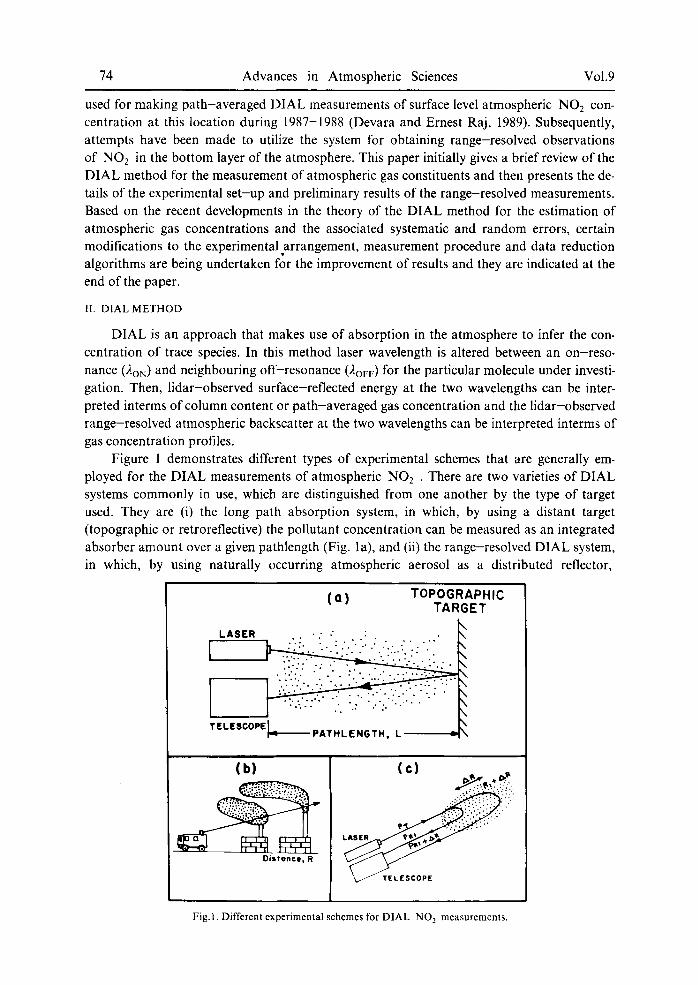
Figure 1 demonstrates different types of experimental schemes that are generally em- ployed for the DIAL measurements of atmospheric NO2 . There are two varieties of DIAL systems commonly in use, which are distinguished from one another by the type of target used. They are (i) the long path absorption system, in which, by using a distant target (topographic or retroreflective) the pollutant concentration can be measured as an integrated absorber amount over a given pathlength (Fig. la), and (ii) the range-resolved DIAL system, in which, by using naturally occurring atmospheric aerosol as a distributed reflector,
(0 ) T O P O G R A P H I C T A R G E T
X L A S E R �9 ." : N
:'�9 .�9 : ' . � 9 �9 . \ , I ,
- . . . . . : �9 . " . . . ' � 9 . . . . . . . . : . \
..!.::-.�9 . . . - . - ; . . . . . � 9 1 4 9 . . . . ... . . . .
�9 . . . . . : : . . . ' . : . . . . . - . .
X TELESCOPEL, - - P A T H L E N G T H , L ~
(b)
�9 ~?:~.
l Di,tonce, R
(c)
k . , / TELESCOPE
Fig.l. Different experimental schemes for DIAL NO 2 measurements.
No.1 P.C.S. Devara and P. Ernest Raj 75
pollutant concentration can be measured as a function of range (Fig. lb) or alternately profile
measurements can be made from the difference in absorptions of radiation from two different range gates (Fig. lc). Recently, powerful DIAL systems have been constructed and applied in air quality studies (Zuev, 1982; Measures, 1984). The very recently introduced gas-correla- tion lidar concept provides attractive possibilities for system simplification (Edner et al.,
1984). Most DIAL systems use single laser which is alternately tuned to the ON and O F F wave-
lengths. The return signals are usually so weak that the concentration profile calculated from
a few measurements is very noisy, and temporal averaging is necessary to improve the
s ignal- to-noise ratio which otherwise leads to unrealistic and sometimes to negative concen- trations. Usually many pairs of return signals are summed up for one concentration
measurement. Generally two nearby wavelengths are selected in DIAL method so that the
volume aerosol and molecular scattering coefficients can be regarded as identical for both ON and OF F wavelengths at the same clock time. But in real situations, these assumptions cause errors in measurements and they can be broadly classified into three groups: (1) errors intro-
duced by the atmosphere, (2) spectral errors, and (3) instrument errors. Detailed analysis of errors in DIAL measurements and suitable solutions have been enumerated in the literature (Schotland, 1974; Gibson and Thomas, 1975; Zuev, 1982; Pelon and Megie, 1982; Browell et al., 1985; Staehr et al., 1985; Browell, 1989).
Ill. LOCATION AND EXPERIMENT
In order to minimise the backscattered noise due to city lights, the complete lidar set-up has been installed on the terrace of the Institute's building which is about 13 m above ground
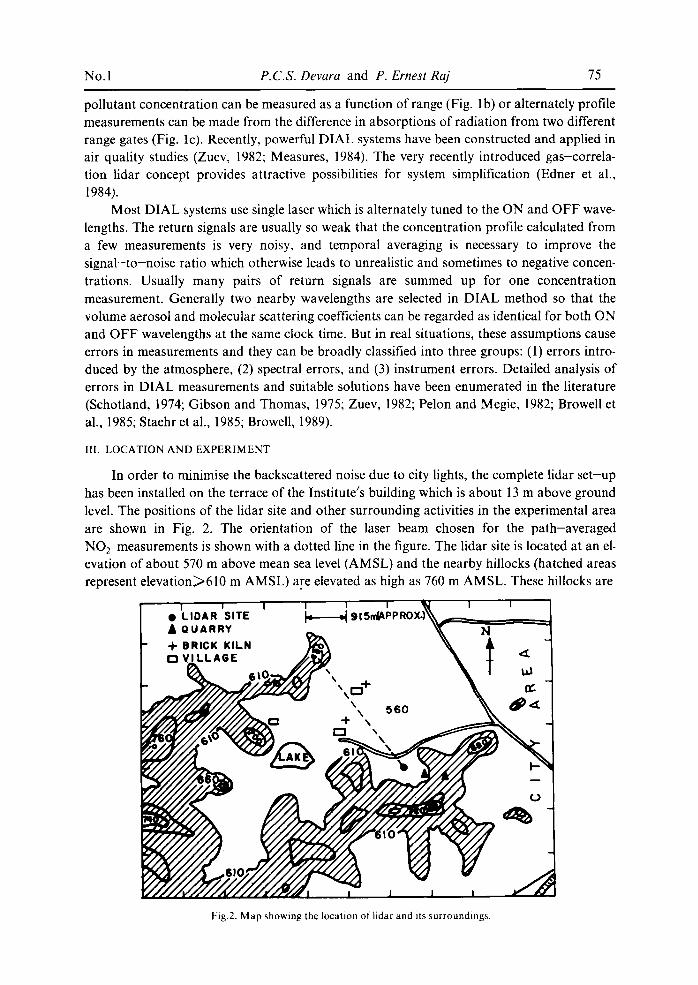
level. The positions of the lidar site and other surrounding activities in the experimental area are shown in Fig. 2. The orientation of the laser beam chosen for the path-averaged
NO2 measurements is shown with a dotted line in the figure. The lidar site is located at an el- evation of about 570 m above mean sea level (AMSL) and the nearby hillocks (hatched areas represent e levat ion>610 m AMSL) are elevated as high as 760 m AMSL. These hillocks are
Fig.2. Map showing the location of lidar and its surroundings.
76 Advances in Atmospheric Sciences Vol.9
believed to be affecting the transport/dispersion of gaseous pollutants particularly in the lower levels of the atmosphere. Also, the stone quarries (east side) and brick kilns (west side) which are situated at a distance of about I km on either side of lidar are considered to be the major local anth-ropogenic sources influencing the NO2 observations at the experimentalsite. Apart from the above, contribution is expected also due to the major urban activity fromeastern part of the lidar site and western side is a sparsely populated area.
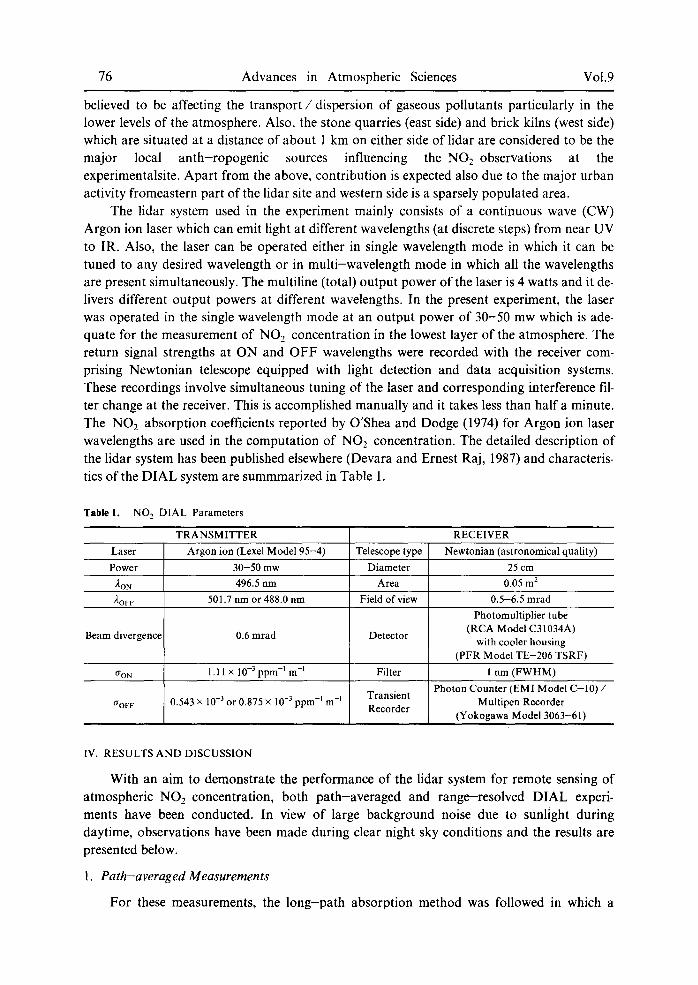
The lidar system used in the experiment mainly consists of a continuous wave (CW) Argon ion laser which can emit light at different wavelengths (at discrete steps) from near UV to IR. Also, the laser can be operated either in single wavelength mode in which it can be tuned to any desired wavelength or in multi-wavelength mode in which all the wavelengths are present simultaneously. The multiline (total) output power of the laser is 4 watts and it de- livers different output powers at different wavelengths. In the present experiment, the laser was operated in the single wavelength mode at an output power of 30-50 mw which is ade- quate for the measurement of NO2 concentration in the lowest layer of the atmosphere. The return signal strengths at ON and OFF wavelengths were recorded with the receiver com- prising Newtonian telescope equipped with light detection and data acquisition systems. These recordings involve simultaneous tuning of the laser and corresponding interference fil- ter change at the receiver. This is accomplished manually and it takes less than half a minute. The NO2 absorption coefficients reported by O'Shea and Dodge (1974) for Argon ion laser wavelengths are used in the computation of NO2 concentration. The detailed description of the lidar system has been published elsewhere (Devara and Ernest Raj, 1987) and characteris- tics of the DIAL system are summmarized in Table 1.
Table I. NO 2 DIAL Parameters
TRANSMITTER RECEIVER
Laser Argon ion (Lexel Model 95-4) Telescope type Newtonian (astronomical quality)
Power 30-50 mw Diameter 25 cm
2ON 496.5 nm Area 0.05 m 2
"~OFF 501.7 nm or 488.0 nm Field of view 0.5-6.5 mrad
Photomultiplier tube (RCA Model C31034A)
Beam divergence 0.6 mrad Detector with cooler housing
(PFR Model TE-206 TSRF)
trON 1.11 X 10 -3 ppm -1 m -l Filter 1 nm (FWHM)
Photon Counter (EMI Model C - 1 0 ) / Transient Multipen Recorder aov F 0.543 x 10 -3 or 0.875 x 10 -s ppm -1 m -I Recorder
(Yokogawa Model 3063-61 )
IV. RESULTS AND DISCUSSION
With an aim to demonstrate the performance of the lidar system for remote sensing of atmospheric NO2 concentration, both path-averaged and range-resolved DIAL experi- ments have been conducted. In view of large background noise due to sunlight during daytime, observations have been made during clear night sky conditions and the results are presented below.
1. Path-averaged Measurements
For these measurements, the long-path absorption method was followed in which a
No.1 P.C.S. Devara and P. Ernest Raj 77
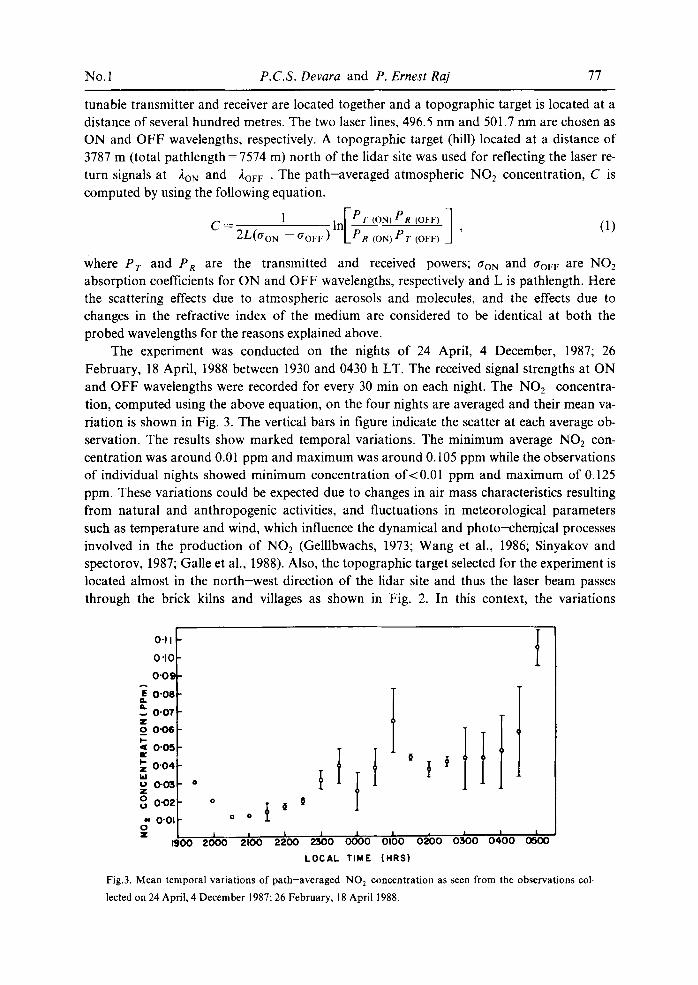
tunable transmitter and receiver are located together and a topographic target is located at a distance of several hundred metres. The two laser lines, 496.5 nm and 501.7 nm are chosen as ON and OFF wavelengths, respectively. A topographic target (hill) located at a distance of 3787 m (total pathlength = 7574 m) north of the lidar site was used for reflecting the laser re- turn signals at ,~.oN and Zovv �9 The path-averaged atmospheric NO2 concentration, C is computed by using the following equation.
1 " I r P r (ON) PR (OFF) ] C i n - - - - - , (1)
2L(aoN -- ~ovv) LP R (oN) P r (ovF) J
Where P r and PR are the transmitted and received powers; aON and aoF v are NO2 absorption coefficients for ON and OFF wavelengths, respectively and L is pathlength. Here the scattering effects due to atmospheric aerosols and molecules, and the effects due to changes in the refractive index of the medium are considered to be identical at both the probed wavelengths for the reasons explained above.
The experiment was conducted on the nights of 24 April, 4 December, 1987; 26 February, 18 April, 1988 between 1930 and 0430 h LT. The received signal strengths at ON and OFF wavelengths were recorded for every 30 min on each night. The NO2 concentra- tion, computed using the above equation, on the four nights are averaged and their mean va- riation is shown in Fig. 3. The vertical bars in figure indicate the scatter at each average ob- servation. The results show marked temporal variations. The minimum average NO2 con- centration was around 0.01 ppm and maximum was around 0.105 ppm while the observations of individual nights showed minimum concentration of<0.01 ppm and maximum of 0.125 ppm. These variations could be expected due to changes in air mass characteristics resulting from natural and anthropogenic activities, and fluctuations in meteorological parameters such as temperature and wind, which influence the dynamical and photo-chemical processes involved in the production of NO2 (Gelllbwachs, 1973; Wang et al., 1986; Sinyakov and spectorov, 1987; Galle et al., 1988). Also, the topographic target selected for the experiment is located almost in the north-west direction of the lidar site and thus the laser beam passes through the brick kilns and villages as shown in Fig. 2. In this context, the variations
o .
Z o I.,- ,,( A,,
bJ U Z
a
o z
0"11 f 0 '10
O'Of
0"08
0-07 0"06
0"05
0"04
0"03 o
0"02 o
0.0! 1
1900 2000 |
2100
,+ t t t ~ | I 1 I i ! I I
2200 2300 0000 0100 0200 0300 0400 0~)00 LOCAL TIME (HRS)
Fig.3. Mean temporal variations of path-averaged NO 2 concentration as seen from the observations col-
lected on 24 April, 4 December 1987; 26 February, 18 April 1988.
78 Advances in Atmospheric Sciences Vol.9
in NO2 concentration observed in the present study are considered partly due to varied activ- ities of the anthropogenic sources around the lidar site. The NO_, measurements made at pune by khemani et al., (1987) using point monitoring instruments during 1981-1984 showed an average value of 0.93 ppb. This could be explained by the fact that the DIAL results are the concentrations integrated over a pathlength of 7574 m. Also, increase in NO, concentra- tion observed in the present experiment could be due to real changes in the atmosphere due to more pollution activities. However, more meaningful comparison between these two experi- ments is possible when they are conducted simultaneously by installing a series of point moni- tors along the pathlength of the lidar experiment. The results of such comparisons have been reported in the literature (Baumgartner et al., 1979).
2. Range-resolved Measurements
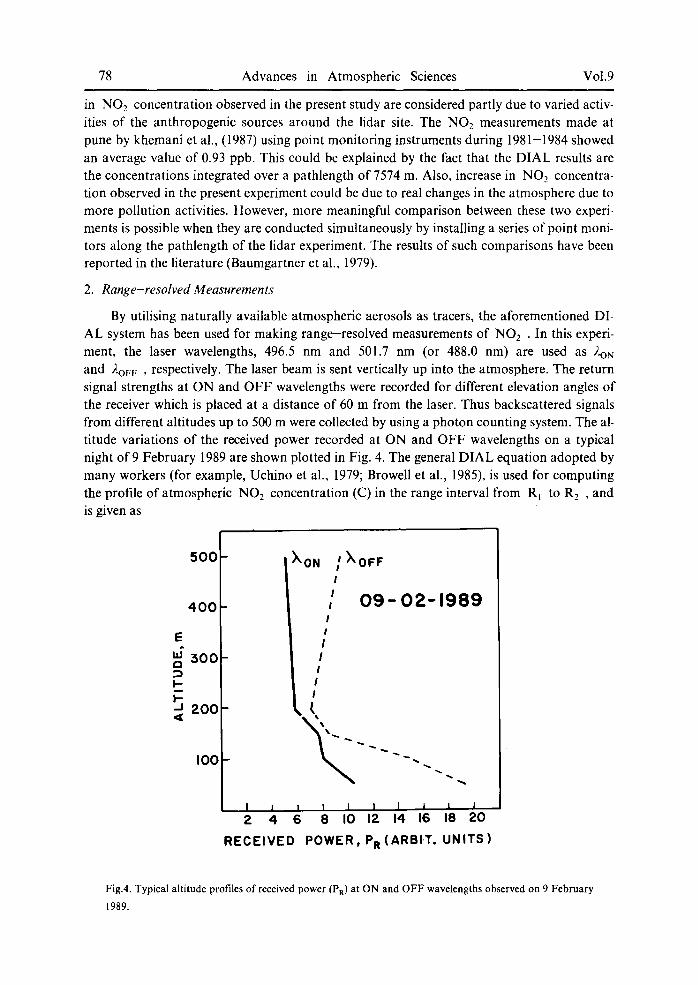
By utilising naturally available atmospheric aerosols as tracers, the aforementioned DI- AL system has been used for making range-resolved measurements of NO2 �9 In this experi- ment, the laser wavelengths, 496.5 nm and 501.7 nm (or 488.0 nm) are used as 2oN and 2oH: , respectively. The laser beam is sent vertically up into the atmosphere. The return signal strengths at ON and OFF wavelengths were recorded for different elevation angles of the receiver which is placed at a distance of 60 m from the laser. Thus backscattered signals from different altitudes up to 500 m were collected by using a photon counting system. The al- titude variations of the received power recorded at ON and OFF wavelengths on a typical night of 9 February 1989 are shown plotted in Fig. 4. The general DIAL equation adopted by many workers (for example, Uchino et al., 1979; Browell et al., 1985), is used for computing the profile of atmospheric NO 2 concentration (C) in the range interval from R~ to R 2 , and
5 0 0
4 0 0
E
3 0 0
" 2 0 0
is given as
XON
I 0 0
~ X O F F I I I I I I I I I I (
0 9 - 0 2 - 1 9 8 9
I I I I I I I I ~ I 2 4 6 8 I0 12 14 16 18 20
R E C E I V E D P O W E R , PR(ARBIT" U N I T S )
Fig.4. Typical altitude profiles of received power (PR) at ON and OFF wavelengths observed on 9 February 1989.
No.1 P.C.S. Devara a.nd P. Ernest Raj 79
I00
9O i
8O
E 7 0
u; s o
5 0 I- V-- 40 _J
30
2 0
I0
l / 21 - 12 - 88
0 2 - 0 2 - 89
!' ........... 2 0 - 0 5 - 8 9
I / ( i ~ i ~176176
~ ::" oO ~
%
.." ,, �9 : "x
I I I I I I 2 3 4 5
PR (OFF) / PR ( ON )
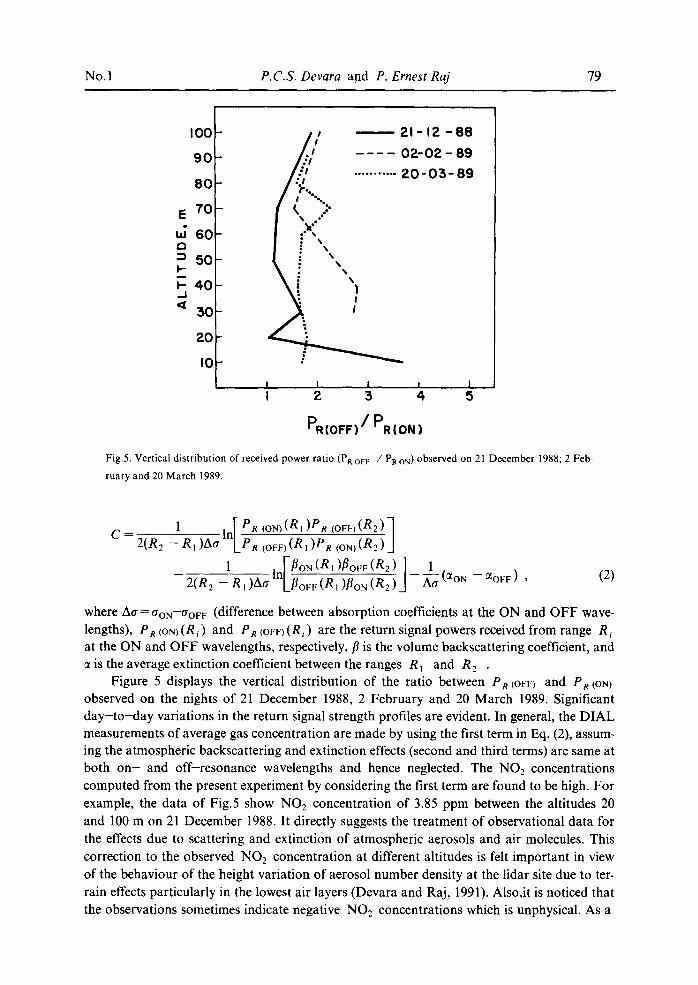
Fig.5. Vertical distribution of received power ratio (PR o r e / PR o,'q) observed on 21 December 1988; 2 Feb-
ruary and 20 March 1989.
1 oF , R2,1 C = 2 ( R 2 - R , ) Aa ln -~R ~ I-~R (o~) ( R 2 ) _I
1 , [ f loN(R1) f lOFF(R2)7 1 - - Atr I n / - - - / / l - - ' ~ - ~ X l - - - - - - 0~OFF ) 2(R 2 - g t ) LfloFF(Rt )floyt~xE) d--Aaa (ct~
(2)
where Atr= croN--trOF F (difference between absorption coefficients at the ON and OFF wave- lengths), Ps coN)(Ri) and PR (OFF)(Ri) are the return signal powers received from range R i at the ON and OFF wavelengths, respectively, fl is the volume backscattering coefficient, and ct is the average extinction coefficient between the ranges R 1 and R 2 .
Figure 5 displays the vertical distribution of the ratio between PR (OFF) and PgtoN) observed on the nights of 21 December 1988, 2 February and 20 March 1989. Significant d a y - t o - d a y variations in the return signal strength profiles are evident. In general, the DIAL measurements of average gas concentration are made by using the first term in Eq. (2), assum- ing the atmospheric backscattering and extinction effects (second and third terms) are same at both o n - and off-resonance wavelengths and hence neglected. The NO2 concentrations computed from the present experiment by considering the first term are found to be high. For example, the data of Fig.5 show NO 2 concentration of 3.85 ppm between the altitudes 20 and 100 m on 21 December 1988. It directly suggests the treatment of observational data for the effects due to scattering and extinction of atmospheric aerosols and air molecules. This correction to the observed NO2 concentration at different altitudes is felt important in view of the behaviour of the height variation of aerosol number density at the lidar site due to ter- rain effects particularly in the lowest air layers (Devara and Raj, 1991). Also,it is noticed that the observations sometimes indicate negative NO2 concentrations which is unphysical. As a
80 Advances in Atmospheric Sciences Vol.9
sample computation, the scattering and extinction effects due to atmospheric aerosols andmolecules in the probed region have been estimated for the DIAL measurements made on 20 March 1989 using the radiometersonde observations from India Meteorological Depart- ment, Pune and the scattered signal strength observations obtained with the lidar at the off-resonance wavelength. These corrections, particularly due to the variations in aerosol particle distribution are found to be improving the NO2 concentration measurements when the scattering variations are small. In order to improve the above results certain changes in the experimental set-up, data archival and retrieval methods are proposed and they are brief-
ly described in the following section.
3. On-line Control and Data Acquisition
The main reasons for the higher and occasionally negative NO2 concentrations ob- served in the present study could be due to (i) long time separation between the on - and off-resonance wavelengths and (ii) insufficient observations of return signal strength at the DIAL wavelengths in the estimation of individual concentrations. By taking these aspects in- to consideration certain modifications to the experimental design are being carried out by augmenting the lidar with an on--line control and data acquisition system. They include (i) operation of the laser in multiwavelength mode to emit both on- and off-resonance wave- lengths simultaneously, and addition of an electronic chopper at the laser output to allow re- cording of (S+N) and N at each filter of the receiver and (ii) incorporation of a filter wheel in front of the face of the PMT to alternate (at faster rate) between the interference filters corre- sponding to the on - and off-resonance wavelengths of the laser.
The main peripheral devices of the on-line control and data acquisition system are fast transient digitizer (8 bit Analog to Digital Converter at a sampling rate of 20 MHz), computercontrolled stepper motors to govern the motion of chopper, filter wheel and the tele- scope. The other peripheral devices are alphanumeric control terminal, two floppy disk drives, a graphic display, a printer and a plotter. The transient digitizer converts the analog signals from the range-resolved measurements into digital form at high sampling rate and transfers to computer memory. The IBM compatible micro-computer sends command sig- nals for on-line detection and controlling of parameters of the laser and receiver at the pre-set experimental requirements, and also stores all individual digital signals for off-line data processing, graphic display and plotting of concentration profiles. For measurements in the regions of low level concentration of gaseous pollutants, spatial averaging technique sug- gested by staehr et al., (1985) will be adopted to remove negative concentrations in the data.
V. CONCLUSIONS
The Argon ion lidar system at the Indian Institute of Tropical Meteorology, Pune has been used for determining the path-averaged and range-resolved atmospheric NO2 concen- tration in the surface layer. These measurements are the first such results obtained in India us- ing the DIAL technique. Although the present observations of path-averaged NOR concen- trations showed reasonable values, the range-resolved observations indicated higher concen- trations and suggest some modifications to the experimental set-up, data recording and retrieval procedures, and treatment of DIAL data for the effects due to atmospheric spectral parameters. It is explained how the proposed on-line control and data acquisition system would help in solving the problems that are encountered in the experiment. It is hoped that
No.1 P.C.S. Devara and P. Ernest Raj 81
the proposed changes in the design of the experiment will improve the data quality to obtain
more realistic values of range-resolved NO 2 concentration.
We express our gratitude to prof. D.R. Sikka and Dr. A.S.R. Murty for their encouragement. We are indebted to
the India Meteorological Department, Pune for making available the necessary aerological data. We are grateful to
the Referees for the thoughtful comments.
REFERENCES
Baumgartner, R.A., Fletcher, L.D. and Hawley, J.G. (1979), Comparison of lidar and air quality
station NO 2 measurements, J.Air Pollut. Control Assoc., 29:1162-1165.
Browell, E.V., lsmail, S. and Shipley, S.T. (1985), Ultraviolet DIAL measurements of 03 profiles in regions of
spatially inhomogeneous aerosols, Appl. Opt., 24: 2827-2836.
Browell, E.V. (1989), Differential absorption lidar sensing of ozone, Proc. IEEE, 77: 419-432.
Devara, P.C.S. and Ernest Raj, P. (1987), A bistatic lidar for aerosol studies, IETE Tech. Rev., 4: 412-415.
Devara, P.C.S. (1989), Active remote sensing of the atmosphere using lasers, J. Sei. and Indust. Res., 48: 71-83.
Devara, P.C.S. and Ernest Raj, P (1989), Remote sensing of the atmospheric NO 2 concentration in the surface lay-
er using the Argon ion lidar system at Pune, Atmos. Environ., 23: 875-877.
Devara, P.C.S. and Ernest Raj, P. (1991), Study of atmospheric aerosols in a terrain-induced nocturnal boundary
layer using bistatic lidar, Atmos. Environ., 25A: 655-660.
Edner, H., Svanberg, S., Uneus, L. and Wendt, W. (1984), Gascorrelation lidar, Opt. Len., 9: 493-495.
Fredriksson, K.A. and Hertz, H.M. (1984), Evaluation of the DIAL technique for studies on NO 2 using mobile
lidar system, Appl. Opt., 23:1403-1411.
Galle, B., Sunesson, A. and Wendt, W. (1988), NO 2- mapping using laser radar techniques. Atmos,
Environ., 22: 569-573.
Gelbwachs, J. (1973), NO 2 lidar comparison: Fluorescence vs backscattered differential absorption, Appl.
Opt., 12: 2812-2813.
Gibson, A.J. and Thomas, L. (1975), Ultraviolet laser sounding of the troposphere and lower stratosphere,
Nature, 256: 561-563.
Khemani, L.T., Momin, G.A. and Gurumukh Singh (1987), Variation in trace gas concentrations in different envi.
ronments in India, Pure Appl. Geophys., 125: 167-181.
Measures, R.M. (1984), Laser Remote Sensing, Wiley, New York.
NRC (National Research Council) (1977), Nitrogen Oxides, National Academy of Sciences, Washington, D.C.
O'Shea, D.C. and Dodge, L.G. (1974), NO 2 concentration measurements in an urban atmosphere using differential
absorption techniques, Appl. Opt., 13: 1481-1486.
Pelon, J. and Megie, G. (1982), Ozone monitoring in the stratosphere and lower troposphere: Evaluation and opera-
tion ofa groundbased lidar station, J. Geophys. Res., 87: 4947-4955.
Rothe, K.M., Brinkmann, U. and Walther, H. (1974). Remote measurement of NO 2 emission from a chemical fac-
tory by the differential absorption technique, Appl. Phys.. 4: 181-182.
Schotland, R.M. (1974), Errors in the measurements of atmospheric gases by differential absorption, J. Appl.
Meteorol., 13: 71-77.
Sinyakov, V.P. and Spektorov, L.A. (1987), Variations of the total NO,_ content in different air masses, lzevestia,
Atmos. Ocean Phys., 23: 22-27.
Singh, H.B. (1987), Reactive nitrogen in the troposphere, Environ.Sei. Tech., 21: 320-327.
Staehr. W., Lahmann, W. and Weitkamp, C. (1985), Range-resolved differential absorption lidar: Optimization of
range and sensitivity, Appl. Opt., 24: 1950-1956.

82 Advances in Atmospheric Sciences Vol.9
Uchino, O., Maeda, M. and Hirono, M. (1979), Application of excimer lasers to laser-radar observations of the up-
per atmosphere, IEEE J. Quant. Electron., QE-I 5:1094-1107.
Wang, W.C., Wuebbles, D.J., Washington, W.M. lssacs, R.S. and Molnar, G. (1986), Trace gases and other poten-
tial perturbations to global climate, Rev. Geophys., 24:110-140.
WMO (World Meteorological Organization) (1985), Global Ozone Research and Monitoring Project, Rep. 16. At-
mospheric Ozone 1985, NASA, ESA,Publ. Divsn., Code EE, Washington, D.C.
Zuev, V.E. (1982), Laser Beams in the Atmosphere, Plenum Publishing Corporation, New York.