atmospheric composition & air quality (maq-34806) lecturers: maarten krol wouter peters
TRANSCRIPT

Atmospheric Composition & Air Quality (MAQ-34806)
Lecturers: Maarten Krol Wouter Peters

Last week
We saw the photochemistry of the troposhereNOx-HOx cycle, role of VOCs, P(O3)
We saw the photochemistry of the stratosphereChapman (O+O3) + catalytic cycles of HOx, NOx, ClOx,...
We learned what controls the production or destruction of ozone in the troposphere
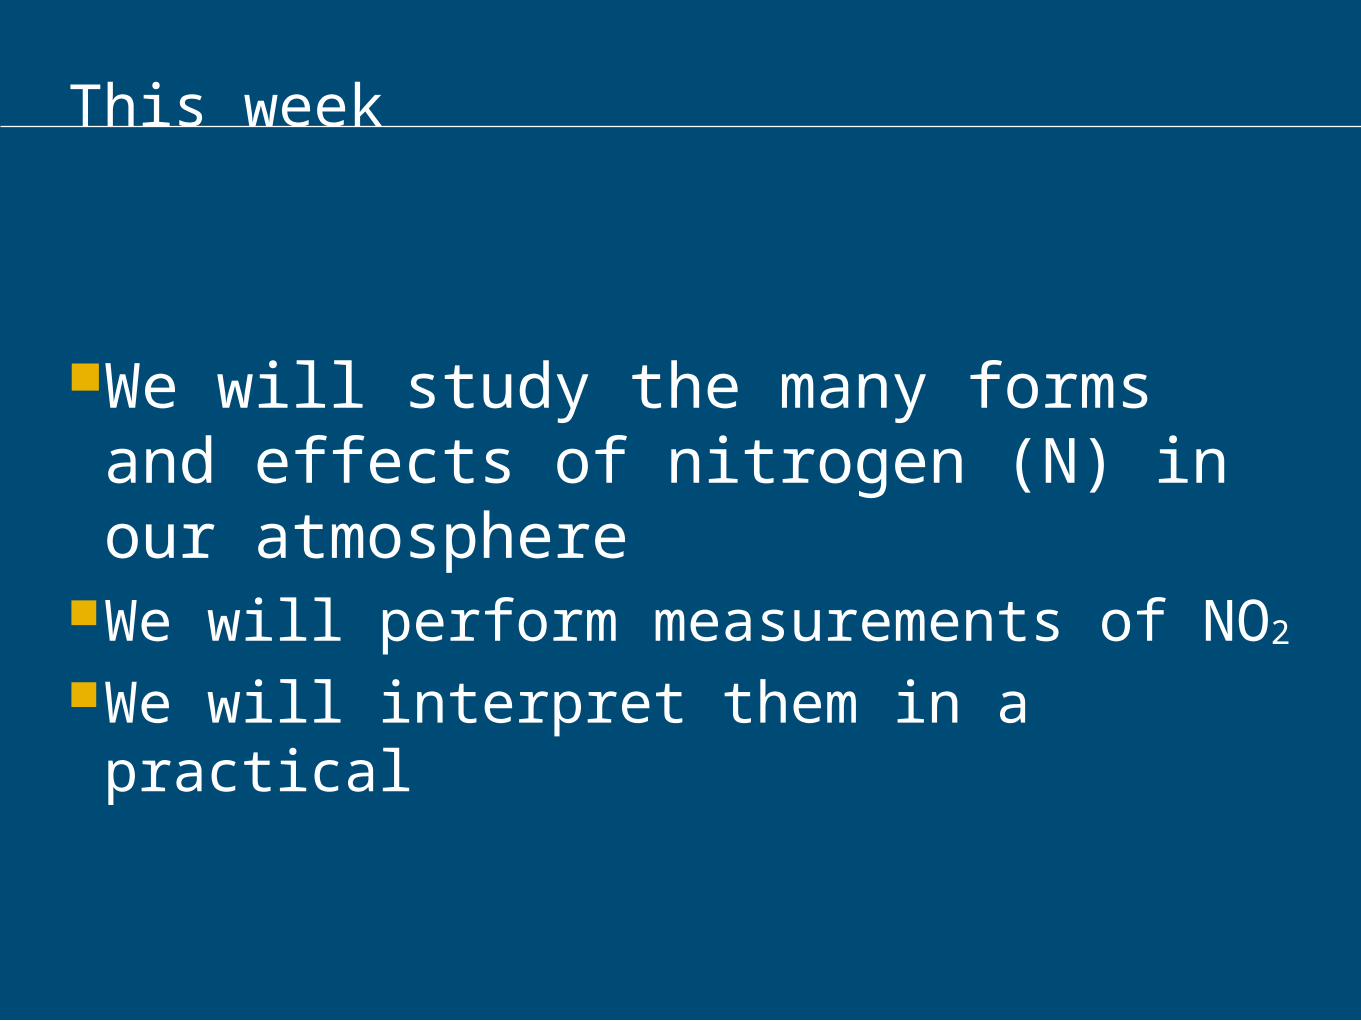
This week
We will study the many forms and effects of nitrogen (N) in our atmosphere
We will perform measurements of NO2
We will interpret them in a practical

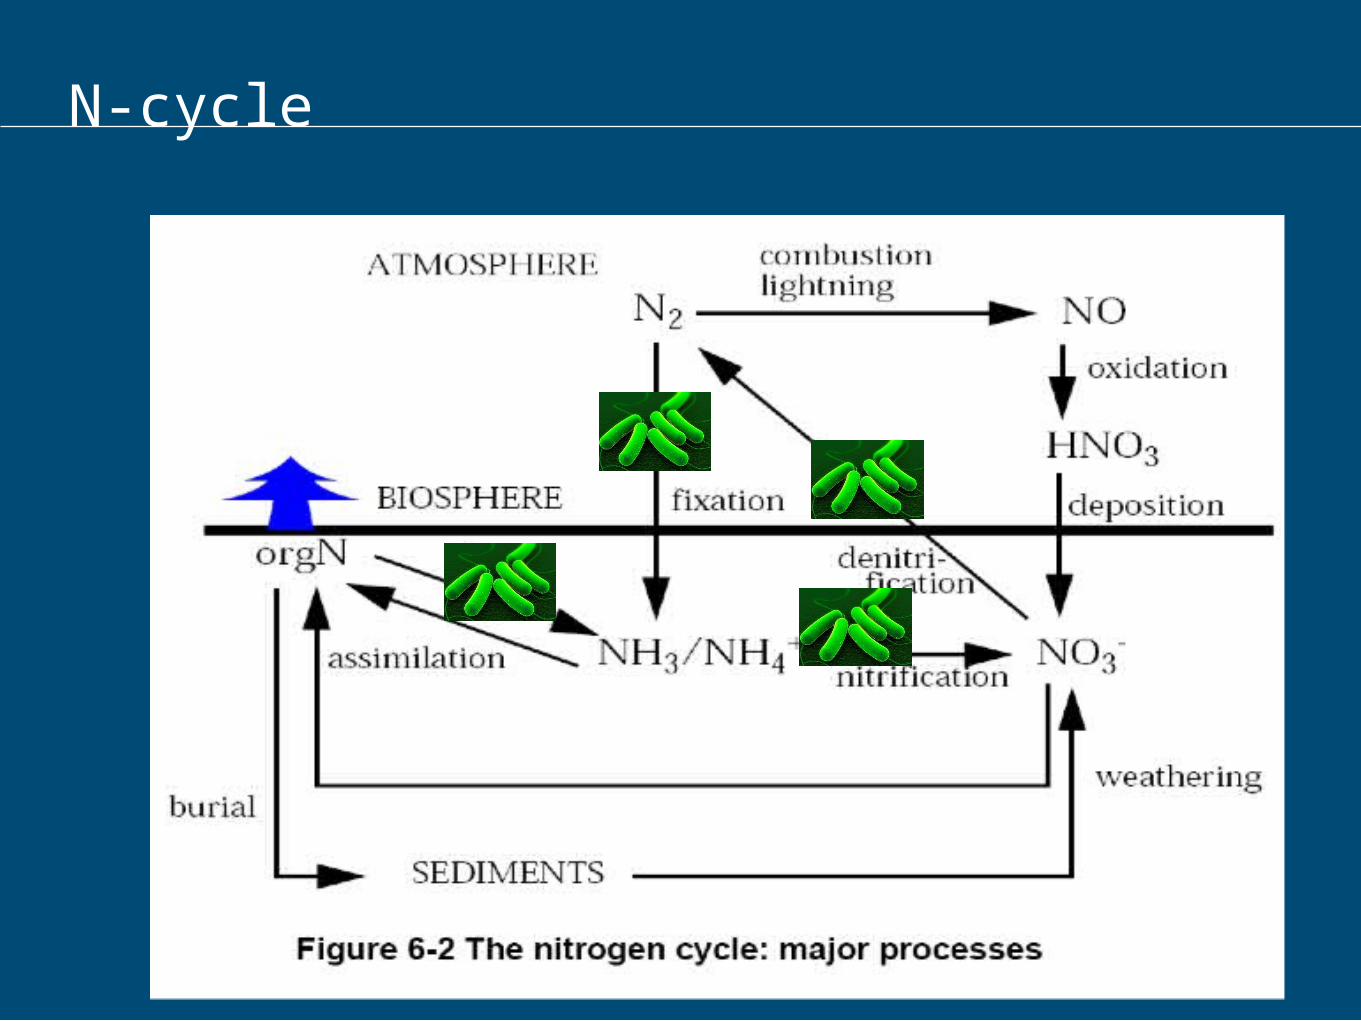
N-cycle: reactive vs. non-reactive
Forms of Nr:NH3/NH4
+
NO3-, HNO3
NO, NO2, …orgN (e.g. amino-acids)

N-cycle
N-cycle

N-cycle

N-cycle

N-cycleEfficiency of fertilizer N
100
FertilizerN
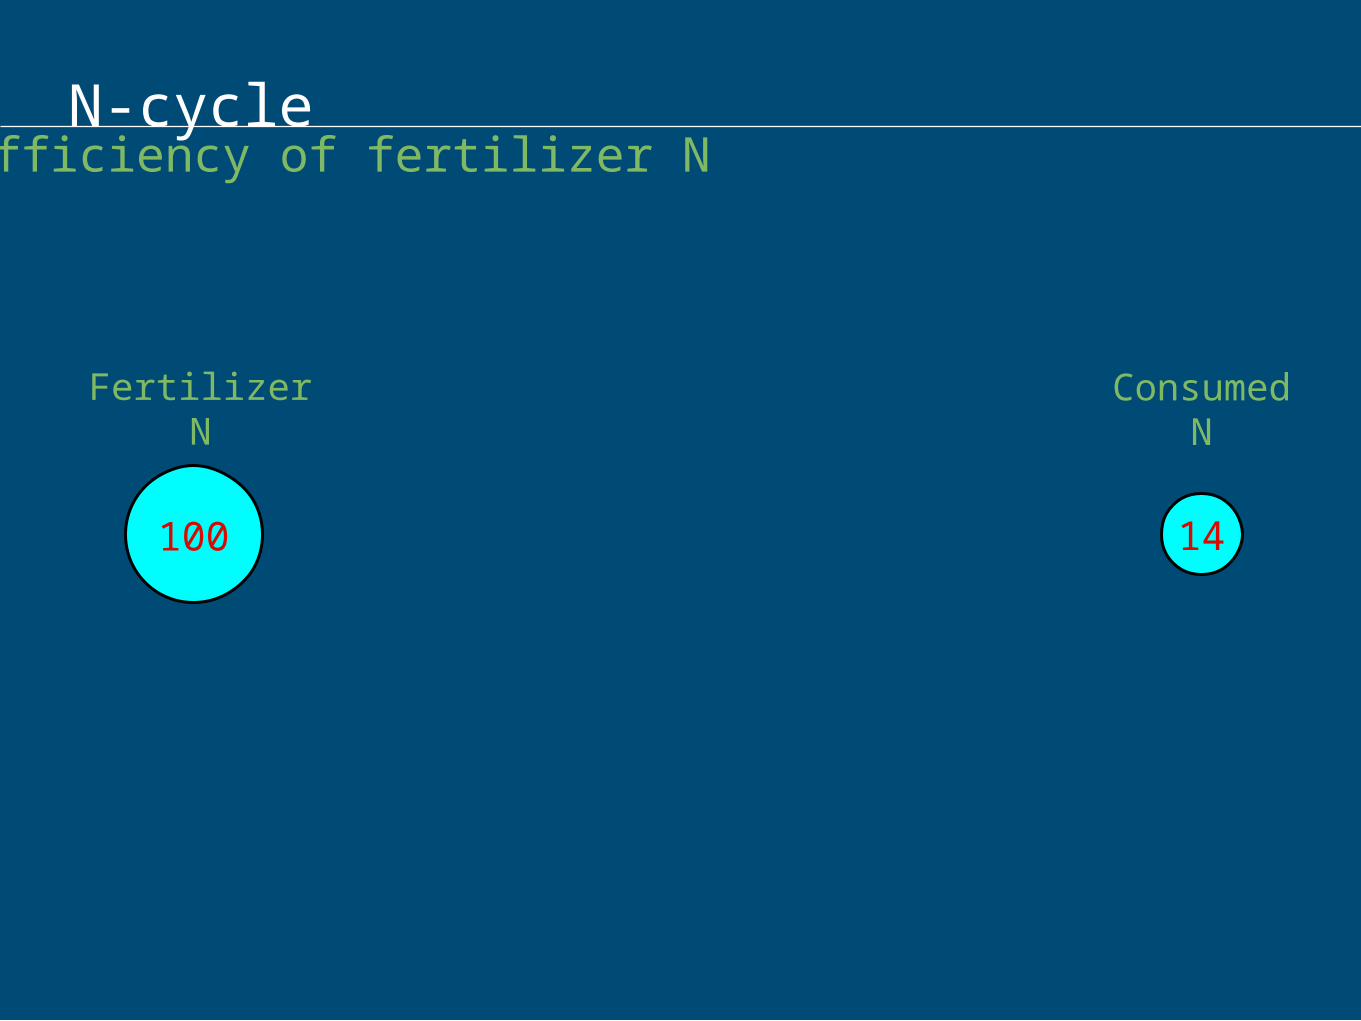
N-cycleEfficiency of fertilizer N
100
FertilizerN
14
ConsumedN

N-cycleEfficiency of fertilizer N
100
FertilizerN
14
ConsumedN
94
EffectiveN
-6

N-cycleEfficiency of fertilizer N
100
FertilizerN
14
ConsumedN
94 47
EffectiveN
PlantN
-6 -47

N-cycleEfficiency of fertilizer N
100
FertilizerN
14
ConsumedN
94 47 31
EffectiveN
PlantN
YieldedN
-6 -47 -16

N-cycleEfficiency of fertilizer N
100
FertilizerN
14
ConsumedN
94 47 31 26
EffectiveN
PlantN
YieldedN
FoodN
-6 -47 -16 -5

N-cycleEfficiency of fertilizer N
100
FertilizerN
14
ConsumedN
94 47 31 26
EffectiveN
PlantN
YieldedN
FoodN
-6 -47 -16 -5 -12
14% of the produced reactive Nitrogen is consumed………if you are vegetarian!

N-cycleEfficiency of fertilizer N
100
FertilizerN
4
ConsumedN
94 47 31 7
EffectiveN
PlantN
FoodN
MeatN
-6 -47 -16 -24 -3
4% of the produced reactive Nitrogen is consumed………if you eat the vegetarian!

N-cycle
Intensive agriculture
Industrialisation
Historic development
Closed cycles of nutrients
Labour and Transport

N-cycle
0
1000
2000
3000
4000
5000
6000
7000
1850 1900 1950 2000
Jaar
Worl
d p
opula
tion a
nd
Agri
cult
ura
l are
a
0
10
20
30
40
50
60
70
80
90
Fert
ilize
r and
N
Ox
World population (10^6)
Agricultural area 10^6 ha
Fertiliser Tg
NOx emission
N= Food; Energy = NCarl Bosch Fritz Haber

Nitrification and de-nitrification
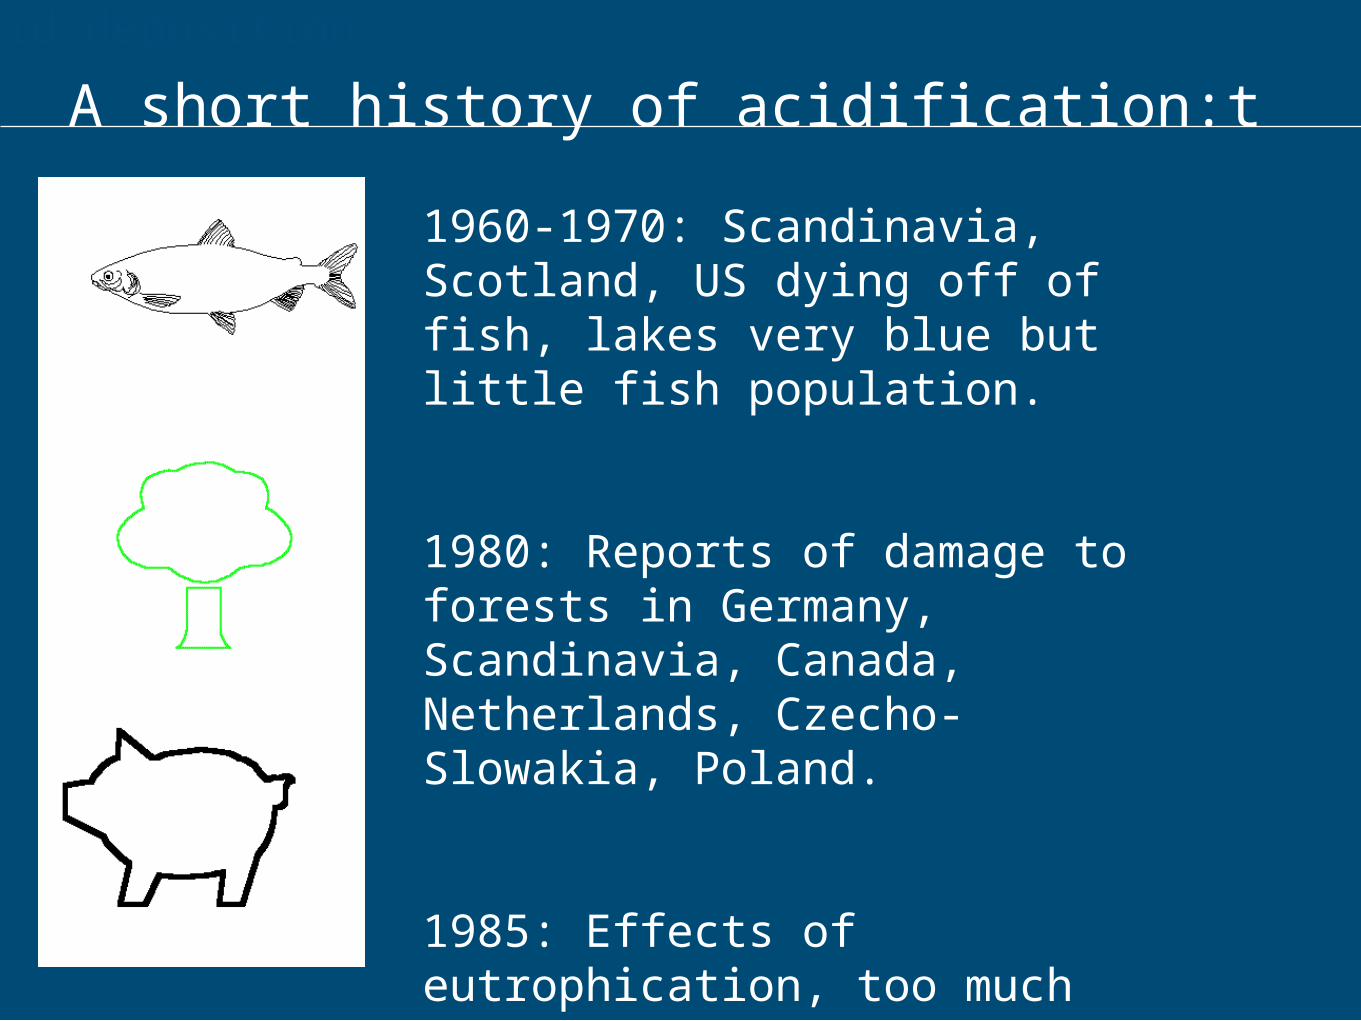
1960-1970: Scandinavia, Scotland, US dying off of fish, lakes very blue but little fish population.
1980: Reports of damage to forests in Germany, Scandinavia, Canada, Netherlands, Czecho-Slowakia, Poland.
1985: Effects of eutrophication, too much nitrogen deposition, too much nitrate in drinking water, loss of species in ecosystems, algae blooms
Acid deposition
A short history of acidification:t
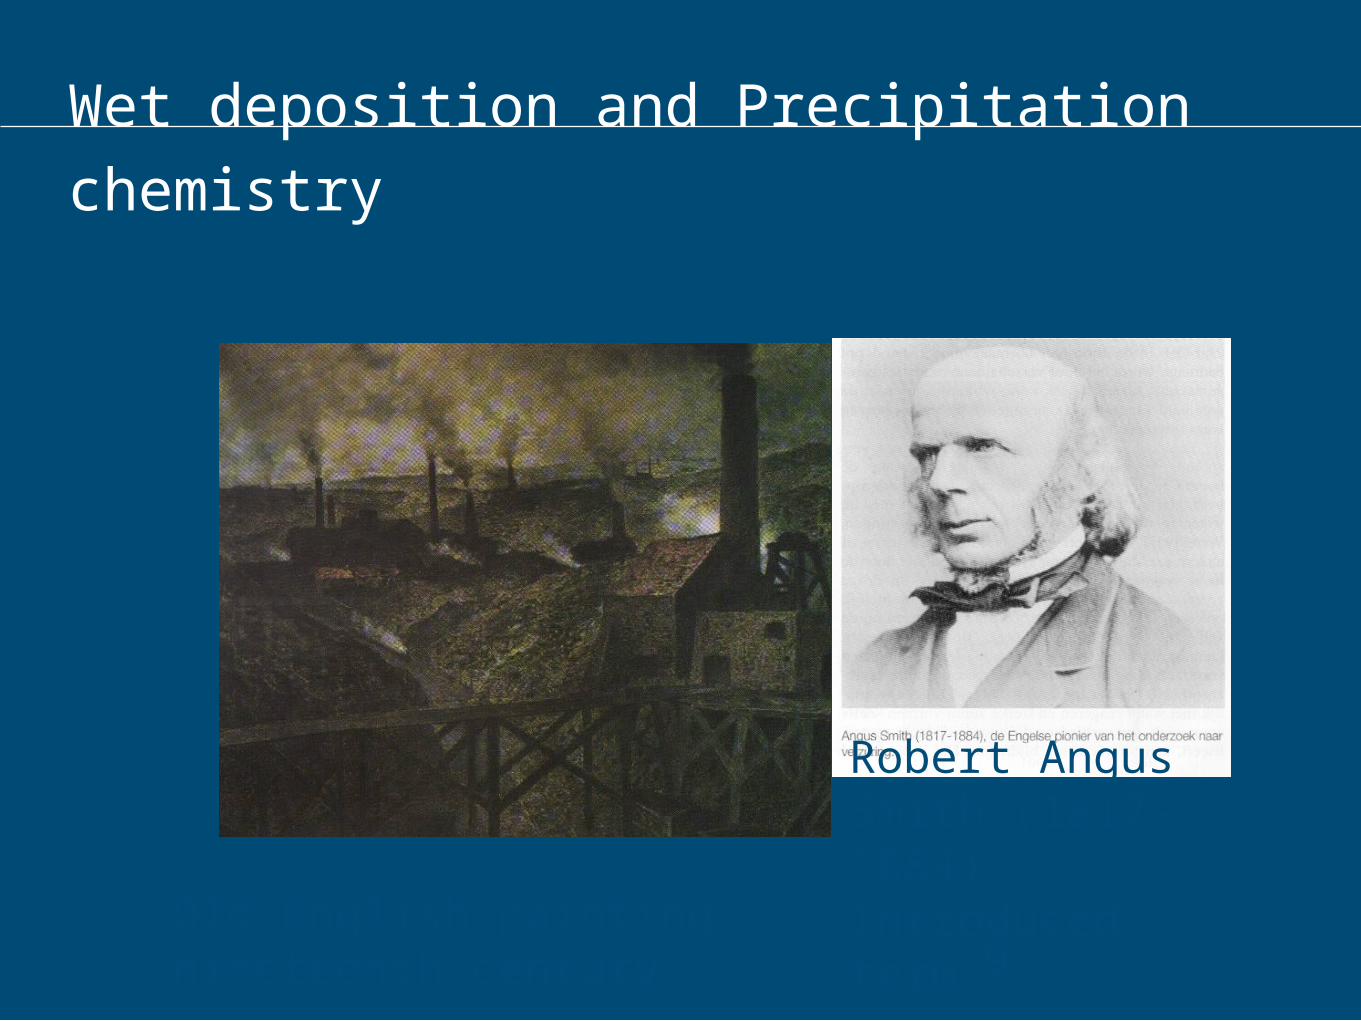
99
Robert Angus Smith (1817-1884)Introduced term: Acid RainOld English painting nineteenth
century
Wet deposition and Precipitation chemistry

1717
pH
Pure water H2O ↔ H+ + OH- 7
+ dissolved CO2
CO2(g) + H2O ↔ H2CO3*
H2CO3* ↔ HCO3- + H+
HCO3- ↔ CO3
2- + H+
5.6-5.7
+ dissolved other natural acids
• HNO3 (NOx, lightning, soils, and fires)
• H2SO4 (sulfur gases, volcanoes and biosphere)
• Cl- (ocean)
• Formaldehyde [HCHO]
• Organic acids: formic acid, acetic acid (biosphere)
5 - 7
+ cations • NH4+ (natural, agriculture) (NH3 base in rainwater)
• Ca2+, Mg2+, K+, Na+ (wind blow)
Acid rain: pH < 5
The pH of precipitation
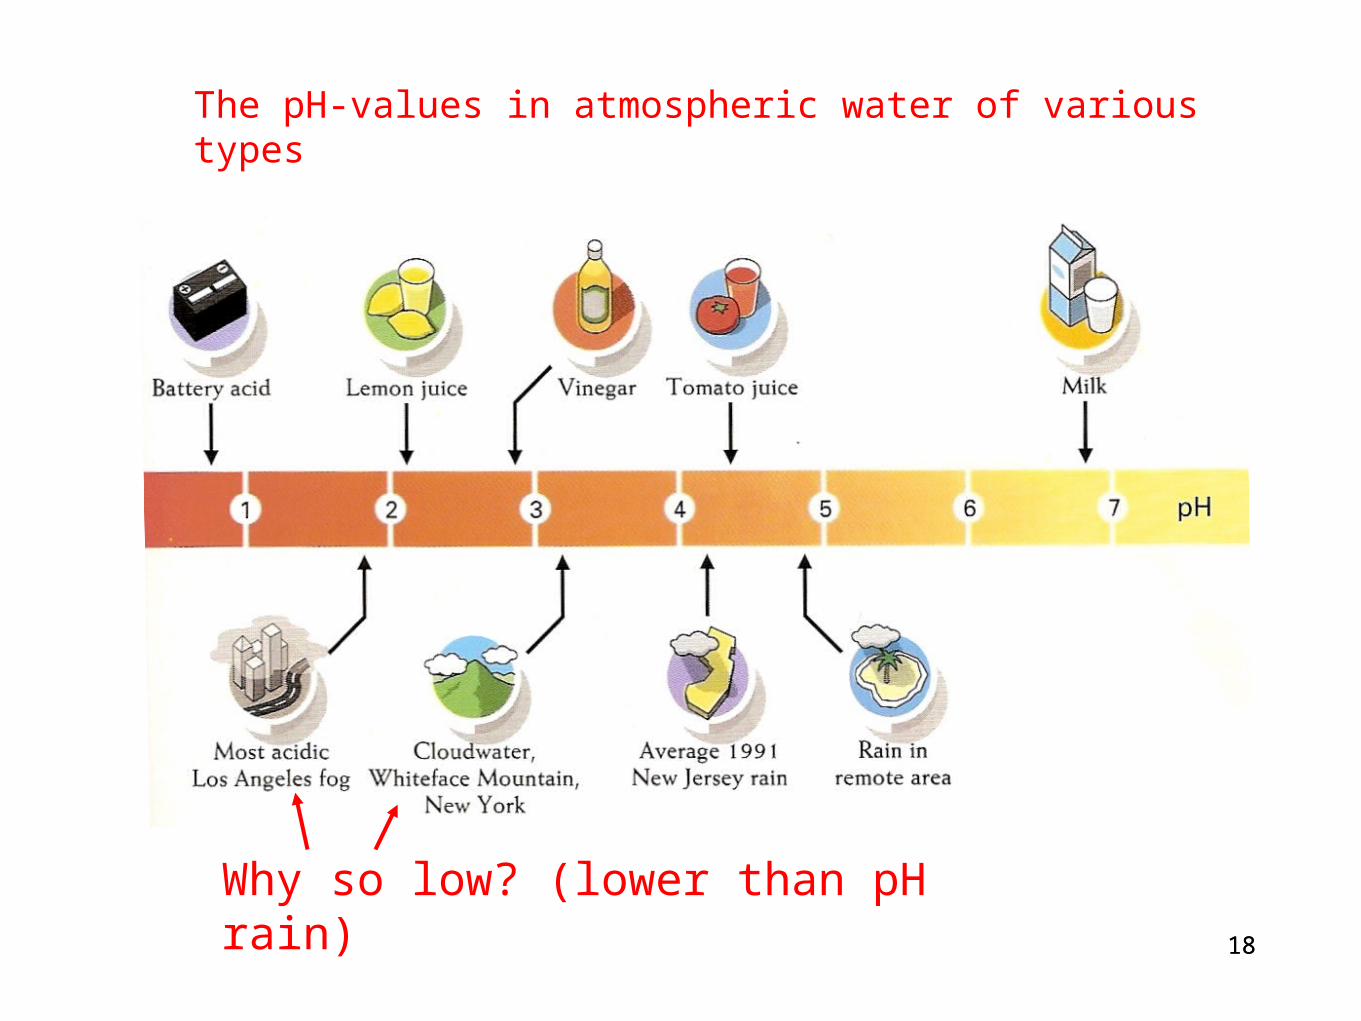
1818
The pH-values in atmospheric water of various types
Why so low? (lower than pH rain)
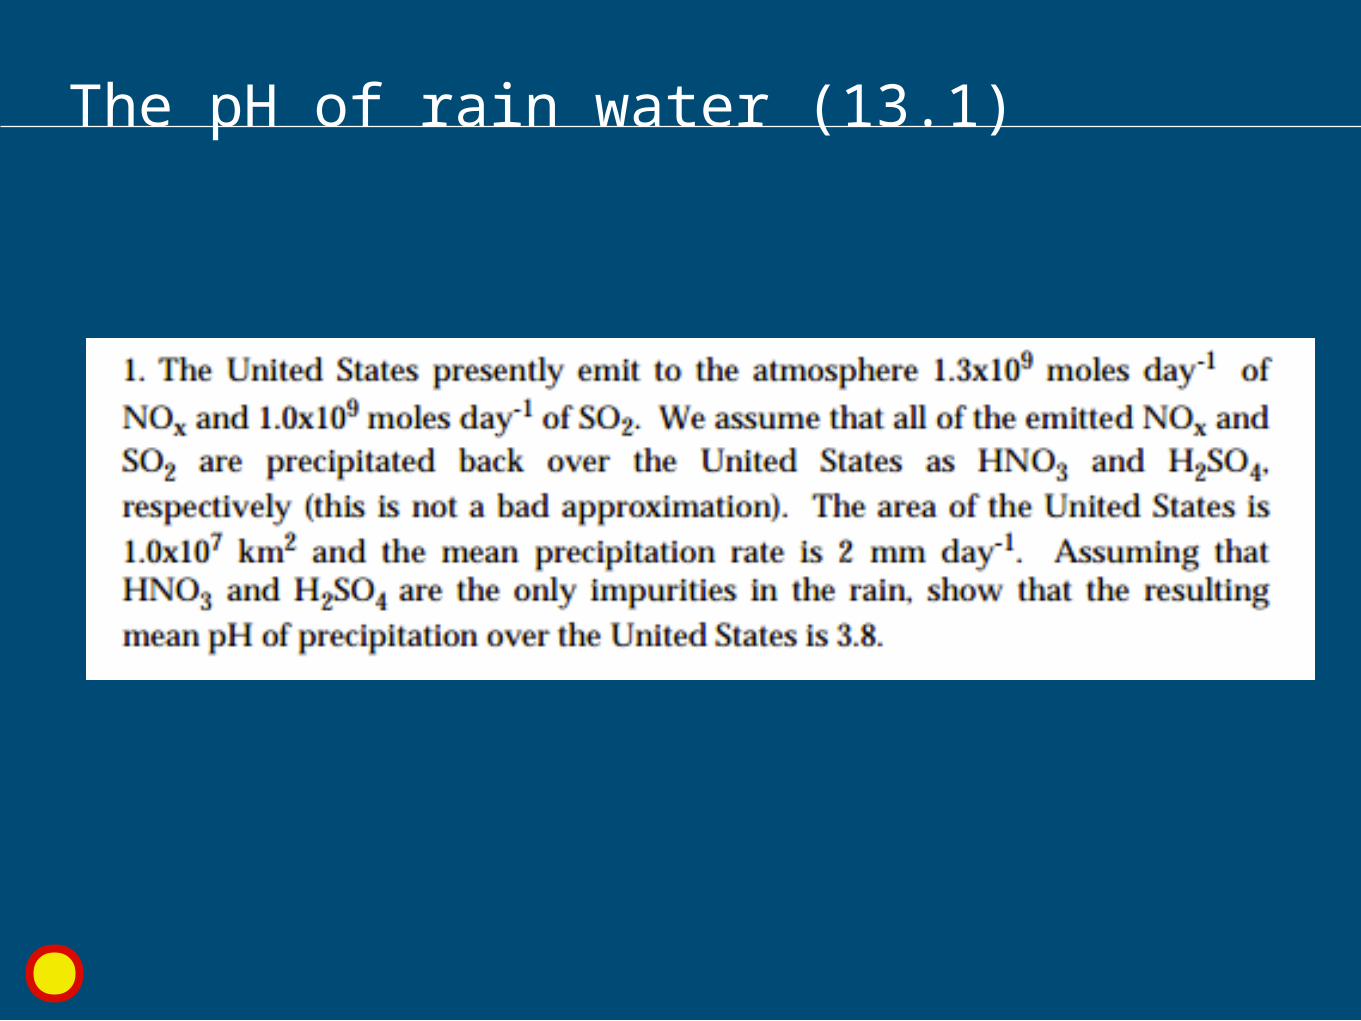
The pH of rain water (13.1)


But NH3 is a base? What now acid rain?
➡In soils by bacteria:➡NH4
+ + H2O + 2O2 --> NO3- + H2O + 2 H+
(nitrification)➡but also: fertilization (NO3
2-)➡over-fertilization: eutrophication

NH3
Sources: Mainly agriculture (94%)
Fertilizer Liquid manure Animal house

European NH3 emissions
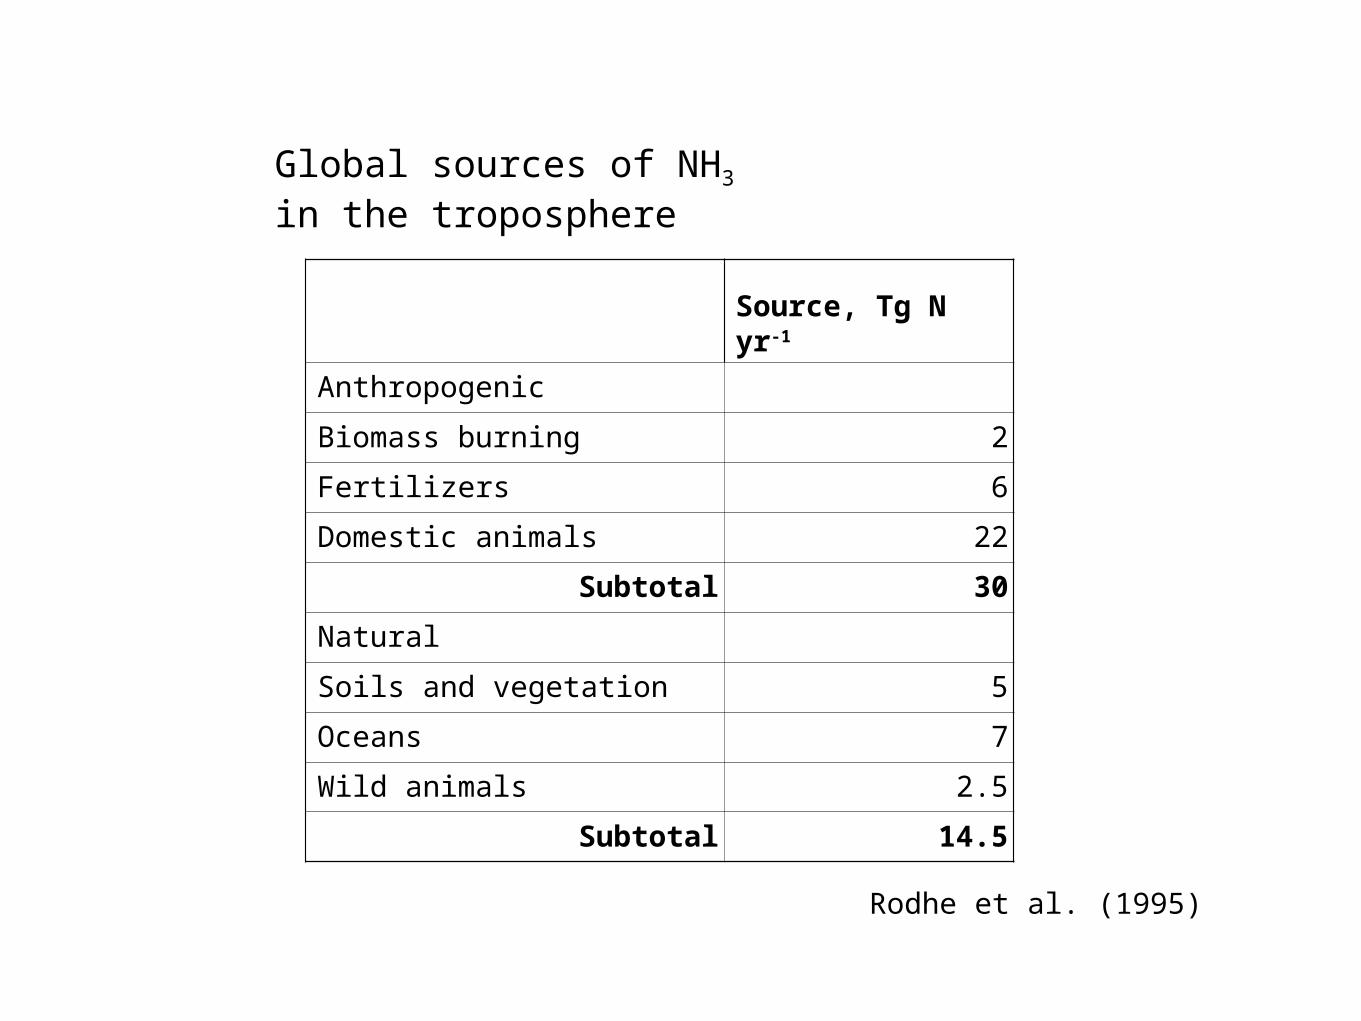
Global sources of NH3 in the troposphere
Source, Tg N yr-1
Anthropogenic
Biomass burning 2
Fertilizers 6
Domestic animals 22
Subtotal 30
Natural
Soils and vegetation 5
Oceans 7
Wild animals 2.5
Subtotal 14.5
Rodhe et al. (1995)
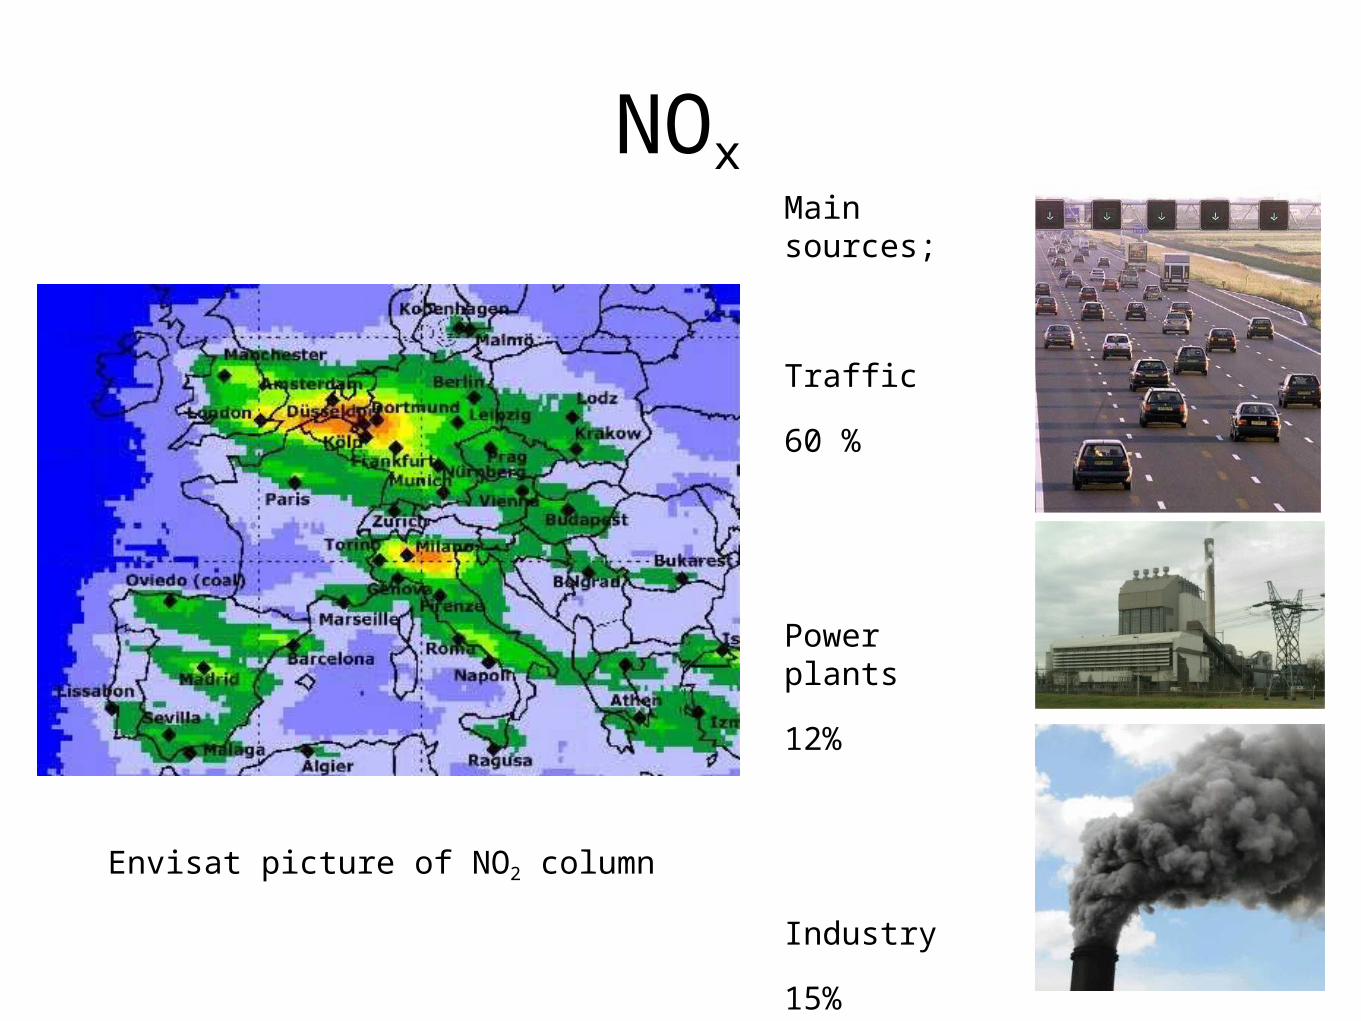
NOx
Envisat picture of NO2 column
Main sources;
Traffic
60 %
Power plants
12%
Industry
15%

Global NOx emissions

European NOx emissions
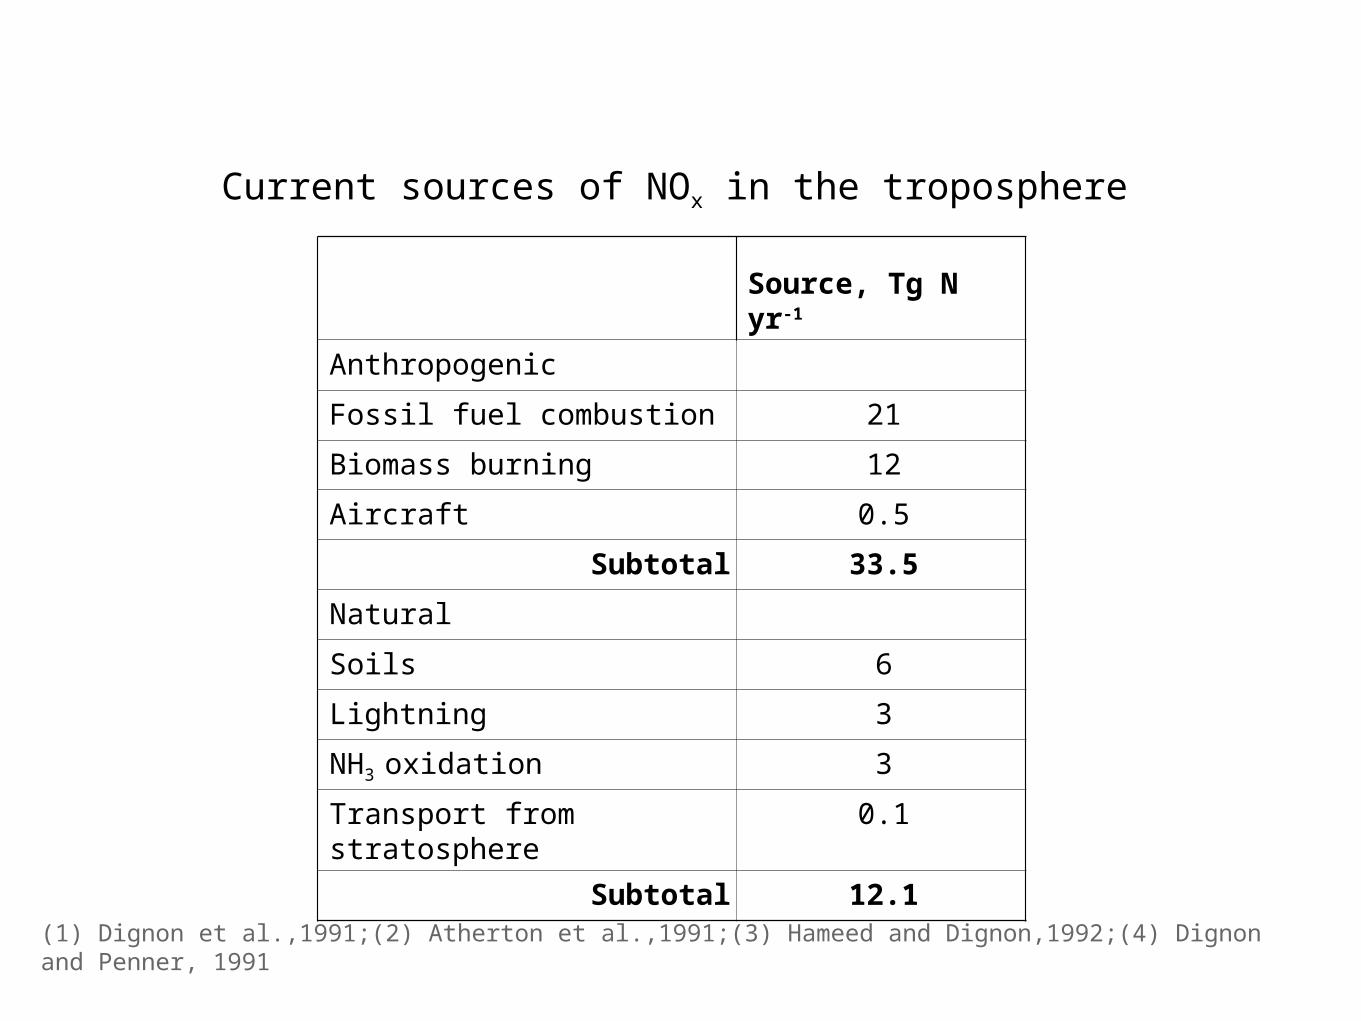
Current sources of NOx in the troposphere
Source, Tg N yr-1
Anthropogenic
Fossil fuel combustion 21
Biomass burning 12
Aircraft 0.5
Subtotal 33.5
Natural
Soils 6
Lightning 3
NH3 oxidation 3
Transport from stratosphere
0.1
Subtotal 12.1
(1) Dignon et al.,1991;(2) Atherton et al.,1991;(3) Hameed and Dignon,1992;(4) Dignon and Penner, 1991
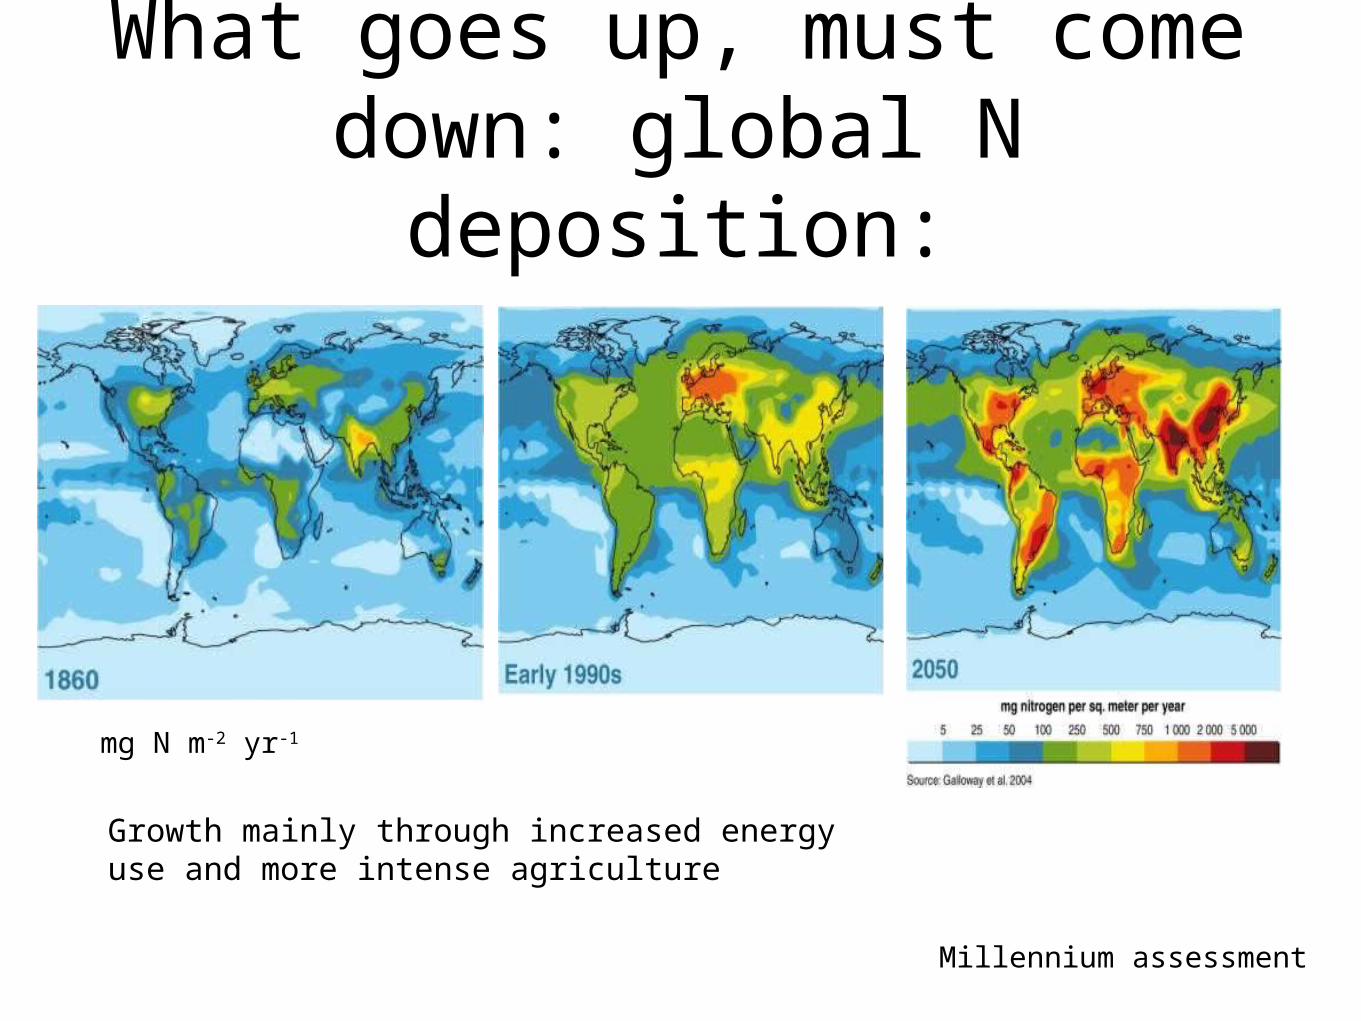
What goes up, must come down: global N deposition:
mg N m-2 yr-1
Millennium assessment
Growth mainly through increased energy use and more intense agriculture

Sensitivity of EU soils for Acid
Sensitivity of European soils.
5 classes are used,
from white (very insensitive), over light yellow, dark yellow and light red to dark red (very sensitive)
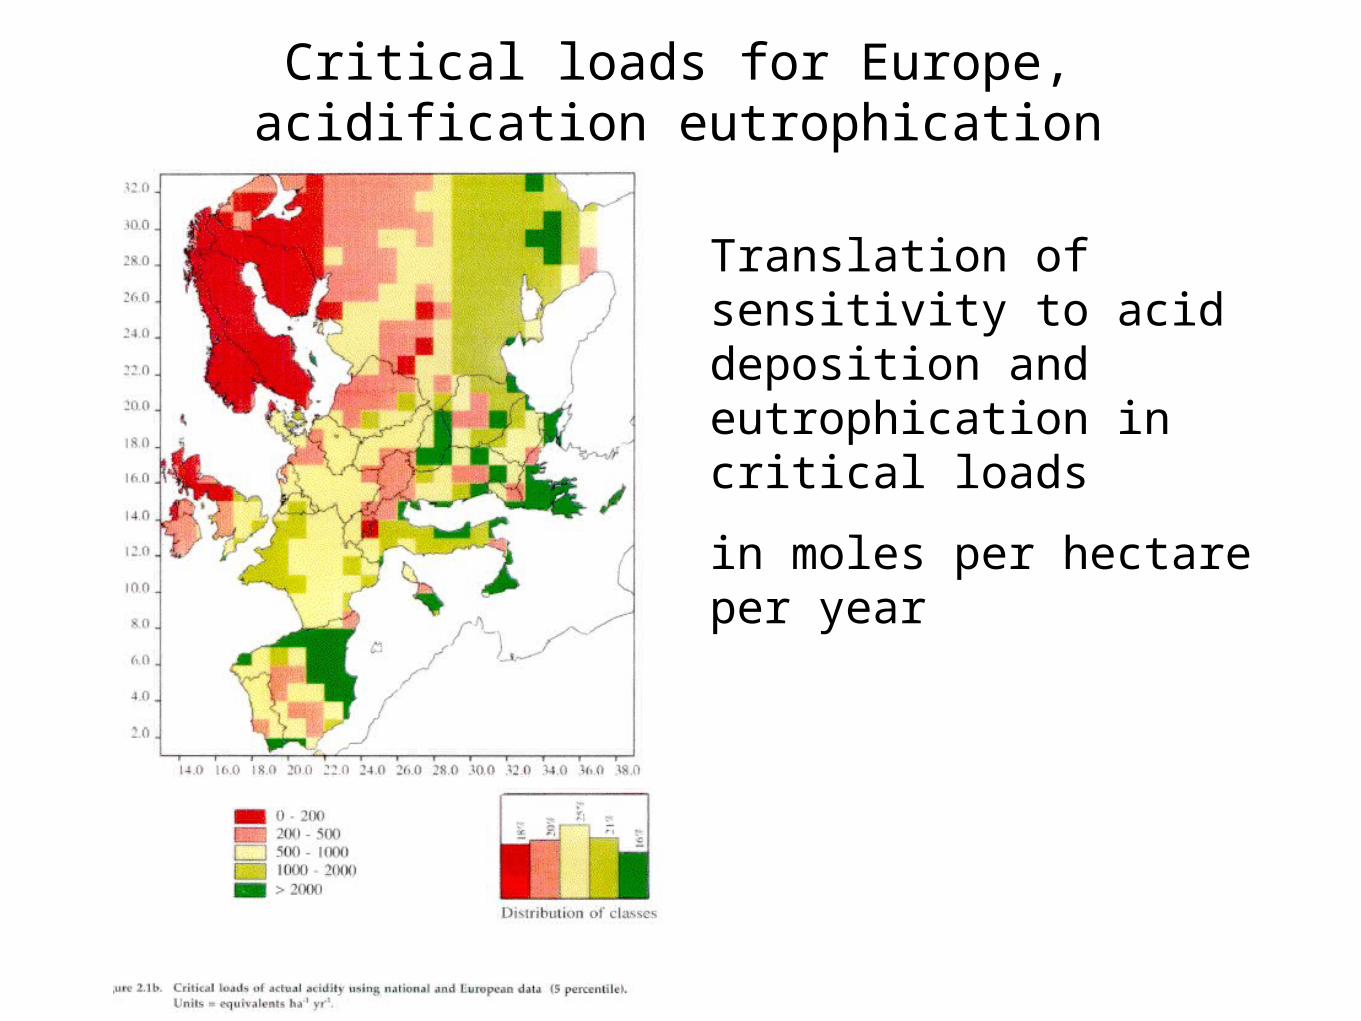
Critical loads for Europe, acidification eutrophication
Translation of sensitivity to acid deposition and eutrophication in critical loads
in moles per hectare per year

Potential acid deposition in Europe in moles per ha per year
F(potential acid)= 2F(SOx) + F(NOy) + F(NHx)
F = Load
F(SOx) = F(sulfate) + F(SO2)
F(Noy ) = sum fluxes of HNO3 and NOx
F(NHx) = sum fluxes NH3 and NH4
Correction for base cations:
F(corrected pot. acid) = 2F(SOx)+F(NOy) + F(NHx) - F(base cations)

Exceedence of critical loads in moles per ha per year
Exceedence in southern Scandinavia because of sensitive soil
Exceedence in middle Europe because of high load
No exceedence in South Europe because of insensitive soil

The Dutch situation for Acid

The Dutch situation for Nitrogen
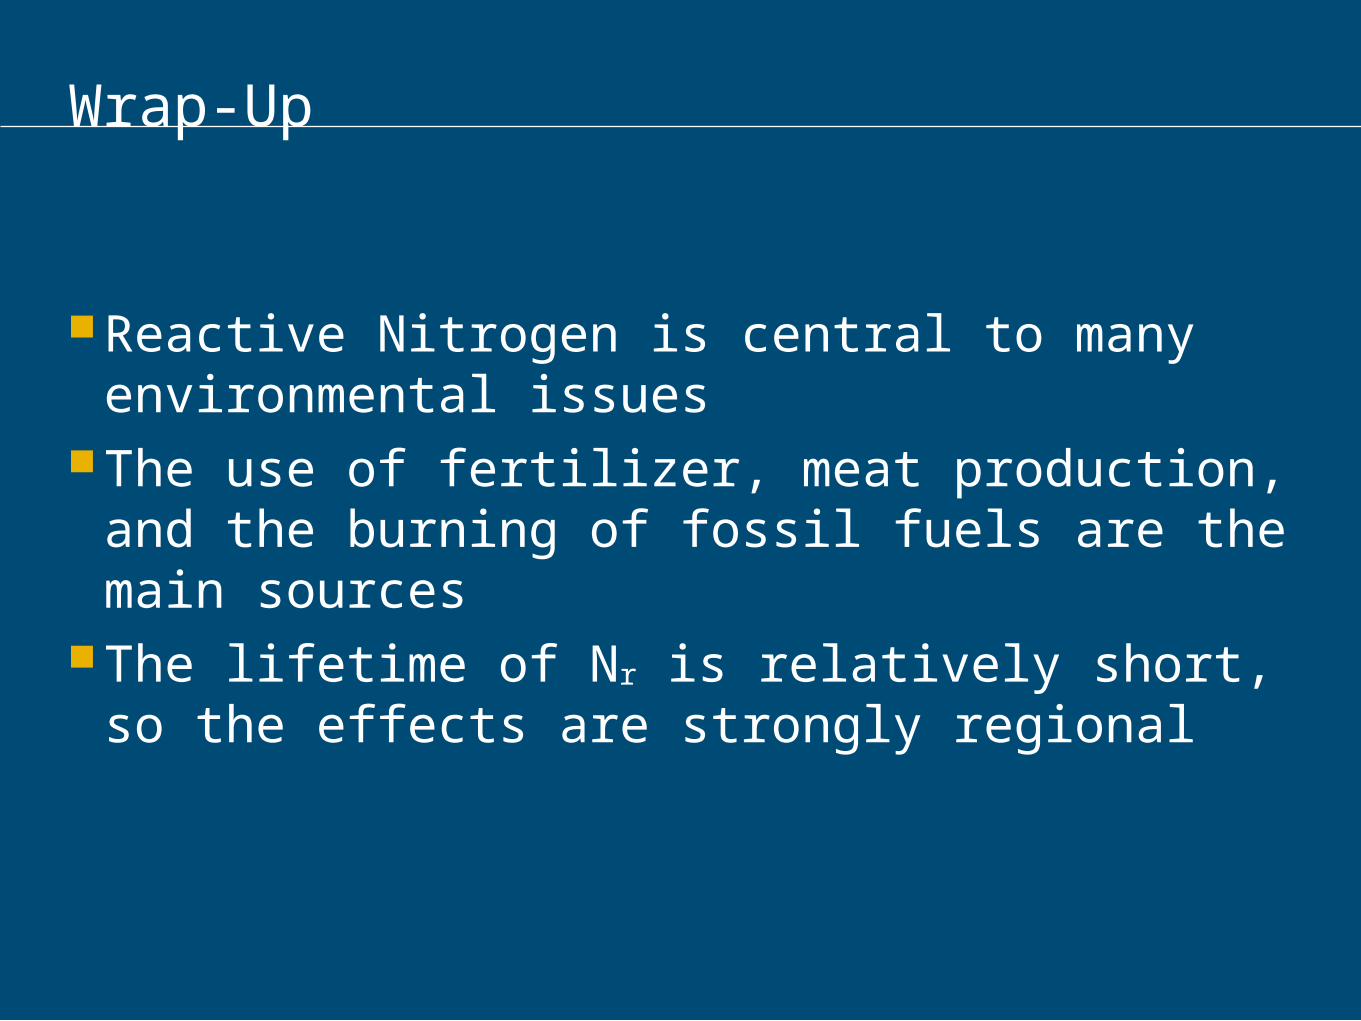
Wrap-Up
Reactive Nitrogen is central to many environmental issues
The use of fertilizer, meat production, and the burning of fossil fuels are the main sources
The lifetime of Nr is relatively short, so the effects are strongly regional