atmosphere water bodies structure of environmental...
TRANSCRIPT
ESM 222 © ARTURO KELLER1
ESM 222
Structure of Environmental
Media
ESM 222 © ARTURO KELLER2
Structure of Environmental Media
AtmosphereStructureAerosols
SoilsStructureCompositionMicrobial activity
Water Bodies
Rivers and StreamsLakesOceansParticulate MatterSediments

ESM 222 © ARTURO KELLER3
Atmospheric Composition
Source: Pollution Science, Pepper et al 1996. ESM 222 © ARTURO KELLER4
Atmosphere
Pollutants of concern in the atmosphere are:
Urban air pollutants:O3 via NOx and VOCs, CO, NOx, SO2, particulates, HAPs, ...
Acid rain gases:NOx, SO2, …
Greenhouse gases:CO2, CH4, N2O, CFCs, ...
Ozone destroyers in stratosphere:
CFCs, …

Source: Pollution Science, Pepper et al, 1996. ESM 222 © ARTURO KELLER6
Atmosphere
For urban air pollution, troposphere is where all action occursSurface layer
at bottom of boundary layer ~1/10th of boundary layer,
typically tens of meterssurface roughness and surface
heat exchange affect properties (temperature, wind speed, humidity)
ESM 222 © ARTURO KELLER7
Atmosphere
Atmospheric boundary layerturbulence in this region may
cause significant short-term mixinginterface between
troposphere and groundonly a few hundreds of
meters thicklarge-scale airflow patterns
affected by surface features, with large vertical gradients of temperature, wind speed and humidity
ESM 222 © ARTURO KELLER8
Atmosphere
Atmospheric boundary layerHeight of boundary layer
varies throughout day, with maximum thickness by mid-afternoonBoundary layer shrinks to
about 100 to 200 m at nightThermal “inversion” may
cause trapping of pollutants in boundary layer, reducing the mixing depth

ESM 222 © ARTURO KELLER9
Wind Direction
Source: Environmental Engineering Handbook, 2nd ed., Liu & Liptak, 1996 ESM 222 © ARTURO KELLER10
Wind Direction
Source: Environmental Engineering Handbook, 2nd ed., Liu & Liptak, 1996

ESM 222 © ARTURO KELLER11
Turbulence
Dispersion of pollutants due to:
wind speedatmospheric turbulence
Turbulence considers variations of more than 2 cycles/hrMost important are variations in the order of 1 to 0.01 cycles/sec
ESM 222 © ARTURO KELLER12
Turbulence
Source: Environmental Engineering Handbook, 2nd ed., Liu & Liptak, 1996

ESM 222 © ARTURO KELLER13
Inversions
When temperature increases with altitude, lapse rate is negative or “inverted”from normal stateOccurs when warm air
“blankets” colder air: atmosphere is extremely stableInversions limit vertical
mixing, trapping pollutants in the lower region
ESM 222 © ARTURO KELLER14
Inversions

Source: Environmental Engineering Handbook, 2nd ed., Liu & Liptak, 1996 Source: Environmental Engineering Handbook, 2nd ed., Liu & Liptak, 1996
ESM 222 © ARTURO KELLER17
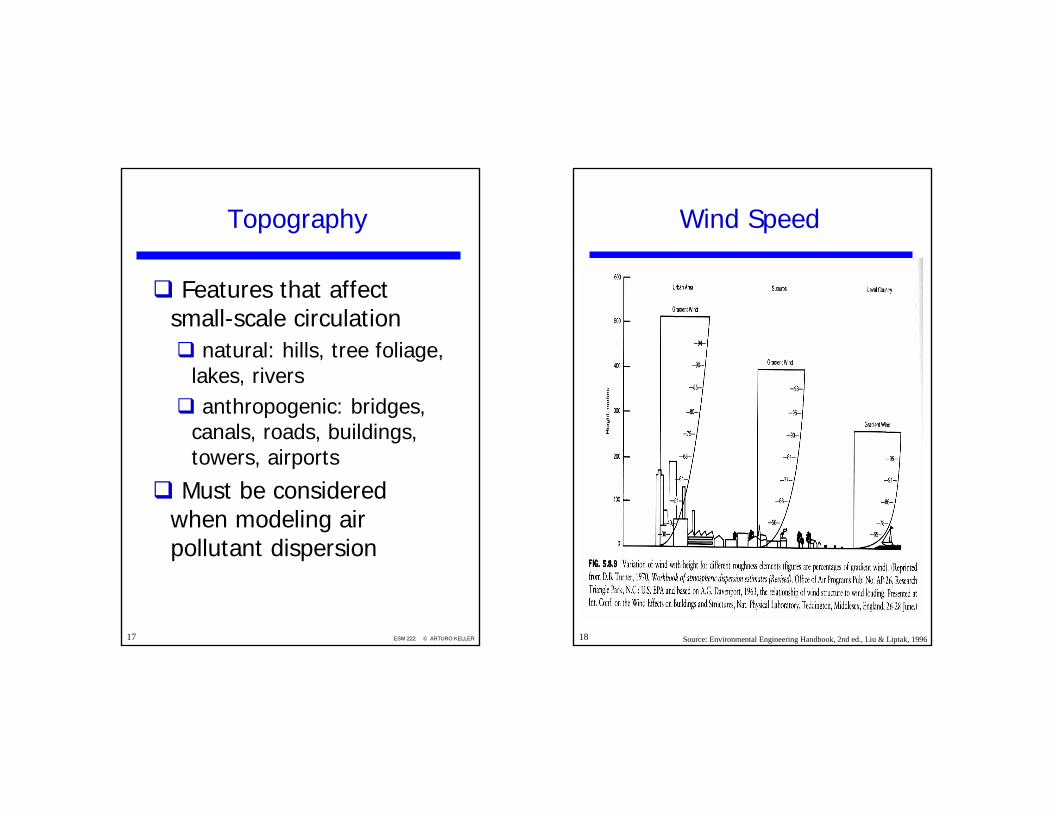
Topography
Features that affect small-scale circulation
natural: hills, tree foliage, lakes, riversanthropogenic: bridges,
canals, roads, buildings, towers, airports
Must be considered when modeling air pollutant dispersion
ESM 222 © ARTURO KELLER18
Wind Speed
Source: Environmental Engineering Handbook, 2nd ed., Liu & Liptak, 1996
ESM 222 © ARTURO KELLER19
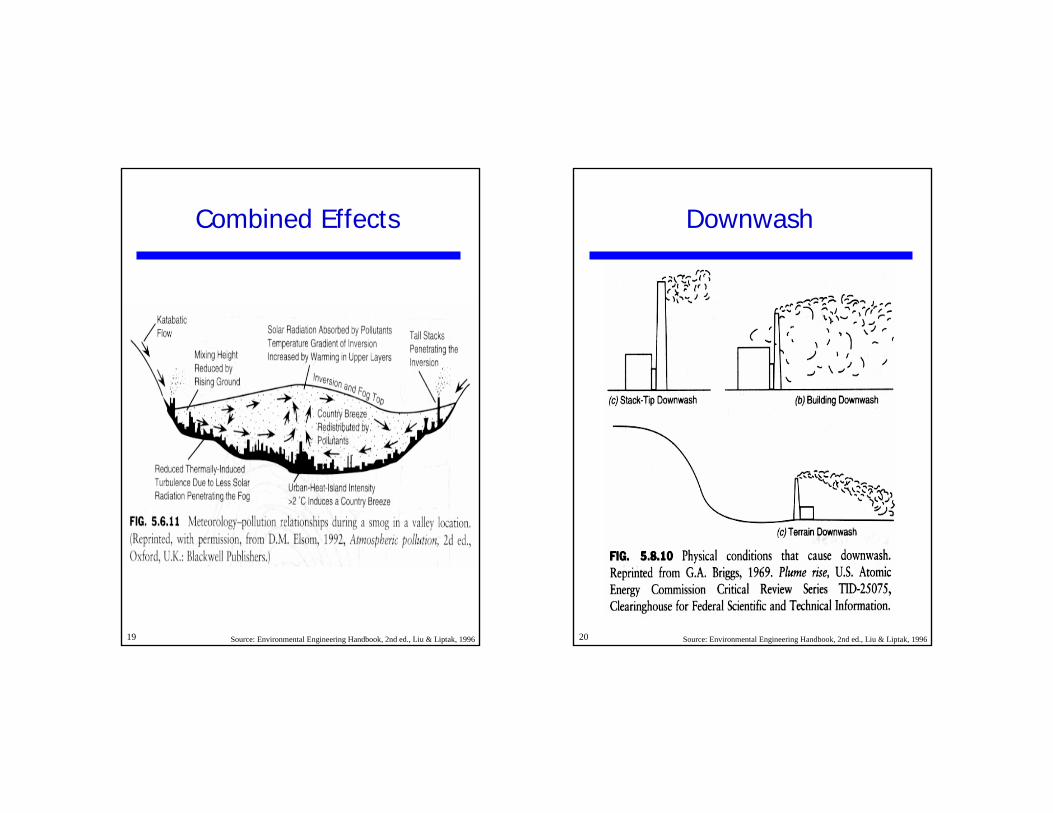
Combined Effects
Source: Environmental Engineering Handbook, 2nd ed., Liu & Liptak, 1996 ESM 222 © ARTURO KELLER20
Downwash
Source: Environmental Engineering Handbook, 2nd ed., Liu & Liptak, 1996

ESM 222 © ARTURO KELLER21
Line Sources
Source: Environmental Engineering Handbook, 2nd ed., Liu & Liptak, 1996 Source: Environmental Engineering Handbook, 2nd ed., Liu & Liptak, 1996

ESM 222 © ARTURO KELLER23
Dispersion Models
Source: Environmental Engineering Handbook, 2nd ed., Liu & Liptak, 1996 ESM 222 © ARTURO KELLER24
Atmospheric Structure
Aerosols & Particulate Matterdust particles from soildust from combustionwater (fog to rain drops)aggregated particles from
conversion of gas species to aqueous species (e.g. SO2 to HSO-
4)Concern with particles from ~1
to 10 microns
ESM 222 © ARTURO KELLER25
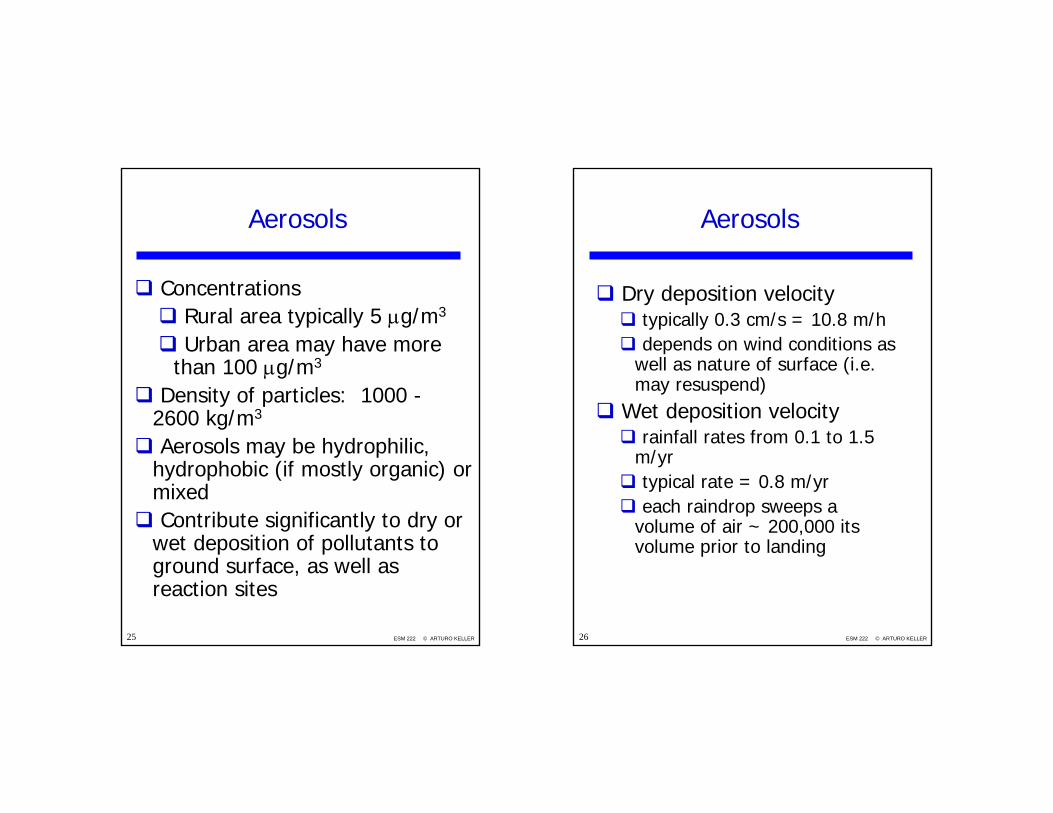
Aerosols
ConcentrationsRural area typically 5 µg/m3
Urban area may have more than 100 µg/m3
Density of particles: 1000 -2600 kg/m3
Aerosols may be hydrophilic, hydrophobic (if mostly organic) or mixedContribute significantly to dry or
wet deposition of pollutants to ground surface, as well as reaction sites
ESM 222 © ARTURO KELLER26
Aerosols
Dry deposition velocitytypically 0.3 cm/s = 10.8 m/hdepends on wind conditions as
well as nature of surface (i.e. may resuspend)
Wet deposition velocityrainfall rates from 0.1 to 1.5
m/yrtypical rate = 0.8 m/yreach raindrop sweeps a
volume of air ~ 200,000 its volume prior to landing

ESM 222 © ARTURO KELLER27
Sample Calculations
Weight and volume of aerosols in atmosphere over an area of 1 km2:
concentration = 50 µg/m3 = 50 x 10-9 kg/m3
volume of air = 6 km x 1 km2 = 6 x 10⁹ m3
density of aerosols = 1500 kg/m3
Weight = concentration x volume of air= 300 kg
Volume = weight/density = 0.2 m3
= 200 L
ESM 222 © ARTURO KELLER28
Sample Calculations
Dry deposition rate:
velocity
length
x volume aerosols = 0.36 x 10⁻³ m3/h
= 3.2 m3/yr
Wet deposition rate:
velocity
lengthx vol. aerosols x vol. swept by raindrop
= 5.3 m3/yr
ESM 222 © ARTURO KELLER29
Soil Structure
Phases in the SoilSolid phase (minerals, SOM)Gas phase
same gases as in atmosphere, but may have very different concentrationsoxygen is lower and carbon
dioxide may be > 1%depending on microbial activity
may have methane, hydrogen sulfide, ethylene, N2O
Water phase
ESM 222 © ARTURO KELLER30
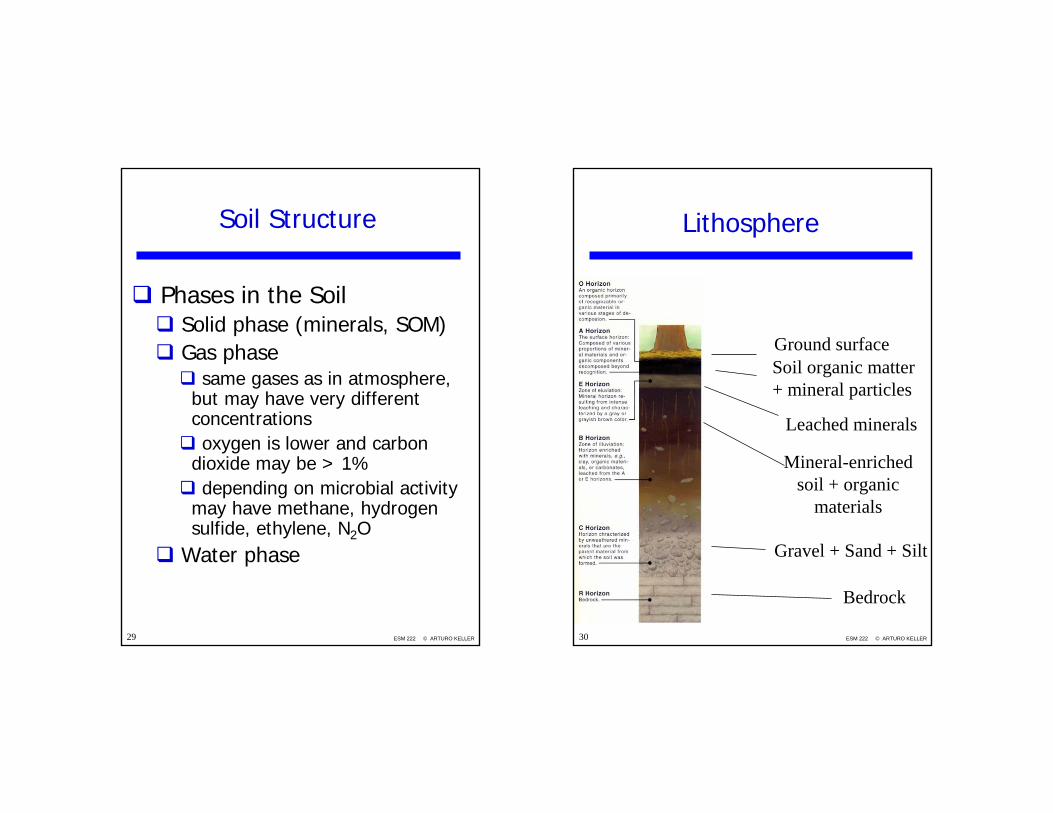
Lithosphere
Ground surfaceSoil organic matter + mineral particles
Leached minerals
Mineral-enriched soil + organic
materials
Gravel + Sand + Silt
Bedrock

ESM 222 © ARTURO KELLER31
Soil Structure
Soil porosityDefined as the volume of
voids (= pore space) divided by the total volume of soilTypically ranges from 20 to
50%Depends on particle size
distributionMixed large and small
particles pack in better, leaving less pore space => lower porosity
USDA classification
Source: Pollution Science, Pepper et al. 1996
ESM 222 © ARTURO KELLER33
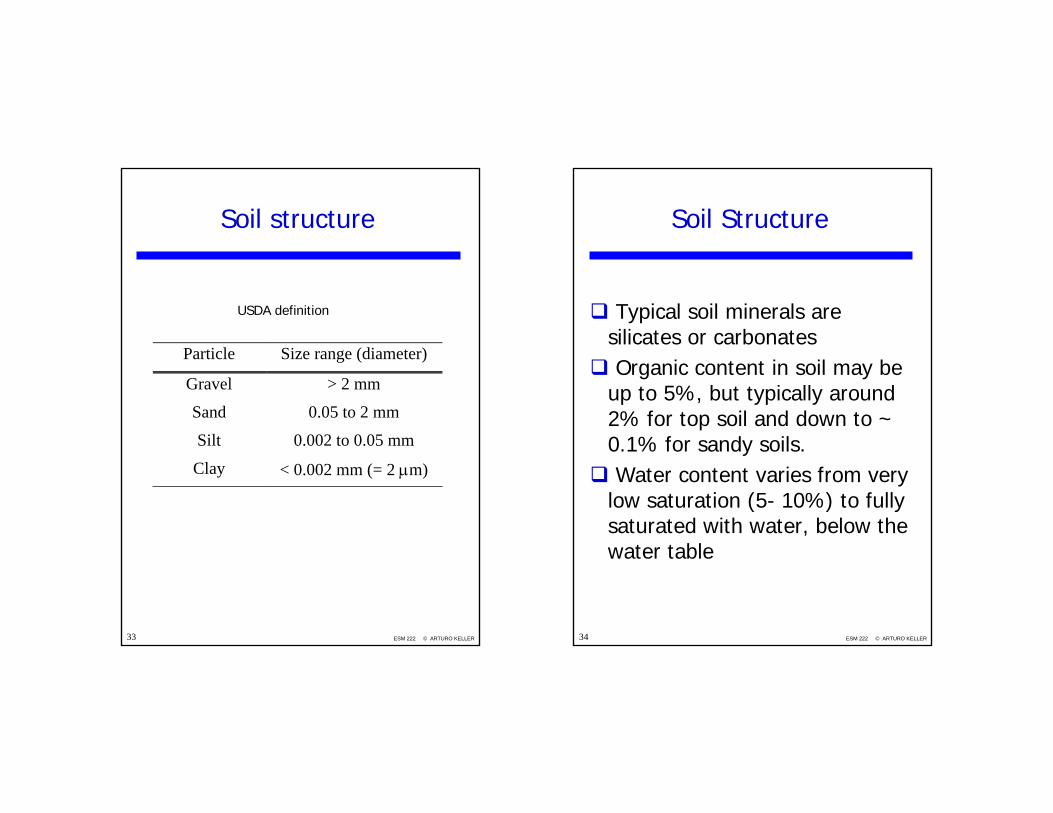
Soil structure
Particle Size range (diameter)
Gravel > 2 mm
Sand 0.05 to 2 mm
Silt 0.002 to 0.05 mm
Clay < 0.002 mm (= 2 µm)
USDA definition
ESM 222 © ARTURO KELLER34
Soil Structure
Typical soil minerals are silicates or carbonatesOrganic content in soil may be
up to 5%, but typically around 2% for top soil and down to ~ 0.1% for sandy soils.Water content varies from very
low saturation (5- 10%) to fully saturated with water, below the water table

ESM 222 © ARTURO KELLER35
Soil Structure
Water table (i.e. depth to first aquifer) fluctuates with recharge (rainfall or irrigation), pumping, and evapotranspiration
Source: Pollution Science, Pepper et al. 1996 ESM 222 © ARTURO KELLER36
Soil structure
Capillary forceWater is sucked up by dry soil
above the water table (balanced by gravity pulling it down)Clayey soils have a stronger
capillary suction due to smaller pore sizesMixed soils (sand + clays) may
have the highest capillary suction since the pores between sand grains are filled with clay particles => very small pore spaces
ESM 222 © ARTURO KELLER37
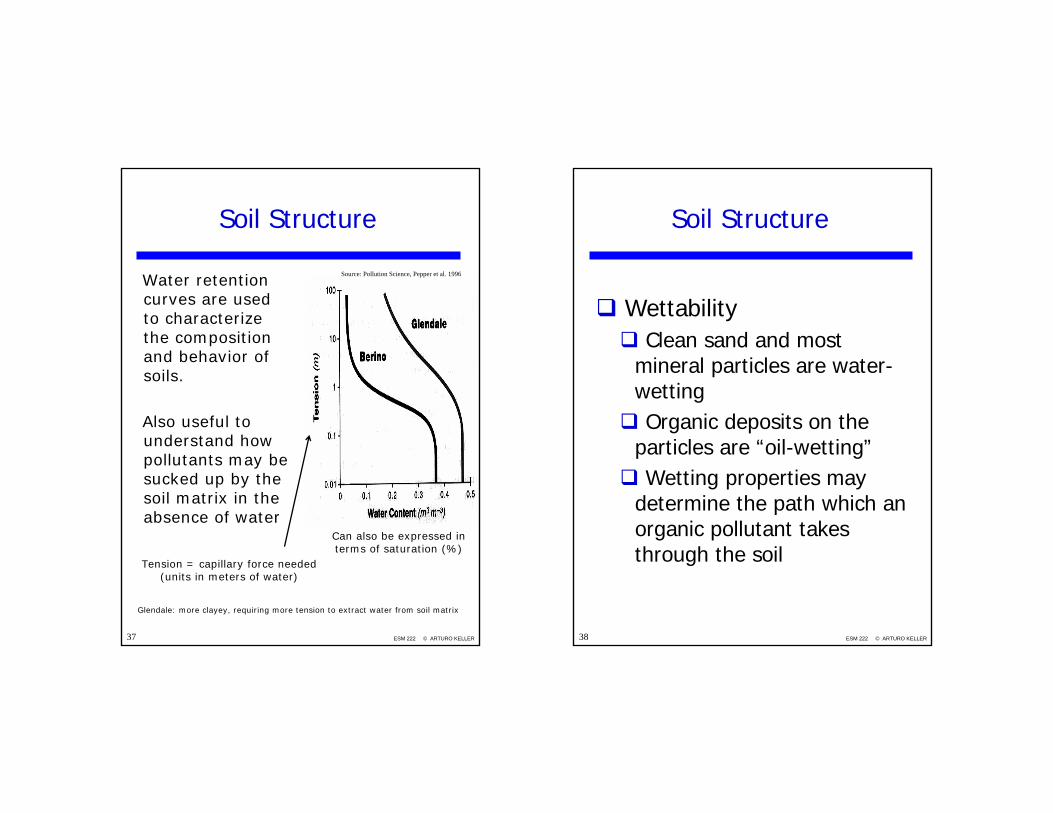
Soil Structure
Water retention curves are used to characterize the composition and behavior of soils.
Also useful to understand how pollutants may be sucked up by the soil matrix in the absence of water
Can also be expressed in terms of saturation (%)
Tension = capillary force needed(units in meters of water)
Source: Pollution Science, Pepper et al. 1996
Glendale: more clayey, requiring more tension to extract water from soil matrix
ESM 222 © ARTURO KELLER38
Soil Structure
WettabilityClean sand and most
mineral particles are water-wettingOrganic deposits on the
particles are “oil-wetting”Wetting properties may
determine the path which an organic pollutant takes through the soil

ESM 222 © ARTURO KELLER39
Soil Structure
Soil Organic Matter (SOM)soil biomass (live bugs)organic residues (decaying plant and microbial biomass)humic substances (high molecular weight organic macromolecules, very slow decay ~ 2%/yr)amino acids, organic acids, carbohydrates, fats
ESM 222 © ARTURO KELLER40
Soil Structure
Soil Organic MatterIn humid areas, SOM up
to 5% on a dry-weight basisIn arid areas, with low
inputs of plant residues, SOM typically < 1%Significant natural
recycling of nutrients via formation of SOM and its decomposition
ESM 222 © ARTURO KELLER41
Soil Structure - Biotic Activity
Factors Affecting Growth of Microbes
Biotic stress - competition (e.g. pathogens)Soil moistureTemperature and its fluctuations
important in bioremediation at higher latitudes
Soil pHSoil carbon, nitrogen and nutrientsSoil redox potential (i.e. aerobic or anaerobic conditions)
ESM 222 © ARTURO KELLER42
Structure of Water Bodies
Rivers and streamsHydraulic properties: flow, velocity, dispersionGeometric properties: depth, width, slopeProperties change frequently over the course of riverTemporal distribution of water flow: annual hydrographPerennial vs. ephemeral flow; baseflow

ESM 222 © ARTURO KELLER43
Structure of Water Bodies
Source: Surface Water Quality Modeling, Chapra, 1997 Source: Surface Water Quality Modeling, Chapra, 1997
ESM 222 © ARTURO KELLER45
Structure of Water Bodies
Human activities modify the hydrographs
Impoundments (dams)Urbanization and channelingWater use for irrigation or drinkingUse for hydropower or cooling water
Steady-flow model is an approximation with many exceptions
ESM 222 © ARTURO KELLER46
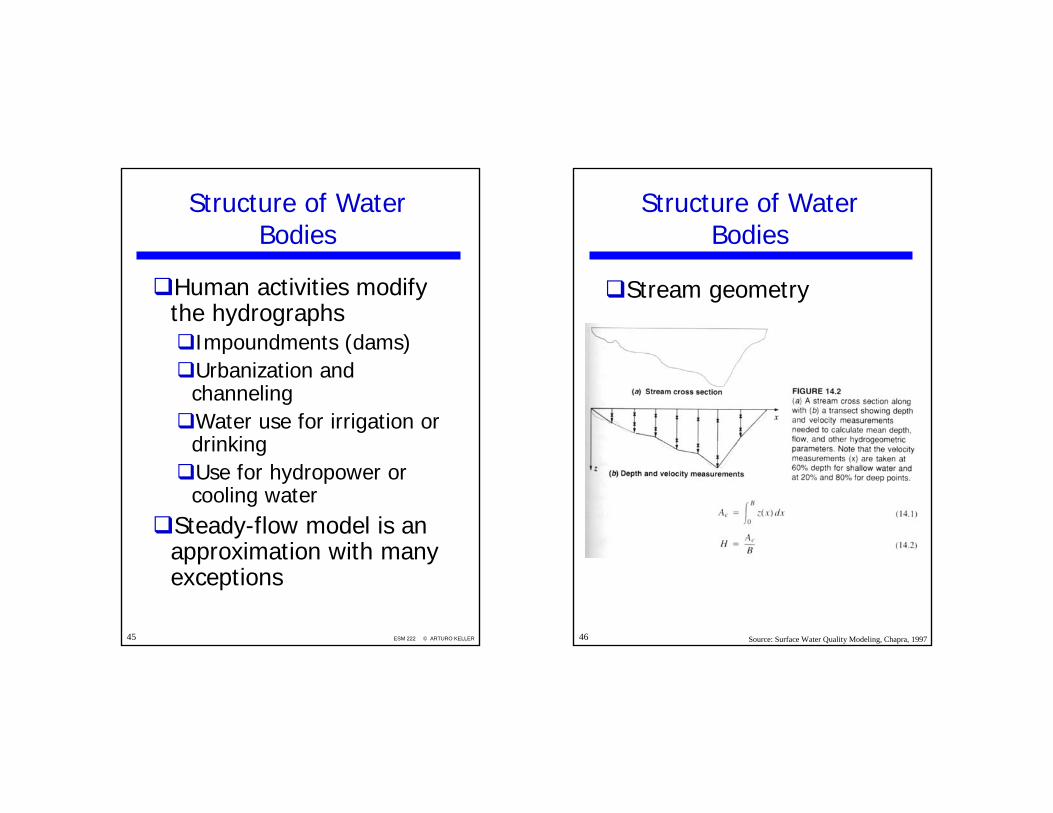
Structure of Water Bodies
Stream geometry
Source: Surface Water Quality Modeling, Chapra, 1997
ESM 222 © ARTURO KELLER47
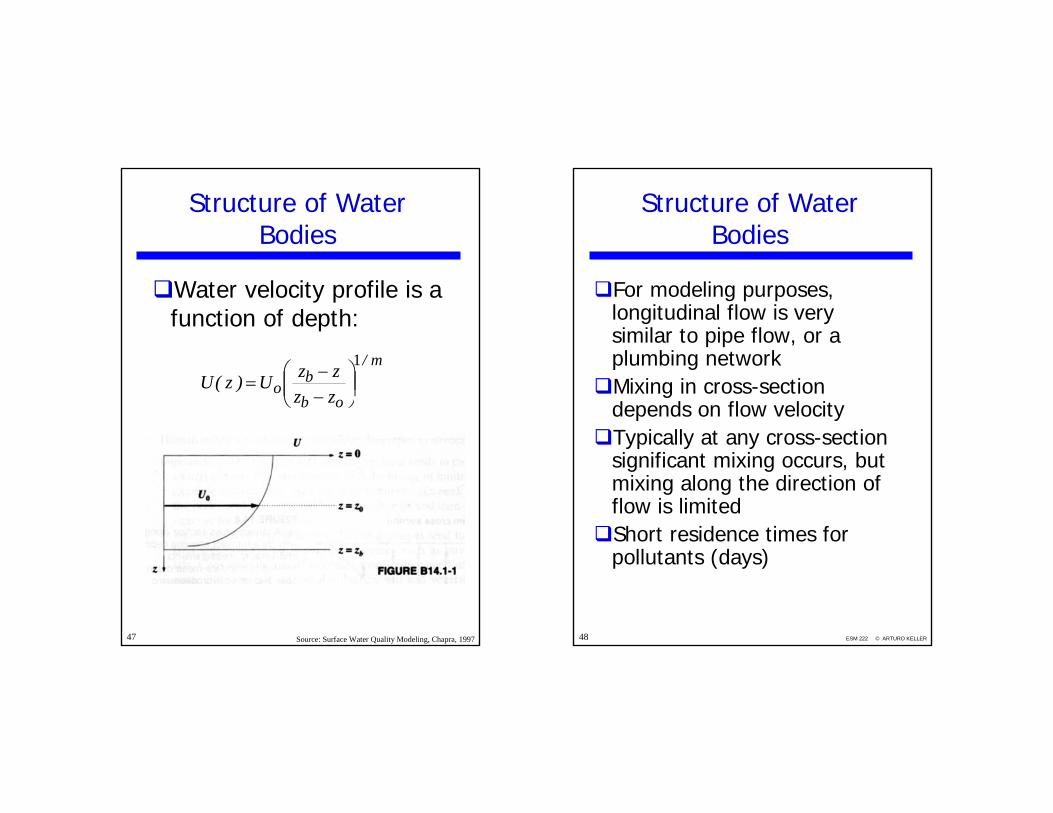
Structure of Water Bodies
Water velocity profile is a function of depth:
m/
obb
o zzzzU)z(U
1
⎟⎟⎠
⎞⎜⎜⎝
⎛−−=
Source: Surface Water Quality Modeling, Chapra, 1997 ESM 222 © ARTURO KELLER48
Structure of Water Bodies
For modeling purposes, longitudinal flow is very similar to pipe flow, or a plumbing networkMixing in cross-section depends on flow velocityTypically at any cross-section significant mixing occurs, but mixing along the direction of flow is limitedShort residence times for pollutants (days)

ESM 222 © ARTURO KELLER49
Structure of Water Bodies
Reach estimatesAssumption that width is less variable than depthEasier to measure width along riverDetermine flow at a point along riverMeasure travel time, t, using a tracer (dye)Mean velocity is U = x/tAverage cross-sectional area from velocity and flow rate, Ac = Q/UMean depth, H = Ac/B
Source: Surface Water Quality Modeling, Chapra, 1997 ESM 222 © ARTURO KELLER50
Structure of Water Bodies
Source: Surface Water Quality Modeling, Chapra, 1997

ESM 222 © ARTURO KELLER51
Structure of Water Bodies
Low-flow conditionsCommon design assumptionObtain a long-term flow recordExpress as a minimum 7-d average flow that would be expected to occur every 10 years7Q10 is based on probabilistic assumptions
Source: Surface Water Quality Modeling, Chapra, 1997
10% probability that flow will be 1.75 m3/s
ESM 222 © ARTURO KELLER52
Structure of Water Bodies
LakesVery different mixing behavior than in riversTypically long residence times (years)Light only penetrates 1-2 m, so photosynthetic activity limited to thin surface layerSeasonal variation in temperatures has a significant effect on mixing

ESM 222 © ARTURO KELLER53
Structure of Water Bodies
Major featuresOrigin: natural (lake) or artificial (impoundment)
impoundments typically have controlled outflow
Shape: Natural lakes tend to be more circular; impoundments (reservoirs) are more likely elongated or dendritic (flooded river valley)Size: defined based on residence time (1 yr.) and depth (7m)
ESM 222 © ARTURO KELLER54
Structure of Water Bodies
Source: Surface Water Quality Modeling, Chapra, 1997

ESM 222 © ARTURO KELLER55
Structure of Water Bodies
Lake morphometry (geometry)
Integrate cross-sectional area along depth to determine volume at a particular depth
Source: Surface Water Quality Modeling, Chapra, 1997 ESM 222 © ARTURO KELLER56
Structure of Water Bodies
Source: Surface Water Quality Modeling, Chapra, 1997
ESM 222 © ARTURO KELLER57
Structure of Water Bodies
For many reservoirs, Qoutis a function of depth HNo outflow may occur
until depth reaches a minimum valueQin depends on the
hydrograph(s) of the tributary, with some baseflow from groundwater recharge
ESM 222 © ARTURO KELLER58
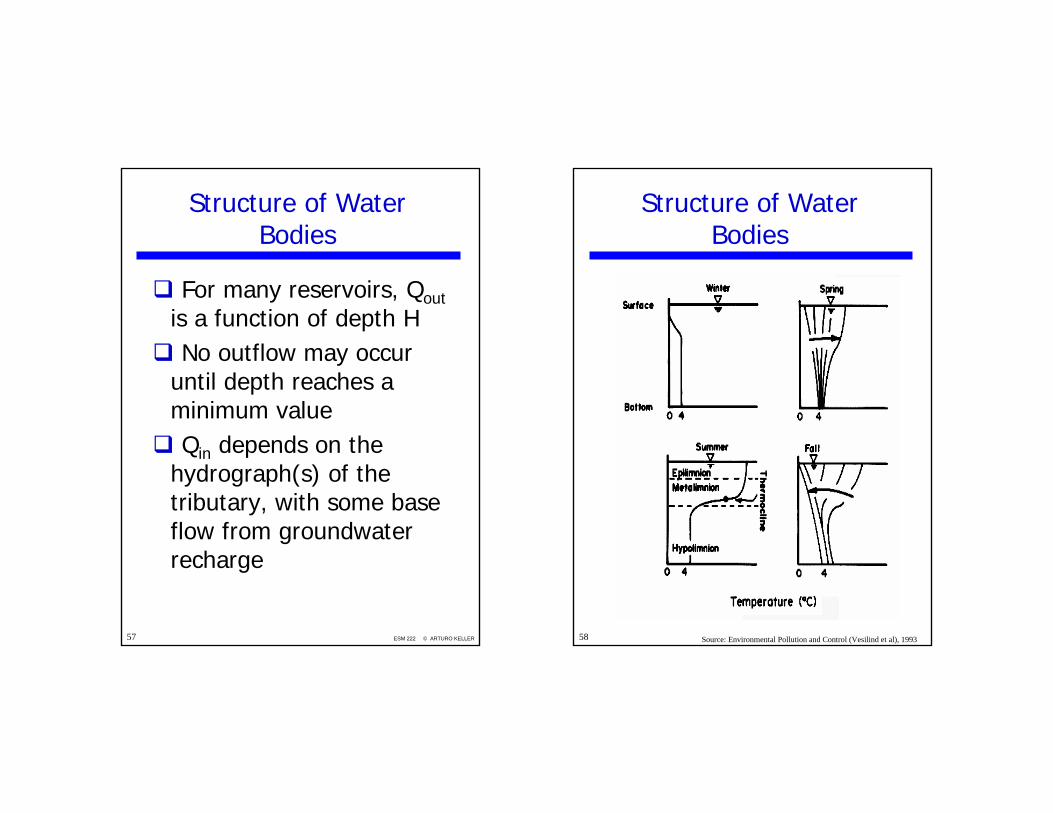
Structure of Water Bodies
Source: Environmental Pollution and Control (Vesilind et al), 1993
ESM 222 © ARTURO KELLER59
Structure of Water Bodies
Stratification may last several months with little mixing among layersBottom conditions may become anaerobicIf organic matter, nitrogen and/or phosphorus loading is large, even epilimnion may become anaerobic resulting in eutrophicationIn autumn, turnover of lake may result in the remobilization of pollutants
ESM 222 © ARTURO KELLER60
Structure of Water Bodies
MTBE study findingsWatercraft release up to 25% unburned gasoline with MTBEHigh concentrations only in surface layer (40-50 ppb)Bottom is below 5 ppbCan draw water from below but have problems with dissolved gases (H2S) from anaerobic degradation
ESM 222 © ARTURO KELLER61
Structure of Water Bodies
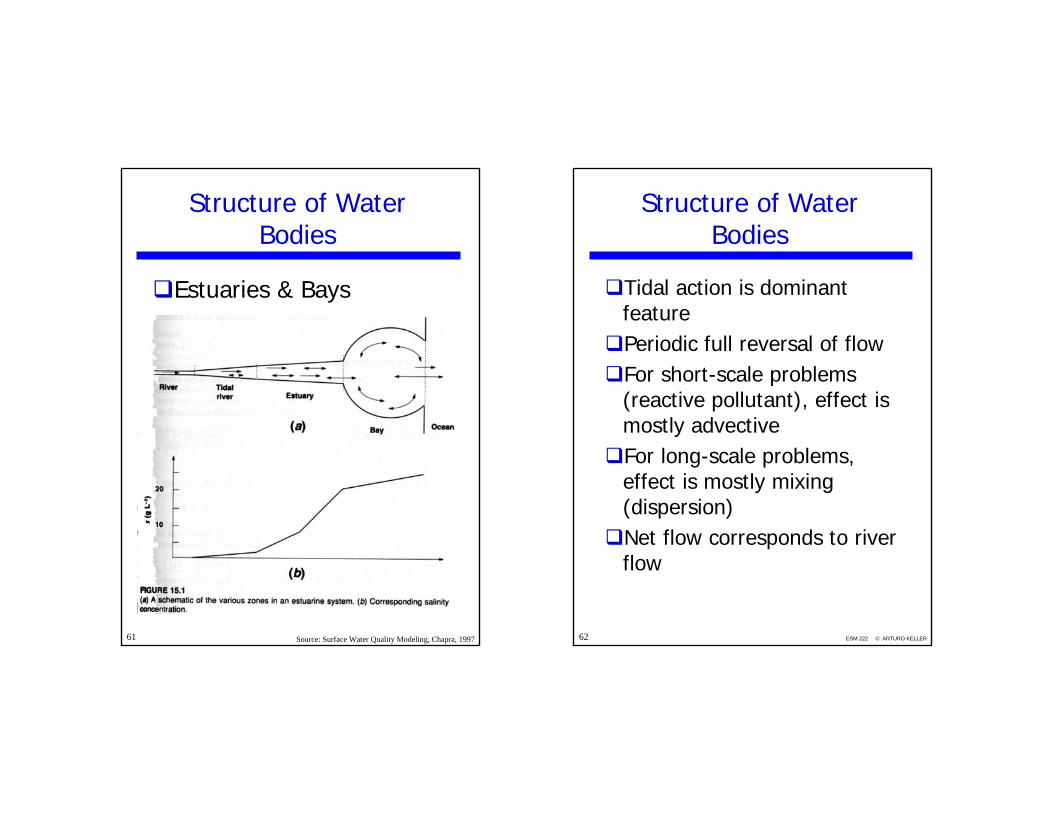
Estuaries & Bays
Source: Surface Water Quality Modeling, Chapra, 1997 ESM 222 © ARTURO KELLER62
Structure of Water Bodies
Tidal action is dominant featurePeriodic full reversal of flowFor short-scale problems (reactive pollutant), effect is mostly advectiveFor long-scale problems, effect is mostly mixing (dispersion)Net flow corresponds to river flow
ESM 222 © ARTURO KELLER63
Structure of Water Bodies
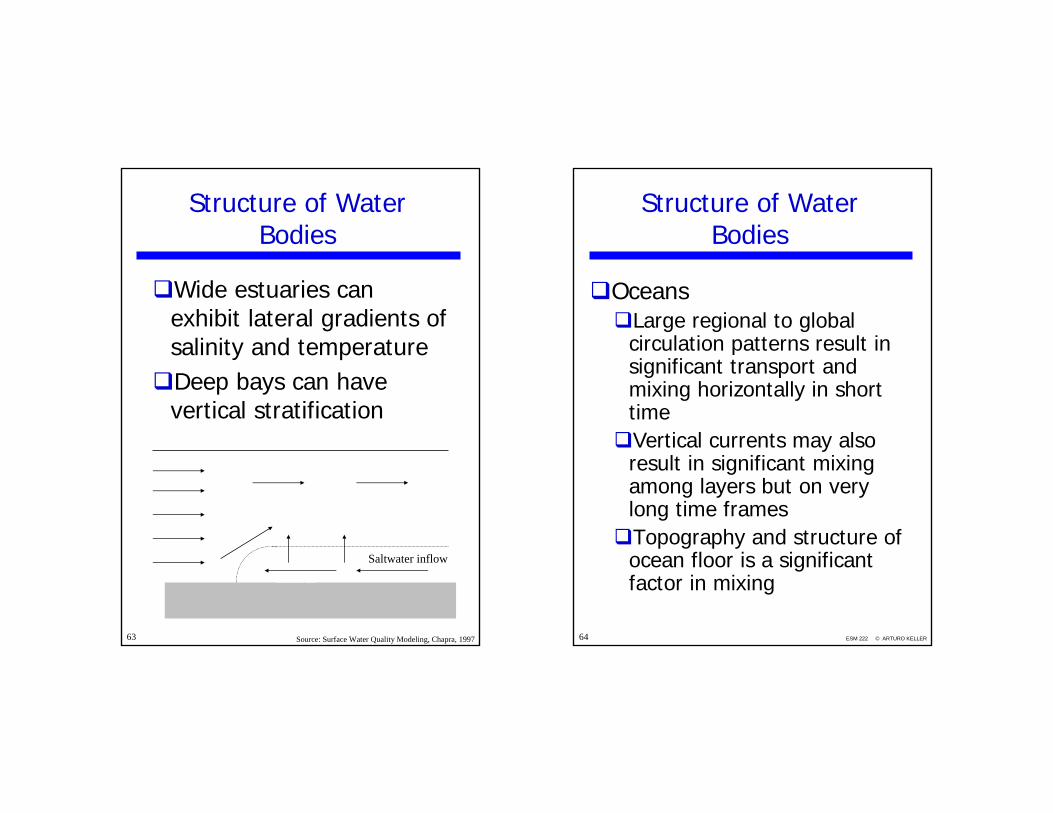
Wide estuaries can exhibit lateral gradients of salinity and temperatureDeep bays can have vertical stratification
Saltwater inflow
Source: Surface Water Quality Modeling, Chapra, 1997 ESM 222 © ARTURO KELLER64
Structure of Water Bodies
OceansLarge regional to global circulation patterns result in significant transport and mixing horizontally in short timeVertical currents may also result in significant mixing among layers but on very long time framesTopography and structure of ocean floor is a significant factor in mixing
ESM 222 © ARTURO KELLER65
Structure of Water Bodies
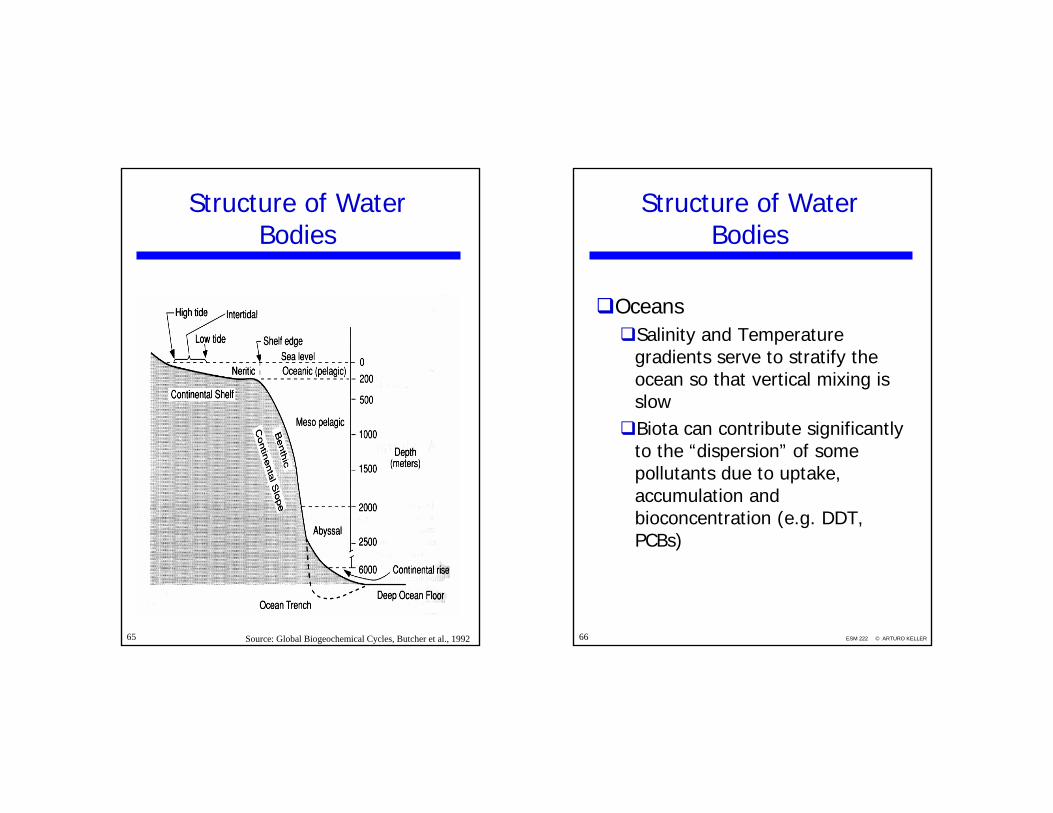
Source: Global Biogeochemical Cycles, Butcher et al., 1992 ESM 222 © ARTURO KELLER66
Structure of Water Bodies
OceansSalinity and Temperature gradients serve to stratify the ocean so that vertical mixing is slowBiota can contribute significantly to the “dispersion” of some pollutants due to uptake, accumulation and bioconcentration (e.g. DDT, PCBs)
ESM 222 © ARTURO KELLER67
Structure of Water Bodies
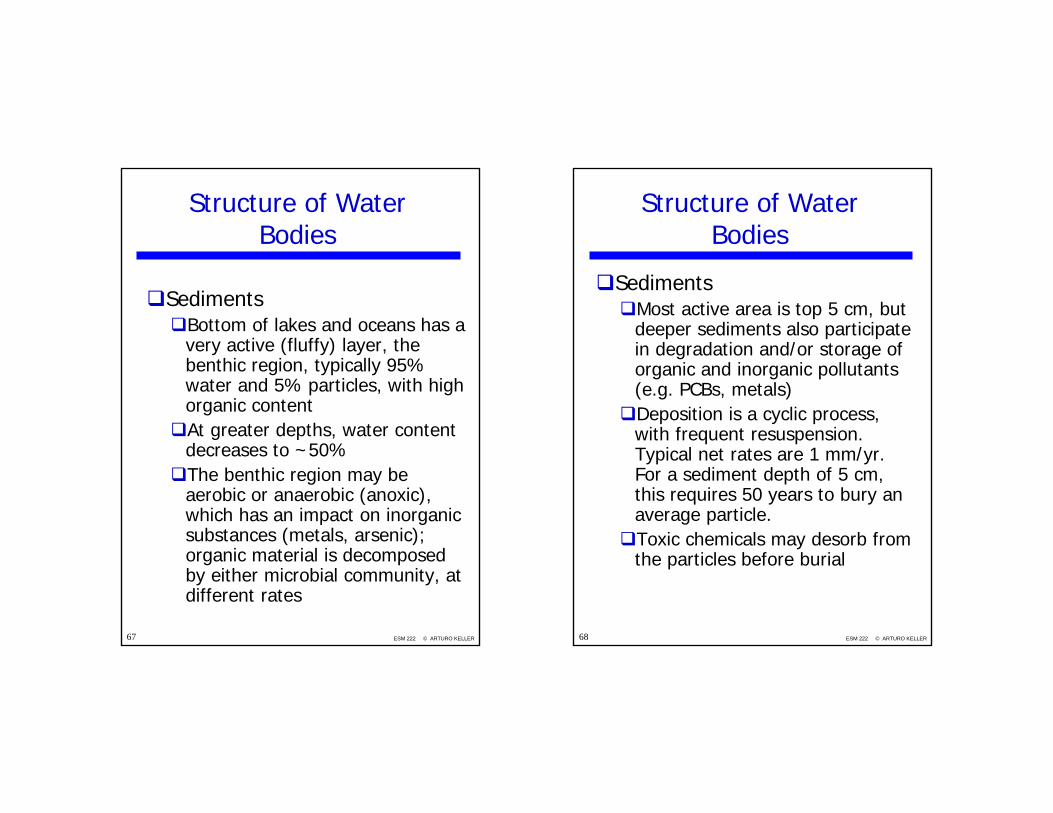
SedimentsBottom of lakes and oceans has a very active (fluffy) layer, the benthic region, typically 95% water and 5% particles, with high organic contentAt greater depths, water content decreases to ~50%The benthic region may be aerobic or anaerobic (anoxic), which has an impact on inorganic substances (metals, arsenic); organic material is decomposed by either microbial community, at different rates
ESM 222 © ARTURO KELLER68
Structure of Water Bodies
SedimentsMost active area is top 5 cm, but deeper sediments also participate in degradation and/or storage of organic and inorganic pollutants (e.g. PCBs, metals)Deposition is a cyclic process, with frequent resuspension. Typical net rates are 1 mm/yr. For a sediment depth of 5 cm, this requires 50 years to bury an average particle.Toxic chemicals may desorb from the particles before burial

ESM 222 © ARTURO KELLER69
Sediments
Particulate MatterChemicals may sorb into the particlesMay consist of mineral matter (silica, clay, carbonates)Usually contains decaying organic matter, which is usually lipophilic but may also contain some acidic portion (e.g. humic acids)Sometimes arbitrarily distinguish between particulate and “dissolved” using a mesh or filter of around 0.45 µm
ESM 222 © ARTURO KELLER70
Sediments
Particulate MatterTypically have about 7.5 g/m3 of particulate matter, with 33% organic matter (density ~ 1000 kg/m3) and 67% mineral (density ~ 2000 kg/m3) Deposition velocities vary significantly depending on water body and mixing conditions but typically range from 0.5 to 2 m/dayBiota (from plankton to fish and mammals) represent about 1 ppmv, with an average lipid (fat) content of ~ 5%

ESM 222 © ARTURO KELLER71
Sediments
Sediment transportOrganic solids may be lost during settling due to decompositionResidual organic particles and mineral solids are transported through the hydraulic systemDeposition zones form around low-energy regions: pools and inside of bendsWind and current turbulence can “focus” deposition
ESM 222 © ARTURO KELLER72
Sediments
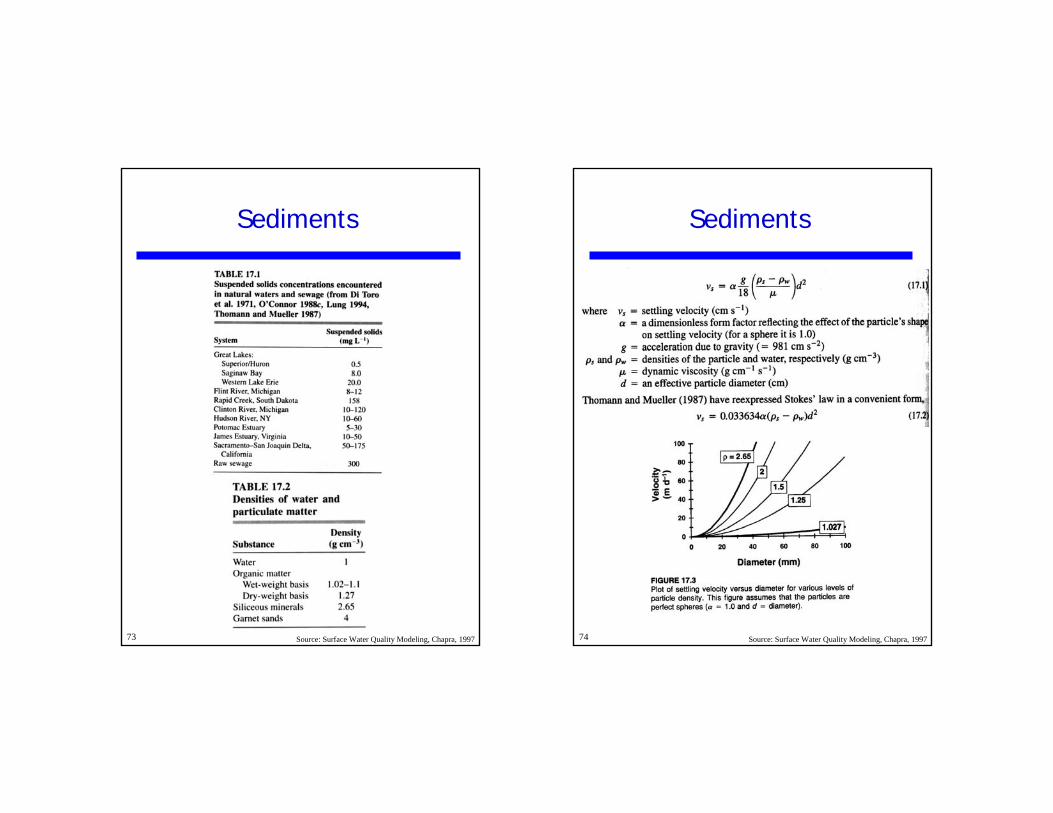
Source: Surface Water Quality Modeling, Chapra, 1997
ESM 222 © ARTURO KELLER73
Sediments
Source: Surface Water Quality Modeling, Chapra, 1997 ESM 222 © ARTURO KELLER74
Sediments
Source: Surface Water Quality Modeling, Chapra, 1997
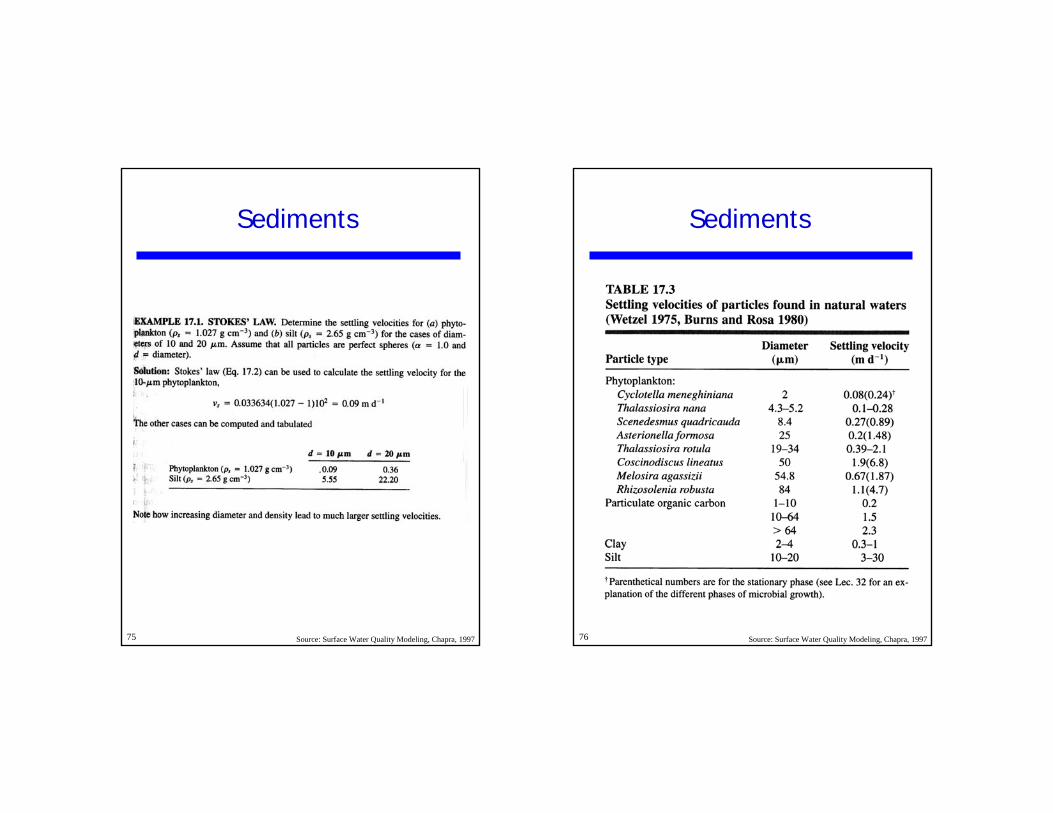
ESM 222 © ARTURO KELLER75
Sediments
Source: Surface Water Quality Modeling, Chapra, 1997 ESM 222 © ARTURO KELLER76
Sediments
Source: Surface Water Quality Modeling, Chapra, 1997
ESM 222 © ARTURO KELLER77
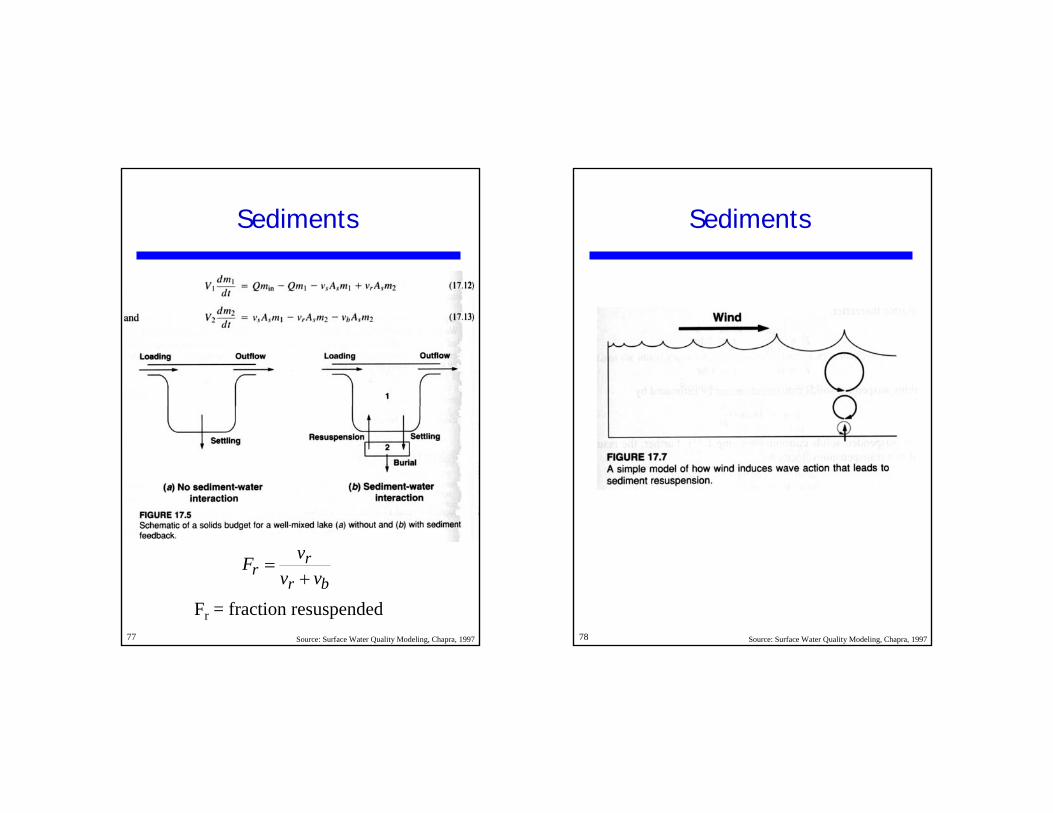
Sediments
brr
r vvvF+
=
Source: Surface Water Quality Modeling, Chapra, 1997
Fr = fraction resuspendedESM 222 © ARTURO KELLER78
Sediments
Source: Surface Water Quality Modeling, Chapra, 1997