atlas of caregiving, asa aia16
TRANSCRIPT

ASA Aging in America Conference!Caregiving 2.0: Innovative Directions in Data and Service Delivery!21 March 2016!
Rajiv [email protected]
650 823 3274
Spea
ker
Not
es
Hello! I am Rajiv Mehta, and I lead a project called Atlas of Caregiving. I am also on the board of the Family Caregiver Alliance, which is managing the effort. And the project is supported by a grant from the Robert Wood Johnson Foundation.
You may ask: What is an atlas of caregiving? Is it a collection of road maps for caregivers? Does it show the terrain of caregiving? As you’ll see, these metaphors fit pretty well.
Need: Much richer understanding of family caregiving!
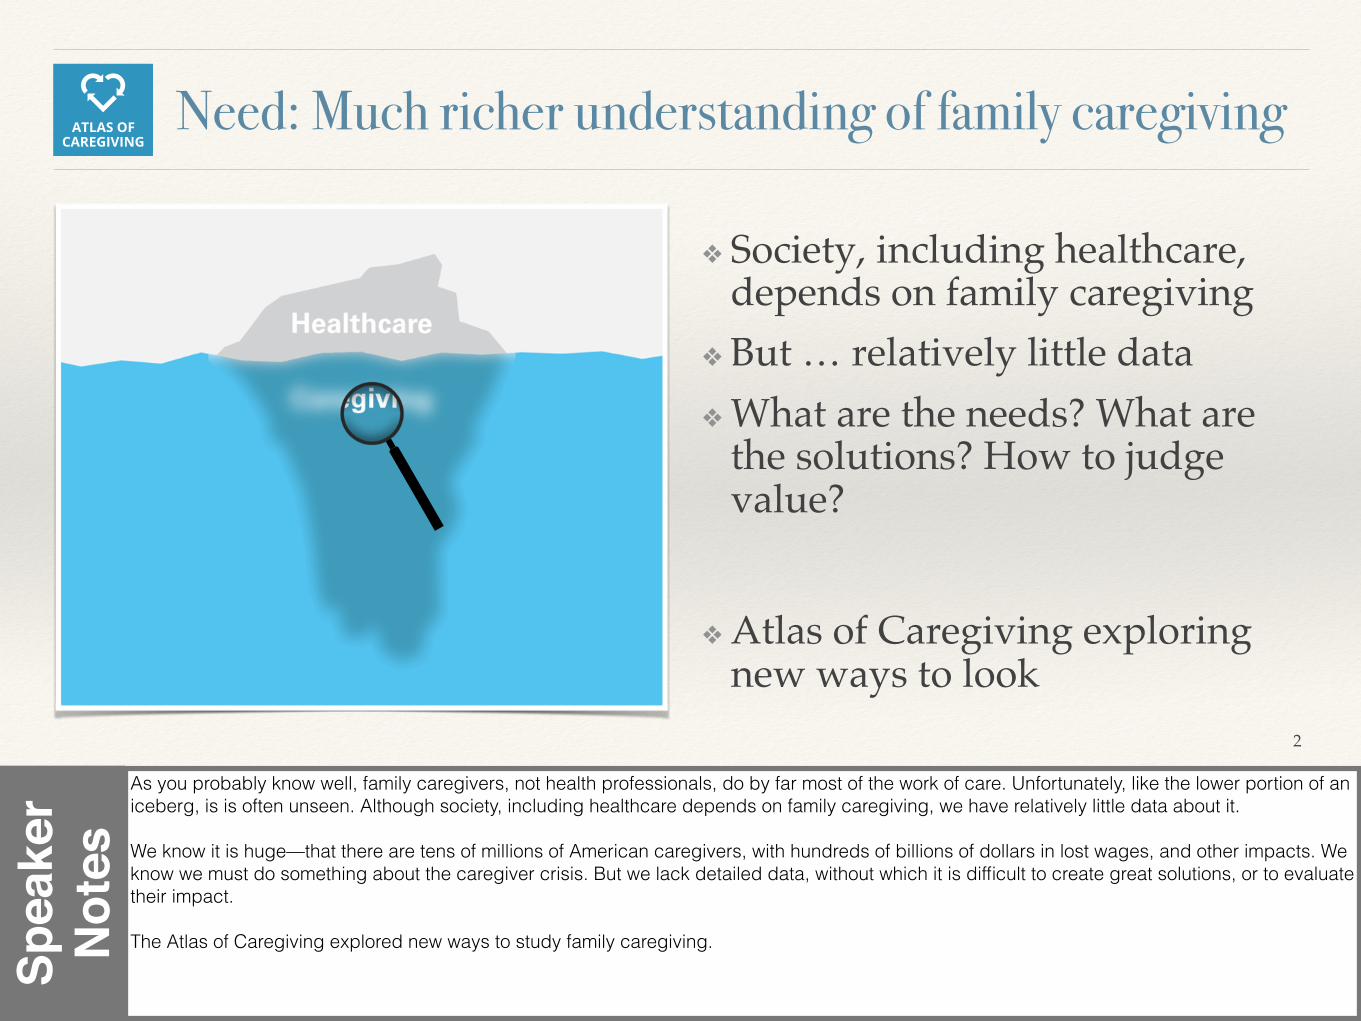
❖ Society, including healthcare, depends on family caregiving
❖ But … relatively little data❖ What are the needs? What are
the solutions? How to judge value?
❖ Atlas of Caregiving exploring new ways to look
2
As you probably know well, family caregivers, not health professionals, do by far most of the work of care. Unfortunately, like the lower portion of an iceberg, is is often unseen. Although society, including healthcare depends on family caregiving, we have relatively little data about it.
We know it is huge—that there are tens of millions of American caregivers, with hundreds of billions of dollars in lost wages, and other impacts. We know we must do something about the caregiver crisis. But we lack detailed data, without which it is difficult to create great solutions, or to evaluate their impact.
The Atlas of Caregiving explored new ways to study family caregiving.
Spea
ker
Not
es

Capture caregiving details!
❖ Actual lived experience of day-to-day family caregiving
❖ Who is involved? — Family, friends, professionals …
❖ What are they doing? — Caregiving & rest-of-life
❖ What is the impact? — Time, stress, physical demands, distraction, …
3
We wanted to understand the details of day-to-day caregiving: exactly Who is involved? What are the things they do, and how does it fit into the context of their lives? Ad what is the impact of all this effort?
Spea
ker
Not
es
“Atlas” aspirational; current effort a pilot!
❖ What can we learn by looking in new ways?
❖ Ethnography (interviews & self-reports)
❖ Wearable and environmental sensors
❖ New visualizations
❖ What can we learn about new ways of looking?
❖ Is this useful? Does it lead to new learning?
❖ How practical is this?
4
I should note that the idea of the Atlas is aspirational, that someday there might exist a rich compendium of information about family caregiving. For now this initial effort is a pilot, to learn how we could achieve the larger goal.
We are using a novel approach to studying family caregiving—combining traditional ethnography with new sensor technologies and new ways of visualizing the resulting data.
We are evaluating both what can we learn by using this new approach, and whether this new approach is useful and practical.
Spea
ker
Not
es
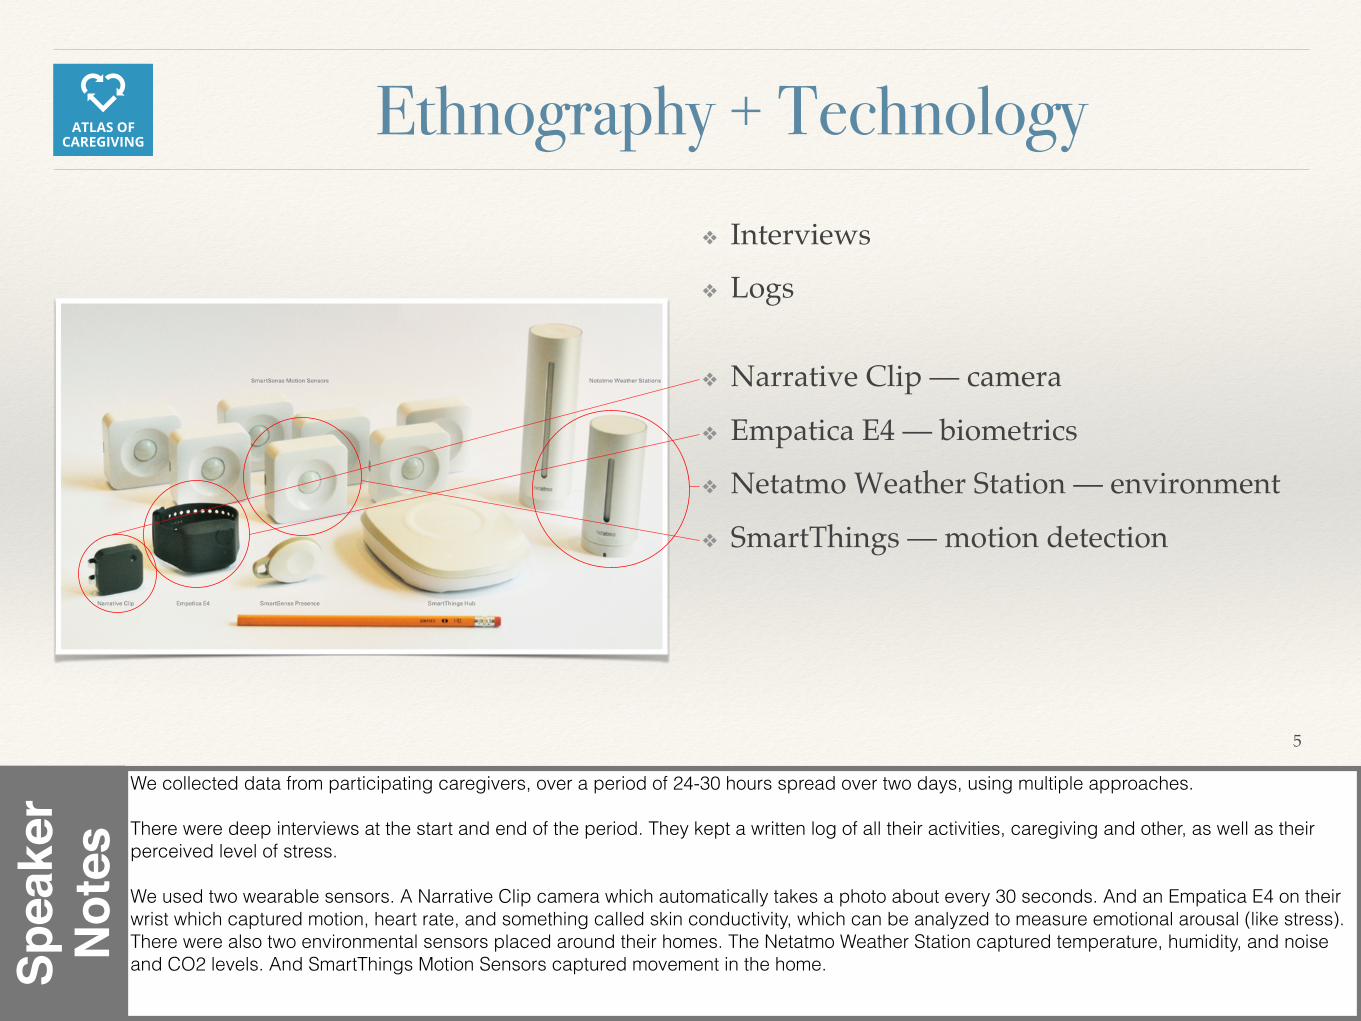
Ethnography + Technology!❖ Interviews
❖ Logs
❖ Narrative Clip — camera
❖ Empatica E4 — biometrics
❖ Netatmo Weather Station — environment
❖ SmartThings — motion detection
5
We collected data from participating caregivers, over a period of 24-30 hours spread over two days, using multiple approaches.
There were deep interviews at the start and end of the period. They kept a written log of all their activities, caregiving and other, as well as their perceived level of stress.
We used two wearable sensors. A Narrative Clip camera which automatically takes a photo about every 30 seconds. And an Empatica E4 on their wrist which captured motion, heart rate, and something called skin conductivity, which can be analyzed to measure emotional arousal (like stress). There were also two environmental sensors placed around their homes. The Netatmo Weather Station captured temperature, humidity, and noise and CO2 levels. And SmartThings Motion Sensors captured movement in the home.Sp
eake
r N
otes

Participants:14 families near San Francisco!❖ Caregiver ages 30–73; Care recipient ages 3–101
❖ Wide variety of health conditions
❖ Alzheimer's, autism, cancer, diabetes, epilepsy, Parkinson's, XYY, …
❖ Wide variety of family contexts
❖ Parents caring for young & adult children; spouses of many ages caring for each other; young & old adults caring for parents ...
❖ Isolated caregivers to Well-supported caregivers; Urban to Semi-rural; Well-off to Just-getting-by
6
We had 14 families, a total of 19 people, participate. They were a diverse group. Caregivers ranged in age from 30-73, and care recipients from 3-101. They had many different conditions; some had multiple issues. There was also great diversity in social and living conditions.
Spea
ker
Not
es

Example: Chantal cares for her mother!
7
Let me show you a little bit of what we learned from one of our families. Over the past six years, as her mother’s health has worsened, Chantal has devoted ever more of herself to caring for Debby. (These aren’t their actual names.) She has relocated her home, changed jobs, moved from full-time to part-time employment and eventually resigned, to do what must be done.
Debby has a wide range of diagnoses. Chantal named eighteen conditions, including dementia, hypertension, atrial fibrillation, fractures, and arthritis. She needs 24x7 care, and has been in-and-out of hospice care in the past year.
Spea
ker
Not
es

8
Care map!
This diagram shows Chantal’s care map, from information collected in the interviews. It shows all the key people involved in her situation. As you can see, the core group includes: Chantal who cares evenings and nights; Emily, a paid assistant, who covers days; and two of Chantal’s brothers who cover the gaps, about 2-3 hours each day.
Chantal herself gets emotional support from Emily, who has a lot of caregiving experience, her husband, online friends, and her dog—who is apparently brilliant at knowing who needs cuddling, and is very much a part of the caregiving team.
Such care maps have turned out to be a popular and powerful tool, and we have developed a method for people to draw their own using just paper and pencil. But that’s a story for another talk.Sp
eake
r N
otes

9
Activities!
This diagram was created by information in Chantal’s log, corrected and expanded by data from the Narrative Clip and Empatica E4. The bar chart on the left shows the amount of time she spent on different types of activities. The blue shows 6.5 hours of caregiving activities, with different colors (and heights) representing different levels of self-reported stress. Those care activities are further broken down on the right. You can see that in the roughly 24 hours of her participation, she also spent 1.6 hours on leisure (mainly a yoga class), 6 hours on sleep, and 4 hours on other activities. Obviously, as the numbers don’t add up to 24, there were many things not recorded.
Counting is a messy and inexact business. Many things overlap. And somethings are just hard to categories. For example, Chantal’s caregiving shift was 6 pm to 8 am, which is 14 hours during which she really couldn’t do much else. So should that count as 14 hours of caregiving? Granted there were times she was sleeping, or reading a book, but if she didn’t have to be there, perhaps she would spend her time differently.Sp
eake
r N
otes

10
24-hour view!9am–9am!
This diagram gives a better sense of how fragmented her day was. It shows all the logged activities from 9 am on the first day of participation, to 9 am on the second day. You can see Chantal’s caregiving shift starts at 6 pm, and that it was an eventful evening. Chantal noted in her log that is was her “worst day ever”. This was mainly an emotional response to slight changes — her mom needed helping brushing her teeth for the first time — but it drove home the reality of her mother’s ever-worsening situation. You can also see that Chantal’s 6-hours of sleep was interrupted as she got up to check on her mother.
Spea
ker
Not
es
11
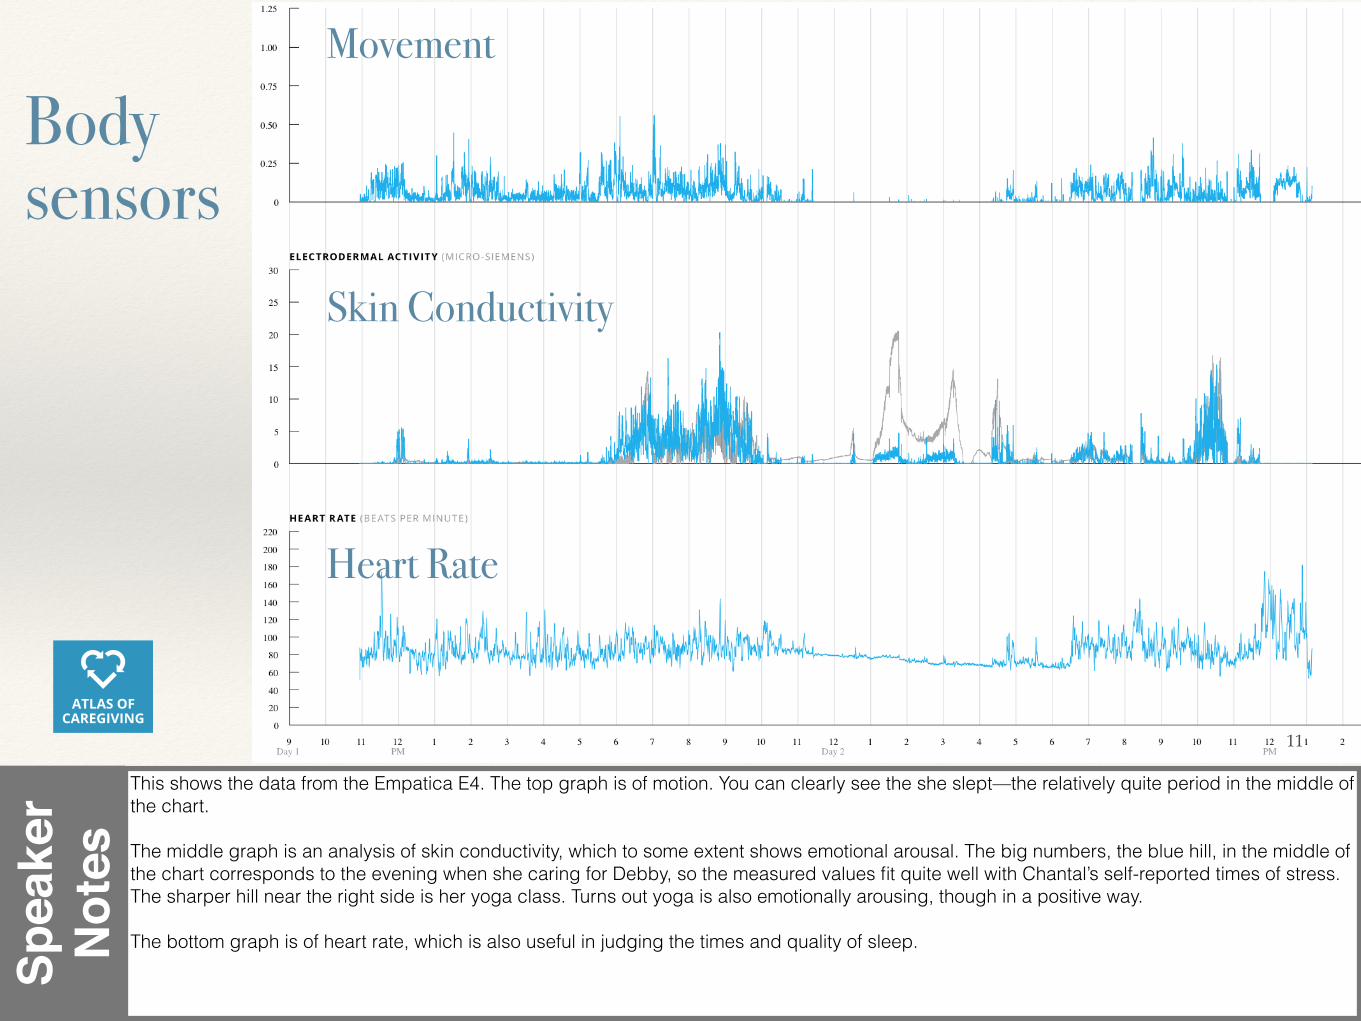
Body!sensors!
Movement!
Skin Conductivity!
Heart Rate!
This shows the data from the Empatica E4. The top graph is of motion. You can clearly see the she slept—the relatively quite period in the middle of the chart.
The middle graph is an analysis of skin conductivity, which to some extent shows emotional arousal. The big numbers, the blue hill, in the middle of the chart corresponds to the evening when she caring for Debby, so the measured values fit quite well with Chantal’s self-reported times of stress. The sharper hill near the right side is her yoga class. Turns out yoga is also emotionally arousing, though in a positive way.
The bottom graph is of heart rate, which is also useful in judging the times and quality of sleep.
Spea
ker
Not
es

12
Images!
These are a selection of images taken by the Narrative Clip. To you, and to us researchers, these may seem meaningless, mundane images. But to Chantal, they helped her remember more clearly what she was doing and feeling at those times. She told us of all the time she had spent that day organizing her mother’s health records and updating her health history. This is something she does every so often, to have it handy when some new doctor needs to know.
Spea
ker
Not
es

More case studies online!!
AtlasOfCaregiving.com/studies!
You can go online to see Chantal story and diagrams in more detail. As I mentioned there were 14 families, and so there will be 14 case studies. A few are already online, and the rest will be posted over the next few weeks.
Spea
ker
Not
es

Findings: Methods!❖ Value of approach confirmed
❖ New data, new insights … not possible with traditional approach
❖ Combination of methods (ethnography + sensors + visualizations) much more than sum-of-the-parts
❖ Improvements
❖ Very labor-intensive ! more technology for data processing and analysis
❖ Improved visualizations possible
❖ Rapidly improving sensor technology bodes well for future efforts
14
So, what have we learned from all this?
First of all is that this new, multi-modal approach to caregiving gives us great new data & insights, that are simply not possible using traditional techniques like surveys and focus groups. Also, though each individual tool was more or less useful, it was the combination that was powerful.
On the other hand, what we did was an enormous amount of work. To make this practical, so that we can study many more families and so others can do similar work, we are going to have to invest in more technology for data processing and analysis. At the same time, we are very optimistic as there are significant opportunities for improvement in both the sensing technologies and the visualizations we create.
Spea
ker
Not
es

Findings: Family caregiving!
❖ Participants found value, and satisfaction, in self-learning
❖ Caregivers not fully aware of the extent of their caregiving activities
❖ Almost always more people involved, sometimes a lot of people
❖ Complex choreography plus contextual knowledge make respite difficult
15
The pilot was small, and so we weren’t expecting to be able to make brand statements about tens of millions of caregivers. And yet, combining our findings with the team’s deep background allows us to make some statements with confidence. I’m going to cover these briefly. You can read our report for much more depth.
• A key point is that caregivers themselves would benefit from learning about themselves. Most of our caregivers were surprised by what they saw in their own data. One person thought she’d spend 2 hours on self-care; it turned out to be 6. Another realized that she did not need to feel guilty about being tired! • This is because they are so busy doing the doing to be fully aware of all that goes on. • Though we often speak of the caregiver and the care recipient, there are almost always more people involved, like in the care map you saw. • And, as desperately as people need respite, providing it in a way that actually makes people’s lives better is not easy. Whoever steps in has to have a deep appreciation of the situation and people. Long relationships are really important.Sp
eake
r N
otes

Findings: Family caregiving (cont.)!
❖ Caregiving involves constant change, sometimes dramatic
❖ Defining the caregiving experience by disease / condition / age is myopic
❖ Caregivers often too overwhelmed to avail themselves of potential assistance
❖ Caregiver stress involves more than just stress events
16
• Even within the small window of time that we looked into these people’s lives, things changed, sometimes dramatically. • People with the same conditions had very different experiences. We had several families dealing with dementia, and also several dealing with Autism-Aspergers. The situations and needs varied significantly. We also had families with very different diagnoses, demographics and social conditions, who nevertheless were dealing with the same issues. • Caregivers are often so overwhelmed, that asking them to research, obtain, learn to use, evaluate, and debug potential solutions may be asking the impossible. • Finally, stress is much more complex that just difficult tasks like home IV treatments and incontinence assistance. Simply counting the hours spent on caregiving, or judging the severity of illness, is not a good proxy for stress.
Spea
ker
Not
es
Implications for all those involved!
❖ Family caregivers (themselves)
❖ Product developers / entrepreneurs
❖ Caregiver support organizations
❖ Employers
17
❖ Healthcare professionals and institutions
❖ Policy makers
❖ Researchers
❖ Foundations
These finding have significant implications for family caregivers themselves, and for all those who are trying to making family caregiving both easier and more effective. I’m only mentioning this for now; you can read the details in the report.
Spea
ker
Not
es
AtlasOfCaregiving.com
Thank you! Rajiv [email protected]
+1 650 823 3274
As I said , we will be publishing all our case studies, as well as details on the methodology, findings and implications. You’ll find this information on our website (atlasofcaregiving.com), and we plan on publishing the final report by the end of April. You can also go on the website to leave us your name and email if you would like to be notified when we publish.
Thank you. I look forward to your questions and comments.
Spea
ker
Not
es