atlantic well folio: georges bank basin
TRANSCRIPT

BOEM 2016-025
Atlantic Well Folio: Georges Bank Basin
Lydonia Canyon Block 187 No. 1 Well
Dominic Smith Paul J. Post
U.S. Department of the Interior Bureau of Ocean Energy Management Gulf of Mexico OCS Region Office of Resource Evaluation

Georges Bank Basin: LC 187‐1 Page 1 of 19
1.5 . Lydonia Canyon 187-1
Figure 1. Location map of Georges Bank Basin (GBB), offshore Massachusetts, USA. Well locations are indicated by the symbol . Leases previously held in the area are shown in yellow.
Georges Bank Basin: LC 187‐1 Page 2 of 19
Tenneco, operator of OCS-A 0182, Lydonia Canyon (LC) 187, drilled new field wildcat well LC 187-1 to a total depth (TD) of 18,127’ to test a combination structural-stratigraphic trap. According to the Application for Permit to Drill (APD) filed by Tenneco (Tenneco, 1982a), hydrocarbons were expected from 9,800’ to 15,000’, with only gas anticipated below 15,000’. (All depths in this report are measured depth unless otherwise specified.) The well was unsuccessful because anticipated reservoir intervals lacked porosity and permeability, and predicted source rock intervals were ineffective due to insufficient total organic carbon (TOC) content. This was the 5th industry well in the Georges Bank Basin (GBB) and the 7th overall including two Continental Offshore Stratigraphic Test (COST) wells.
The decision to lease the block and subsequently drill LC 187-1 was based on good quality 2-D seismic coverage in this part of the GBB, and the improved understanding derived from COST G-1 (1976) and G-2 (1977) wells. Block LC 187 was leased during Sale No. 42 on December 18, 1979 for a bonus bid of $15,819,000 (MMS Staff, 1985) or $54,867,000 in 2015 dollars (HBrothers, 2015). The selected drillsite was the primary one of four initially proposed in the APD for block 187 (Tenneco 1982a).
LC 187-1 was located on dip-oriented seismic line D 133 near a crossing strike-oriented line. The well was spudded on March 12, 1982 by the Alaskan Star semisubmersible and completed on August 21, 1982. The location was in 307’ of water about 8 miles to the southeast of COST G-2 (Fig. 1), ~215 miles east-southeast of Boston, MA at latitude 40° 46' 15" N, longitude 67° 23' 19" W. Two other new field wildcat wells (LC 145-1 and LC 273-1) were subsequently drilled in the area during 1982. Following the LC 187-1 dry hole, the
lease was relinquished on January 28, 1985 (Edson et al., 2000). 1.5.1 Objectives and Concepts
According to the APD, LC 187-1 targeted a faulted anticline with primary objectives (~9,800’– ~17,000’?) being porous, Jurassic age, high-energy, oolitic calcarenite limestones (Table 1, and Fig. 2) and carbonates with porosity enhanced by dolomitization (Tenneco, 1982a). Underlying secondary objectives to the proposed total depth of 21,000’ were believed to be carbonates whose porosity was enhanced with secondary dolomitization. These objective strata were interpreted to have been deposited in, and affected by, a shallow paleobathymetric environment (Tenneco, 1982a).
Seismic interpretation from the APD (Tenneco, 1982a) showed a high-angle, reverse-faulted, structure (Fig. 3) with significant offset interpreted at their deepest Lower Jurassic Unconformity horizon that decreased upward (Fig. 4). The Minerals Management Service (MMS) interpretation was a three-way closure with the faulting not extending into the shallower targeted zones.
The pre-sale MMS resource estimates for the tract were 4,251,454 barrels (bbls) of oil and condensate with 33,332.5 million cubic feet (MMCF) of gas and associated gas. Total BOE was estimated at 10,182,510 (MMS Staff, 1985). 1.5.2 Results Drilling
Carbonates were the dominant rock type below 9700’. However, the anticipated reservoirs were found to be cryptocrystalline micrites (wackestones and packstones) with very low porosity and permeability of Middle and Late Jurassic age.

Georges Bank Basin: LC 187‐1 Page 3 of 19
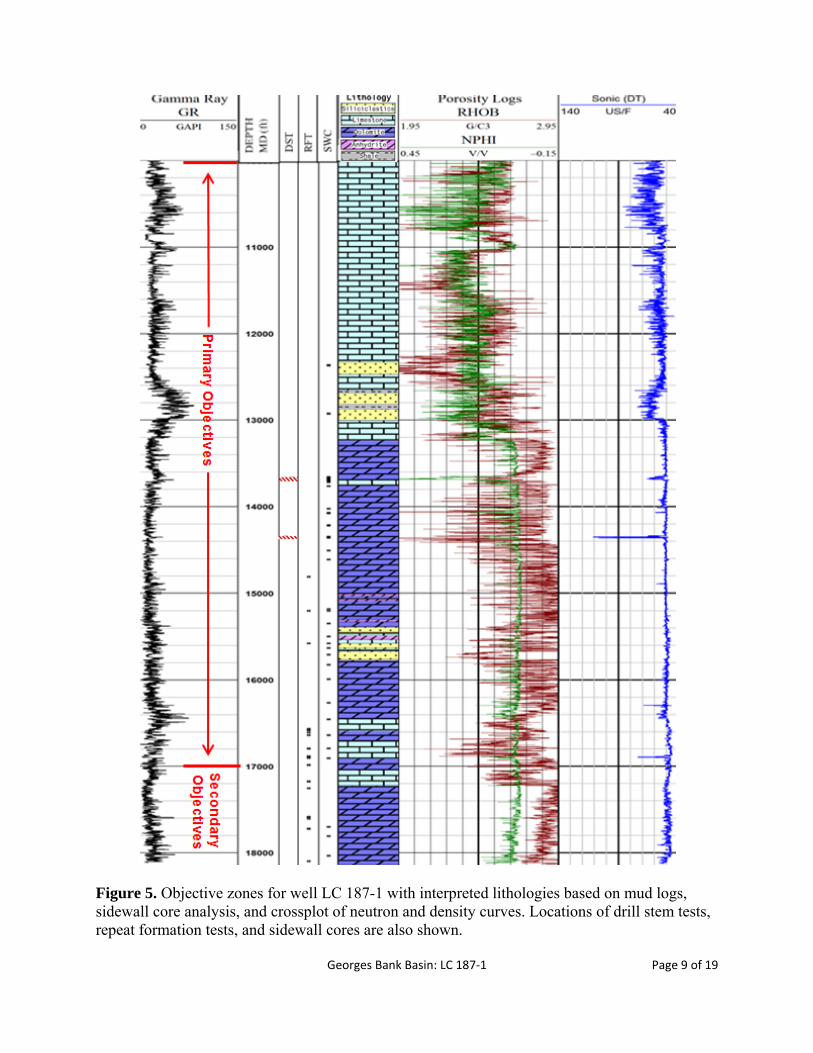
Mud logs, wireline logs, and sidewall cores were used to construct Figure 5. Dolomite rather than limestone is the primary lithology from ~13,230’(Fig. 5), just above the interpreted base of the Bathonian, to TD with some interbeded limestone, sandstone, siltsone and anhydrite. Several zones of interest, identified by modest natural gas shows were encountered while drilling through the target zones. The best mud log gas shows were from 9,277’–9,287’ (118 units), 13,640’–13,660’ (650 units), 14,310’–14,325’ (950 units), and 14,340–14,370’ (950 units). The shallowest show was in Late Jurassic carbonates. The other gas shows were in Middle Jurassic carbonates. Cased hole drill stem tests (DSTs); 13,650’–13,660’, 13,664’–13,686’, and 14,338’–14,355’ were preformed following perforating and acidizing,with no hydrocarbon recovery per the Tenneco Well Completion Report (Tenneco 1982b). Sixty-five sidewall cores were recovered from 9,020’–18,020’ ranging from 0.2 to 1.4 inches (Core Laboratories Inc., 1982). These provided porosity and permeability data for comparison with the log curve calculations, and because of their precise locations, supplemented lithology descriptions from the aggragated cuttings. Seismic Interpretation
Tenneco submitted two pre-drill, 2-D time-migrated seismic lines with their APD (Tenneco, 1982a). Figure 4 shows line D 133 through the proposed LC 187-1 well, with their interpretation. A nearly perpendicular cross-line (GB 75-53), ~3,700’ southeast of the proposed location, was also interpreted and submitted (Tenneco, 1982a). Tenneco staff interpreted a reverse fault on the western flank of an anticlinal structure creating a fault trap on the western flank of the feature at their Lower Jurassic Marker and Lower Jurassic
Unconformity horizons (Figs. 3 and 4). The tested trap was on the flank of the anticline at the shallowest of the interpreted objective horizons, the Top Middle Jurassic (Fig. 3).
Our post-drill seismic interpretation used reprocessed time-migrated, depth-converted data licensed from GeoSpec, a CGG company. The 8 sequence boundaries (SBs) in our interpretation were originally identified and interpreted by GeoSpec, using the two COST wells, and 5 industry wells including 187-1 as part of their seismic interpretation of the U.S. Atlantic OCS (GeoSpec, 2003). The structure (Fig. 6) is interpreted to be inversion-related, caused by transpression/compression reactivation of basin-bounding faults during seafloor spreading of this part of the Atlantic (Withjack et al., 2012). These faults are interpreted as high-angle, cutting across our “base mid-Jurassic” (SB1), and uplifting the lower SBs. Uplift diminishes throughout the Jurassic with a small, but still visible, effect in the Cretaceous SBs. Overlying Tertiary sediments are interpreted as flat and unaffected (Fig. 6). The inversion structure is interpreted to be almost 12 miles long and ~9 miles wide at SB1.
A fracture system, possibly connected to a deep, basin margin fault system may have been intersected by the well. Between ~16,855’–16,885’, two drilling breaks, each of which reached a maximum of 70’ per hour, were encountered with an associated CO2 influx and a 25 barrel pit gain (Exlog Inc., 1982). No geochemical data exists to determine the organic or inorganic origin of this CO2 influx. Fitrianto et al., (2012) analyzed the origin, distribution, and prediction of CO2 occurrences in South Sumatra and noted an association between CO2 concentration and deep-penetrating faults in the Jabung block of South Sumatra, supporting an inorganic origin for the CO2.
Georges Bank Basin: LC 187‐1 Page 4 of 19
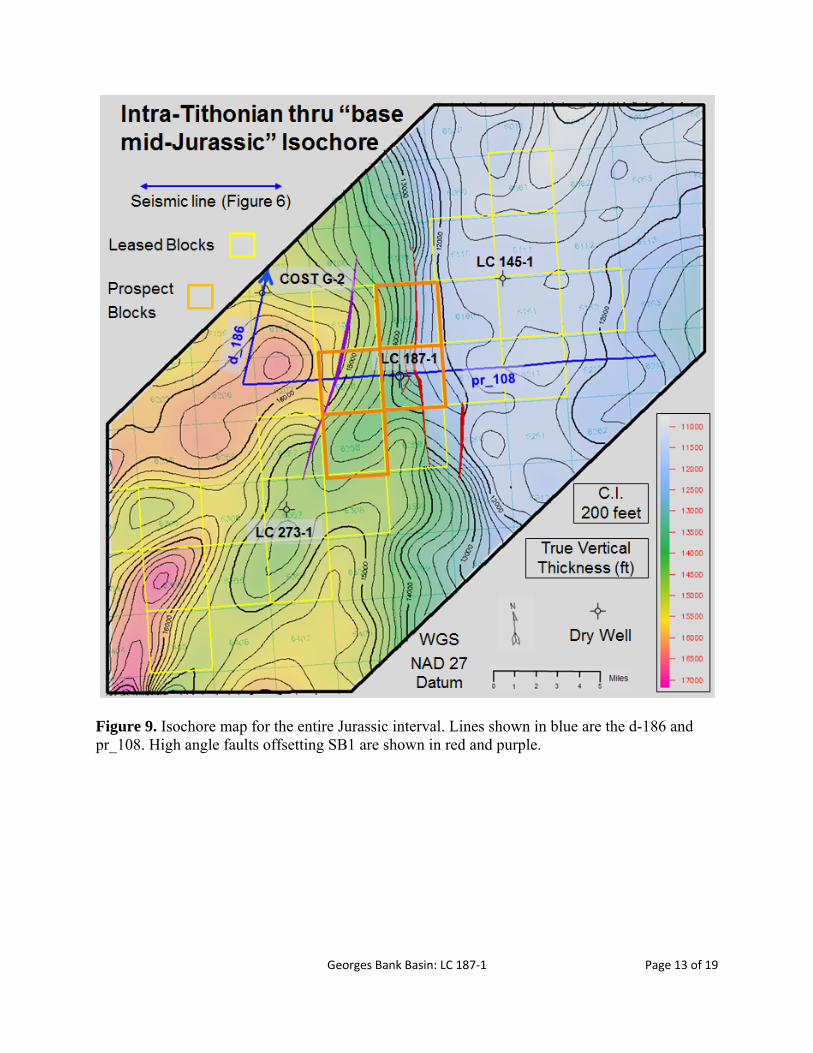
Our mapping (Figs. 7 and 8) failed to support Tenneco’s pre-drill four-way closure (Fig. 3). Structure maps of the base Oxfordian (SB3) and base Bathonian (SB2), Figures 7 and 8 respectively, depict our interpretation of the southwest plunging inversion structure. A Jurassic isochore map (Fig. 9) between an upper horizon, the intra-Tithonian (SB4), and a lower horizon, the “base mid-Jurassic” (SB1), illustrates this structure plunging into the main depocenter. The depocenter-bounding faults are shown on this map, with the large offset of the main fault visible east of the LC 187-1 in true vertical thickness (TVT) contouring.
Subsequently, LC 145-1 was drilled updip and upthrown to the “base mid-Jurassic” faulting, and LC 273-1 was drilled downdip along the same southwest plunging structural trend as LC 187-1 (Figs. 7, 8, and 9). Biostratigraphy and Paleoenvironment Robertson Research conducted biostratigraphical analysis for Tenneco using microfaunas, nannofossils, and palynomorphs on cutting samples from 1,340’ to TD. Only 3 of the 65 sidewall cores (9,520’, 9,524, and 15,340’) had enough material for nannoplankton and palynological analyses. From the fossil taxa (Table 2), they determined depths for the interpreted geologic ages, environment of deposition (EOD), and paleobathymetry (Robertson Research, 1982).
Fossils from the Mesozoic section appear to be reworked, being oxidized and displaying many disconformities. Cavings from uphole, along with fewer dateable microfossils in the shallow water paleoenvironments, tempered confidence in some age estimates (Robertson Research, 1982). Paleoenvironments transgressed from marginal marine and inner shelf in the Jurassic and Early Cretaceous to deep middle neritic during the Late Cretaceous.
Water depths during the Late Cretaceous were generally comparable to the present-day 307’ depth. Pre-drill, Tenneco staff (Tenneco Oil Company, 1982a) inferred the shallowest of the Jurassic carbonate objectives were deposited in shallow water environments. Deeper objectives were “basinal carbonates” (Tenneco Oil Company, 1982a). We interpret the EOD from ~13,000’ to TD as marginal marine to transitional supratidal, sabkha (Friedman, 1980) based on the occurrence of dolomite and anhydrite throughout this section. Table 3 summarizes our biostratigraphic interpretation. 1.5.3 Operations and Costs
Block 187 was awarded at OCS Sale No. 42 in December 1979 for a high bid of $15,819,000. Valued at $54,867,000 in 2015 dollars (HBrothers, 2015), the interests were Mobil Oil Corp. 30%, Union Oil Co. of California 25%, Tenneco Oil Co. 20%, Amerada Hess Corp. 15%, and Transco Exploration Co. 10% (Tenneco Oil Company, 1980). Total well cost was $25 million ($62,500,000 in 2015 dollars) according to an MMS report citing the September 1982 issue of the AAPG Explorer. Prospect 187 ($15,819,000) also included blocks 143 ($13,758,000), 186 ($3,729,000), and 230 ($28,111,000) for a total prospect lease cost of $61,417,000 or $213,020,000 in 2015 dollars (HBrothers, 2015). 1.5.4 Petroleum System Analysis
Magoon and Dow (1994) defined a petroleum system as “a natural system that encompasses a pod of active source rock and all related oil and gas and which includes all the geologic elements and processes that are essential if a hydrocarbon accumulation is to exist.” Petroleum includes thermal or
Georges Bank Basin: LC 187‐1 Page 5 of 19
biogenic gas … or condensates, crude oils, and asphalts found in nature (Magoon and Dow, 1994).
Petroleum system elements are: source rock, reservoir rock, seal rock, and overburden rock (a thick enough rock column above the source rock interval to result in burial sufficient for temperatures to trigger hydrocarbon generation). Our guidelines for source, reservoir, and seal elements are shown in italics in Table 4. Petroleum system processes include trap formation and hydrocarbon generation-expulsion-migration-accumulation (Table 5), and preservation (modified after Magoon and Dow, 1994). Timing is paramount in petroleum systems; e.g., a reservoir in a sealed trap must exist when hydrocarbons are generated, expelled from the source rock, migrate into the trap, become entrapped and retained in the trap (Magoon and Dow, 1994). Not all processes will occur in all areas; i.e., when there is no hydrocarbon generation and expulsion, there can be no migration or accumulation. Geochemistry
A full suite of geochemical analyses for LC 187-1 was lacking; e.g., Rock-Eval Pyrolysis was not run. Therefore, Tmax, S1, S2, HI, and OI data were not available. However, TOC values were recorded for 85 samples, and vitrinite reflectance (%Ro) was measured for 54 samples.
%Ro is used as an indicator of thermal maturity to determine the maximum maturity level reached by vitrinite macerals in the well (U.S. Dept of Interior BLM, 2015). %Ro data, along with bottomhole temperatures (BHTs) were used in the maturity models created in BasinMod® 2012. Modeling of LC 187-1 showed early mature oil (0.5% Ro) occurred early in the development of the basin, during the Late Jurassic. Consequentially, much of the
sedimentary section mature today has been for a majority of the basin’s history. High %Ro values, which occur in the more siliciclastic-rich parts of the well, are interpreted to be reworked, recycled vitrinite derived from older sediments being eroded and redeposited in the basin. Best fit to the data results show present-day onset hydrocarbon generation in the Late Jurassic Tithonian.
Of the 86 TOC values, 70% were below 0.5% with an average of 0.42%, and only 4 were ≥1% (2 in the Callovian, 1 in the Aptian, and 1 in the Hauterivian) (Tenneco Oil Company, 1983). TOC values between 1% and 2% are typically classified as indicating good source rocks capable of having hydrocarbons expelled from them. However, wells in the GBB have shown that although hydrocarbons can be generated from a source rock with a 1% or less TOC, they are unlikely to be expelled. Modeling in BasinMod® 2012 predicts minor generation of hydrocarbons in the Jurassic from mature source rocks with initial TOC values ≥1%. The modeling accurately predicted that none of these hydrocarbons would be expelled, in agreement with the LC 187-1 well results. Table 6 cites these deficiencies in the post-drill results section.
Without pyrolysis, identification of kerogen type was limited to visual examination as reported by the MMS in Mr. Fry’s report (MMS Staff, 1985). Inert, Type IV, non-source kerogen was reported present throughout most of the well in percentages ranging from 20% in the Cretaceous, and reaching 80% in the Jurassic from 11,417’ down to TD. The oil-prone, Type I kerogens, contributed a smaller portion in the Cretaceous (~17%) and were not seen in the Jurassic. Type II (oil-prone) and Type III (gas-prone) kerogens made up about half of the organic matter from the Late Cretaceous until the Early Jurassic section of the well (MMS Staff, 1985).

Georges Bank Basin: LC 187‐1 Page 6 of 19
Exploration Implications 1. TOC values in Jurassic strata were too
low for these units to be considered source rocks, averaging 0.42% (Table 4). Modeling in BasinMod® 2012 showed that the volume of hydrocarbons generated would be low (~10 bbls/acre*ft) with none expelled from even the highest TOC intervals. This is collaborated by the indications of gas shows based on the mud logs, which wireline logs show to be in tight, Middle Jurassic carbonates. The general correlation between the best shows and the highest TOC intervals supports the interpretation that generated hydrocarbons remained in situ (Fig. 10). The kerogen in the well was often inert (Type IV), averaging 59.4% in the Jurassic, and 30.5% in the Cretaceous.
2. Low porosities and permeabilities eliminate potential reservoir intervals near the highest TOC intervals. Lack of vertical migration conduits would have
prevented hydrocarbons from migrating to better quality, shallower reservoirs had hydrocarbons been generated and expelled. The main faults seen on the isochore map (Fig. 9) are not interpreted to cut horizons much shallower than the “base mid-Jurassic” (SB1). Intra-Tithonian and younger strata have porosities and permeabilities sufficient to be considered potential reservoirs. However, these sediments are immature and are bordered by low TOC intervals.
Acknowledgements The support of BOEM management and staff: R. Poling and M. Wilson are gratefully acknowledged. We are grateful to GeoSpec, a CGG company, for allowing the publication of their reprocessed, depth-converted, time-migrated seismic data and derivative maps produced by BOEM staff from this data. The assistance of J. Danford and M. Paton of GeoSpec is greatly appreciated.

Georges Bank Basin: LC 187‐1 Page 7 of 19
Figure 2. Stratigraphic chart showing the target interval for Tenneco LC 187-1.

Georges Bank Basin: LC 187‐1 Page 8 of 19
Figure 3. Structure maps showing Tenneco’s top of Middle Jurassic, Lower Jurassic marker, and Lower Jurassic unconformity (Tenneco, 1982a).
Figure 4. Tenneco’s seismic interpretation through LC 187-1 (Tenneco, 1982a).
Georges Bank Basin: LC 187‐1 Page 9 of 19
Figure 5. Objective zones for well LC 187-1 with interpreted lithologies based on mud logs, sidewall core analysis, and crossplot of neutron and density curves. Locations of drill stem tests, repeat formation tests, and sidewall cores are also shown.

Georges Bank Basin: LC 187‐1 Page 10 of 19
Figure 6. Seismic profile (north to southwest to east) with interpreted horizons (in black) and faults (red and purple). Structure maps of the intra-Oxfordian and base Bathonian horizons are shown in Figures 7 and 8.

Georges Bank Basin: LC 187‐1 Page 11 of 19
Figure 7. Structure map: datum intra-Oxfordian mapped horizon (Figure 6). Lines shown in blue are the d-186 and pr_108.

Georges Bank Basin: LC 187‐1 Page 12 of 19
Figure 8. Structure map: datum base Bathonian mapped horizon (Figure 6). Lines shown in blue are the d-186 and pr_108.
Georges Bank Basin: LC 187‐1 Page 13 of 19
Figure 9. Isochore map for the entire Jurassic interval. Lines shown in blue are the d-186 and pr_108. High angle faults offsetting SB1 are shown in red and purple.

Georges Bank Basin: LC 187‐1 Page 14 of 19
Figure 10. Correlation of the gas shows encountered while drilling with the higher TOC values measured from the cuttings supports our model’s predictions that hydrocarbons remained in situ.
Georges Bank Basin: LC 187‐1 Page 15 of 19
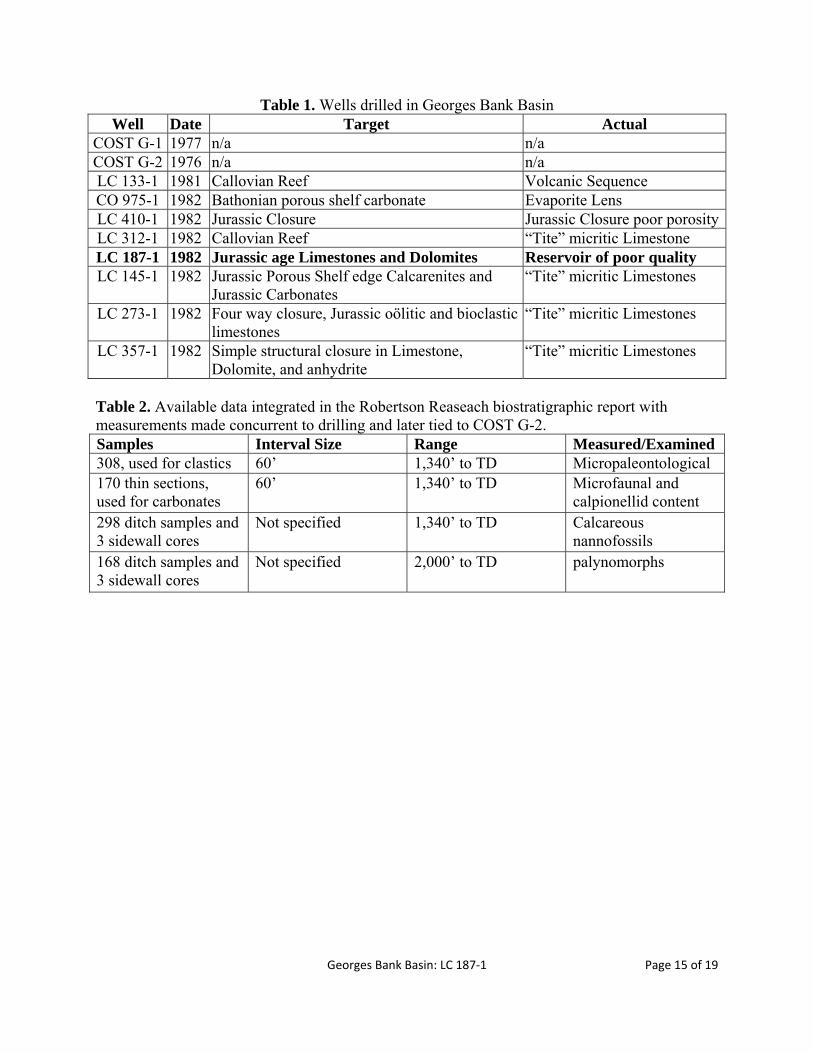
Table 1. Wells drilled in Georges Bank Basin Well Date Target Actual
COST G-1 1977 n/a n/a COST G-2 1976 n/a n/a LC 133-1 1981 Callovian Reef Volcanic Sequence CO 975-1 1982 Bathonian porous shelf carbonate Evaporite Lens LC 410-1 1982 Jurassic Closure Jurassic Closure poor porosityLC 312-1 1982 Callovian Reef “Tite” micritic Limestone LC 187-1 1982 Jurassic age Limestones and Dolomites Reservoir of poor quality LC 145-1 1982 Jurassic Porous Shelf edge Calcarenites and
Jurassic Carbonates “Tite” micritic Limestones
LC 273-1 1982 Four way closure, Jurassic oӧlitic and bioclastic limestones
“Tite” micritic Limestones
LC 357-1 1982 Simple structural closure in Limestone, Dolomite, and anhydrite
“Tite” micritic Limestones
Table 2. Available data integrated in the Robertson Reaseach biostratigraphic report with measurements made concurrent to drilling and later tied to COST G-2. Samples Interval Size Range Measured/Examined 308, used for clastics 60’ 1,340’ to TD Micropaleontological 170 thin sections, used for carbonates
60’ 1,340’ to TD Microfaunal and calpionellid content
298 ditch samples and 3 sidewall cores
Not specified 1,340’ to TD Calcareous nannofossils
168 ditch samples and 3 sidewall cores
Not specified 2,000’ to TD palynomorphs

Georges Bank Basin: LC 187‐1 Page 16 of 19
Table 3. Formation names, ages, and tops for the LC 187-1 well were derived from GeoSpec’s earlier work (GeoSpec, 2003). Lithology and depositional environment assembled from previously reported sources and from our analysis of mud logs, wireline logs using Log Evaluation System Analysis (LESA) software, and sidewall core descriptions. Depth (tops)
Age Formation/Unit: Lithology Depositional Environment
600 Miocene to Campanian
Unknown Middle shelf (~300’), mud dominated
1330 Campanian to Cenomanian
Dawson Canyon Fm.: Fossiliferous mudstones
Middle shelf (~300’), mud dominated
2235 Cenomanian to Barremian
Logan Canyon Fm.: Mudstone with interbedded, unconsolidated sandstone and limestone, occasional chert
Shallow water (~50’–100’), mixed mud and siliciclastic dominated shelf
3740 Barremian to Hauterivian
Mississauga: Interbedded mudstone, calcareous siltstone, and poorly consolidated, calcareous cemented sandstone
Shallow water (~50’–100’), mixed mud and siliciclastic dominated shelf
4940 Berriasian to Tithonian
Roseway Unit: limestones and calcareous mudstones, locally pyritic, top of unit is fossiliferous
Shallow water (~50’–100’), mixed mud and carbonate dominated shelf
6300 Tithonian-Oxfordian (?)
Abenaki: Shale and limestone interbedded with sandstone and siltstone
Shallow water (~50’–100’), mixed mud and carbonate dominated shelf
6990 Oxfordian Mic Mac-Mohawk: Interbedded sandstones and mudstones, often with calcite and anhydrite cements
Shallow water (~50’–100’), mixed clastic and mud dominated shelf
8950
Oxfordian- Bathonian
Abenaki: Oolitic limestone with interbedded siliciclatics and some shale
Shallow water (~25’–50’), mixed carbonate and clastic dominated shelf
12645 Bathonian* Mohican: Interbedded siltstones and sandstones with carbonates
Shallow water (~25’–50’), mixed carbonate and clastic shelf
12985 Bathonian* Iroquois: Dolomite and Oolitic limestone, locally anhydritic and lignitic stringers
Carbonate shelf and tidal flat, sabkha. Restricted shallow marine.
*Fauna interpreted as being reworked. Age interpretation considered unreliable.

Georges Bank Basin: LC 187‐1 Page 17 of 19
Table 4. Petroleum System Elements
Element LC 187-1 Lithology
Source rock (>1% TOC) However, an
effective source rock has ~2% TOC
Below 5,600 there are TOC values of 1% and 1.65% for consecutive measurements at 14,200’ and 14,400’
respectively. Two additional samples >1% found in shallower, immature sections of Early Cretaceous age.
Reservoir rock (>10 % φ >1 mD k)
Cretaceous, Kimmeridgian, and Oxfordian sandstones
Seal rock (10-3 mD k)
Shale, Anhydrite, impermeable Carbonates
Overburden rock Early maturity for oil at 5,600’ (0.5% Ro) Main dry gas generation at 17,200’ (1.3% Ro)
Table 5. Petroleum System Processes
Onset hydrocarbon generation
5,600’ based on vitrinite reflectance data.
Expulsion
Overall, strata in the well contain insufficient TOC (<1%) to generate and expel hydrocarbons. There are no significant shows in reservoir lithologies. The low TOC values result in source rocks too lean for hydrocarbons to have been expelled (Katz, 2012). Modeling using BasinMod® 2012 suggests that the limited volumes of hydrocarbons generated are retained in the “source rock” (in situ).
Table 6. LC 187-1 Target Summary
Pre-Drill InterpretationTarget ~9,800’–21,000’
Trap Type Structural-Stratigraphic Hydrocarbon
Expected Oil and gas
Post-Drill ResultsTarget
Interval At ~9,700’, MD Jurassic carbonates were encountered. Insufficient TOC for hydrocarbon generation-expulsion-migration-accumulation existed to TD of 18,127’
Hydrocarbon Shows
There were no reported oil shows and gas encountered was low volume and ephemeral
Georges Bank Basin: LC 187‐1 Page 18 of 19
References: Core Laboratories Inc, 1982. Sidewall Core Analysis, Well #1, OCS A-0182, Block 187, NK 19-
12 (Lydonia Canyon), 5 p. (available at https://www.data.boem.gov/homepg/data_center/other/WebStore/master.asp)
Dow, W., 1977, Kerogen studies and geological interpretations: Journal of Geochemical Exploration, v. 7, p. 79-99.
Edson, G.M., D.L. Olson, and A.J. Petty (eds.), 2000. Tenneco Lydonia Canyon Block 187 No. 1 Well; Geological and Operational Summary: MMS 2000-035, 59 p. http://www.boem.gov/uploadedFiles/BOEM/Oil_and_Gas_Energy_Program/Resource_Evaluation/Geological_and_Geophysical_Data_Acquisition/AtlanticCOST2000-035.pdf (accessed May 20, 2014)
Exlog Inc., 1982. Well Summary Report, Well #1, OCS A-0182, Block 187, NK 19-12 (Lydonia Canyon), 30 p. (available at https://www.data.boem.gov/homepg/data_center/other/WebStore/master.asp)
Fitrianto, T., H.N. Saputra, B. Syam, and A.H. Purwanto, 2012. The origin, distribution and prediction of CO2 in south Sumatra, a case study: Jabung block and surrounding area. Proceedings, Indonesian Petroleum Association. Thirty-six annual convention and exhibition, p. 10. http://archives.datapages.com/data/ipa_pdf/083/083001/pdfs/IPA12-G-025.pdf
Friedman, G.M., 1980. Dolomite is an evaporite mineral: evidence from the rock record and from sea-marginal ponds of the red sea, SEPM Special Publication No. 28, p. 69–80.
GeoSpec, 2003. Frontier basins of the North Atlantic, 271 p. HBrothers. “Inflation Calculator.” DollarTimes, 2015. DollarTimes.
http://www.dollartimes.com/calculators/inflation.htm (accessed March 12, 2015) Katz, B.J., 2012. Hydrocarbon Migration: What We Know, What We Don't Know and Why It Is
Important (abstract), HGS Bulletin, https://www.hgs.org/civicrm/event/info?reset=1&id=1235 (accessed 27 May, 2014).
Magoon, L.B., and W.G. Dow, 1994. The Petroleum System: in L.B. Magoon, and W.G. Dow (eds.), The petroleum system—from source to trap: AAPG Memoir 60, p. 3–24.
Minerals Management Service (MMS) Staff, 1985. Geologic Review, Well #1, OCS A-0182, Block 187, NK 19-12 (Lydonia Canyon), 102 p. (available at https://www.data.boem.gov/homepg/data_center/other/WebStore/master.asp)
Robertson Research, 1982. Biostratigraphical Analysis of the Tenneco Oil Co. OCS A-0182 #1 Well, Block 187, Georges Bank Area, North Atlantic, 95 p. (available at https://www.data.boem.gov/homepg/data_center/other/WebStore/master.asp)
Tenneco Oil Company, 1980. Lease Instrument, Well #1, OCS A-0182, Block 187, NK 19-12 (Lydonia Canyon), 28 p. (available at https://www.data.bsee.gov/homepg/data_center/other/WebStore/master.asp)
Tenneco Oil Company, 1982a. Application for Permit to Drill, Well #1, OCS A-0182, Block 187, NK 19-12 (Lydonia Canyon), 45 p. (available at https://www.data.boem.gov/homepg/data_center/other/WebStore/master.asp)
Tenneco Oil Company, 1982b. Well Completion Report, Well #1, OCS A-0182, Block 187, NK 19-12 (Lydonia Canyon), 3 p. (available at https://www.data.boem.gov/homepg/data_center/other/WebStore/master.asp)
Tenneco Oil Company, 1983. Source Rock Evaluation Data, Well #1, OCS A-0182, Block 187, NK 19-12 (Lydonia Canyon), 2 p. (available at https://www.data.boem.gov/homepg/data_center/other/WebStore/master.asp)

Georges Bank Basin: LC 187‐1 Page 19 of 19
Withjack, M.O., R.W. Schlische, and P.E. Olsen, 2012. Development of the passive margin of eastern North America: Mesozoic rifting, igneous activity, and breakup: in A.W. Bally and D.G. Roberts, eds., Principles of Phanerozoic Regional Geology, v 1, p. 301–335.
U.S. Department of the Interior, Bureau of Land Management, 2012 Oil Shale and Tar Sands Programmatic EIS Glossary/Acronyms, 2012. http://ostseis.anl.gov/glossacro/dsp_wordpopup.cfm?word_id=2288 (accessed March 4, 2015)