atlantic basin seasonal hurricane prediction from 1 december
TRANSCRIPT

Science and Technology Infusion Climate Bulletin NOAA’s National Weather Service 33rd NOAA Annual Climate Diagnostics and Prediction Workshop Lincoln, NE, 20-24 October 2008
______________ Correspondence to: Philip Klotzbach, Department of Atmospheric Science, Colorado State University; E-mail: [email protected]
Atlantic Basin Seasonal Hurricane Prediction from 1 December Philip Klotzbach
Department of Atmospheric Science, Colorado State University
1. Introduction
The Tropical Meteorology Project (TMP) at Colorado State University (CSU) has been issuing Atlantic basin seasonal hurricane forecasts in early June with an update in early August since 1984 (Gray 1984b). CSU’s seasonal hurricane forecast scheme has shown significant real-time skill for the early June and early August predictions (Owens and Landsea 2003). Additional research in the late 1980s and early 1990s led to the development of an early December forecast (Gray et al. 1992) that utilized West African rainfall and the quasi-biennial oscillation (QBO) as predictors. These predictors, when used in combination, explained about 50% of the cross-validated variance for the following year’s hurricane season, based on data from 1950-1990. However, these predictors did not show real-time forecast skill.
More recently, Klotzbach and Gray (2004) developed a new December statistical hindcast scheme utilizing National Centers for Environmental Prediction/National Center for Atmospheric Research (NCEP/NCAR) reanalysis data (Kistler et al. 2001). This newer prediction scheme utilized a total of six predictors and attempted to hindcast several forecast metrics including named storms, named storm days, major hurricanes and Net Tropical Cyclone (NTC) activity (Gray et al. 1994). Although this scheme also showed considerable amounts of hindcast skill, it did not show real-time forecast skill from 2003-2007. Real-time predictions of Net Tropical Cyclone activity issued in early December have shown little correlation (r = 0.05) with observations over the period from 1992-2007.
Additional revisions to the early December forecast scheme have recently been made. These revisions involve simplifying the statistical scheme and including more robust statistical tests for predictor significance, similar to what was done in Klotzbach (2007). More extensive discussion of the new December forecast scheme can be found in a recently published paper (Klotzbach 2008). The remainder of the paper is structured as follows. Section 2 discusses the data that is used in the study. Section 3 describes the methodology utilized to obtain the predictors. Section 4 demonstrates the hindcast skill available when implementing the forecast scheme. Section 5 discusses the physical relationships between predictors and Atlantic basin hurricane activity, while Section 6 examines the application of this prediction scheme to United States landfalling hurricanes. Section 7 concludes and provides some ideas for future work.
2. Data
Atlantic basin tropical cyclone statistics from 1950-2007 were calculated from the “best track” dataset generated by the National Hurricane Center (Jarvinen et al. 1984). From the “best track” dataset, an index of Net Tropical Cyclone activity (NTC) was created. NTC was introduced by Gray et al. (1994) and is defined to be the following six parameters normalized by their 1950-2000 average values: named storms, named storm days, hurricanes, hurricane days, major hurricanes and major hurricane days. NTC is the only metric predicted by this new forecast scheme, in an effort to develop a simpler scheme that utilizes fewer predictors than when multiple indices are forecast (i.e., named storms, hurricanes, major hurricane days, etc.). A small downward adjustment to the “best track” is applied prior to 1970 (Landsea et al. 1993). The National Centers for Environmental Prediction/National Center for Atmospheric Research (NCEP/NCAR) reanalysis (Kistler et al. 2001) was utilized as the source of large-scale atmosphere/ocean data.
3. Predictor Selection Methodology
Predictors were selected from the NCEP/NCAR reanalysis. First, a time series of Atlantic basin NTC was created for 1950-2007. Then, NCEP/NCAR reanalysis fields of sea level pressure, sea surface

SCIENCE AND TECHNOLOGY INFUSION CLIMATE BULLETIN
2
temperature and 500 mb geopotential height were correlated against the NTC index from 1950-1989, leaving out the 1990-2007 period as an additional dataset to test hindcast skill. Correlations were investigated for both the combined October-November period and the individual month of November. Figure 1 displays a linear correlation map between October-November sea surface temperature and the following year’s NTC over the period from 1950-1989. Note the large areas of positive correlation in the North Atlantic.
Areas selected as predictors correlated significantly at the 95% level (r > |0.31|) with NTC over the period from 1950-1989. Significance was determined by using a two-tailed Student’s t-test and assuming that each hurricane season represents one degree of freedom. This assumption seems reasonable as the auto-correlation between one year’s NTC and the following year’s NTC is only 0.22. The areas selected had to be of fairly large spatial extent (at least 10° latitude by 15° longitude) in order to avoid selecting correlation “bulls-eyes” which sometimes exist in the NCEP/ NCAR reanalysis. In order to remain in the predictor pool, several additional criteria had to be met. First, the correlation between the predictor and NTC had to remain significant at the 95% level (r > |0.47|) over the period from 1990-2007. Second, the predictor had to show significant correlations with physical features during the following August-October period that are known to effect Atlantic basin hurricane activity, such as alterations in wind shear patterns, sea level pressure patterns, and sea surface temperature patterns (Gray 1984a, b, Knaff 1997, Goldenberg et al. 2001). Finally, when the predictors were added using stepwise regression, they had to add at least three percent additional variance explained for NTC over the three time periods of 1950-1989, 1990-2007 and 1950-2007.
4. Results
Figure 2 displays the locations of the predictors on a map. Only three predictors were utilized in this forecast scheme. It is believed that by regressing against only one index (NTC) and keeping the predictor pool small, the scheme will likely show more skill than some of the earlier schemes utilized by the TMP that had much larger predictor pools. The dangers of over-fitting a statistical scheme that utilizes only three predictors should be considerably reduced.
Table 1 displays the locations and individual correlations between each of the
three predictors and NTC over the developmental period from 1950-1989, the test period of 1990-2007 and the full period of 1950-2007. As mentioned in the methodology section, all predictors are significant at the 95% level over all three time periods.
Table 2 displays the variance explained of these three predictors using stepwise regression over the period from 1950-1989 and applying those equations (developed from 1950-1989 using the stepwise
Fig. 1. Linear correlation between October-November sea surface temperature and the following year’s Net Tropical Cyclone activity over the period from 1950-1989.
Fig. 2. Location of predictors utilized in the new early December statistical forecast scheme.

KLOTZBACH
3
Predictor Latitude-Longitude Region
1950-1989 Correlation
1990-2007 Correlation
1950-2007 Correlation
1) October-November SST in the North Atlantic (+)
(55-65°N, 60-10°W) 0.48 0.56 0.55
2) November 500 MB Geopotential Height in the far North Atlantic (+) (67.5-85°N, 50°W-10°E) 0.52 0.48 0.51
3) November SLP in the Subtropical Northeast Pacific (+) (7.5-22.5°N, 175-125°W) 0.33 0.53 0.36
Table 1. Listing of predictors selected for the early December forecast. The sign of the predictor associated with above-normal tropical cyclone seasons is in parentheses. The correlation of predictors with NTC over the following periods (1950-1989, 1990-2007 and 1950-2007) is also provided.
regression technique) to the 1990-2007 period. Also, the variance explained over the full period using equations developed over 1950-1989 is listed. North Atlantic SST is added to the scheme first, followed byfar North Atlantic 500 mb geopotential height and then subtropical Northeast Pacific sea level pressure. Note that the addition of each predictor adds considerable amounts of variance explained for each of the three periods examined. The hindcast scheme explains 40% of the variance over the dependent period from 1950-1989, while explaining 53% of the variance over the test period from 1990-2007. Over the full time period (1950-2007), the scheme explains 46% of the variance, using equations developed on 1950-1989.
If equations are developed over the full forecast period from 1950-2007, variance explained for NTC increases slightly to 47%. The average error using the hindcasts is 32 NTC units, compared with 44 NTC units using climatology. This reduction in average error is statistically significant at the 95% level using a two-tailed Student’s t-test. The hindcasts are able to correctly predict an above- or below-average season (greater than or less than 100 NTC units) in 45 out of 58 years. It is remarkable that such a simple statistical scheme using only three predictors can explain such a large amount of variance in NTC seven months before the start of the hurricane season. It is likely the interaction between large-scale modes such as El Niño-Southern Oscillation (ENSO) (Rasmusson and Carpenter 1982), the Atlantic Multi-Decadal Oscillation (AMO) (Goldenberg et al. 2001) and the Pacific Decadal Oscillation (PDO) (Mantua et al. 1997) provide the long-period memory that gives the model its hindcast skill.
Period Predictor 1 Predictors 1 and 2 Predictors 1, 2, and 3
1950-1989 0.23 0.32 0.40
1990-2007 0.31 0.45 0.53
1950-2007 0.30 0.38 0.46
Table 2. Stepwise regression technique documenting the increase in variance explained for NTC over the periods of 1950-1989, 1990-2007 and 1950-2007, respectively. Equations were developed over the 1950-1989 period. Predictor numbers are the same as listed in Table 1.
A new addition to this statistical forecast model when compared with earlier statistical forecast schemes used by the TMP is using a rank technique to adjust the statistical hindcasts. The ranking technique is generated by ranking all statistical hindcast values over the 1950-2007 period from 1 to 58. Then, actual observed NTC values for that ranking are assigned to a particular year. For example, 1953 ranked as the seventh largest hindcast value. The seventh largest observed value of NTC from 1950-2007 was 188, and therefore, 1953 was assigned a final rank hindcast NTC value of 188. It should be noted that several observed values of NTC were either below 40 or above 200. However, especially at this early lead time, the confidence in the statistical scheme is not high enough to assign values greater than 200 or lower than 40.
SCIENCE AND TECHNOLOGY INFUSION CLIMATE BULLETIN
4
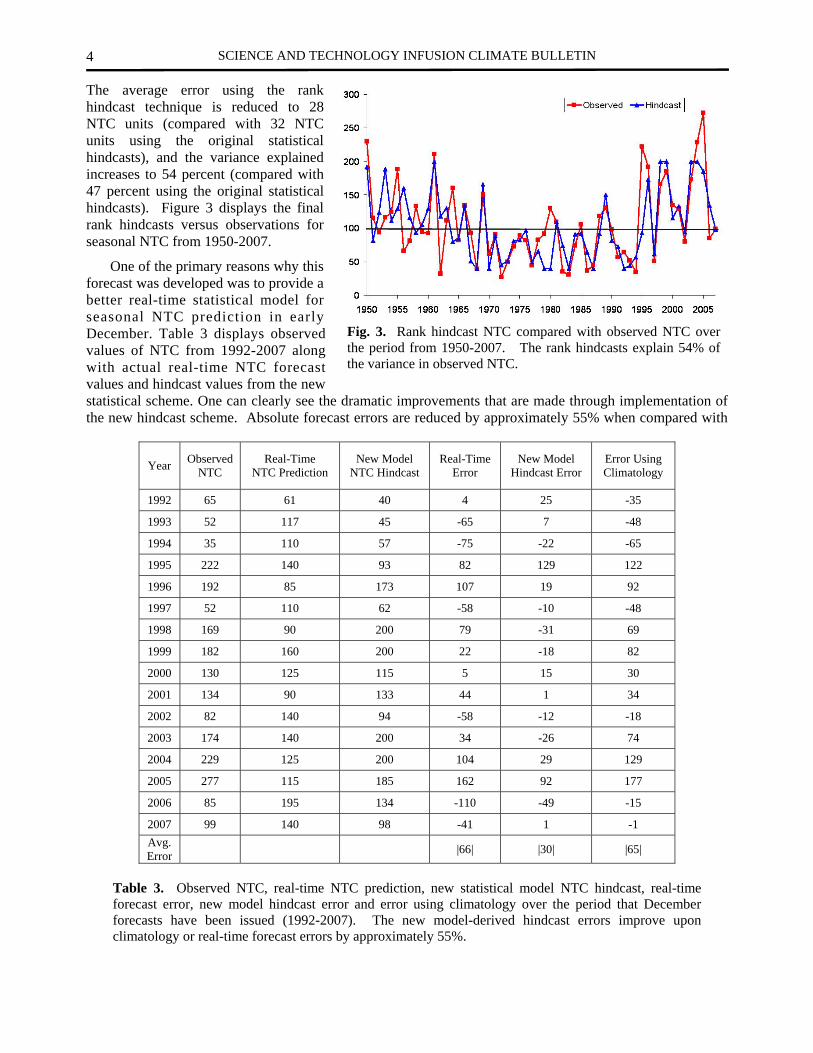
The average error using the rank hindcast technique is reduced to 28 NTC units (compared with 32 NTC units using the original statistical hindcasts), and the variance explained increases to 54 percent (compared with 47 percent using the original statistical hindcasts). Figure 3 displays the final rank hindcasts versus observations for seasonal NTC from 1950-2007.
One of the primary reasons why this forecast was developed was to provide a better real-time statistical model for seasonal NTC prediction in early December. Table 3 displays observed values of NTC from 1992-2007 along with actual real-time NTC forecast values and hindcast values from the new statistical scheme. One can clearly see the dramatic improvements that are made through implementation of the new hindcast scheme. Absolute forecast errors are reduced by approximately 55% when compared with
Year Observed NTC
Real-Time NTC Prediction
New Model NTC Hindcast
Real-Time Error
New Model Hindcast Error
Error Using Climatology
1992 65 61 40 4 25 -35
1993 52 117 45 -65 7 -48
1994 35 110 57 -75 -22 -65
1995 222 140 93 82 129 122
1996 192 85 173 107 19 92
1997 52 110 62 -58 -10 -48
1998 169 90 200 79 -31 69
1999 182 160 200 22 -18 82
2000 130 125 115 5 15 30
2001 134 90 133 44 1 34
2002 82 140 94 -58 -12 -18
2003 174 140 200 34 -26 74
2004 229 125 200 104 29 129
2005 277 115 185 162 92 177
2006 85 195 134 -110 -49 -15
2007 99 140 98 -41 1 -1 Avg. Error |66| |30| |65|
Table 3. Observed NTC, real-time NTC prediction, new statistical model NTC hindcast, real-time forecast error, new model hindcast error and error using climatology over the period that December forecasts have been issued (1992-2007). The new model-derived hindcast errors improve upon climatology or real-time forecast errors by approximately 55%.
Fig. 3. Rank hindcast NTC compared with observed NTC over the period from 1950-2007. The rank hindcasts explain 54% of the variance in observed NTC.

KLOTZBACH
5
either the real-time forecast or climatology. The new hindcast scheme’s error is smaller than climatology in 14 out of 16 years and is smaller than the real-time forecast’s error in 13 out of 16 years. The model was used in real-time prediction for the first time for the 2008 Atlantic basin hurricane season. The statistical model called for a somewhat above-average hurricane season of 127 NTC units. As of the end of October, seasonal NTC was observed to be 145 NTC units, which indicates a reasonably successful forecast.
5. Physical Relationships between Predictors and Atlantic Basin Hurricane Activity
One of the primary reasons why some of the TMP’s earlier statistical forecast models have failed in real-time forecasting is likely due to a lack of rigorous statistical tests and inadequate understanding of the physical relationships between individual predictors and Atlantic hurricane activity. In the previous section, the more rigorous statistical tests that were conducted in order to verify the legitimacy of individual predictors were demonstrated. In this section, individual predictors and their likely physical relationships with Atlantic basin hurricane activity are discussed. Correlation maps between individual predictors and August-October sea surface temperature, sea level pressure, 200 mb zonal wind and 925 mb zonal wind are provided. These maps illustrate the fact that these predictors are likely physically tied to features that are known to effect Atlantic basin hurricane activity.
a. Predictor 1. October-November SST in the North Atlantic (55°-65°N, 60-10°W) (+)
Warm North Atlantic sea surface temperatures in the fall are indicative of an active phase of the Atlantic Multidecadal Oscillation (AMO) and a strong Atlantic thermohaline circulation (Goldenberg et al. 2001). There tends to be a fairly strong auto-correlation between North Atlantic SSTs in this region during the late fall and SSTs during the following August-October period as seen in Panel (a) of Figure 4. An active AMO is associated with anomalously low vertical wind shear, anomalously warm tropical Atlantic sea surface temperatures and anomalously low sea level pressures during August-October (Figure 4). These anomalously low values of vertical wind shear are generated by a weakening of the Tropical Upper Tropospheric Trough (TUTT) in the central Atlantic. When this occurs, upper-level westerlies and low-level easterlies are reduced, thereby reducing vertical wind shear.
b. Predictor 2. November 500 mb Geopotential Height in the far North Atlantic (+) (67.5-85°N, 50°W-10°E)
Predictor 2 correlates at -0.73 with November values of the Arctic Oscillation (AO) (Thompson and Wallace 1998) and at -0.55 with November values of the North Atlantic Oscillation (NAO) (Barnston and Livezey 1987). Negative AO and NAO values imply more blocking or ridging in the central Atlantic and an associated reduction in the strength of the westerlies. In addition, a negative NAO is associated with a
Fig. 4. Linear correlation between October-November SST in the North Atlantic (Predictor 1) and the following year’s August-October sea surface temperature (panel a), August-October sea level pressure (panel b), August-October 200 mb zonal wind (panel c) and August-October 925 mb zonal wind (panel d).

SCIENCE AND TECHNOLOGY INFUSION CLIMATE BULLETIN
6
weaker Azores High, resulting in weaker trade winds and positive SST anomalies in the tropical Atlantic (Marshall et al. 2001). These anomalies are clearly evident during the following August-October period (Figure 5). Other following summer-early fall features that are directly correlated with this predictor are low sea level pressure in the Caribbean and easterly anomalies at 200 mb, resulting in weaker vertical wind shear (Figure 5). Both of these are also hurricane-enhancing factors.
c. Predictor 3. November SLP in the Subtropical Northeast Pacific (+) (7.5-22.5°N, 175-125°W)
High pressure in the subtropical northeast Pacific tends to appear during the fall and winter prior to a La Niña event (Larkin and Harrison 2002). High pressure forces stronger trade winds in the East Pacific which encourages mixing and increases upwelling, helping to initiate La Niña conditions. Also, these stronger trades likely help keep cool conditions in the tropical Pacific into the upcoming hurricane season, by inhibiting the recharge and discharge of the warm pool during the winter and spring months. Figure 6 displays linear correlations between Predictor 3 and the following August-October’s values of sea surface temperature, sea level pressure, 200 mb zonal wind and 925 mb zonal wind. Note the large area of negative correlations for SST in the tropical Pacific indicative of La Niña. Cool ENSO conditions are associated with reduced vertical wind shear across the tropical Atlantic and especially in the Caribbean (Gray 1984b, Klotzbach 2007).
6. Early December NTC Hindcasts and U.S. Landfalling Tropical Cyclones
The TMP has been issuing landfall probability forecasts since August 1998. The primary
Fig. 5. Linear correlation between November 500 mb geopotential height in the far North Atlantic (Predictor 2) and the following year’s August-October sea surface temperature (panel a), August-October sea level pressure (panel b), August-October 200 mb zonal wind (panel c) and August-October 925 mb zonal wind (panel d).
Fig. 6. Linear correlation between November SLP in the subtropical northeast Pacific (Predictor 3) and the following year’s August-October sea surface temperature (panel a), August-October sea level pressure (panel b), August-October 200 mb zonal wind (panel c) and August-October 925 mb zonal wind (panel d).

KLOTZBACH
7
justification for issuing these forecasts is that on a statistical basis, more active tropical cyclone seasons have more landfalling storms than do inactive tropical cyclone seasons. If seasonal forecasts are developed that have statistical skill at forecasting tropical cyclone seasons, there should also be skill in issuing landfall probability forecasts, as discussed in Klotzbach (2007). For this newly-developed December scheme, considerable differences exist between seasons with high NTC hindcasts compared with low NTC hindcasts. In keeping with discussions in Klotzbach and Gray (2004) and Klotzbach (2007), the strongest ratios are found for storms making landfall along the Florida Peninsula and East Coast. For example, the top 15/bottom 15 NTC landfall ratios are 36 to 17 for named storms, 19 to 8 for hurricanes and 7 to 2 for major hurricanes. Figure 7 displays the tracks of the major hurricanes making landfall in the top 15 and bottom 15 NTC hindcasts for the Florida Peninsula and East Coast.
7. Conclusions and Future Work
There exists significant hindcast skill in predicting the following year’s Net Tropical Cyclone activity parameter by early December (seven months prior to the start of the hurricane season). A simple statistical scheme utilizing three predictors is able to explain over 50% of the variance in NTC over the period from 1950-2007. Predictors were selected based on their skill over the period from 1950-1989, while the 1990-2007 was set aside for additional testing of model skill. Physical relationships between individual predictors and the following year’s hurricane season were discussed. NTC hindcasts were also shown to exhibit significant relationships with U.S. landfalling hurricanes, especially along the Florida Peninsula and East Coast.
References
Barnston, A. G., and R. E. Livezey, 1987: Classification, seasonality and persistence of low-frequency atmospheric circulation patterns. Mon. Wea. Rev., 115, 1083-1126.
Goldenberg, S. B., C. W. Landsea, A. M. Mestas-Nuñez, and W. M. Gray, 2001: The recent increase in Atlantic hurricane activity: Causes and implications. Science, 293, 474-479.
Gray, W. M., 1984a: Atlantic seasonal hurricane frequency. Part I: El Niño and 30 mb quasi-biennial oscillation influences. Mon. Wea. Rev., 112, 1649-1668.
Gray, W. M., 1984b: Atlantic seasonal hurricane frequency. Part II: Forecasting its variability. Mon. Wea. Rev., 112, 1669-1683.
Gray, W. M., C. W. Landsea, P. W. Mielke Jr., and K. J. Berry, 1992: Predicting Atlantic seasonal hurricane activity 6-11 months in advance. Wea. Forecasting, 7, 440-455.
Gray, W. M., C. W. Landsea, P. W. Mielke Jr., and K. J. Berry, 1994: Predicting Atlantic basin seasonal tropical cyclone activity by 1 June. Wea. Forecasting, 9, 103-115.
Jarvinen, B. R., C. J. Neumann, and M. A. S. Davis, 1984: A tropical cyclone data tape for the North Atlantic basin, 1886-1983: Contents, limitations, and uses, 21 pp. NOAA Tech. Memo. NWS NHC 22, Miami, FL.
Fig. 7. Tracks of major hurricanes making Florida Peninsula and East Coast landfall for the top 15 NTC hindcasts (panel a) and bottom 15 NTC hindcasts (panel b). Seven major hurricanes made landfall in the top 15 NTC hindcasts compared with two major hurricanes in the bottom 15 NTC hindcasts.
a)
b)

SCIENCE AND TECHNOLOGY INFUSION CLIMATE BULLETIN
8
Kistler, R., and Co-Authors, 2001: The NCEP-NCAR 50-year reanalysis: Monthly means CD-ROM and documentation. Bull. Amer. Meteor. Soc., 82, 247-267.
Klotzbach, P. J., 2007: Revised prediction of seasonal Atlantic basin tropical cyclone activity from 1 August. Wea. Forecasting, 22, 937-949.
Klotzbach, P. J., 2008: Refinements to Atlantic basin seasonal hurricane prediction from 1 December. J. Geophys. Res., 113, D17109, doi: 10.1029/2008JD010047.
Klotzbach, P. J., and W. M. Gray, 2004: Updated 6-11-month prediction of Atlantic basin seasonal hurricane activity. Wea. Forecasting, 19, 917-934.
Knaff, J. A., 1997: Implications of summertime sea level pressure anomalies in the tropical Atlantic region. J. Climate, 10, 789-804.
Landsea, C. W., 1993: A climatology of intense (or major) Atlantic hurricanes. Mon. Wea. Rev., 121, 1703-1713.
Larkin, N. K., and D. E. Harrison, 2002: ENSO warm (El Niño) and cold (La Niña) event life cycles: Ocean surface anomaly patterns, their symmetries, asymmetries and implications. J. Climate, 15, 1118-1140.
Mantua, N. J., S. R. Hare, Y. Zhang, J. M. Wallace, and R. C. Francis, 1997: A Pacific decadal climate oscillation with impacts on salmon. Bull. Amer. Meteor. Soc., 78, 1069-1079.
Marshall, J., and Co-Authors, 2001: North Atlantic climate variability: Phenomena, impacts and mechanisms. Int. J. Climatol., 21, 1863-1898.
Rasmusson, E. M., and T. H. Carpenter, 1982: Variations in tropical sea surface temperature and surface wind fields associated with the Southern Oscillation/El Niño. Mon. Wea. Rev., 110, 354-384.
Owens, B. F., and C. W. Landsea, 2003: Assessing the skill of operational Atlantic seasonal tropical cyclone forecasts. Wea. Forecasting, 18, 45-54.
Thompson, D. W. J., and J. M. Wallace, 1998: The Arctic Oscillation signature in the wintertime geopotential height and temperature fields. Geophys. Res. Lett., 25, 1297-1300.