atiu draft power sector/feasibility...
TRANSCRIPT

Aitutaki Power Study Report June 2005
Prepared for the Government of the Cook Islands and funded by the Government of
New Zealand

Foreword
The consultants would like to thank the many people who provided information for this report and assisted in our field trip. These include the Director and staff of the Energy Division, Aitutaki Power Supply management and staff, Aronga Mana, Island Council & Administration and the various departments, CIIC, TAU , Environment, Government Ministries, businesses and the residents of Aitutaki who generously gave their time and input to the study.
Bruce Clay
Herb Wade
Dick Watling
June 2005
ii

ACRONYMS and ABBREVIATIONS
A Ampa.g.l. Above ground levela.s.l. Above sea levelAAGR Average Annual Growth RateABC Arial Bundled CableAC Alternating CurrentACP African Caribbean Pacific CountriesADB Asian Development BankAIC Aitutaki Island CouncilAl AluminiumAPS Aitutaki Power SupplyCEO Chief Executive OfficerCOE Cost of EnergyCu CopperDSM Demand Side ManagementEff EfficiencyEIA Environmental Impact AssessmentENSO El Niño/El Niña oceanic climate cycleGDP Gross Domestic ProductGoCI Government of the Cook IslandsHa Hectarehr HourHV High VoltageHyab Hydraulic hoist truckHz HertzIRR Internal Rate of ReturnJCB Loader/backhoe tractorkg KilogramkM Kilometrekm2 Square kilometrekV Kilo VoltskVA Kilo Volt AmpskVAr Kilo Volt Amps ReactivekW KilowattkWh Kilowatt HourkWp Kilo Watt PeakLPG Liquid Petroleum Gas
iii

L LitreLV Low Voltagem Metrem/s Metres per secondm3 Cubic MeterMFEM Ministry of Finance and Economic Management min Minutemm MillimetresMWh Mega Watt HourNEP National Energy PolicyNPV Net Present ValueOMIA Office of the Minister of Island AdministrationsPACER Pacific Agreement on Close Economic Relations PEIA Preliminary Environmental Impact AssessmentPIC Pacific Island CountriesPICTA Pacific Islands Trade AgreementPREFACE
Rural Renewable Energy France-Australia Common Endeavour (SPC)
PV Photovoltaicqty QuantityRMU Ring Main UnitSFC Specific Fuel ConsumptionSHS Solar Hotwater SystemSOC Specific Oil ConsumptionSq km Square kilometreTA Technical AssistanceTAU Te Aponga Uira O Tumu-Te-Varovaro tC02 tonnes of CO2
THD Total Harmonic DistortionTOR Terms of ReferenceUNDP United Nations Development ProgrammeUNESCO United Nations Educational, Scientific and Cultural OrganisationV VoltW WattWTG Wind Turbine Generator
$ = NZ$ unless stated otherwise
iv

TABLE OF CONTENTS1 SUMMARY OF FINDINGS AND RECOMMENDATIONS............................................................................62 INTRODUCTION....................................................................................................9
2.1 PROJECT BACKGROUND AND OBJECTIVES...............................................................................92.2 METHODOLOGY...............................................................................................................10
3 AITUTAKI BACKGROUND.......................................................................................133.1 PHYSICAL DESCRIPTION AND POPULATION............................................................................133.2 LOCAL GOVERNMENT.......................................................................................................133.3 INFRASTRUCTURE............................................................................................................14
4 AITUTAKI POWER SUPPLY....................................................................................174.1 STRUCTURE AND ORGANISATION........................................................................................174.2 POWER STATION.............................................................................................................184.3 GENERATION..................................................................................................................194.4 HIGH VOLTAGE DISTRIBUTION...........................................................................................204.5 LOW VOLTAGE DISTRIBUTION............................................................................................234.6 FUEL HANDLING..............................................................................................................234.7 POWER QUALITY AND LOAD PROFILE...................................................................................244.8 CUSTOMER DISTRIBUTION AND TARIFF.................................................................................334.9 PRESENT RECOVERY TARIFF..............................................................................................35
5 POWER SECTOR PLAN.........................................................................................385.1 INSTITUTIONAL ARRANGEMENTS.........................................................................................385.2 LOAD FORECASTS...........................................................................................................395.3 SHORT TERM RECOMMENDATIONS......................................................................................41
5.3.1 Power Station.........................................................................................................................415.3.2 HV Distribution.......................................................................................................................425.3.3 LV Distribution........................................................................................................................435.3.4 Administration and Personnel.................................................................................................455.3.5 Demand Side Management (DSM)..........................................................................................465.3.6 Tariff.......................................................................................................................................47
5.4 MEDIUM TERM RECOMMENDATIONS....................................................................................495.4.1 Power Station.........................................................................................................................495.4.2 HV Distribution.......................................................................................................................495.4.3 LV Distribution........................................................................................................................505.4.4 Administration & Personnel....................................................................................................505.4.5 Demand Side Management....................................................................................................505.4.6 Tariff.......................................................................................................................................515.4.7 Renewable Energy..................................................................................................................515.4.8 Biomass..................................................................................................................................525.4.9 Biogas.....................................................................................................................................525.4.10 Wind...................................................................................................................................525.4.11 Solar...................................................................................................................................56
5.5 LONG TERM RECOMMENDATIONS........................................................................................585.5.1 Power Station, HV & LV Distribution.......................................................................................585.5.2 Administration & Personnel....................................................................................................585.5.3 Demand Side Management....................................................................................................585.5.4 Tariff.......................................................................................................................................595.5.5 Renewable Energy..................................................................................................................59
6 ANNEXES......................................................................................................60ANNEX A – TERMS OF REFERENCE.................................................................................................60ANNEX B – LIST OF PEOPLE CONSULTED.........................................................................................68ANNEX C – INCEPTION NOTE........................................................................................................69ANNEX D – DOCUMENTARY SOURCES.............................................................................................76ANNEX E – DEBRIEFING NOTE......................................................................................................77
v

1 SUMMARY OF F INDINGS AND RECOMMENDATIONS
This report is the result of investigation of the current power system on Aitutaki and institutional arrangements for the future direction of Aitutaki Power Supply (APS). The report outlines an overall power sector plan addressing short, medium and long term issues including use of renewable energy technologies to supplement or replace diesel generation.
Currently APS operates under the direction of a Central Government appointed interim board. To ensure provision of a reliable and efficient power system which will cater for Aitutaki’s continued economic development it is proposed ownership of APS would reside with CIIC who would be responsible for obtaining finance for utility development and for interfacing with other Government agencies. A MOU or contractual arrangement should be entered into with Te Aponga Uira O Tumu-Te-Varovaro (TAU) for technical and commercial support of APS but without TAU accepting responsibility for APS management or finances.
In the short term, replacement of the present diesel generation plant and upgrade of the HV and LV systems and bulk fuel storage is required to ensure provision of reliable supply and minimise environmental degradation through poor fuel and oil handling practises. Total expenditure for recommended interventions is close to $4,000,000. Staff training and service equipment should be provided as part of the refurbishment. Initiation of a wind monitoring programme by the Energy Division is underway and important to substantiate the available wind resource.
It is expected that in the medium term wind power can contribute close to 15% of energy requirements and that continued upgrading and refurbishment of the HV and LV systems will be completed. Initiation of demand side management programs aimed at energy efficiency should commence and develop to mitigate a potential doubling of energy consumption and peak load over the next decade.
For the longer term, technology improvements are expected to allow wind or solar to generate a larger percentage of total system power than is the case today but as both are based on intermittent sources, neither can provide 100% of generation without large scale energy storage. Externally provided biofuel appears to be the only option among existing commercially available technologies that can fully replace fossil fuel for power generation. Should low cost energy storage, wave energy conversion devices or OTEC based generation become commercially available, those technologies may become appropriate for Aitutaki.
Table 1-1 summarises the major findings and recommended interventions which form the basis of an overall power sector plan for Aitutaki Power Supply.
Table 1-1 Summary of Findings and Recommendations
Findings Short Term Medium Term Long Term
Power Station Old Blackstone generators are generally requiring extensive repairs and maintenance.
Install 4 x 320kW packaged gensets in new building with automatic control and new LV switchgear. Expand bulk fuel
Effectively manage routine maintenance of all plant and equipment.
Place particular emphasis on system planning. Gensets major
6

Power House is in need of refurbishment and modification. Bulk fuel storage inadequate.
storage from 60,000L to at least 160,000L with spill containment bunds.
Expenditure: $2,301,00
overhauls will be required.
HV Distribution
11kV in good condition. 3.3kV in poor and dangerous condition.
Upgrade all 3.3kV to 11kV.
Expenditure: $701,400
New substation #121, Piake and associated cabling. Expenditure: $170,800
Monitoring of load flows and system performance. Planning is essential
LV Distribution
Much of the overhead cabling is in poor and dangerous condition with undersized and jointed cabling. Voltage at some consumers is below acceptable levels.
Upgrade of priority areas to overhead ABC.
Expenditure: $700,000
Continued upgrading of remaining old LV. Expenditure: $356,500
Monitoring of load flows and system performance. Planning is essential
Administration and Personnel
In general APS is better managed than other outer island utilities in the region. Meter reading and billing system is mostly manual and not suitable. No formal staff training programme in place.
Implement computerised billing system. Carry out job and personnel evaluation and establish correct manning levels. Develop training programme in collaboration with TAU.
TAU to carry out annual audits of APS including financial, administration, operations, training and staffing.
Ongoing evaluation by TAU with particular attention to larger maintenance requirements.
Demand Side Management
Significant use of incandescent lighting, electric cooking appliances.
Some larger resort loads that could be scheduled.
Promote energy efficiency.
Investigate means of encouraging use of fluorescent lighting
Survey Solar hot water systems to determine suitability.
Develop more extensive DSM measures that continue the short term program but include auditing of large commercial customers. Various financing options should be examined.
Continued development of energy efficiency initiatives and load management
7

Power Quality Good with the rental set operating
Monitor parameters Continued monitoring and maintenance of power quality
Continued monitoring and maintenance of power quality
Tariff Full Cost Recovery Tariff - $0.77/kWh
Carry out a complete tariff assessment and formula for future tariff reviews.
Ongoing tariff reviews to ensure financial sustainability of APS.
Ongoing tariff reviews to ensure financial sustainability of APS.
Local Renewable Energy Resource
Wind power offers most potential in line with National Energy Policy
Commence on-site wind monitoring (installing Jul05)
Should wind monitoring prove a sufficient resource install up to 120kW of wind power.
Follow developments in new technologies particularly in energy storage.
The ADB Cook Islands Power Development Study of 1998 carried out an extensive evaluation of outer island power supplies and provides a baseline for comparison to current systems. Key statistics and a comparison to the current situation are shown in Table1-2. Of particular importance is the 63% increase in the current landed fuel price and full cost recovery tariff requirement of 73% over the 1998 figures whilst the billed tariff has only increased 25% for domestic and 3% for commercial. Future tariff structures will need to reflect the true cost of energy delivery in order to ensure sustainability of the power supply.
Whilst population has decreased approximately 17% power consumption has increased 95% since 1997. Commercial sales accounted for 33% of the total sales in 1997 however no account for 60% indicating the extensive economic development that has taken place in tourism in Aitutaki.
Table 1-2 Comparison of 1998 ADB study of Aitutaki and current study
Unit 1998 ADB Study
May 2005 % Change
Fuel Price Landed $/litre $0.52 $1.067 +63
Full Cost Recovery Tariff $/kWh $0.40 $0.77 +73
Domestic Tariff $/kWh $0.36 + $5/month
$0.45 ~25%
Commercial Tariff $/kWh $0.58 + $5/month
$0.60 ~3%
Population1 No. 2,357 (1991) 1,946(2001) -17
Installed Capacity kW 1,640 1,062 -35
Peak Load kW 420 570 +36
8

Supply Hours Hours 24 24
Power Supply staff number No. 10 13 +30
Commercial Customers No. 88 97 +10
Domestic Customers No. 584 623 +7
% Commercial Sales % 33 60 +27
Billed kWh p.a.2 kWh 1,469,037 2,860,802 +95
Specific Fuel Efficiency Litre/kWh
0.300 0.286 -5
Load Factor % 45 64 +19
Projected/Actual generation for 20043
kWh 2,801,505 3,239,971 +16
Projected/Actual peak load 20043
kW 628 578 -8
1. Census figures
2. 1997 ADB figures
3. 1998 ADB Study projected figures for 2004
9

2 INTRODUCTION
2.1 Project Background and Objectives
In June 2004 the Government of the Cook Islands (GoCI) decided to transfer control of the Aitutaki Power Supply (APS) from the Aitutaki Island Local Government to the Board of Te Aponga Uira (TAU) to take over the operation, management and financial control of the islands power supply. This power study funded by the New Zealand Government and executed by the Energy Division, Ministry of Works, GoCI aims to (1) assist the GoCI, TAU, the Aitutaki Island Local Government and other relevant stakeholders with the practical implementation of structural reform; (2) to provide a power sector plan recommending power system improvements in the short medium and long term; and (3) to investigate the feasibility of including renewable energy technologies
This project has five main objectives briefly outlined as follows:-
a) Determine short term improvements of the existing power system
In view of the current serious limitations in generation capacity and distribution recommend short term interventions to ensure reliability of supply and address longer term capacity requirements.
b) Determine medium to long term feasibility of supplementing current diesel power systems with renewable energy
Investigations of appropriate feasible renewable energy technologies which could supplement the diesel power system.
c) Preliminary Environmental Impact Assessment
Examination of environmental impacts of existing and proposed interventions for the power system.
d) Power Sector Plan
Formulation of a plan encompassing project recommendations which addresses short, medium and long term development of the power system. Issues addressed include:-
Operational Costs and Budgets
Capital Budgets
Tariff Structure
Demand Growth
Organisational requirements
Human resources development
Environmental sustainability
Demand side management strategies
Reliability
10

e) Institutional Arrangement Report
Review past and existing arrangements and investigate appropriate institutional arrangements for the integration of Aitutaki Power Supply into Te Aponga Uira.
For detailed Terms of Reference (TOR) please refer to Annex A.
2.2 Methodology
Project execution was undertaken in the following four stages.
Stage 1: Inception Note/Project Preparation.
Review of relevant background material, studies and investigations already undertaken.
Identify key stakeholders.
Preparation of inception note.
Develop field visit schedule in consultation with stakeholders.
Stage 2: Field Visit; 21st – 30th May 2005
Consultants Bruce Clay, Herb Wade and Dick Watling participated in the field visit to Rarotonga and Aitutaki. The field visit encompassed the following;
Visit to Rarotonga:
Discussions with the Energy Division, Ministry of Works; TAU and relevant Government Ministries on existing arrangements, history, plans and the effects of the recent cyclones on APS.
Following up Stage 1 information gathering with relevant Government Departments, organisations and project stakeholders.
Visit to Aitutaki:
Meeting with stakeholders including Aitutaki Island Council, Aronga Mana, Aitutaki Island Secretary, Interim Board Members and Manager APS and community groups to discuss the structure of APS and survey qualitatively the socio-economics of the various consumers and how these impact power supply services.
Compiled a listing of existing power generation and control equipment, grid composition and their operating status.
Gather available power system data for existing diesel power systems. Specifically looking at operational regime information, power production, daily load structure and its variability, and fuel consumption.
Using a power quality analysis recorder log power data during the island visit. Data logged included phase voltages and currents, active and reactive power and energy and power factor. Collected data is used in substantiating/correlating existing data.
Investigated potential local energy resources and their technical feasibility for using in future power generation development.
11

Assessed relevant physical and institutional conditions that may impact power generation development. These included; geographic characteristics, existing infrastructure, utility capabilities, workforce and construction equipment availability.
Gathered information for a preliminary Environmental Impact Assessment based on the GoCI EIA procedures/guidelines and the Asian Development Bank Environmental Guidelines for Selected Industrial and Power Development Projects (1993). Information included relevant material pertaining to; land use, noise, biological resources, visual resources, soil erosion and water quality, public health and safety, cultural and ethnographic resources, socio-economics, public services and infrastructure, solid and hazardous wastes, air quality and climate.
Stage 3: Preliminary Analysis/Debriefing Note
Prepared a debriefing note providing recommendations and conclusions based on preliminary analysis and findings. This note mapped the path of the projects analysis and report generation.
The debriefing note was presented and discussed with the Director of the Energy Division, Ministry of Works, CEO of TAU, Manager of APS, Aitutaki Island Secretary, Aitutaki Island Council, Aronga Mana and relevant stakeholders.
Stage 4: Detailed Analysis and Power Sector/Feasibility Report Preparation
Description of project background and immediate objectives, based on the Government of the Cook Islands recognition of the potential contribution renewable energy technologies can make toward economic and social development and the environment. Reference was made to the project’s objectives, concept and beneficiaries and how it ties in to relevant studies and those currently in process.
Socio-economic consequence description that is based on field qualitative survey and where available, existing survey data.
A power Sector description was generated after analysis of gathered data. This description highlights the various roles on a national and local community level of relevant public authorities, institutional and legal frameworks in place for the power sector, standards, ownership, Government policies, plans, budgets and objectives.
Examined, described and assessed the trends in electricity tariff and demand based on gathered information including the Cook Islands National Energy Policy (2003) and its influence on the feasibility of introducing renewable energy technologies to Aitutaki. Procedures for accommodating changes in tariff structure were investigated.
Analysed existing power and load structure data in association with field recorded power analysis logged data and investigated present and potential power demand and loading structure. Forecasts were prepared relating to medium and long-term power requirements to assist in further feasibility studies.
Based on the field visit and collected data relating to existing power generation, short term options were examined to improve efficiencies in diesel generation and distribution. Options include supply sided, distribution and demand side management activities.
Local energy resource preliminary assessment that was based on available resource data and field visit and evaluated solar thermal, solar photovoltaic, wind and biomass and their future potentials for Aitutaki power generation.
Assessment of project engineering for Aitutaki’s power system when considering short, medium and long term options. These will consider not only the technologies applicable to generation and distribution but also civil, operational and maintenance requirements with particular consideration to difficulties in operating and maintaining power systems in remote locations.
12

The consultants will investigate organisational requirements for power plant construction/upgrade, operation and maintenance. Recommendations for roles and responsibilities of involved parties including implementing agencies, relevant local and National authorities will be developed by the consultants.
Training and technical assistance programmes will be outlined. These will include training programme target groups, content and delivery. Recommendations for technical assistance to develop the island power system will be documented with reference to specifications of experts, their role and timing.
A preliminary Environmental Impact Assessment of the short, medium and long term power supply options will be carried out. The assessment will be based on Asian Development Bank Environmental Guidelines for Selected Industrial and Power Development Projects (1993).
For each power supply option, capital and operational budgets will be prepared. Based on budgets and cash flows, an economic and financial analysis (including sensitivity analysis) will be performed on the various options as part of the overall feasibility assessment. The consultants will undertake analysis of associated assumptions and risks.
As a major project outcome, the consultants will develop a power sector plan for Aitutaki. This plan will encompass the synthesis of project recommendations and power supply options feasibilities consistent with the Cook Islands National Energy Policy.
Former, existing and planned institutional arrangements for the management, operation, maintenance etc of the APS will be reviewed and in line with project findings if required recommendations for improvements or alternatives will be made.
Several previous studies and reports are particularly relevant to this project and were relied on among others for information regarding power sector, institutional structure, background to power systems on each of the islands, renewable energy resource data and EIA guidelines. These include but were not limited to:
Cook Islands National Energy Policy 2003
Environment Act 2003
Environment Service Environmental Significance Declaration
2001 Census
Budget Policy Statement 2004-2005
Outer Island Budget Outputs 2004-2005
GEF/ UNDP Pacific Islands Renewable Energy Project (PIREP) Draft Cook Islands National Report May 2004
ADB Cook Islands Power Development Study 1998
ADB EIA Guidelines for Power Projects 1993
Conditions of Supply and Service and Installation Rules for the Supply of Electricity, TAU 1997
For a detailed list of all the documentary sources consulted please refer to Annex D.
13

3 A ITUTAKI BACKGROUND
3.1 Physical Description and Population
Aitutaki is the Northern most of the Southern Cook Islands located approximately 140km North of Rarotonga. With an area of 18.4sq km Aitutaki is the 6th largest in area of the Cook Islands but ranks second in population which was enumerated as 1,946 in the December 2001 National Census. The North of the island is generally more volcanic in origin with steeper terrain and the highest point at Maungepu of 124 metres.
Aitutaki comprises eight districts being; Amuri, Arutanga, Anaiunga, Avanui, Taravao, Tautu, Vaipae and Vaitupa. A total of 435 private dwelling were noted in the December 2001 National Census.
Considered one of the most beautiful islands in the Cook Islands with an extensive lagoon and smaller uninhabited islets, Aitutaki has developed into the Cook Island’s major tourist destination second only to Rarotonga. This is reflected in employment and energy consumption. As of the 2001 Census, a little more than 50% of employment was in the Trade, Restaurants and Accommodation (tourism) industry compared to 25% in Rarotonga and 10% in the remaining islands. In power consumption, commercial consumers, including resorts, account for 60% of the total. Power supply reliability and sustainability is therefore a significant issue in Aitutaki’s economic well being.
3.2 Local Government
The local governing body of the island is the Aitutaki Island Council. The Council composition is a Mayor and five councillors elected every three years. Included in the Island Council as ex-officio members without voting rights are Arikis, a representative of the Aronga Mana, the Member of Parliament and the Central Government Representative.
A Secretary of Island Administration appointed by the GoCI Cabinet through consultations with the Island Council, is responsible for managing the functions of the Island Administration (IA) and works closely with the Mayor and Island Council in the administration and development of the island.
Map 3-1 Aitutaki
Source – New Zealand Department of Survey & Land Information
14

3.3 Infrastructure
In comparison to other islands in the Southern Group Aitutaki has good infrastructure which reflects the economic development the island has seen over the last decade particularly through the tourism industry.
Much of the main road circumnavigating the island is sealed with those unsealed sections in the West and South being presently upgraded with paving utilising “lagoon mud” which compacts to a fair quality load bearing surface.
The Aitutaki International Airport has a recently sealed main runway capable of handling Boeing 737 jets. There are scheduled daily services to Rarotonga (45minutes) and neighbouring islands serviced by Air Rarotonga’s Banderante and Saab turbo prop aircraft.
Mains water supply is primarily from a water gallery in the North East of Vaipeka. Electric pumps supply water to elevated reservoirs in the centre of the island at a height above sea level of approximately 80 metres. Salinity and capacity of the mains water supply is an ongoing problem with many households and smaller tourism facilities relying on rainwater catchment for potable water. Pacific Resort has its own water gallery whilst Aitutaki Lagoon Resort and Spa on Akitua Is. operates a desalination unit. Discussions with the Island Secretary (IS) indicated a possible new water gallery to be developed toward the airport. Residents are not charged for water supply which does not encourage efficient use.
A monthly New Zealand – Rarotonga – Aitutaki shipping service operated by Reef Shipping supplies the island with major building materials and consumables. Cargo is unloaded off-shore and ferried in lighters to the main wharves at Arutanga. As the island can handle sea containers, cargos are consolidated where possible in 20 foot containers. Two mobile cranes at the wharf handle containers and cargo from the lighters with a side lifter truck available for delivering containers around the island. Power station fuel is shipped in 20 foot container tanks and delivered to the power station on trailers for discharge into bulk tanks.
Private firms and government departments have a range of heavy equipment including graders, dump trucks, bulldozers, loaders, excavators, forklifts, cement trucks, and back hoes. There is enough equipment for any power station developments recommended in this report apart from the requirement of a smaller truck with hydraulic boom hoist that is needed by Aitutaki Power Supply for overhead line maintenance and equipment handling.
Picture 3-1 Mobile Crane and Forklift
Photo: Bruce Clay, 2005
15

Picture 3-2 and 3-3 Arutanga Wharves
Photo: Bruce Clay, Herb Wade 2005
Telecom Cook Islands provides full direct dial and data services via satellite with underground reticulation to the majority of properties. Equipment is powered from the island electricity grid with backup from the hospital’s standby diesel generator.
Tourism is the major economic activity on the island with a current total of 236 rooms1. The Aitutaki Tourism Association has set a level of 250 rooms as the maximum sustainable given labour availability, water and power supply constraints. It appears this number of rooms will be surpassed in the next 24 months with proposed developments in excess of 100 rooms. Identified areas of development include the Anaunga coastline and the South West coastline from the airport to Ootu. Depending in supply options these developments could have significant effect on existing water and power supplies. The Island Secretary has indicated that energy supply must not be a hindrance to the advancement of development on Aitutaki.
Picture 3-5 and 3-6 Aitutaki Resorts
1 From discussion with Mike Henry representing the Aitutaki Tourism Association
Picture 3-4 Aitutaki Resort
Photo: Herb Wade 2005
16

Photo: Herb Wade, 2005
17

4 A ITUTAKI POWER SUPPLY
4.1 Structure and Organisation
Aitutaki Power Supply (APS) currently operates under the direction of a Central Government appointed interim board. This interim board will remain in control until institutional arrangements are formalised for the future direction of APS.
Power generation is by way of diesel powered gensets with underground high voltage (HV) distribution and a combination of overhead and underground low voltage (LV) distribution. Power is available 24 hours a day. APS is the only public power generator on Aitutaki with the two largest resorts and a number of smaller resorts having standby diesel generation capacity. These standby generators are not configured to feed into the island grid.
Connected customers and corresponding tariffs as of May 2005 are listed in table 4-1.
Table 4-1 Connected Customers and Tariffs
Customer No. Connected Tariff (VAT exclusive)
Domestic/Government 623 $0.45 per unit
Commercial 95 $0.60 per unit for 1st 1000units per month then $0.45 per unit
Resorts 2 $0.60 per unit
Note: No. connected as of Dec2004. Tariff as of May2005. 1 unit being 1 kWh.
The internal structure of the Aitutaki utility appears reasonable given the physical plant that must be operated and maintained. As with most small utilities, personnel titles are only an indicator of their actual work since almost everyone must perform multiple duties and must stand in for other workers who are sick or on leave. The table indicates the current staffing situation by job title and years of service.
Since the plant provides 24 hour power, at least three operator shifts are needed and with the current equipment, multiple operators are sometimes required, one at the console and one at the engine. Operators also perform meter-reading duties (the position of meter-reader is vacant at this time) and light mechanic duties as well as the general power house duties of plant operation. From time to time casual labour has been needed. In recent years, casual labourers have effectively become permanent wage earners under the utility, a practice that needs to be reviewed.
Table 4-2 Personnel
Title Years of Service
Manager 22
Linesman/Supervisor 23
Linesman 4
Mechanic 11
Station Mechanic 3
Mechanic 2
Operator 15
Operator 7
Operator 6
Operator 6
Operator 5
Admin Officer 8
Admin Assistant New
18

In general, the team found the Aitutaki power system to be better managed than most outer island utilities around the Pacific and its primary problems are seen to be associated with inadequate resources provided by the owners of the system for generation, distribution and maintenance and not due to poor day to day management. We note that the utility staff has provided generally reliable and good quality power for many years even though they have had to use second hand equipment for which spare parts have been increasingly difficult to obtain and have had to perform manually and skilfully many operating functions that with modern equipment would be automatic.
The system for meter reading and billing was adequate for the smaller customer base some years ago but today with around 800 meters in place, the mostly manual system needs to be reviewed and computers better integrated into the system both in order to shorten the time needed to prepare bills, read meters and provide invoices and to reduce the errors that invariably arise in manually calculated billings, particularly for commercial customers where multiple tariff rates may have to be calculated. The accounting system uses Quick Books, an excellent small business accounting system and one that appears to be providing good financial information to the utility but it does not provide many of the features needed for utility use and is not used to generate invoices, they are prepared entirely by hand over a two week period that uses over 20 books of invoices per month. The team notes that the only record of meter readings and kWh usage appears on the original meter reader/invoice paper. Nothing is available from the computer except the financial records. This makes analysis of individual customer power use awkward and time consuming and that is essential data for understanding the power system needs, the effect of tariffs on utility finances and how tariffs affect the customers.
4.2 Power Station
Aitutaki Power Station is located between Vaipae and Arutanga on Crown Land adjacent to the Island Administration infrastructure yards.
Originally constructed in the 1970s with extensions over the past twenty years, the power house is a concrete, timber structure of approximately 450m2 that is manned 24 hours a day, seven days a week. Whilst the structure itself appears to be sound, the roofing, cladding and facilities are in a general state of disrepair. The majority of the roof is original construction asbestos corrugated sheet and the station operators report that it leaks. The power house houses the generating plant, LV and HV switchgears and step up transformers.
Picture 4-1 Aitutaki Power Station
Photo: Bruce Clay, Herb Wade 2005
19

The generator and switchgear control area has no separation from the power station main generation floor and as such operators and control equipment are subject to high levels of noise and air pollution from the generators. Toilet and washroom facilities are extremely poor with associated hygienic concerns. Main generation floor drainage runs to an unlined pit at the rear of the station and shows considerable oil contamination.
A sperate building houses the operations and management office and store room. Accounting and billing is carried out in the Island Administration offices in Arutanga.
4.3 Generation
Four Blackstone diesel generators are installed in the power station with a rental packaged Caterpillar generator located adjacent the power station building. The 600kW Caterpillar set was brought into service on the 26th April 2005 as an emergency measure to support the ailing Blackstone’s generators of which only one is operational and another appearing to require a major overhaul.
Generation capacity is listed in table 4-3.
Table 4-3 Installed Generation Capacity
Generator Model - Year Rated kW Status
GEN #1 Blackstone ERS8 - 1963 462 Operating to 90% capacity
GEN #2 Blackstone ERS8 - 1963 462 Under major overhaul
GEN #3 Not installed - -
GEN #4 Blackstone EV8 - 1950 240 Out of service – not connected to LV Bus
GEN #5 Blackstone EV8 - 1950 240 Requiring major overhaul
Rental Cat V12 Packaged Set 600 On load continuously
The Caterpillar set has been connected to the Low Voltage (LV) busbar at the Gen #3 and Gen #4 position.
The three connected Blackstone sets are controlled from a manual synchronising panel however the rental Caterpillar set has no internal synchronising facility and other generators must be synchronized with it if additional capacity is needed. Present operational procedure is to run the Caterpillar set continuously with Gen #1 brought in to help cover peak load in the early evening for approximately two hours.
20

Picture 4-2 & 4-3 Generator and Control Panel
Photo: Bruce Clay, 2005
4.4 High Voltage Distribution
Prior to 1992, the islands distribution was all by 3.3kV circuits. In 1992 an AusAID project upgraded much of the 3.3kV distribution to 11kV with new power station switchgear, step up transformer, cables, substation transformers and switchgear. Subsequent installation of more 11kV cabling and substations has created an 11KV ring main plus a new feeder to the newly established Aitutaki Waste Facility.
Picture 4-4 Power Station HV Switchgear & 3.3kV Substation Switchgear
Photo: Bruce Clay 2005
21

The LV 415V bus feeds an 11kV/600kVA and a 3.3kV/200kVA step up transformer cabled to a 12kV rated switchboard. Four of the six HV switchgear panels are used for 11kV and two for 3.3kV. A separate ring main unit (RMU) is used to split the 3.3kV feed from the HV switchboard to two further 3.3kV feeders.
Whilst the 11kV cabling is in good condition (the first cable fault since installation occurring during the field visit) the 3.3kV cabling is old with insulation testing showing degradation to unsatisfactory levels. This causes numerous cable faults and is an ongoing problem to the power station operators.
Substations are spacious concrete structures with corrugated iron roofs and timber doors. Whilst most are of considerable age the structures are generally sound requiring only some remedial work on roofing, penetrations and access security. Whilst 11kV substations are equipped with modern switchgear all the 3.3kVA (with exception of #115) employ exposed knife style switches which are extremely hazardous to operators. Table 4-4 lists all connected sub-stations.
The HV distribution network consists of a major 11kV ring main with a spur feeding the Airport, Ootu and Akita plus another feeder to the Waste/Recycle Facility. Three feeders supply the older 3.3kV substations. Figure 4-1 shows the HV layout.
Table 4-4 Substations
Sub No. Name Voltage (kV)
Capacity (kVA)
100 Vaipae 3.3 100
101 Tautu 3.3 100
102 Vaitekea 3.3 50
103 Hospital 3.3 50
104 Nikaupara 3.3 50
105 Ararura 11 200
106 S.D.A. 3.3 50
107 Arutanga 11 100
108 Amuri 11 100
109 Rapae 11 100
110 Apiripiri 11 50
111 Airport 11 50
112 Akitua 11 500
113 Vaipeka 3.3 25
114 Ooka 3.3 25
115 Water Supply 3.3 30
116 Anaunga 11 50
117 Ootu 11 50
118 Fisheries Operating at LV
119 Pacific Resort 11 200
22

Figure 4-1 Aitutaki High Voltage Distribution Network
23

4.5 Low Voltage DistributionThe majority of low voltage distribution is overhead with some underground reticulation in newer extensions.
Much of the overhead cabling in the Amuri District is 25sqmm insulated Copper and is in reasonable condition. However, elsewhere, particularly in the Southern areas of the island, very old 16 and 10 sqmm cabling is in poor condition with many joints appears undersized for the loading and requires replacement. The ADB funded Cook Is. Power Study of 1998 recommended urgent complete replacement of the LV system. To date only some of the LV has been replaced in the Amuri District.
Most power poles are concrete and in reasonable condition however many need to be moved back to the vertical.
Many cross arms and insulators are in need of attention. Some cross arms show signs of rot and cables have fallen off insulators or insulators are damaged.
Underground LV cabling is 16 and 25sqmm Copper with pillar box type consumer connection and is in satisfactory condition.
4.6 Fuel Handling
Diesel fuel and lubricating oil is currently purchased from Reef Shipping’s petroleum marketing division and is supplied via a monthly shipping service from New Zealand. The purchase arrangements for fuel are currently under review as the contract with Reef Shipping has expired.
Fuel is shipped in 20,000 litre (L) containerised tanks which are off loaded to the island lighter and then lifted onto trailers for delivery to the power station. At the power station fuel is pumped from the shipping containers to two 30,000 L bulk tanks and a previously used 16,000 L shipping tank.
As monthly shipments are in the order of 80,000 L (4 shipping tanks) there is insufficient bulk storage requiring that at least one of the 20,000 L shipping tanks is kept adjacent the power station after each delivery and returned the following month after being discharged during the period between shipments.
The shipping and handling arrangements appear to work well and the station operators are pleased at the quality of fuel delivered and the relative ease of handling the shipping tanks. The major concern is the lack of bulk storage. Present handling facilities allow barely a month’s fuel storage which places the power supply at significant risk should there be a delay in the monthly shipments.
Bulk Storage tanks have no spill containment and pose an environmental threat.
Picture 4-5 LV Overhead
Photo: Bruce Clay, 2005
24

Picture 4-5 Bulk Fuel Storage & Container Tank
Photo: Bruce Clay, 2004
4.7 Power Quality and Load Profile
A Metrel Power Quality Analyser model MI2192 was used to record data from 21/5/05 12:45 – 26/5/05 14:15. Iteration period was 60 seconds with logging of the variables listed in Table 4-5.
Table 4-5 Logged Power Variables
Phase Voltages; V1,V2,V3 in Volts (V)
Phase Currents; I1,I2,I3 in Amps (A)
Frequency in Hertz (Hz)
Phase and Total Power in kilo Volt Amps (kVA)
Reactive Power in kilo Volts Amps Reactive (kVAR)
Power Factor (0 – 1 inductive or reactive)
Current and Voltage Total Harmonic Distortion in % (THD)
3rd,5th and 7th Phase Current and Voltage Harmonics in %Logged data is analysed using Powerlink software
Due to the construction of the LV switchboard and busbar shrouding, the analyser transducers were applied at the connection point of the Caterpillar rental set. This was not optimum but to have gained access to the main busbar would have required shutting down of the bus, with subsequent disruption to supply for an extended period during connection and disconnection of the transducers. The measurement made on just the Caterpillar leads is considered quite adequate as the rental set
25

was on-line continuously and only during the evening peaks of around 2 hours was a second generator brought on-line. During the time with a second generator on load its contribution was recorded manually and added to the analyser data.
General conclusions from studying the logged power data are as follows:-
With the Caterpillar hire generator supplemented by the one Blackstone set that is still, operational the present situation could be described as adequate but fragile.
The current load profile, shown in Figure4-2 appears consistent with little daily variance from the pattern. The major load of around 550 – 600 kW coming on in the early evening around 18.00 and tapering of after 1-2 hours to the lowest level averaging around 240 kW in the early hours of the morning rising again quite rapidly at 6 am to around 400 kW and operating throughout the day at this level. This pattern appears to be very consistent apart from Sunday where the consumption dropped noticeably after the morning peak rising back again to the norm in the late afternoon. We attribute this to people gathering at churches / Halls and outdoor venues for religious and social functions.
Examination of power station logs for the period January 2004 to date show a maximum noted peak load in the range of 570kW (Jan05) – 420kW (Feb04). Minimum loading was noted in the range 340kW (Jan05) – 250kW (Feb04)
In general the quality of the power generated is very good and the load profile is regular with no unexpected or unusual loadings or inconsistencies appearing during the period of the test.
Voltage:
The Voltage is steady with little fluctuation and remains generally in the range 240-245 Volts. Over the period logged it was generally at 242 Volts + or - 1.5%.
Line 2/Yellow phase was throughout the period of the test showing as slightly higher by 1 – 2 volts on average than the other phases.
This higher voltage does not appear to be caused by lighter loadings than the other phases these show as being evenly balanced throughout the day.
Although this Voltage variation is within the 5% maximum out of balance allowed by most motor manufacturers it should be addressed and bought into line with the other phases.
Frequency:
The frequency remained stable at 50.18 Hz with minor fluctuations during the test period both with the caterpillar unit running alone and with the supply being supplemented by the Blackstone. The variation when the Blackstone came on and off line was negligible and was visible on the charts as a small fluctuation of .1 of a percent only.
Harmonics:
The harmonics profile showed no arrears for concern with general background harmonics only occurring at a low level throughout the test period increasing slightly during peak loadings the spikes recorded coincide with the Blackstone generator coming on line. We can see no potential for concern or any action required regarding harmonics.
26

Power:
The Average Peak Power demand during logging was approximately 540kW and does not appear to vary greatly from day to day. See General comments. However the peak instantaneous demands i.e. motor starting or other loads during the evening peak can be up to 700kW and this needs to be taken into consideration for any generation upgrading and DSM.
Power Factor:
In general the power factor is very good staying above .9 almost continuously and above .96 more than 50% of the time. There are however a number of major dips (of very short duration) below .9 that appears on the power factor chart when analysing peaks and averages. This appears on full investigation to be brought about by 3 phase Electric motors starting probably Direct on Line (DOL) and without adequate power factor correction equipment. Aitutaki Power Authority should look into this problem and ensure that all electric motors are fitted with correctly sized & Operational Power Factor Correction Equipment.
kVA-kW: (Apparent Power kVA- True Power kW)
The Kilowatt kVA ratio is good in this case as is expected with the Power factor at .96 for most of the time however to ensure maximum tariff return for the power generated (especially with the present high fuel cost) the Authority could consider checks on major commercial installations to ensure that needed power factor correction equipment is installed and operating correctly.
27

Figure 4-2 Load Profile
0
100
200
300
400
500
600
700
21.05.2005 13:00:00
21.05.2005 19:40:00
22.05.2005 02:20:00
22.05.2005 09:00:00
22.05.2005 15:40:00
22.05.2005 22:20:00
23.05.2005 05:00:00
23.05.2005 11:40:00
23.05.2005 18:20:00
24.05.2005 01:00:00
24.05.2005 07:40:00
24.05.2005 14:20:00
24.05.2005 21:00:00
25.05.2005 03:40:00
25.05.2005 10:20:00
25.05.2005 17:00:00
25.05.2005 23:40:00
26.05.2005 06:20:00
26.05.2005 13:00:00
Tota
l Pow
er
Pt+ (kW) Avg
Generator Taken out of Service
Generator Returned to Service 14:45
28

Figure 4-3 Phase Voltages
29

Figure 4-4 Frequency
30

Figure 4-5 Harmonics
31

Figure 4-7 Logged Power Factor
32

Figure 4-8 Logged Average kVA&kW
0
100
200
300
400
500
600
21.05.2005 13:00:00
21.05.2005 18:00:00
21.05.2005 23:00:00
22.05.2005 04:00:00
22.05.2005 09:00:00
22.05.2005 14:00:00
22.05.2005 19:00:00
23.05.2005 00:00:00
23.05.2005 05:00:00
23.05.2005 10:00:00
23.05.2005 15:00:00
23.05.2005 20:00:00
24.05.2005 01:00:00
24.05.2005 06:00:00
24.05.2005 11:00:00
24.05.2005 16:00:00
24.05.2005 21:00:00
25.05.2005 02:00:00
25.05.2005 07:00:00
25.05.2005 12:00:00
25.05.2005 17:00:00
25.05.2005 22:00:00
26.05.2005 03:00:00
26.05.2005 08:00:00
26.05.2005 13:00:00
KVA
-KW
St+ (kVA) Avg Pt+ (kW) Avg
33

4.8 Customer Distribution and Tariff
As of Dec 2004 there were a total of 740 customers comprising:-
623 Domestic (including Churches)
95 Commercial
2 Resort
20 Government (Billed as domestic)
From a tariff point of view, there are three classes of customers, the two large resorts, commercial customers and domestic or government customers. Current tariffs have domestic and government customers on a flat rate of $0.45 per unit, commercial customers pay $0.60 per unit for the first 1000 units and $0.45 per unit for those used in excess of the base 1000. While the APS was operated by the Island Council, the Resorts negotiated a tariff of $0.47 for the first 50,000 units and $0.40 for those units in excess of 50,000 but this was increased by the new Board on April 20, 2005, to a flat rate for the two large resorts of $0.60 per kWh. These current tariffs and class contribution to annual sales are shown in table 4-6 below.
Table 4-6 Tariff as at May 2005 and % of Sales
Customer Class Tariff (billed monthly) % of Sales(1)
Domestic (incl. Govt. & Churches) $0.45/kWh 40%
Commercial $0.60/kWh for first 1000kWh then $0.45/kWh thereafter 25%
Resorts (Pacific and Aitutaki Lagoon) $0.60/kWh 35%
1. Calendar Year 2004
In 2004, the two large resorts together paid about $43,000 per month for electricity, domestic and government customers about $43,500 per month and commercial customers about $27,500 per month for a total of about $114,000 per month. The customer distribution (2004) as regards monthly usage is shown on the tables on the next page. It is noted that in the commercial sector the great majority of customers (86 out of the 97 total commercial customers) use less than 1000 kWh/month and therefore pay all electricity at $0.60 per unit. The larger Akitua resort averages less than 51,000 kWh/month and the Pacific Resort never reaches 50,000 kWh/month with its average usage of about 33,000 kWh/month; so in 2004 the resorts were effectively paying $0.47 per kWh. That tariff structure resulted in the unusual situation of the many small commercial operators on Aitutaki subsidizing the two large resorts. Since the actual cost of delivering a unit of electrical service is almost certainly higher than $0.47, government and aid donors have in essence been subsidizing the large resorts about equally with the domestic users. The new tariff introduced in April 2005 under the new Board corrects this inequality.
In 2004, around 88% of Domestic customers used less than 225 units per month with an average per household usage of about 145 kWh/month, an amount sufficient for a full range of household appliances including TV, fridge, fans and small kitchen appliances but little in the way of air conditioning, electric water heating or electric cooking. Discussions with islanders indicate that this is in fact generally the norm for households on Aitutaki but without actual survey data the
34

household energy patterns can only be estimated. A household survey scheduled for later in 2005 will provide detailed appliance ownership information but that information will not be available in time for use in this study.
Figure 4-8 shows the distribution of household usage in 2004 with the exception of two households that are using well over 1000 kWh/month and are off the upper scale of the graph.
Figure 4-8 Distribution of monthly kWh usage for Aitutaki Households
Commercial customers in the lower usage group are mainly neighbourhood shops, many of which are open only during the day. The group of users from 200 - 500 kWh per month are mainly large shops with multiple refrigerators and freezers and a few small tourist accommodations. The larger users include freezer facilities, telecom and tourist oriented establishments. The two large resorts are not shown since they are in the range 15,000 to 50,000 kWh/month and far off scale of the graph. They are treated as a special class of commercial consumer by the APS.
35

Figure 4-9 – kWh per month Usage distribution among commercial customers in Aitutaki
Distribution of Commercial Customers
0
5
10
15
20
25
30
1 3 5 7 9 11 13 15 17 19 21 23 25 27 29 31 33 35 37 39 41 43 45 47 49 51 53 55 57hundreds of kWh/month
Num
ber o
f Cus
tom
ers
With the exception of water pumping and health services, government users are modest users of electricity in the same range as households and have the same tariff as domestic consumers.
4.9 Present Recovery Tariff
The full cost and operations and maintenance only recovery tariffs for APS were calculated using data for the calendar year 2004 derived from the power station logs and financial statements. The tariff was based on a 15 year (project life) break even Net Present Value (NPV) at a 6% discount rate. Tariffs are exclusive of VAT.
Full Cost Recovery Tariff (Including Capital) $0.77/kWh
Operations and Maintenance Cost Recovery Tariff $0.54/kWh
To confirm the calculations by the consultants, system modelling with Homer2 was carried out and calculated a full cost of generated energy of $0.65/kWh which equates to $0.75/kWh full cost recovery tariff based on the technical and non-technical losses of 13.3%. With no capital cost included Homer calculated a cost of energy of $0.44/kWh which equates to a recovery tariff of $0.51/kWh. Homer results therefore provide a reasonable validation of the Consultant’s calculated recovery tariffs.
2 Homer is an optimisation modelling software (Version 2.09 Feb 2004) for distributed power. It is developed by the National Renewable Energy Laboratory. www.nrel.gov/homer
36

The following table 4-7 for the 12 month period January 2004 to December 2004 shows the technical operating data obtained from the power station logs. The months of June and July were combined as no July power station log could be located.
Table 4-7 Operational Data for Aitutaki Power Supply Jan04-Dec04
Period Generated Sold Loss Fuel S.F.C. Oil S.O.C.
(kWh) (kWh) (kWh) (litres) (kWh/l) (litres) (kWh/l)
Jan-04 269269 262766 6503 74491 3.61 255 1056
Feb-04 253877 240850 13027 74431 3.41 798 318
Mar-04 275775 231655 44120 77989 3.54 720 383
Apr-04 276983 241838 35145 76593 3.62 695 399
May-04 273348 233691 39657 78945 3.46 330 828
Jun-04 261900 247436 14464 75216 3.48 355 738
Jul-04 261900 211936 49964 72057 3.63 355 738
Aug-04 267707 241917 25790 76377 3.51 660 406
Sep-04 264182 220806 43376 75184 3.51 800 330
Oct-04 272012 237381 34631 80412 3.38 745 365
Nov-04 274586 254054 20532 83047 3.31 470 584
Dec-04 288433 236473 51960 81842 3.52 435 663
Totals 3239972 2860802 379170 926584 6618
Monthly Avg. 269998 238400 31597 77215 3.50 552 567
NB. June and July data averaged where necessary.
Fuel cost used in tariff analysis was provided by APS and was calculated as per table 4-8 and based on the costs for the shipment received 16th May 2005.
Table 4-8 Diesel Fuel Cost May 2005
$/litre
Reef Petroleum Diesel Fuel Price 1.036
Aitutaki Cartage 0.010
Aitutaki Port Charges 0.021
Total Fuel Cost $ 1.067
Personnel, maintenance and other operating expense information were gathered from the APS accounting records for financial year ending June 2004 as shown in table 4-9.
37

Table 4-9 Operating & Maintenance Costs
Cost Amount Comments
Personnel $ 284,111
Maintenance $ 139,532 Incl. lubricating oil
Admin Telecom & Consumables $ 26,822
Total $ 450,465
Estimated full capital costs for power station and distribution are listed in table 4-10. These costs represent the costs at current value to build a new power station and distribution system to service the island to the same extent as present.
Table 4-10 APS Capital Costs
Component Capital Cost
Power Station including generators, LV switchgear, buildings, fuel storage $2,301,000
HV Distribution including substations and power station transformers and HV switchgear $3,038,320
LV Distribution $900,270
Vehicles, tools and test equipment, computers, office equipment $168,000
Total $6,407,590
NB. Costs where based on current market values with allowance for transport to site from point of origin and installation
38

5 POWER SECTOR PLAN
Aitutaki Power Supply has suffered in recent times from limited resources, particularly financial, due to increasing fuel prices which have not been reflected by tariff increases. This has impacted in its ability to maintain equipment and provide a reliable supply. Urgent attention is required for investment in generation plant and distribution. As commented in meetings with members of the Island Council and Island Secretary; “Energy must not be a hindrance to the advancement of development of Aitutaki”. In the power sectors present state it will indeed be a hindrance to development.
5.1 Institutional Arrangements
The Aitutaki power system has operated under the Cook Islands Electric Power Supply (EPS), under the Ministry of Energy, under the Ministry of Outer Islands Development and under the Island Council and is now operating under an independent Board of Directors essentially under the CIIC.
From the point of view of providing reliable power while maintaining efficient power system operation and maintenance it is clear that the sharing of technical, personnel and other resources with TAU can be very beneficial to the Aitutaki power system. However, from earlier experience it is also clear that attempting to actually manage the island power system from Rarotonga is difficult, expensive and inefficient. Also, it is not reasonable for the TAU to assume financial responsibility for Aitutaki operations since it may be impossible for all the costs of Aitutaki operations to be borne by the Aitutaki customer base and therefore Rarotonga customers would in effect have to subsidise some of the Aitutaki operational costs. Therefore an arrangement is proposed whereby the technical and commercial resources can be made available to the APS under an MOU or contractual arrangement but without TAU accepting responsibility for APS management or finances.
Ownership of APS resides with CIIC. The Aitutaki utility should have its own Board of Directors, with Board members representing a cross section of stakeholders. CIIC would appoint the board of management and empower that Board to obtain finance for utility development and interface with other Government agencies. The suggested board structure includes:
Chairman: An eminent person of proven administrative capabilities with experience in managing a major public enterprise
Ex Officio Director: The Manager of TAU Ex Officio Director: Energy Division Director: A Senior Island Council Representative Director: A representative of the Aitutaki Tourism Industry Director: A representative for Aitutaki consumers (NGO) Director: A businessman with strong financial development experience Secretary to the Board: Manager of APS
A formal Memorandum of Understanding (MOU) should be made between APS and TAU clearly setting out their respective responsibilities. TAU would be expected to provide technical support, training, management assistance, assistance in tariff structuring and would periodically perform a review of APS operations to assure the APS board that the APS is operating competently and
39

efficiently. The APS would be expected to operate on the same quasi-commercial terms as TAU and use the technical, operational and environmental standards set by TAU except where special conditions dictate special requirements for APS standards that are set by the APS Board.
The MOU should be developed between the management of APS and TAU with agreement by both the TAU and the APS Boards and the CIIC. The MOU should include components relating to:
Training. What training is needed by APS personnel and how TAU can assist in obtaining that training.
Technical Support: The types of technical support in the form of skilled personnel and equipment that is needed by APS and how TAU can help provide that support.
Fuel purchasing. Combining fuel purchases of APS and TAU may provide benefits to both organizations. The needed arrangements for combining APS and TAU fuel purchases where there is benefit to APS should be included in the MOU.
Spare parts purchasing. Where there is equipment of the same type used in both APS and TAU, the MOU should indicate the arrangements that would be made for combined purchase and storage where there is a cost advantage.
Personnel Support: Because of the small number of persons at APS and the specialised nature of many of the jobs, it is difficult to arrange for temporary replacements for personnel leave or extended illness. The MOU should address what arrangements can be made for TAU personnel to temporarily stand in for absent APS staff whose work cannot be handled by other APS staff.
Annual Review. An annual review of utility operations including operations, finances, tariff structure, load structure, staffing, forward planning and management is needed at APS with associated recommendations for improvements. The MOU should address what TAU can do to assist in this annual audit.
Standards. APS should indicate what technical and environmental standards that have been set by TAU will be adopted and any deviations that are deemed appropriate for the special circumstances of Aitutaki.
The manner and scope of payment for services provided by TAU to APS.
5.2 Load Forecasts
Domestic consumer sales growth has shown an average annual rate of approximately 2.3% over the past decade. Domestic sales accounted for 67% of total sales in 19973 however for the calendar year 2004 domestic sales accounted for only 40%. In this regard a best guess assumption based on a recent National GDP growth rate of around 2.5% that an annual average growth rate for domestic sales of 2.5% would be reasonable for planning purposes.
Commercial consumer growth rate predictions are far more difficult to forecast as the construction of one single large resort would have a large impact on peak loads. The Aitutaki Tourism Study, August 2003, proposed a maximum environmentally and economically sustainable room level of 250 for Aitutaki. Discussions with the Michael Henry of the Aitutaki Tourism Association confirmed that 250 rooms was their target maximum and that currently there are 236 rooms. Since 19984 rooms have increased from 120 at an annual average of approximately 12% per year. Discussions with the Resort Manager of the Aitutaki Lagoon Resort and Spa confirmed their plans to double their number of rooms from 36 to around 72 over the next 2 years. This increase in itself will exceed the targeted 250 room sustainable maximum. The Teapaki Group of companies has also
3 Figures from Cook Islands Power Development Study 19984 Figures from Aitutaki Tourism Study 2003
40

indicated in the media and to local authorities that it intends to build a large resort with over water rooms in the Ootu area once planning approvals are finalised.
Commercial sales growth has seen an annual average growth rate of close to 16% since 1996 3 when commercial sales accounted for 33% of total sales. Current commercial sales are now 60% of total indicating the strong growth in the tourism sector and associated services.
Given that there remains large areas of undeveloped land on the coast running North from the Pacific Resort toward the airport and Ootu area, an apparent trend toward higher quality accommodation with associated high energy use, more awareness of energy efficiency driven by higher tariff and strong room growth we have assumed that commercial energy consumption will continue to increase at a rate of at least 8% over the next decade. This is 2% higher than the long term average estimated by the Cook Islands Power Development Study of 1998.
For the calendar year 2004 generated units were 3,239,971 and a peak load of 560kW. This represents a load factor of 0.66 and may be a little high due to manual reading of power station instrumentation. Analysis of logged data during the field visit calculated the load factor as 0.64 which would appear accurate and a major improvement on the load factor of 0.45 reported in 1997 5. We have assumed that this load factor will continue given that commercial sales will continue to dominate energy use for the foreseeable future.
Losses both technical and non-technical in 2004 were 13.3% which whilst reasonably high are far lower than the power systems of many of the other Southern Group islands. With upgrading of the 3.3kV and LV system and improved billing including street lighting (currently not billed), it can be expected that this will be reduced to around 10% over the next 3 years.
Using projected sales and assumptions for load factor and losses Table 5-1 indicates the forecast for the next decade.
Table 5-1 Projection of Sales, Generation, Losses and Peak Load
Year AAGR Domestic
Domestic kWh
AAGR Commercial
Commercial kWh
Total kWh
Losses Generated kWh
Load Factor
Peak Load kW
2004 1151798 1709004 2860802 13.3% 3239971 0.64 578
2005 2.5% 1180593 8% 1845724 3026317 13.0% 3419739 0.64 610
2006 2.5% 1210108 8% 1993382 3203490 12.0% 3587909 0.64 640
2007 2.5% 1240360 8% 2152853 3393213 11.0% 3766467 0.64 672
2008 2.5% 1271369 8% 2325081 3596451 10.0% 3956096 0.64 706
2009 2.5% 1303154 8% 2511088 3814241 10.0% 4195665 0.64 748
2010 2.5% 1335733 8% 2711975 4047707 10.0% 4452478 0.64 794
2011 2.5% 1369126 8% 2928933 4298058 10.0% 4727864 0.64 843
2012 2.5% 1403354 8% 3163247 4566601 10.0% 5023261 0.64 896
2013 2.5% 1438438 8% 3416307 4854745 10.0% 5340219 0.64 953
2014 2.5% 1474399 8% 3689611 5164010 10.0% 5680411 0.64 1013
2015 2.5% 1511259 8% 3984780 5496039 10.0% 6045643 0.64 1078
5.3 Short Term Recommendations
5.3.1 Power Station
5 Figures from Cook Islands Power Development Study 1998
41

Immediate investment in new generation plant is needed to ensure reliability of supply. Presently there is only a hired package genset carrying the base load with only one of the existing gensets (Gen #1 460kW) able to be brought online in peaks. The remaining three gensets are out of service requiring major overhauls. All four of the old Blackstone generators are no longer in production and the overhaul cost prohibitive. Water cooling towers require replacement, bulk fuel storage is inadequate and interconnecting pipe works are in a poor state of repair.
The power house itself whilst apparently structurally sound is in need of extensive refurbishment to meet modern standards of operation and occupational health. The roof requires replacement, oil spill containment is required and the control/switchgear area needs to be enclosed along with many smaller repairs and refurbishments to the structure and generator ancillary equipment.
Given the state of the generation plant and power house it is recommended to install a new power station based on packaged gensets with a simple accommodating structure. Packaged gensets whilst more expensive than open sets require only a simple low cost roof structure to keep operators out of the weather. They also provide better sound level reduction than expensive sound reduction measures built into the power station building. Picture 5-1 shows the style of power station recommended. The power station would also include new LV switchgear and a generator automatic control system to dispatch individual generators as required.
Picture 5-1 Recommended Power Station Style
Source: Powercorp Pty Ltd, Australia
The forecast load growth over the next ten years with a near doubling in peak load makes sizing of the generation plant difficult as gensets would tend to be underloaded now yet approaching capacity in just a few years. Bearing in mind that under low load (i.e. < 50% rated output) gensets are generally less efficient and have increased maintenance requirements, we recommend sizing that will include multiple gensets for efficient operation and flexibility and still provide for the forecast
42

10 year peak load of around 1,000kW. Redundancy must also be included to allow generators being taken out of service for maintenance. Taking account of these requirements it is recommended the new power station include four 320 kW gensets.-
This will provide peak output up to around 1,000kW with one redundant genset and at the same time provide high fuel efficiency and operational flexibility. For the next three to four years two generators will probably manage the peak and thereafter a third set will need to be brought on-line for the peaks. Although including other sizes of gensets in the mix could provide more flexibility and slightly higher efficiency of operation, the maintenance and spare parts advantages that accrue by having all sets of the same model outweigh these small operational advantages.
A generator control system that primarily operates in automatic mode would control generator start/stop, synchronisation, circuit breaker open and close, generator protection and full monitoring of performance and error messaging. The control system whilst normally operating in automatic mode could be operated manually should this be required. In operation the power station would only require one operator in attendance. (The design of the engines and control system should also take into consideration the integration of wind power into the system so that there is no repeat of the problems experienced in Mangaia. There is also the need to equip the station with proper maintenance tools and test instruments.)
The capital investment budget for the new power station is set out in table 5-2. These costs include estimates for freight and installation and represent full investment amounts. They are conservative and assume all new equipment.
Table 5-2 Budget Power Station Capital Cost
Four x 350kW packaged generating sets $1,024,000
Generator Control System $111,000
LV Bus and switchgear $116,000
160,000l Fuel bulk tanks including spill containment bunds $140,000
Installation including interconnecting pipe work and cabling. $300,000
Building/Civil works $310,000
Project Management & Supervision $300,000
Total $2,301,000
5.3.2 HV Distribution
The remaining 3.3kV HV distribution should be upgraded as a priority. Cable condition is deteriorating with associated faults becoming a concern to operation. The 3.3kV substation switchgear is extremely dangerous with fully exposed and unguarded ageing knife switches. LV distribution boards in many substations need upgrading from MCB domestic style to industrial CB standard. To ensure reliability to the water supply pumps in Vaipeka the APS Manager recommends replacing the existing 3.3kV pad substation with an 11kV kiosk style unit connected to the ring main.
A second 415V/11kV 600kVA step-up transformer is in stock at the power station which was procured for the 2nd phase of the HV upgrade which did not eventuate. The proposed upgrade would
43

utilise this transformer and the existing HV switchgear currently switching the 3.3kV. The HV switchboard is rated for up to 12kV and would need no major modification. The substations and associated cable routes and estimated costs are shown in table 5-3.
Table 5-3 Short Term HV Distribution Upgrade Estimated Capital Cost
Upgrade Capacity Cable run (mtr) Estimated Cost
PS – Sub#102 (Vaitekea) 11kV 50kVA 1,000 $93,100
Sub105(Ararura – Sub103(Hospital) 11kV 50kVA 440 $59,100
Sub103(Hospital) - Sub104(Nikaupara) 11kV 50kVA 1,430 $119,000
Sub105(Ararura) – Sub106 (S.D.A.) 11kV 50kVA 1135 $101,200
PS – Sub100(Vaipae) 11kV100kVA - $75,300
Sub100 (Vaipae) – Sub101(Tautu) 11kV 100kVA 1,000 $97,100
Sub114(Oota) 11kV 50kVA - $32,300
Sub113(Vaipeka) 11kV 50kVA - $32,300
Sub115(Water Supply) new kiosk 11kV 30kVA - $50,500
Upgrade of Substation LV Distribution Boards
Varied - $20,000
PS – Step up transformer install 600kVA $21,500
Totals 5,005 $701,400
5.3.3 LV DistributionWhilst there has been some upgrading of the LV system the majority of the system is in a very poor state with undersized conductors having many joints and conductors often not attached to cross arm insulators. Many overhead mains are 16mm2 HDPVCCC with some single phase 10mm2
conductors. These undersized conductors contribute significantly to the system loss as well as causing voltage fluctuations and poor power quality for customers on these lines. There is also some newer 25mm2 underground distribution and much of Amuri overhead conductors has been replaced with 25mm2 and appears in acceptable condition.
The North Western coast running from Amuri to the Airport and toward Ootu should be the highest priority for replacement of overhead cables. Voltages on consumer mains are particularly low and the area has been identified as one that is growing in demand through tourism and residential development.
It is recommended to upgrade the overhead LV mains to Ariel Bundled Cable (ABC) as is used by TAU on Rarotonga. This has proved to reduce maintenance costs for TAU and would allow APS access to training and equipment from TAU. The ABC is not as susceptible to cyclonic damage as individual wires, requires less vegetation clearing and has less visual impact which is preferable in Aitutaki where the economy is dependent on tourism.
Measurements of voltage drop at consumer meter boxes during the evening peak indicated several areas of voltages which were more than 5% less than nominal 240V. Mains from Sub110 (Vaitiupa) running South showed around 245V at the substation but as low as 198V at the consumer main. This is unacceptable and could result in customer equipment damage. Whilst we could not check all consumer mains due to time constraints we would expect similar low voltages elsewhere given the poor and condition of much of the LV system.
44

Sub109(Rapae) had a transformer LV side voltage reading per phase of 238,239,236 and a consumer main reading of 230V per phase which indicated the transformer tap may need adjustment to improve the consumer mains voltage.
There are no complete records/drawings of the LV or HV systems remaining in the files. As a part of the LV upgrade we recommend a GIS mapping survey be carried out providing complete data of the composition of the systems and consumer points of access. This will be invaluable in the ongoing maintenance and control of the system.
APS’s truck with a crane hoist is no longer useable and they have to hire the large port facility mobile crane at considerable cost when it is necessary to work on overhead lines or shift heavy equipment. This is not a workable solution for the long term and a new truck with a hydraulic boom crane should be purchased. This truck will be required for upgrading work on the LV system and ongoing maintenance. (There is a need to equip staff with proper safety gear, working tools and test instruments)
Many of the poles used in the overhead LV mains are concrete. Many poles have been deflected from the vertical through subsistence or wind loading (particularly in the cyclones in January 2005) but are generally serviceable. Older timber poles should be replaced. Many cross arms are in a poor state. However if the lines are upgraded to ABC these will not be required in most areas.
Due to the lack of records on the extent of the LV system we have relied on estimates from the field visit added to what information could be found to estimate costs of the upgrade. These cost estimates are shown in table 5-4 in order of priority.
Table 5-4 Estimated LV Upgrade Cost
Priority Upgrade Estimated Length (m) Estimated Cost
1 GIS Mapping of LV System $20,000
2 New Crane Truck $80,000
3 Rapae, Anaunga & Apiripiri 6,000 $175,000
4 Arutanga, Ararura, Nikaupara 6,700 $214,000
5 Vaipae 2,600 $100,000
6 Tautu 3,400 $111,000
Totals 18,700 $700,000
5.3.4 Administration and Personnel
With a customer base approaching 800, a computerised system to record meter readings and produce invoices should be implemented. The present manual book based system is time consuming, conducive to errors and does not provide data in a form that can be readily used for power system analysis. This billing system could be in the form of a spreadsheet program similar to
45

that used at Atiu Power Supply or perhaps the same system as used by TAU on Rarotonga. One issue that must be addressed with any new system is that it must be able to be kept operational by the administration staff or in the case of use of the TAU system, by IT staff from TAU.
The proposed new power station would be operated largely by auto mode controls (as is the present rental genset) requiring minimum staffing with normal operations requiring only one operator on station. This operator can be carrying out other power station duties whilst on station. As the use of the rental generator has shown, these modern packaged generators require a minimum of attention compared to the older slow speed sets. It would be expected that staffing levels in the power station could therefore be reduced with the new power station. Table 5-5 shows indicative staffing.
The station operators should be able to carry out routine maintenance on the proposed sets with a Station Mechanic/Electrician responsible for overseeing those maintenance procedures and schedules are followed. Generator top and major overhauls would necessitate the hiring of specialist mechanics familiar with the brand and model of generators chosen for the new power station. These may be from the Cook Island or the region and investigation into mechanics available in the country that have experience on a particular model of engine presently in service elsewhere may warrant specifying these models for the power station.
Under the new institutional relationship TAU should carry out a job evaluation exercise to determine current skills and ability of APS staff and where the staff should be positioned in the APS structure. The evaluation will also identify areas where competencies are limited and propose particular training or job attachments to address these deficiencies. Of concern is that the present Manager of APS appears to be the only person that can trouble shoot and control the HV network. One of the benefits of having the relationship with TAU is the access to trainers that visit TAU from time to time that could now be available to APS.
Table 5-6 lists training that would be expected to be addressed in an ongoing programme.
Table 5-6 Training
TRAINING CONTENT
Electrical Wireman theory and practical. Electrical theory and wiring rules
Electrical circuit calculations
Fault diagnosis
Table 5-5 Personnel
Number Position
1 Manager
1 Linesman/Supervisor
1 Linesman
1 Station Mechanic/Electrician
4 Operator/Mechanics
2 Admin Officers
2 (Casual) Meter Readers
46

Wireman safety
Practical attachment to private firms regionally and/or utilities
Electrical/Mechanical generator theory and maintenance.
Principals of generation
Metering and indication
Protection and control equipment
Maintenance and troubleshooting faults
Practical attachment to regional private firms or utilities and or TAU.
Electrical Distribution Distribution theory and circuit calculations
LV & HV equipment maintenance and safety procedures
Practical attachment to TAU or regional utilities
5.3.5 Demand Side Management (DSM)
Aitutaki’s load profile is characterised by a large evening peak load of relatively short duration. The morning peak is not significant and is relatively far smaller than other Southern Group islands. This indicates that lighting and use of electric cooking appliances play a significant part in this evening peak. Encouraging the use of high efficiency florescent lighting and gas cooking appliances would be expected to reduce this peak. Statistics from the 2001 Census indicate 23% of households use electricity as their principal means of cooking. This represents 105 households and may contribute as much as 100kW to the evening peak.
Whilst a detailed survey of light fittings was not carried out it would be reasonable to assume the ratio of incandescent : florescent light fittings in households would be similar to that in Atiu of 4:1 where a household survey was carried out in June 2004 6. As a basic example of potential load reduction and cost savings consider the following:-
Change one commonly used incandescent lamp per household
Assume a standard 60W incandescent lamp is exchanged for an 11W Compact Fluorescent Lamp (a size that produces an equivalent amount of light) in 400 households where the light is used on average 2 hours per evening peak.
Demand Saving : 400 x (60-11) = 19.6kW
Cost @ $10/lamp : 400 x $10 = $4,000
Energy bill savings at a domestic tariff of $0.45/kWh = 365days x 19.6kW x 2hr x $0.45 = $6,438
Generator installed cost/kW (new packaged sets) = $800
Potential Generation Capital Cost Savings : 19.6 x $800 = $15,680
6 Atiu Power Sector Feasibility Report UNDP/UNESCO 2004
47

As this simple example displays, exchanging of commonly used incandescent lighting with energy efficient fluorescent can save for both the consumer and APS. Discussions with NGOs on Aitutaki indicated they are not well informed regarding energy saving measures and also they desire information about what can be done to save energy. An energy efficient awareness program should therefore be implemented. This could simply be by way of the production of a leaflet that is included with the monthly bill that shows the use and cost saving of energy efficient fluorescent lights and could include meetings and workshops for the NGOs. APS may also investigate subsidising the cost of these lights and perhaps financing them through the billing process to further encourage their use. The Fiji Electricity Authority is currently running a energy efficient lighting program with a Fijian firm and 11W compact fluorescent bulbs are available to consumers for the reduced costs of 3 bulbs for NZ$12.50. Perhaps TAU and APS could purchase bulbs in large lots of and pass the price benefits on to their consumers.
Consultations with resort and commercial customers showed that they are more aware of energy efficiency measures. There is, however, opportunity to develop this further and information should be provided to demonstrate and encourage use of energy efficient appliances and operational controls and procedures.
Discussions with the General Manager and Maintenance Manager of Aitutaki Lagoon Resort and Spa, the largest consumer, indicated they were pursuing energy efficiency in the resort and are currently investigating the replacement of their 40kW laundry dryer with alternatives including pre-drying and LPG. This dryer usually operates daily 9:00am – 10:00pm. APS should request the resort not to operate the dryer during the peak evening load.
A similar demonstration on the cost effectiveness of LPG against electricity for cooking would also encourage reduction of electricity demand by households.
It is recommended that APS work with TAU on the development of a project to encourage use of energy efficient lighting and LPG or alternate sources of cooking. However, any energy efficiency project must be documented and monitored to evaluate their success and it must be recognised that such programmes must be continuing, not just a short term exercise.
5.3.6 Tariff
As a minimum tariff APS should recover full operating and replacement costs if the power supply is to be reliable in the future and function without subsidy. This assumes that funds either from the Central Government or donors is made available to carry out the short term remedial works required to get the system into proper condition. The future tariff should not be expected to cover returning the system to a proper condition, only to provide for future sustainability.
Unlike many poorer islands, only about 10% of Aitutaki meters show usage less than 25 kWh/month (sufficient for lighting and TV) and many of those are represented by meters on workshops and part time dwellings so the concept of a “life line” tariff does not appear to be useful as a measure to offset poverty in Aitutaki.
The large resorts are a special concern for the APS due to the two resorts together using approximately 1/3 of all the energy generated. The loads are somewhat seasonal and include single large loads, such as the 40kW clothes dryer at Akitua, that impact on the management of the
48
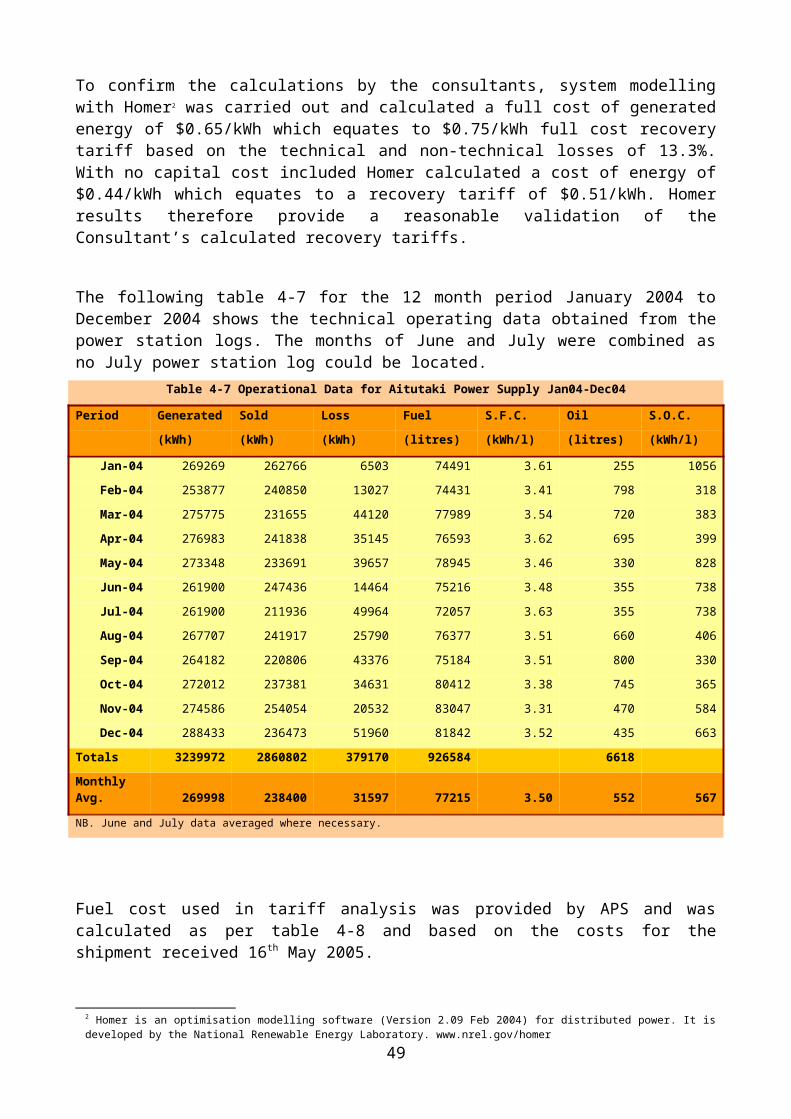
generators when switched on or off. Having the resorts connected to the grid has advantages and disadvantages to both the resorts and the utility. Three interconnection choices exist:
o the resorts depend on the utility for power and have a back up generator for emergencies;
o the resorts operate their own independent power system and depend on the utility for back up in an emergency
o there is no interconnection between the utility and the resorts. The resorts provide their own power using multiple generator systems for high reliability with in essence a main generator and a backup generator.
The complete separation of the utility and the resorts would result in higher power costs for both the utility and the resorts since APS would lose a major customer that provides system loads that probably reduce the effects of domestic load peaks and the resorts would have to become a mini-utility with significant increase in personnel, maintenance and capital costs. For the resorts to generate their own power while depending on APS for backup would reduce the capital investment required by the resort but still would require increased personnel and add to maintenance costs and APS would have to invest in significant, generally unused capacity to provide for that backup.
For both parties, it appears that the present arrangement with APS being the primary power provider and the resorts maintaining an infrequently used backup generation capability is the best option. Should one of the large resorts choose to generate its own power and use APS as a backup, APS will have to have the capacity available to supply the resort even though it is not normally needed as APS must be prepared to carry the resort load should the resort generators fail. Therefore APS should charge a special backup power fee based on kW capacity that must be kept available. That fee must be paid whether power is taken from the grid or not. Further, a special higher level tariff should be established for any energy provided to the resorts as backup power.
There is the possibility that the resort generators could be integrated into the APS system – acting independently for the resorts when APS power fails but feeding into the grid at other times – with APS paying a generation fee for any power delivered to the grid by the resort generators. This approach is not recommended for three reasons:
1. the resort generators would have to be synchronised with the APS generators each time they are started, a process that requires special equipment and trained operators which can cause power outage and serious damage to APS (and resort) equipment if done improperly;
2. the resort generators cannot have as high an efficiency of operation as the larger machines at APS and any power from the resort generators would be more costly than that of APS generation;
3. it would be commercially unwise for APS to shift 1/3 of its power generation to generators over which it has no control.
However, the resort generators do provide APS with some ability to shed a substantial part of its load should there be a loss of generator capacity at APS due to malfunction.
The information available to the team does not provide sufficient data for properly determining the most rational tariff. In particular, a survey of commercial and residential customers is needed to determine the need to stage tariffs for different types of usage, to impose demand based tariffs and to understand the relationship between the cost of generation and the load structure. Also further information is needed regarding the daily load structure of the resorts to determine whether the resort loads are helping level the system loads or are making the peaks more pronounced.
49

What is clear is that the power system is different in structure from that of Rarotonga and the other outer islands and tariffs need to be determined specifically for Aitutaki. Using the Rarotonga tariff structure is not recommended as the cost of power delivery on Aitutaki appears to be substantially higher than that of Rarotonga and tariffs need to reflect that fact if APS is to function without external operations subsidy. It is recommended that the Board commission a study of the true cost of generation, the effect of tariffs on tourism development, the effect of tariffs on households and the effect of tariffs on commerce. With fuel representing up to 70% of operational costs a tariff that includes a frequently updated fuel cost component that reflects variations in landed fuel cost should also be considered. Using that information, a tariff structure should be developed that provides for sustainable APS operation while equitably sharing those costs among the domestic, resort, commercial and government sectors.
In a basic assessment, with a current tariff of $0.45/kWh for domestic and $0.60/kWh for commercial and assuming 40% of consumption is domestic then the average tariff collected by APS is $0.54/kWh. This equates to the present recovery cost for operations and replacement and until a complete tariff assessment is carried out, would sustain APS provided the rehabilitation recommendations are funded externally and fuel prices do not increase significantly. When considering tariff rates, future medium term investments in system upgrades should be included as external funding may not be available when the upgrades are needed.
5.4 Medium Term Recommendations
5.4.1 Power StationIn the medium term (2-5 years), assuming that the new power station is constructed, the most significant issue for the power station will be the management of the routine maintenance of plant and equipment particularly generators and fuel systems. In the medium term only routine maintenance of the generators should be required as top overhauls of the engines should not be required until 15,000-20,000 hours of engine operation has accumulated. It is envisaged in the medium term that total generator time per year would be in the order of 12,000-14,000 hours and with 4 gensets it would be towards the end of year 5 that top overhauls would be needed.
5.4.2 HV DistributionWith anticipated growth toward the ridge in the centre of the island between Amuri and Avanui Districts, a new substation designated #121, Pirake, is proposed. This would be located on the main ridge road above the Amuri School and LV feeders would provide coverage throughout these elevated areas. By feeding the new sub from #109, Rapae and #106, S.D.A. a ring could be established encompassing the developed areas of Amuri and Arutanga and providing a higher degree of supply security and improved quality of supply. Table 5-7 shows the estimated cost.
Table 5-7 Medium Term HV Distribution Upgrade Estimated Capital Cost
Upgrade Capacity Cable run (mtr) Estimated Cost
New Pirake Substation 121 11kV 50kVA 1,600 $170,800
50

5.4.3 LV DistributionContinued upgrading of the LV system will be required in the medium term to replace old overhead cables with ABC and the few poles that are unsafe. By the end of this upgrading all overhead cabling should be in good condition and provide reliable service for the long term.
Due to the lack of information on the extent of the LV system we have relied on estimates from the field visit and what information could be found to estimate costs of the upgrade. These cost estimates are shown in table 5-8.
Table 5-8 Medium Term Estimated LV Upgrade Cost
Upgrade Estimated Length (m) Estimated Cost
Hospital, Vaiteka, S.D.A. 5,060 $165,900
Ooka, Vaipeka, Water Gallery 5,500 $163,800
Ootu 1,000 $26,800
Totals 11,560 $356,500
5.4.4 Administration & PersonnelIt is recommended that TAU carry out annual audits of APS and this should include staff evaluation, administration, operations and billing procedures, training programmes and financial performance. Whilst APS management should also be undertaking these evaluations they should be encouraged to work with TAU to identify those areas that can be strengthened and in general to ensure the well being of the workers and sustainable operation of APS.
5.4.5 Demand Side ManagementShould the short term DSM project to encourage energy efficiency prove successful, the consumers will have confidence in further measures and more extensive DSM measures could be developed in the medium term. These could provide more extensive energy auditing of resort and commercial high energy consumers to produce recommendations of financially viable and practical energy efficiency solutions. With further reductions in peak demand through DSM, APS can delay further investment in increased generation and distribution capacity with those cost savings passed on to consumers.
There are two significant barriers to implementation of a more ambitious energy efficiency programme that would need to be addressed.
Access to suitably qualified personnel to carry out energy audits and develop appropriate solutions, specifications and financial models.
Methods to micro-finance implementation of viable energy efficiency technologies. It is possible that some consumers may be able to finance implementation however generally it appears that finance may be an issue for many consumers due to the relatively high capital cost of many applicable technologies.
APS can address these barriers and their removal in several ways. For example, APS can share the costs of qualified personnel with TAU who could be running a programme in parallel with APS.
51

Also APS can offer financial solutions where by APS provides a level of financing to the consumer to allow spreading repayment of capital investment over a period which may represent the simple payback for the capital cost. This solution would mean the consumer is potentially not out of pocket during the payback period due to the reduction in their energy bill being equal to the finance cost for the equipment. Once the equipment loan was repaid, the consumer bill would be lower. This concept is dependent on APS having funds available. External sources may be approached to help the establishment of a revolving fund for DSM finance of this type.
5.4.6 TariffOngoing tariff reviews, with the assistance of TAU, are required for the sustainability of APS. The tariff review in the short term should provide a template that APS can utilise to establish correct tariff levels. These reviews should be at intervals short enough that consumers are never faced with significant increases in one step. It may be that a public relations exercise, perhaps through the Island Council, would advise consumers on the basic inputs in the tariff setting and their effect. Cost of diesel and its impact on tariff would be the first input to be explained to consumers as this is the major cost component.
5.4.7 Renewable EnergyVarious indigenous renewable energy (RE) resources are available in the Cook Islands. These in theory include; solar, wind, wave, ocean thermal, biomass and biogas. The National Energy Policy (NEP) clearly sets the guidelines and policies for acceptable renewable energy technologies (RET). These include:-
Self-sufficiency; The provision of energy services shall utilise wherever practical and financially and economically feasible, indigenous energy resources, local expertise and local capital available within the Cook Islands
Flexibility; In general, the government will not consider the use of any technologies for energy production or savings that have not been technically proven and adopted commercially elsewhere. The national energy policy and all strategies and activities to implement it will be carried out with prudence and flexibility. It is likely, for example, that donors may support energy demonstration projects, which are technically proven and reliable and could benefit the country but may not be strictly commercial in the Cook Islands. It will approve non-commercial demonstrations based on these criteria:
Experimental or unproven energy projects will not be tried in any island or remote communities. Communities that receive demonstration projects will provide in-kind assistance during planning and construction. They will pay a reasonable monthly fee (based on a national cost policy to be developed) for energy services received thereafter.
For large- scale grid-connected commercial or pilot programmes based on renewable energy, any additional costs will not be imposed on consumers. The government will assure that any unusual financial risks to the utility (TAU or Island Councils) would be borne by the donor, supplier or financer.
Policy 3.1; Promote the increased use of appropriate renewable energy technologies, technically and commercially proven, financially and economically viable, and environmentally friendly.
These policies and guiding principals exclude RETs that are not technically and commercially proven. Infant technologies such as wave and Ocean Thermal Energy Conversion (OTEC) will not be considered in this report as they have not been proven, particularly in remote areas, either
52

technically or commercially. Biomass, biogas, solar and wind are considered proven technologies and are commercially available.
5.4.8 Biomass
Fuel wood for cooking is being largely replaced by Liquefied Petroleum Gas (LPG) as a more convenient fuel. Fuel wood is now predominantly used by low income households and for the traditional “umu kai” (earth) oven. The 2001 Census results show 16% of households on Aitutaki use wood and 50% LPG as their primary source of cooking fuel. As such fuel wood is not a major source of energy for cooking. The land area is not sufficient to support sustainable biomass use for significant power generation. Environmental concerns also effectively prevent large scale biomass use for energy.
Fuel oil from coconuts offers the best current technology for using biomass potential on smaller islands; however the resource on Aitutaki is limited and insufficient to impact on energy supply. Should coconut oil become available from external sources at a competitive cost in the future it should be considered but local production in the quantities needed is not practical.
5.4.9 Biogas
The 2000 Census of Agriculture and Fisheries indicates 3,200 pigs, and 650 goats on Aitutaki. Biogas production, which can be used for cooking similarly to LPG, through anaerobic digestion of animal wastes offers potential only if animals are confined and the wastes of a number of animals are combined as would occur with dairy farms and commercial piggeries. With only 13 residents employed in agriculture and fishing, and no commercial piggeries or other operations that combine a number of animals in an enclosed space, biogas is not considered a reasonable option for Aitutaki.
5.4.10 Wind
Two wind assessment projects in the Cook Islands are the only source of long term wind data for power generation:
Southern Pacific Wind and Solar Monitoring Project by the Forum Secretariat installed a 10m wind and solar monitoring tower in November 1994 at Ngatangiia Point on the Eastern extremity of Rarotonga. Monitoring was carried out over a 2 year period and recorded an annual average wind speed of 5.5m/s @ 10m a.g.l. The wind mast unobstructed exposure was from the North West through East to the South West. 60% of winds were from the Eastern quadrant as expected with the predominant Easterly trade wind patterns of the South Pacific. Long term correlation with six year averages measured at the Meteorological Office at Rarotonga Airport indicate that the 1995 and 1996 wind speeds were on average lower by 5% to the long term mean. Subsequent wind mapping by Vergnet in May 19997,
7 Cook Islands – Pre-feasibility study of wind power projects on Rarotonga, Atiu & Mangaia – May 1999 – Prepared by Vergnet SA, Laurent Albuisson
53

and COWI/Risoe 19988, using the Ngatangiia data, identified potential sites with estimated averages of 7.0 to 7.5 m/s at 30m height.
Vergnet carried out a wind power feasibility study for grid connected wind turbines on Mangaia Island in the Southern Cooks9. A 30m high monitoring tower was installed on a ridge 110m above sea level (a.s.l.) and commenced data logging in April 2001 until July 2002. The tower with two anemometers installed at 20 and 30mtr recorded 10minute average wind speed and wind direction. A pair of 20kW turbines has been installed on Mangaia though analysed operational data is not yet available.
Neither of these studies provides definitive information about the resource on Aitutaki. However, they do indicate that there is likely to be a sufficient wind resource on Aitutaki for power generation and make it reasonable to carry out a proper wind survey to support Aitutaki wind power development.
Aitutaki has a potential wind turbine site on a ridge running for approximately 600m southeast from the highest point in the island, Maungapu at 124m a.s.l. A wind monitoring tower will be erected on this site in July 2005 to evaluate the wind resource. This station should be maintained as a permanent site for long term wind data correlation with other future wind monitoring projects throughout the Southern Group. At least 12 months of data needs to be collected before analysis will provide substantiative results to verify wind power feasibility.
Picture 5-2 Aitutaki Potential Wind Site
Photo: Dick Watling 2005
The elevation on this ridge is on average 80m a.s.l. compared to Mangaia where the turbines are at 95m a.s.l. The Aitutaki site has very little vegetation compared to Mangaia. The sites are sufficiently comparable to make it reasonable for the purpose of preliminary evaluation to assume an average wind speed of 7.5m/s @ 30m a.g.l. as for Mangaia.
8 Forum for Energy and Development (FED), Pacific-Danish Environmental Education and Action Program – Feasibility Study of Phase 1, prepared by COWI/Risoe, January 19989 PREFACE Mangaia – Cook Islands Feasibility Study for a Wind Farm Connected on the Diesel Grid, prepared by Vergnet SA December 2001
54

120kW of wind turbine rated capacity would be the maximum amount recommended to be connected to the Aitutaki grid. Homer software has been used to model a wind / diesel system with an average wind speed of 7.5m/s at a hub height of 30m. It is assumed that 6 x 20kW turbines make up the wind farm. These turbines would be similar in size to those at Mangaia and could be easily managed by APS with their involvement and training during installation and commissioning. These smaller sized units can be of a type that can be lowered by APS personnel to prevent damage from cyclones.
Assumed system nominal specifications, estimated full capital costs and financial parameters are listed in Table 5-9.
Financial viability was modelled both with full and with no capital cost for both diesel and wind systems. With capital cost included, average wind speed of 7.5m/s and current fuel cost of $1.07/l a straight diesel based system has the lower cost of energy while with no capital cost applied the wind/diesel system has a lower cost of energy. These results are shown in table 5-10.
Table 5-10 Sensitivity to Capital Costs
System Capital Wind speed (m/s) Fuel Cost ($) Cost of Energy ($)
diesel only full capital 1.07 0.649
wind/diesel full capital 7.5 1.07 0.658
diesel only no capital 1.07 0.445
wind/diesel no capital 7.5 1.07 0.403
Modelling by Homer showed that the introduction of wind turbines to the system produced a lower cost of energy (with no capital) at least down to 6.5m/s wind speed which we would assume to be a the lower end of the expected wind resource. As expected, if external funding could be found for the wind turbines they should be economically viable.
System sensitivity to fuel price and wind speed with full capital costs included was examined. Figure 5-1 shows graphically the financial sensitivity to wind speed and diesel fuel price. The blue shaded area representing wind/diesel system as optimum whilst the black areas represent diesel only as the optimum. For example at a wind speed of 8.0m/s fuel cost needs to be approximately $1.20/l
Table 5-9 Grid Connect Wind Specifications, Cost and Financial Parameters
Wind Turbine Capacity (6x20kW)
120kW
Hub Height 30m
Average wind speed at hub height
7.5m/s
Weibull k factor 2.8
Annual RE production 477,367kWh
RE fraction of total production
14.7%
Diesel Fuel Substituted 122,300 litres
Installed Total Cost $1,592,500
Estimated O&M/year $10,000
System Life 20 years
Discount 6%
Project life 15years
55

before the wind turbine is viable. At the estimated wind speed for the site of 7.5m/s it shows that fuel cost needs to exceed $1.30/l for wind to be viable. This is at full capital cost.
Figure 5-1 Wind Power Economic Viability
Source: Homer (NREL)
In the medium term wind power should be utilised if either external funding can be sourced or if the combined wind resource and fuel price show wind to be viable.
5.4.11 Solar
56

There is no measurement of Global solar radiation data on Aitutaki however data collected from the Meteorological Office adjacent to the Rarotonga Airport should be sufficient for design and analysis of solar power systems. It would be advisable to include logging of solar radiation on the wind monitoring station being installed on Aitutaki to verify long term average radiation.
Collected solar radiation data for Rarotonga is shown in Table 5-11. This shows average solar radiation as 4.965 kWh/m2/day which is a significant resource by global averages. Minimum radiation in winter is on average 3.510 kWh/m2/day due to the Cook Islands relatively low latitude. In higher latitude countries winter minimum radiation can be particularly poor. Solar radiation data in table 3-12 has been measured on a horizontal surface rather than inclined. This also will underestimate the annual average as solar modules will be inclined to increase the total radiation collected over the year.
Table 5-11 Solar Radiation Measurements, Meteorological Office site, Rarotonga (1995 data not complete)
kWh/m2/day on a horizontal surface
JAN FEB MAR APR MAY JUN JUL AUG SEP OCT NOV DEC YEAR
1986 3.283 3.658 4.118 4.493 5.501 6.163 6.422 4.805
1987 5.098 5.616 5.242 4.925 3.082 3.600 3.600 3.917 5.098 6.192 5.990 5.875 4.853
1988 5.299 5.789 5.962 3.773 3.974 3.312 3.485 4.723 5.386 6.278 5.299 5.558 4.903
1989 5.645 6.394 0.000 4.378 3.888 3.715 3.686 4.723 5.443 5.443 5.270 5.933 4.956
1990 6.941 5.386 5.933 4.349 3.514 3.974 3.917 5.126 5.242 5.645 6.278 6.019 5.194
1991 5.962 5.386 5.818 4.608 3.629 3.456 3.859 4.378 6.048 0.000 6.336 5.990 5.043
1992 6.019 6.422 5.472 4.435 3.859 3.658 3.686 4.262 5.990 5.962 6.739 6.768 5.273
1993 6.509 5.962 5.184 4.550 3.946 3.686 3.370 4.003 5.069 5.933 6.710 6.019 5.078
1994 5.386 5.990 5.386 4.320 3.571 3.686 3.110 4.579 4.694 6.106 6.480 5.558 4.906
1996 5.069 5.213 5.299 4.176 3.283 3.226 3.773 4.406 5.184 5.472 6.134 6.048 4.774
1997 6.653 6.509 4.637 4.147 3.773 3.629 3.226 4.349 4.579 6.163 6.480 5.904 5.004
1998 6.250 4.723 5.069 4.982 4.003 3.571 3.254 4.464 4.954 6.221 6.480 5.674 4.970
1999 5.875 4.867 5.155 4.954 3.168 3.427 3.686 3.917 4.666 4.694 6.278 5.702 4.699
2000 5.990 6.250 5.472 4.579 3.485 3.312 3.370 4.147 4.954 5.357 6.451 5.933 4.942
2001 6.250 5.472 5.069 4.090 3.542 2.794 6.106 4.522 4.608 5.933 6.365 6.163 5.076
2002 6.077 5.760 5.242 4.435 4.320 3.514 3.859 4.061 5.386 5.155 5.155 6.422 4.949
2003 6.394 5.789 4.579 4.320 3.600 3.600 3.859 4.032 5.126 5.501 6.336 4.694 4.819
Average 5.963 5.720 4.970 4.439 3.665 3.510 3.740 4.351 5.152 5.378 6.174 5.891 4.965
Source – Cook Islands Meteorological Service (2004) and GEF/ UNDP Pacific Islands Renewable Energy Project (PIREP) Draft Cook Islands National Report May 2004
Solar PV for Electricity Generation
Sufficient vacant land area is available adjacent the power house on CIIC land to erect a PV array of up to 1,000m2. Other areas that could be considered roofs of public buildings for modular grid connected PV.
57

Solar feeding directly into the grid cannot offset the evening system peak since the peak solar output is midday. Aitutaki’s midday loading is in the order of 400kW which should allow the inclusion of around 80kWp (i.e. 20% of system load) of solar without adverse effect on the system. The array could be mounted on the clear area adjacent the power station and public works buildings. Modelling of grid connected PV was carried out using both RETScreen10 and Homer software based on the use of standard grid-connect PV equipment. Assumed system nominal specifications and estimated costs and financial parameters are listed in table 5-12.
Financial viability was tested at full and no capital cost and as expected the use of solar will be viable only when there is no associated capital cost as shown in table 5-13.
Investigations using Homer showed that fuel prices would need to rise to around $4.00/l before solar at full capital cost was viable.
Table 5-13 Sensitivity to Capital Costs
System Capital Fuel Cost ($) Cost of Energy ($)
diesel only full capital 1.07 0.649
solar/diesel full capital 1.07 0.674
diesel only no capital 1.07 0.445
solar/diesel no capital 1.07 0.403
At this stage wind power generation is far more cost effective when capital cost is included and, due to wind not being limited to daytime operation, wind power can provide more energy to the system as well. Wind power produces 0.3kWh/year/$ where as solar produces 0.1kWh/year/$ of investment. Based on this it is recommended to pursue wind power generation in the medium to long term.
Solar Thermal
10 RETScreen is a renewable energy project analysis software (Version 3.0 Wind Energy) developed under the authority of the Ministry of Natural Resources Canada
Table 5-12 Grid Connect PV Specifications, Cost and Financial Parameters
PV Array 80.64 kWp
Array Area 740 m2
Grid Inverter 80kW
Annual energy production 119,179 kWh
RE Fraction of total energy production
3.7%
Diesel Fuel Substituted 28,394 litres p.a.
Installed Total Cost $1,214,000
Installed Cost/Wp $15.05
O&M/year $5,500
System Life 25 years
Discount 6%
Project life 15years
58

Although solar PV does not appear to be a viable option for significant power generation at this time, solar thermal energy for water heating is usually viable for water heating for domestic and commercial use. However, because the water distributed on Aitutaki has high mineral content, water heater designs that tolerate that condition should be used if long life and low maintenance are to be expected. Though solar water heating should be encouraged to reduce peak demand for APS, before specific types of water heaters are recommended, a survey of existing solar water heater users should be carried out to determine the type of unit that provides the best service under Aitutaki conditions.
5.5 Long Term Recommendations
5.5.1 Power Station, HV & LV DistributionPlanning will become a significant issue in the long term for the power system. Rapid changes in demand structure can occur because of the high percentage of system loading due to tourism facilities and power planning must be coordinated with tourism development plans.
The proposed new generation plant offers 3 x 320 = 960kW with one redundant 320kW set. Should the peak loads exceed the capacity of three sets then the system will be vulnerable to outages with all four sets on-line. Reduction of the peak loading through DSM measures and the shifting of cooking loads to LPG can significantly delay the need for added capacity and should be pursued.
In the long term the generators will require major overhaul at between 30-40,000 hours. Selection of generators for operation should be arranged to bring engines to overhaul hours at staggered intervals so that no more than one engine requires overhaul at a given time. It may be worth considering shipping generators to either Rarotonga or perhaps New Zealand or Australia for major overhauls depending on availability of suitably qualified mechanics.
Load flows, transformer and cable capacities and fault protection will need to be monitored both at the power station and HV/LV distribution as peak loads approach 1000kW. This planning may have to commence as early as 2010 to ensure correct balancing and loading on system feeders and substations. There may be requirements for upgrades for substations that become undersized in areas with increasing development particular in view of any major resort developments that may be planned.
5.5.2 Administration & PersonnelContinuing evaluation of staffing levels, skills and operations should be ongoing. In the long term system upgrades carried out in the next few years will start to age and maintenance requirements will increase. Ongoing evaluation and support from TAU should help identify changing human resource and operational requirements.
5.5.3 Demand Side ManagementThe more extensive DSM measures are in the medium to long term will put less pressure on power system capacity. Developing personnel and financial capacity to implement DSM measures, particularly in energy efficiency, will be worthwhile long term investments.
59

5.5.4 TariffAs for the medium term recommendations it is important for APS’s long term sustainability to regularly review and maintain adequate tariff structures. Tariff review should not be a reaction to financial losses.
5.5.5 Renewable Energy
Renewable Energy technologies are developing rapidly and may provide new opportunities in the long term. Existing wind and solar technologies can not provide capacity to the power system without some form of energy storage. This limits their penetration to the levels shown in the medium term recommendations. Present energy storage technologies are not financially and economically feasible on a system this size however research into new technologies may provide a solution in the long term to increase wind and solar penetration. These developments should be followed and their suitability for Aitutaki considered.
Biofuel such as coconut oil may provide some long term opportunities though production on Aitutaki, considering its available land and its emphasis on tourism development, may not be viable. Importing of biofuel may, however, become an acceptable option and should be examined as they become more readily available and cost competitive since locally or regionally supplied biofuel reduces Aitutaki’s (and the region) exposure to fossil fuel supply risk.
Picture 5-3 20kW Wind Turbine as Recommended for Aitutaki
Photo: Bruce Clay, 2004
60

6 ANNEXES
Annex A – Terms of Reference1. INTRODUCTION
The 22 June 2004 the Government of the Cook Islands (GoCI) decided to return the Aitutaki Power Supply (APS) from the Aitutaki Island State Government to the Board of Te Aponga Uira (TAU) to operate, i.e. TAU completely takes over the operation, management, and financial control of the island power. As part of this reintegration process the GoCI has decided to undertake a power study for Aitutaki. The aim of this study is twofold. Firstly to provide input and assistance to the GoCI, TAU, the Aitutaki Island State Government, and other relevant stakeholders with the practical implementation of this structural reform and secondly to assess and recommend power system improvements in the short, medium and long term. The recent hurricanes and their impact on Aitutaki including the power sector have made this technical assistance consultancy even more vital. Based on a request from the GoCI the Government of New Zealand has agreed to fund this study.
2. OBJECTIVES
a) To determine in detail what improvements, in the short term, should be undertaken in the current diesel based power systems;
b) To determine in detail the technical, socio-cultural, economic, financial and institutional/management feasibility, in the medium and long term, of supplementing the current diesel systems with indigenous energy sources;
c) To prepare an overall power sector plan; and
d) To describe and review the institutional arrangements for the management, operation, maintenance, etc. of the Aitutaki Power Supply (APS) as part of TAU and if required recommend how the institutional design and set-up can be strengthened.
3. OUTPUTS 11
a) An inception note;
b) A de-briefing note;
c) A detailed power sector/feasibility study report including an overall power sector plan; and
d) A review and recommendation paper concerning the institutional arrangements for the incorporation of APS into TAU.
4. ACTIVITIES
11 All outputs from the consultancy are solely the property of the Government of the Cook Islands. E.g. the Government of the Cook Islands can distribute as widely as it finds appropriate.
61

The scope of work for the consultancy will include, but not necessarily be limited to, the following activities:
Regarding Output a)
a) Study and review relevant background material;
b) Identify key project stakeholders; and
c) Write-up an inception note comprising the consultant’s understanding of the consultancy and associated tasks; identification of issues crucial to the viability of the consultancy; and comments on this TOR. Subsequently, if required and approved by the GoCI, the scope and/or activities of this TOR can be adapted to fit the needs of the specific issues being examined.
Regarding Output b)
a) Prepare debriefing note, based on preliminary findings, conclusions and recommendations; and
b) Discuss debriefing note with the Director, Energy Division (ED), Ministry of Works, CEO, TAU, Manager, Aitutaki Power Supply (APS), Aitutaki Island Secretary, Aitutaki Island Council and Aronga Mana and other relevant stakeholders. Prepare minutes of the meetings.
Regarding c) 12
In general:
(a) Specify what improvements (i.e. rehabilitation and/or expansion) in the short term should be undertaken in the current diesel based power systems (for generation as well as distribution);
(b) Describe and assess the technical, socio-cultural, economic, financial and institutional/management feasibility in the medium (e.g. 2-5 years) to long (e.g. 5-10 years) term of supplementing the current diesel systems with indigenous energy sources;
(c) Develop an overall, balanced and realistic power sector plan for the short, medium and long term for installation of new generation capacity in order to meet the requirements of load growth, reliability, operating costs and environmental sustainability;
12 Among others the Terms of Reference (TOR) for TA NO. 2264-COO: Outer Island Power Development Study for the Cook Islands, ADB, May 1998 has been consulted for the preparation of this section.
62

(d) Consider appropriate Demand Side Management (DSM) strategies of all the supply options to be investigated;
(e) Undertake a preliminary Environment Impact Assessment (EIA) in line with the Government’s EIA procedures/guidelines of the recommended supply option interventions;
(f) Ensure that all short, medium, and long-term interventions proposed are consistent with the Cook Islands National Energy Policy (2003);
(g) Consult existing relevant studies and reports. In particular consult relevant sections of the Outer Island Power Development Study for the Cook Islands from 1998 (ADB, TA no. 2264-COO) especially the sections on Aitutaki and compare the development of key parameters including: 1) fuel price; 2) tariffs (including full cost recovery tariff); 3) installed capacity; 4) maximum demand; 5) supply hours; 6) households with different types of appliances (e.g. refrigeration, electric jugs, video, etc); 7) power supply staff numbers; 8) types of costumers (e.g. commercial and domestic); 9) billed kWh; 10) specific fuel consumption; 11) projected vs. actual generation; and 12) projected vs. actual peak load;
(h) Coordinate and collaborate to the extent possible with activities undertaken as part of the on-going Wind Resource Assessment, Feasibility Study and Project Concept Development for Aitutaki and other related local, national and regional activities;
(i) Consult during the whole process as appropriate with major stakeholders such as the Energy Division (ED), Ministry of Works; TAU; Aitutaki Power Supply; Aitutaki Island Secretary, Aitutaki Island Council and Aronga Mana; Office of the Minister for Islands Administration (OMIA), and the Environment Service, Government of the Cook Islands.
In particular:
(j) Briefly describe background and immediate objectives. The description might include but not necessarily be limited to the following: 1) the project idea, its immediate objectives and beneficiaries; 2) dates of essential events; and 3) relevant studies and investigations already undertaken;
(k) Briefly describe the socio-economic context. The description might include but not necessarily be limited to the following: 1) geography, climate and main economic activities; 2) structure of local administration overall and more specifically how it relates to power supply services; 3) size of population, population density, 4) average income per capita; 5) income distribution; 6) occupational distribution; 7) economic growth and growth potentials; 8) willingness and ability of the concerned project beneficiaries to pay for the services; 9) relevant forecasts (e.g. extension of service area(s); population/target group(s); per capita income, etc.). As part of this task, briefly undertake an analysis of general development priorities for the island/village in question. An appropriate methodology could possibly be a qualitative survey technique such as Participatory Rural Appraisal (PRA). Among others this will enable island/village development problems to be ranked according to priority and gender (and/or other relevant variables);
(l) Briefly describe the power sector. The description might include but not necessarily be
63

limited to the following: 1) the relevant public authorities for the sector at national and local levels, roles and responsibilities; 2) government policy and plans for the sector, objectives, strategies, programmes and activities; 3) sector national and local budgets in relevant details and measured in relation to total budgets and other sectors; 4) overall legislative framework for the sector; 5) the organisation of the sector itself, ownership within the sector, degree of organisational and financial autonomy of the power supply entities; 6) service sector coverage at national and local levels; and 7) national norms and standards for the sector (e.g. fuel, efficiency, emissions, treatment and disposal of waste oil, cooling water, etc.);
(m)Describe and assess power/electricity demand, tariff structure, and rates. The description and assessment might include but not necessarily be limited to the following: 1) size and composition of present power/electricity demand; 2) demand projections (these are to be compared with the supply forecasts); 3) tariff structure and rates strategy and forecasted power/electricity rates in 2004 New Zealand Dollars; and 4) the procedure to follow for changing the tariff structure and rates;
(n) Undertake problem analysis. The analysis might include but not necessarily be limited to the following: 1) the present power supply situation; 2) present and potential demand for power services; and 3) short, medium and long term problems to be addressed (legislative, institutional, human resource, technical, environmental, financial, security of supply, etc.). A key here will be the load structure including peak and minimum power requirements, daily load curves and their variability, and forecasts of these parameters for a 5 and 10 year period respectively. Further, a survey of existing appliances being used in households and their daily use times and the inventory of other loads on the islands should be undertaken if appropriate;
(o) Asses and specific in detail what improvements (i.e. rehabilitation and/or expansion) in the short term (i.e. 0-1 years) should be undertaken in the current diesel based power systems . Proposed interventions should look at generation as well as distribution. Concerning generation in particular: 1) review serviceability of all diesel sets, auxiliaries, station service facilities, buildings and other appurtenances; 2) review fuel/oil storage facilities and adequacies; and 3) review cooling water and other service facilities, switchgear, power station transformers, and other electrical (control/protection/operation) facilities. Concerning distribution in particular: 1) review and survey distribution lines, substations, consumer transformers, pole conditions, supports, etc;
(p) Preliminary assess indigenous energy resources. The analysis might include but not necessarily be limited to the following: 1) describe the technically possible local energy resources that can be utilised presently and realistically in a 1-10 years period for power generation; and 2) recommend the most viable of the local energy resources. The resource assessments must include solar, wind and biomass (notably coconut oil);
(q) Assess in detail, technology, and project engineering. This assessment might include but not necessarily be limited to the following: 1) present and forecast needed power supply capacities and characteristics; 2) proposed standards of power supply; 3) power plant technology options including merits and disadvantages and recommended option; 4) power supply network technology options including merits and disadvantages and recommended option; 5) infrastructure (e.g. site, wharf, access roads, etc; 6) overall plant layout; 7) overall building, machinery and equipment specifications; 8) overall procurement and construction supervision model (foreign – local supplies); and 9) overall operation and maintenance
64

engineering requirements (e.g. spare parts and after sales services);
(r) Assess production, operation, and maintenance of inputs. The assessment might include but not necessarily be limited to the following: 1) overall supply programme for fuel, lubricants and cooling water; qualitative properties; quantities; source and origin; availability; unit costs; and 2) overall utilities’; needs; availability; and unit costs;
(s) Describe possible future project/power plant organisation. The description might include but not necessarily be limited to the following: 1) project preparation organisation (e.g. involved parties, possible technical support and their roles and responsibilities); 2) project implementing organisation (e.g. implementing agency, other involved parties, their roles and responsibilities including construction and installation supervision), 3) power supply entity organisation (e.g. roles and responsibilities); and 4) job positions to be filled (e.g. recruitment needs, availability of relevant workforce within reasonable distance from the project);
(t) Briefly outline needed training and technical assistance programme. The outline might include but not necessarily be limited to the following: 1) specification of staff/positions to be trained and the training subjects; 2) training programme (e.g. content and duration of courses, participants, on-the-job or classroom; local, regional or overseas); and 3) technical assistance programme (e.g. specification of expertise needed, time schedule for inputs, placing and the role of expert(s) in the project/plant organisation);
(u) Briefly undertake preliminary Environmental Impact Assessment (EIA) of current and recommended future supply option(s). The general framework for the assessment will be the Cook Islands Government’s EIA procedures/guidelines, but since no specific procedures/guidelines are available with regard to power sector interventions, the Asian Development Bank (ADB) Environmental Guidelines for Selected Industrial and Power Development Projects (1993) will be applied.13 Thus, included will be a description of the actual and potential positive and negative environmental impacts during: i) construction and erection period; and ii) operations period (e.g. external and internal environment, occupational health and safety). The assessment under the construction and erection period might include but not necessarily be limited to the following: 1) social impacts due to employment creation; 2) social impacts due to population relocation; 3) noise impact from construction works; 4) disposal of excavated materials; 5) construction waste, dust and other pollution; 6) disruption of access to houses and business; 7) impacts on surface and groundwater sources; 8) use of and impact on other natural resources; 9) potential areas of conflict with: coastal/inland water, agriculture, forestry/uncultivated land, and other types of area. The assessment under the operations period might include but not necessarily be limited to the following: 1) social impacts due to improved living conditions; 2) reduced air pollution; 3) increased employment conditions; 4) impacts on surface and groundwater resources; 5) cooling water disposal; 6) fly ash and waste oil treatment and disposal; 7) social impacts, including public nuisance due to fuel transport; 8) noise impacts from the operation; 9) energy consumption; and 10) health and safety of workers and the public. Consult extensively among others with Environment Service, GoCI for this activity;
13 These ADB guidelines now are superseded with newer more comprehensive ones. The 1993 guidelines are applied due to the scale of operation on Aitutaki.
65

(v) Outline the budget for different power supply options. The outline might include but not necessarily be limited to the following: 1) investment budget and 2) operation budget;
(w)Undertake economic analysis. A 15-year term and 6% discount rate (when inflation is not considered) should be applied for the analysis;
(x) Undertake financial analysis. The analysis might include but not necessarily be limited to the following: 1) net present value (NPV) of the investment; 2) financial internal rate of return (FIRR); 3) a cost recovery analysis; and 4) relevant sensitivity analysis;
(y) Briefly undertake an assumptions and risks analysis; and
(z) Develop an overall power sector plan. Based on outcomes of the above mentioned activities develop an overall, balanced and realistic power sector plan for the short (0-1 years), medium (2-5 years) and long (6-10 years) term for installation of new generation capacity on Aitutaki to meet the requirements of load growth, reliability, operating costs and environment sustainability.
Regarding Output d) 14
a) Describe the former institutional arrangements for the management, operation, maintenance, etc. of the Aitutaki Power Supply (APS), i.e. island devolution where the island council individually operated the power system. As part hereof describe benefits as well issues experienced with this structural arrangement;
b) Describe existing, i.e. post June 2004 Cabinet decision, or planned institutional arrangements for the management, operation, maintenance, etc. of the Aututaki5 Power Supply (APS), i.e. TAU completely takes over the operation, management and financial control of the island power. As part hereof outline the potential advantages as well as disadvantages of combining the island power utility with TAU; and
c) Review any general and specific decisions, recommendations, documents, etc. made by the GoCI and TAU concerning institutional arrangements for the management, operation, maintenance, etc. of the Aututaki Power Supply (APS) as part of TAU. If required recommend improvements or alternatives to this institutional design covering management, operation, maintenance, etc.
5. REPORTING REQUIREMENTS
14 Among others the TA NO. 2264-COO: Outer Island Power Development Study for the Cook Islands, ADB, May 1998 has been consulted for the preparation of this section including Volume I, Chapter 8 and the Terms of Reference (TOR).
66

Deliverables Date
a. Draft Inception Note To be determined (TBD)
b. Final Inception Note TBD
c. Draft Debriefing Note TBD
d. Final Debriefing Note TBD
e. Draft power sector/feasibility study report including an overall power sector plan
7 TBD
f. Final power sector/feasibility study report including an overall power sector plan
8 TBD
g. Draft review and recommendation paper concerning the institutional arrangements for the incorporation of APS into TAU
9 TBD
h. Final review and recommendation paper concerning the institutional arrangements for the incorporation of APS into TAU
10 TBD
Concerning reporting requirements it should be noted:
a) All outputs produced under the consultancy must be available by end of May 2005;
b) All draft documents should be in Microsoft Word and all final documents in Microsoft Word or Adobe Acrobat format;
c) All documents must have no restriction in access; and
d) All documents must be in clear, unambiguous language. All information contained in the documents except for proper names must be in English.
6.INPUTS
Organisation Input
Energy Division, Ministry of Works, Government of the Cook Islands
a) Organise the consultancy; b) Provide relevant background information and documentation to the consultant(s) regarding relevant plans, programmes/projects, activities, etc.; c) Assist with logistics concerning the field visit; d) Participate in the field visits; and e) Provide input on all the draft documents.
67

TAU a) Provide relevant background information and documentation to the consultant regarding relevant plans, programmes/projects, activities, etc.; b) Assist with logistics concerning the field visit; c) Participate in the field visits; and d) Provide input on all the draft documents.
7. DOCUMENTARY SOURCES
Below specified some of the key documentary sources to be consulted as part of the assignment:
a) Cook Islands National Energy Policy (2003);
b) TA NO. 2264-COO: Outer Island Power Development Study for the Cook Islands, ADB, May 1998;
c) The ADB Environmental Guidelines for Selected Industrial and Power Development Projects, 1993;
d) Pacific Regional Energy Assessment 2004 – Cook Islands National Report, Final Draft Version, Secretariat of the Pacific Regional Environment Programme (SPREP), 2005;
e) Conditions of Supply and Service and Installation Rules for the Supply of Electricity, Te Aponga Uira O Tumu Te Varovaro, 1997.
68

Annex B – List of People Consulted
Ministry of Works Energy Division – Mata Nooroa; Director of Energy
Cook Islands Investment Corporation – Tarita Hutchinson; CEO, Temu; Chairman
Ministry of Outer Islands - CEO
Island Environment Authority – Bobby Bishop
Ministry of Finance & Economic Management, Aid Management Division – Steven Barrett
Te Aponga Uira (Rarotonga Electricity Authority) – Apii Timoti; CEO and Board Members
Aitutaki Island Secretary – Sapati Solomona
Aitutaki Deputy Mayor – Temanu Temanu Jnt and Councillors
Aitutaki Island Administration – Pumati Pumati, Infrastructure Project Manager
Aitutaki Power Supply - Long Tuiravakai, Manager and Staff
Aitutaki Power Supply – Trevor Simmons; Chartered Accountant
Aitutaki Power Supply Interim Board – Ron Maki, Moeau Ngata, George Pick
Aitutaki Lagoon Resort & Spa – Resort Manager and Maintenance Manager
Pacific Resort – Maintenance Engineer
Aitutaki Tourism Association – Michael Henry, President
Aitutaki Vainetini – Women’s NGO
69

Annex C – Inception Note
Aitutaki Power Study
Carried out for the Government of the Cook Islands and funded by the New Zealand Government.
INCEPTION NOTE
Prepared by:
Bruce Clay, Clay Engineering Ltd
May 2005
70

Introduction
In June 2004 the Government of the Cook Islands (GoCI) decided to return the Aitutaki Power Supply (APS) from the Aitutaki Island State Government to the Board of Te Aponga Uira (TAU) to take over the operation, management and financial control of the islands power supply.
As part of this reintegration process this power study aims to assist the GoCI, TAU, the Aitutaki Island State Government and other relevant stakeholders with the practical implementation of this structural reform and secondly to provide a power sector plan recommending power system improvements in the short medium and long term and to investigate the feasibility of including renewable energy technologies.
Key Stakeholders
The following have been identified as key stakeholders in the success of this project:
Ministry of Works and in particular the Energy Division Cook Islands Investment Corporation Te Aponga Uira and Board Office of the Minister for Islands Administration Aitutaki Island State Government and Aronga Mana Aitutaki Power Supply Members of Parliament for Aitutaki Aitutaki Tourism Council Ministry of Environment Aitutaki Environment Council
Objectives and Methodologies
Determine short term improvement of existing power system
Aitutaki Power Supply (APS) is facing serious limitations in generation capacity which needs to be addressed promptly to provide reliability of supply.
During the field trips to Aitutaki power system operational data will be collected, equipment listed and discussions had with power system operators, island administration and council. Based on data and feedback gathered recommendations will be made for short term improvements. Both generation and distribution will be addressed and suitable interventions developed to ensure reliability of supply and address longer term capacity requirements.
71

Determine medium to long term feasibility of supplementing current diesel power systems with renewable energy
In line with the National Energy Policy of promoting the increased use of feasible renewable energy technologies, this project aims to determine medium to long term (2-10 years) options of supplementing the current diesel systems with local indigenous renewable energy sources. Assessment of the various intervention options will consider technical, socio-cultural, economic, financial and institutional/management feasibility as well as environmental impact.
Data and information gathered during missions including operational, load profiles and consultations with stakeholders will be combined with existing studies undertaken in the Cook Islands in developing feasibility options and developing an overall, balanced and realistic power sector plan. Existing relevant studies include the Pacific Islands Renewable Energy Project (PIREP), Outer Island Power Development Study (1998 ADB) plus statistical data from the 2001 Census.
Technically mature renewable energy technologies to be considered for supplementing the current diesel power systems include; solar thermal, solar photovoltaic, wind and biomass. Local energy resource assessment will be based on available resource data and field visit observations. Feasibility analysis will include civil, operational and maintenance requirements and the difficulties of operating and maintaining power systems in remote locations.
Preliminary Environmental Impact Assessment
For each recommended supply option intervention a preliminary EIA will be undertaken. The EIA will be based on the ADB Environmental Guidelines for Selected Industrial and Power Development Projects 1993 and the Cook Islands Government EIA procedures and guidelines.
Data for the assessment will be gathered during the field visits to Aitutaki and from local sources where available. Information would include relevant material pertaining to; land use, noise, biological resources, visual resources, soil erosion and water quality, public health and safety, cultural and ethnographic resources, socio-economics, public services and infrastructure, solid and hazardous wastes, air quality and climate. The preliminary EIA will report existing environmental impacts and potential environmental impacts for recommended power supply development.
72

Power Sector Plan and Report
A power sector plan addressing short, medium and long term will be developed. The plan will encompass a synthesis of project recommendations developed during the feasibility analysis. This plan will be consistent with the National Energy Policy 2003 and will examine various issues including:-
Operational Costs and Budgets Capital Budgets Tariff Structure Demand Growth Organisational requirements Human resources development Environmental sustainability Demand side management strategies Reliability
Institutional Arrangement Review and Report
Former and existing institutional arrangements for the operation, maintenance and financial control of APS will be described and reviewed. Past experience combined with any specific decisions and recommendations made by GoCI and Tau for the incorporation of APS into TAU will be reviewed and an evaluation of options carried out to assess appropriate institutional arrangements.
73

Comments on Critical Issues and the Terms of Reference
Following is a listing of several issues are critical to the effectiveness of this project :-
ISSUE ACTION/COMMENT
Quality data and information Identification of required information and principal sources.
Power system logging to cover as long a time period as possible.
Information, observations and data from previous studies to be corroborated where ever possible.
Effective consultations with stakeholders.
Where necessary carry out qualitative surveys.
Stakeholder involvement in consultations
Consultation with Energy Division, OMIA, TAU and Island Council/Administration to ensure clear direction for APS and to ensure the power sector recommendations are in line with Aitutaki’s strategic development plans.
Local Energy Resource Assessment
A lack of site specific resource data, particularly wind, will require estimation and sensitivity analysis
Proposed Work Plan
Outlined below is the proposed schedule. Dates and activities for the Mission have been agreed by the Cook Islands Director of Energy and the consultants. Background material is currently being reviewed by the consultants and project preparation is well underway. Following over page is the proposed work plan.
74
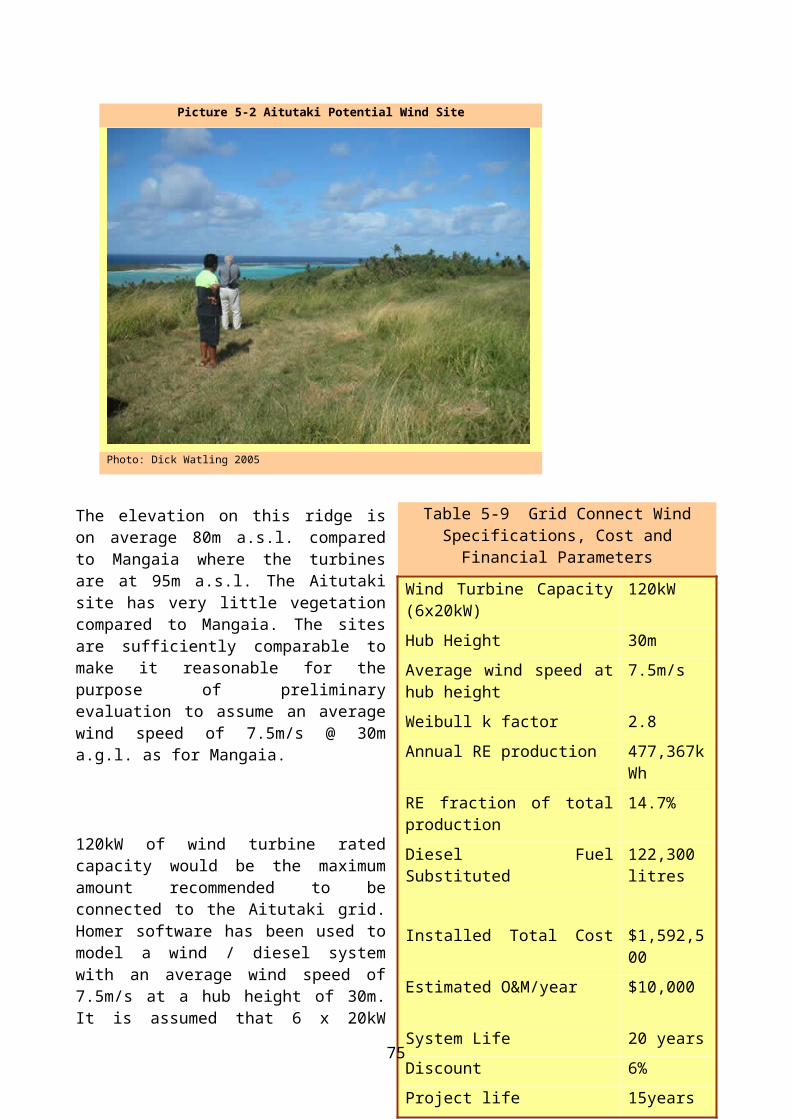
Work Plan
Activity or Milestone Scheduled Date(s)
Project Preparation: Mission Programs, Inception Note, Background material review
10-20 May
Field visit to Aitutaki, meetings with relevant island stakeholders
21-27 May
Visit to Rarotonga for meetings with stakeholders and gathering of any further information required.
28-30 May
Preliminary analysis, debriefing note presentation 30 May
Mission 2b: Debriefing Note presentation 29 – 30 Nay
Detailed Analysis and report preparation 1-14 June
Submission of Draft Report 14 June
Review Period for Draft Report 14 -30 June
Submission of Final Report 30 June
11
Following over page is the planned activity program.
75

Mission Activity Program
Day Activity
21st
MaySaturday AM: Meet with Mata Nooroa, Director of Energy, to discuss
arrangements for the Mission.
Travel to Aitutaki.
PM: Meet with Manager APS to arrange connection of power quality analyser.
22nd
MaySunday - Sunday Church
23rd
MayMonday -Meet with Aitutaki Island Council and Aronga Mana to discuss
current power supply situation (demand, tariff structure, operation), institutional/management issues, potential demand, infrastructure, socio-economics of the island and other pertinent issues.
-Further discussion and familiarisation with APS.
- Information gathering including household and commercial energy data (may include energy auditing where required).
-Arrival of Environmental Consultant.
-Commencement of environmental assessment.
24th
– 25th
May
Tuesday - Wednesday
- Information gathering continued including household and non-domestic energy data (may include energy auditing where required). Ongoing discussions and information gathering on institutional arrangements.
- Ongoing environmental assessment and information collection.
- Investigate potential local energy resources, physical and institutional conditions (geographic conditions, infrastructure etc ) relating to power generation development.
26th
MayThursday AM: Further investigation and information gathering
- Disconnect power logger.
- Meet with Island Council, Administration and APS for discussion of preliminary findings and project development.
PM: Travel Aitutaki - Rarotonga
27th
– 28th
Friday - Saturday
-Preliminary analysis/Prepare debriefing note and gather any required information.
-Meetings with Director of Energy and relevant stakeholders including TAU, OMIA, CIIC, and Government ministries.
29th
MaySunday - Sunday Church.
30th
MayMonday - Ongoing meetings with stakeholders.
- Presentation of Debriefing Note.
76

Annex D – Documentary Sources
ADB ADB Cook Islands Power Development Study 1998ADB ADB EIA Guidelines for Power Projects 1993CIA World Factbook: Fiji chapter 2004
FEDPacific-Danish Environmental Education and Action Program – Feasibility Study of Phase 1, prepared by COWI/Risoe, January 1998
GoCI Cook Islands National Energy Policy 2003GoCI Environment Act 2003GoCI Environment Service Environmental Significance DeclarationGoCI Cook Islands 2001 Population CensusGoCI Cook Islands Budget Policy Statement 2005-06GoCI Outer Island Budget Outputs 2004-2005
GoCIRecord for Technical Data for the Outer Islands prepared by the Energy Division
GoCI Budget Policy Statement 2004-2005
GoCIMangaia AWS Wind Data 2001-2003 prepared by the Meteorological Office
GoCIMauke AWS Wind Data 2001-2003 prepared by the Meteorological Office
GoCI Cook Islands 2000 Census of Agriculture & Fisheries
GoCIAitutaki Tourism Study, Peter Phillips, Roger Malcolm 2003Cook Islands Tourism Study 2005-2015
GoCIThe Climate and Weather of the Southern Cook Islands prepared by New Zealand Meteorological Service
PREFACEMangaia – Cook Islands Feasibility Study for a Wind Farm Connected on the Diesel Grid, prepared by Vergnet SA December 2001
PREFACEPre-feasibility study of wind power projects on Rarotonga, Atiu & Mangaia – May 1999 – Prepared by Vergnet SA, Laurent Albuisson
SOPACCopra Oil as a Biofuel in Pacific Islands - Challenges and Opportunities prepared by Jan Cloin
TAUConditions of Supply and Service Installation Rules for the Supply of Electricity, TAU 1997
AIDABHV Network Deelopment, Merz & McLellan & Partners 1988Aitutaki Power Supply, Mertz Report 1991
UNDPGEF/ UNDP Pacific Islands Renewable Energy Project (PIREP) Draft Cook Islands National Report May 2004
77

Annex E – Debriefing Note
Aitutaki Power Study
Carried out for the Government of the Cook Islands through the Energy Division. Funded by the New Zealand Government.
DEBRIEFING NOTE
78

Prepared by:
Bruce Clay, Herb Wade, Dick Watling
Introduction
In June 2004 the Government of the Cook Islands (GoCI) decided to transfer control of the Aitutaki Power Supply (APS) from the Aitutaki Island Local Government to the Board of Te Aponga Uira (TAU) to take over the operation, management and financial control of the islands power supply. This power study aims to (1) assist the GoCI, TAU, the Aitutaki Island Local Government and other relevant stakeholders with the practical implementation of this structural reform; (2) to provide a power sector plan recommending power system improvements in the short medium and long term; and (3) to investigate the feasibility of including renewable energy technologiesKey Stakeholders
The following have been identified as the key stakeholders of this project:
Ministry of Works and in particular the Energy Division Cook Islands Investment Corporation Te Aponga Uira and Board Office of the Minister for Islands Administration Aitutaki Island Local Government and Aronga Mana Aitutaki Power Supply Members of Parliament for Aitutaki Aitutaki Tourism Council Ministry of Environment Aitutaki Environment Council
Objectives
This project has five main objectives briefly outlined as follows:-
A) Determine short term improvements of the existing power systemIn view of the current serious limitations in generation capacity and distribution
recommend short term interventions to ensure reliability of supply and address longer term capacity requirements.
B) Determine medium to long term feasibility of supplementing current diesel power systems with renewable energy
Investigations of appropriate feasible renewable energy technologies which could supplement the diesel power system.
C) Preliminary Environmental Impact AssessmentExamination of the environmental impacts of existing and proposed interventions for
the power system.79

D) Power Sector PlanFormulation of a plan encompassing project recommendations which addresses
short, medium and long term development of the power system. Issues addressed include:-
Operational Costs and Budgets Capital Budgets Tariff Structure Demand Growth Organisational requirements Human resources development Environmental sustainability Demand side management strategies Reliability
E) Institutional Arrangement ReportReview past and existing arrangements and investigate appropriate institutional
arrangements for the integration of Aitutaki Power Supply into Te Aponga Uira.
Information Gathered on Mission
During the mission information was gathered on many aspects of the operation of APS. Consultations were had with stakeholders including the APS Interim Board, Island Council, community and tourism groups, environment groups and tourism operators.
Following is an outline of main areas of information collected:-
Logged generation and power quality data Existing plant operational status Distribution layout and specifications Distribution equipment status Fuel arrangements APS Personnel arrangements APS billing and administration system Consumer distribution Tourism planning Community comments on APS
80

Description of Existing Power System
APS operates the only power generation and distribution system on Aitutaki though some backup generators are present at resorts and other facilities. APS is currently under the control of a Government appointed interim board of three persons. Previously the Aitutaki Island Council and Administration was responsible for its operation.
APS staffing is as follows:-
Manager – R. “Long” Tuiravakai
2 x Admin/Accounting
5 x Station Operators
3 x Mechanics
2 x Linesman
The power station consists of an older concrete and timber structure of approximately 450 m2.
Current Installed Generation Capacity
Generator Model Rated kW StatusGEN #1 Blackstone
ERS8462 Operating to 90% capacity
GEN #2 Blackstone ERS8
462 Under major overhaul
GEN #3 Blackstone EV8 240 Out of service
GEN #4 Blackstone EV8 240 Requiring major overhaul
GEN #5 Cat V12 Hire Set 600 On load continuously
Daily Peak Load 570kW (evenings 18:30 – 20:30)
Minimum Load 240kW (early morning 02:00-04:00)
Average Monthly Diesel Fuel Consumption 77,200 litres
Average Specific Fuel Consumption 3.39 kWh/litre
Distribution is by way of underground 11kV and 3.3kV high voltage with a 11kV/600kVA and 3.3kV/200kVA step up transformers at the power house.
81

There are a total of 19 substations on the HV network; 9 x 3.3kV and 10 x 11KV.
Nine new 11kV substations and associated underground cabling have been installed since 1992 and are in reasonably good condition. All 3.3kV substations and associated cabling are close to forty years old and in need of upgrade. The tenth 11kV substation, using a surplus transformer from Rarotonga, has been integrated into one of the older 3.3kV stations and is dangerous and in urgent need of upgrade.
Fuel is supplied monthly by Reef Shipping directly from Auckland under contract. Fuel is shipped in 20,000 litre containerised tanks, off loaded to the island’s barge and carted to the power station for discharge into the station’s bulk tanks. The fuel supply contract is currently out to tender with Reef Shipping and local suppliers having submitted their bids.
Bulk fuel storage capacity at the power house is 58,000 litres which is below one month’s supply and requires one of the containerised tanks to remain on site to ensure a month’s supply is available. This is considered inadequate and in fact late delivery has in the past forced rolling blackouts and load shedding to stretch fuel supplies.
Landed cost of fuel has increased from $0.79/litre in November 2003 to $0.98/litre in May 2005.
Current Tariffs (VEP):-
Domestic $0.45/kWh
Commercial $0.60/kWh for first 1000kWh then $0.45/kWh thereafter
Pacific and Akitua Resorts $0.60/kWh (from 20th April 05)
Short Term Recommendations
Preliminary findings indicate the following short term interventions:
GenerationInstallation of 3 x 400kW generators with associated switchgear and semi-automatic control.
Power StationInstallation of at least an additional 60,000 litres of bulk fuel storage
Purchase of 5 tonne Hyab crane truck
Refurbishment of power station
82

DistributionUpgrade of four 3.3kV substations to 11kV
Refurbish the combined 3.3kV and 11kV substation with modern equipment
Upgrade of aged and undersized LV distribution.
Tariff ReviewTariff may include a fuel component that fluctuates with fuel prices.
Tariff should not decrease with consumption as this does not encourage conservation and increases power station costs due to increased capacity requirement.
Capital investment required for short term interventions is initially estimated to be in the order of $1.5m.
Medium to Long Term Recommendations
Preliminary findings indicate the following medium to long term recommendations:-
Renewable Energy GenerationWind – Direct grid connection of up to 100kWr of wind turbines may be feasible. Wind monitoring data over the next 12 months should confirm it viability
Solar – Given that the peak demand is in the evenings it is unlikely solar will be viable unless fuel prices increase significantly
Biomass – Limited resources, particularly of coconut, rules out local biofuel production in the medium term and the available biomass resource is not sufficient to provide any significant contribution to the power supply.
Demand Side ManagementEncourage and proactively promote demand side management measures at both the commercial and domestic level.
DistributionUpgrade all remaining 3.3kV substations to 11kV. Addition of new 11kV substation at Pirake.
Upgrade of LV distribution
Introduction of integrated billing system possible as per TAU.
Staff training as an ongoing programme with field training provided by TAU personnel.
83

1. PRELIMINARY EIA AND REVIEW
Issue Comment Recommendation
Current Operation
Fuel Handling
Two serious historic incidents 1) rupture of fuel line contaminated Govt. station groundwater supply; 2) Loss overboard of 20,000 litre tank full of diesel – not recovered
Introduce Code of Environmental Practice (COEP)
Waste Oil
Major on-going waste oil spillage-discharge mixed with stormwater drains to outside sump. Now a contaminated site seeping oil. A significant liability in any transfer of ownership
Urgent professional clean up – removal of all contaminated soil. Install separators. Introduce COEP
Bulk StorageBulk diesel storage tanks – single skinned and without any bunding or containment
Replace tanks and install full containment and bunding. COEP
Water UseExcessive water use for cooling towers and blowdown-overflow mixes with waste oil to the sump
New generator sets should have radiator type forced- air coolers. No mixing of storm or other water with power station discharges COEP
Issue Comment RecommendationAsbestos Roofing
Roof leaks - handling of asbestos is a problem
Replace roof.Deposit asbestos in safe facility
Transformers, Capacitors,
Batteries
Stockpile of old transformers near power station – adjacent to rupturing sacks of ?fertiliser. Transformer oil is a major source of highly persistent PCBs. No procedures for battery disposal
Remove Transformers from the island for professional disposal; Introduce COEP for storage and removal of these, batteries and capacitors.
Noise
Old generators are noisy. Residences are now being built in areas close to the power station and are affected by the noise
Provide acoustic controls and proper silencers for engines. Introduce planning controls
Possible Future Power Supply Interventions
Solar power – photo voltaics
If feasible, use of solar power will have no significant negative environmental impact, rather it will be environmentally beneficial on several counts.
84

Power costs Can assist in offsetting fuel costs.
Ensure any reductions are passed on to the consumer
Visual Banks of solar panels can be unattractive
Site in appropriate place – area around current power station appears good
Wind power – wind
generators
If feasible, use of wind power is unlikely to have any negative environmental impact, rather it will be environmentally beneficial on several counts. However, wind turbines are likely to be controversial on visual and noise grounds, and Aitutaki has an endangered bird of great scientific and cultural interest. These together necessitate a thorough EIA be undertaken.
Power costs Can assist in offsetting fuel costs.
Ensure any reductions are passed on to the consumer
Visual
Wind turbines will need to be placed in visually conspicuous locations. As such there will be polarised opinion within the community.
Appropriate location. Ensure thorough consultation is undertaken as part of an EIA
Noise
Turbines are often considered to be a noise nuisance, although modern turbines are much quieter than the older ones.
Appropriate location. Ensure thorough consultation is undertaken as part of an EIA
Blue Nun Bird
(Ultramarine Lorikeet)
An endangered species, only found on Aitutaki in the Cook Islands and of scientific, tourist and cultural interest
Ensure that the EIA commissions a professional study of the possible impact of wind turbines on this bird.
Institutional Arrangements
Aitutaki Customer Distribution and tariffs
From a tariff point of view, there are three classes of customers, the two large resorts, commercial customers and domestic or government customers. Current tariffs have domestic and government customers on a flat rate of $0.45 per unit, commercial customers pay $0.60 per unit for the first 1000 units and $0.45 per unit for those used in excess of the base 1000. The Island Council and the Resorts negotiated a tariff of $0.47 for the first 50,000 units and $0.40 for those units in excess of 50,000 but this was increased by the new Board on April 20, 2005, to a flat rate for the resorts of $0.60 per kWh.
85

In 2004, the two resorts together paid about $43,000 per month for electricity, domestic and government customers about $43,500 per month and commercial customers about $27,500 per month for a total of about $114,000 per month. The customer distribution (2004) as regards monthly usage is shown on the tables on the next page. It is noted that in the commercial sector the great majority of customers (86 out of the 97 total commercial customers) use less than 1000 kWh/month and therefore pay all electricity at $0.60 per unit. The larger Akitua resort averages less than 51,000 kWh/month and the Pacific Resort never reaches 50,000 kWh/month with its average usage of about 33,000 kWh/month; so in 2004 the resorts are effectively paying $0.47 per kWh. This tariff structure resulted in the unusual situation of many small commercial operators on Aitutaki subsidizing the two very large commercial operators. Since the actual cost of providing a unit of electrical service is almost certainly substantially higher than $0.47, government and aid donors are in essence heavily subsidizing the large resorts about equally with the domestic users. The new tariff introduced in April 2004 corrects this inequality.
In 2004, around 88% of Domestic customers used less than 225 units per month with an average per household usage of about 145 kWh/month, an amount sufficient for a full range of household appliances including TV, fridge, fans and small kitchen appliances but little in the way of air conditioning, electric water heating or electric cooking. Discussions with islanders indicate that this is in fact generally the norm for households on Aitutaki but without actual survey data the household energy patterns can only be estimated. The upcoming household survey will provide detailed appliance ownership information but that information will not be available in time for use in this study.
Unlike many poorer islands, only about 10% of Aitutaki meters show usage less than 25 kWh/month (sufficient for lighting and TV) and many of those are represented by meters on workshops and part time dwellings so the concept of a “life line” tariff does not appear to be appropriate to offset poverty in Aitutake.
Considerable analysis of the data collected remains before a proper estimate of service delivery cost can be made but such analyses have been carried out in other Pacific countries for small power systems comparable to that of Aitutaki. Those analyses show an actual per unit cost in excess of $1.00. In Fiji, for example, FEA estimated in 2003 that their Ovalau diesel facility delivered power to customers at over FJ$1.50 per unit. Estimates by the GM of the Tuvalu Electric Corporation indicate a delivered power cost of over A$1.00 per unit.
86

Distribution of Commercial Customers
0
5
10
15
20
25
30
1 3 5 7 9 11 13 15 17 19 21 23 25 27 29 31 33 35 37 39 41 43 45 47 49 51 53 55 57hundreds of kWh/month
Num
ber o
f Cus
tom
ers
Structure and Organisation
The internal structure of the Aitutaki utility appears reasonable given the physical plant that must be operated and maintained. As with most small utilities,
Title Years of Service
Manager 22
Linesman/Supervisor 23
Linesman 4
Mechanic 11
Station Mechanic 3
Mechanic 2
Operator 15
Operator 7
Operator 6
Operator 6
Operator 5
Admin Officer 8
Admin Assistant New
87

personnel titles are only an indicator of their actual work since almost everyone must perform multiple duties and must stand in for other workers who are sick or on leave. The table indicates the current staffing situation by job title and years of service.
Since the plant provides 24 hour power, at least three operator shifts are needed and with the current equipment, multiple operators are sometimes required, one at the console and one at the engine. Operators also perform meter-reading duties (the position of meter-reader is vacant at this time) and light mechanic duties as well as the general power house duties of plant operation. From time to time casual labour has been needed. In recent years, casual labourers have effectively become permanent wage earners under the utility, a practice that needs to be reviewed.
In general, the team found the Aitutaki power system to be better managed than most outer island utilities around the Pacific and its primary problems are seen to be associated with inadequate resources for generation and distribution and maintenance not poor management. We note that the utility staff has provided generally reliable and good quality power for many years even though they have had to use second hand equipment for which spare parts have been increasingly difficult to obtain and have had to perform manually and skilfully many operating functions that with modern equipment would be automatic.
The system for meter reading and billing was adequate for the smaller customer base some years ago but today with around 800 meters in place, the mostly manual system needs to be reviewed and computers better integrated both in order to shorten the time needed to prepare bills, read meters and provide invoices and to reduce the errors that invariably arise in manually calculated billings, particularly for commercial customers where multiple tariff rates may have to be calculated. The accounting system uses Quick Books, an excellent small business accounting system and one that appears to be providing good financial information to the utility but does not provide many of the features needed for utility use and is not used to generate invoices, they are prepared entirely by hand over a two week period that uses over 20 books of invoices per month. The team notes that the only record of meter readings and kWh usage appears on the original meter reader/invoice paper. Nothing is available from the computer except the financial records. This makes analysis of individual customer power use awkward and time consuming and that is essential data for understanding the power system needs, the effect of tariffs on utility finances and how tariffs affect the customers.
Relationship to TAU
The Aitutaki power system has operated under the Rarotonga Power Utility (then EPS), under the Energy Division and under the Island Council. Each of the three institutional approaches has its own advantages and disadvantages.
From the point of view of providing reliable power while maintaining efficient power system operation and maintenance it is clear that the sharing of technical, personnel and other resources with TAU can be very beneficial to the Aitutaki power system. However, from earlier experience it is clear that attempting to actually manage the island power system
88
from Rarotonga is difficult, expensive and inefficient. Though further discussions with stakeholders need to be held before a final recommendation can be made, making the Aitutaki system a wholly owned subsidiary of TAU appears to provide most of the advantages of direct integration of the Aitutaki power system into TAU while still allowing the local management reasonable freedom to continue the generally good job of system management they have shown in the past.
As a subsidiary company, the Aitutaki utility could have its own Board of Directors, with most Board members coming from Aitutaki, and remain responsive to the specific needs of its market while TAU would be expected to provide technical support, training, management assistance, assistance in obtaining capital finance, assistance in tariff structuring and periodically perform management and financial audits to ensure that its subsidiary was operating competently and efficiently. The Aitutaki subsidiary would be expected to operate on the same quasi-commercial terms as TAU and use technical, operational and environmental standards set by TAU.
Work Plan
Following meetings with stakeholders in Rarotonga, the team will concentrate on developing the detailed report which will build on the data collected during the field visits. The report will include a detailed power sector/feasibility study including an overall power sector plan and a review and recommendation paper concerning the institutional arrangements for the incorporation of APS into TAU. The draft report is scheduled for completion by 14 June, 2005.
89