atalian q2 2014 2015 vdef · pdf fileq2 2015 results disclaimer certain statements in this...
TRANSCRIPT
AtalianQ2 2015 results
Confidential
May 13, 2015

Q2 2015 RESULTS
Disclaimer
Certain statements in this presentation are forward-looking. All statements other than statements of historical facts included in this presentation, including, without limitation, those regarding the Company’s financial position, business strategy, plans and objectives of management for future operations, are forward-looking statements. By their nature, such forward-looking statements involve known and unknown risks, uncertainties and other important factors that could cause the actual results, performance or achievements of the Company to be materially different from results, performance or achievements expressed or implied by such forward-looking statements. These include, among other factors, changes in economic, business, social, political and market conditions, success of business and operating initiatives, and changes in the legal and regulatory environment and other government actions. These and other factors could adversely affect the outcome and financial effects of the plans and events described herein. Forward-looking statements contained in this presentation regarding past trends or activities should not be taken as a representation that such trends or activities will continue in the future. The Company does not undertake any obligation to update or revise any forward-looking statements, whether as a result of new information, future events or otherwise. You should not place undue reliance on forward-looking statements, which speak only as of the date of this presentation.
Information contained herein relating to markets, market size, market share, market position, growth rates, penetration rates and other industry data pertaining to the Company’s business is based on the Company’s estimates and is provided solely for illustrative purposes. In many cases, there is no readily available external information to validate market-related analyses and estimates, thus requiring the Company to rely on internal surveys and studies. The Company has also compiled, extracted and reproduced market or other industry data from external sources, including third parties or industry or general publications, for the purposes of its internal surveys and studies. Any such information may be subject to significant uncertainty due to differing definitions of the relevant markets and market segments described.
This presentation contains references to certain non-IFRS financial measures and operating measures. These supplemental measures should not be viewed in isolation or as alternatives to measures of the Company’s financial condition, results of operations or cash flows as presented in accordance with IFRS in its consolidated financial statements. The non-IFRS financial and operating measures used by the Company may differ from, and not be comparable to, similarly titled measures used by other companies.
1

Q2 2015 RESULTS 2
Summary & presenting team
Loïc Evrard
Chief Finance Officer of ATALIAN Group
Loïc Evrard
Chief Finance Officer of ATALIAN Group
Matthieu de Baynast
Chairman of ATALIAN International
Matthieu de Baynast
Chairman of ATALIAN International
KEY HIGHLIGHTS OF Q2 2015
BUSINESS REVIEW
FINANCIAL REVIEW
STRATEGY UPDATE
1
2
3
4
3
8
12
17

Q2 2015 RESULTS 3
KEY HIGHLIGHTS OF Q2 20151

Q2 2015 RESULTS
Financial performance
Focus on the Q2 2015
Continued results improvement– Group revenue: €334m in Q2 2015 vs. €312m in Q2 2014, +7.0%– Slight increase of EBITDA at €23m ; EBITDA margin improvement from 6.6% in Q2 2014 to 6.9 % in Q2 2015– Adjusted net debt of €332m (3.5x proforma(1) EBITDA) vs. €319m (3.5x proforma(2) EBITDA) in FY 2014
4
1. Key highlights of Q2 2015
Main events of H1 2015
Acquisitions– Croatia: acquisition of ISS subsidiaries (International Service Solutions) operating in facility management
services with around €3m of revenues (full year) – Completed in December 2014
– Poland: acquisition of Metro Property Services (FY revenue around €47m) – Completed in February 2015
– Turkey: acquisition of a 51% controlling interest in Ekol (FY revenue around €20m) – Completed in February 2015
Post H1 2015 events
Acquisitions (to be completed in Q3)– Philippines: acquisition of a 10% non-controlling interest in CBM (FY revenue around $17m)
– Thailand: acquisition of a 51% controlling interest in CIS & COM (FY revenue around $10m)
– Morocco: acquisition of a 60% controlling interest in Cleaning services & Facilities (FY revenue around €8m)
– Ivory Coast: acquisition of a 51% controlling interest in Cleaning activities
– Russia: acquisition of a 51% controlling interest in Primex (Cleaning activities – FY revenue around €13m)
Current LOI (SPA to be signed in Q3)– Indonesia: acquisition of a 60% controlling interest in Cleaning services
– Vietnam: acquisition of a 51% controlling interest in Cleaning activities (FY revenue around $10m)
– Serbia: acquisition of a 56% controlling interest in Cleaning services (FY revenue around €4m)
Disposal of non-core activities– Landscaping: exclusive discussion with an investments fund company (completed in March 2015)
– Public lighting: disposal signed on March 17, 2015
(1) Proforma EBITDA Q1 2015 is calculated on a 12-month period and as if the acquisition of Harta realized in November 2014 had occurred on September 1 st, 2014
(2) Proforma EBITDA 2014 is calculated as if the acquis itions realized during the fiscal year 2014 (NiwakiGroup subsidiaries, Etkin and acquisitions in South East Asia) had occurred on September 1 st, 2013

Q2 2015 RESULTS
EBITDA increased from €39m in H1 2014 to €43m in H1 2015 (+10%)
EBITDA margin reached 6.5% in H1 2015 vs 6.2% in H1 2014
Key figures – H1 2015
5
1. Key highlights of Q2 2015
(1) (1) Including inter-sectors transactions (€(9.9)m in H1 2015 and €(11.9)m in H1 2014) (2) Including Holding costs
Increase of revenue mainly due to external growth in Cleaning and International activities
Decrease of revenue in Facility management services mainly due to a decline in Construction business and a gap in Landscaping activities orders in H1 2015

Q2 2015 RESULTS 6
Revenue – Q2 2015
FRANCE
− Revenue remained stable in Cleaningactivities mainly due to
1) External growth related to acquisition of 5 subsidiaries from Niwaki Group
2) Loss of contracts following Atalianpolicy of not accepting very low prices
− Organic growth in Facility Management is taken by ending Construction activities
INTERNATIONAL
− Strong increase in revenue (+€15m) mainly due to
1) External growth linked to Asian acquisitions (Harta and Tritunggal)
2) Organic growth increased by 11% in recurring business
− Including negative impact from stopping Construction activities
1. Key highlights of Q2 2015

Q2 2015 RESULTS
EBITDA by quarter
(1) Including Holding costs
7
1. Key highlights of Q2 2015

Q2 2015 RESULTS 8
BUSINESS REVIEW2

Q2 2015 RESULTS
Q2 2015 Group revenuein € millions
Positive impact of change in scope, mainly related to Cleaning activities (+€5.7m) and International (+€15.6m), partially reduced by stopping overall Construction activities (-€3.8m)
9
2. Business review
Despite a complicated market, especially for Cleaning, slight increase of Group organic growth by +1.0%
Forex impact of €0.7m essentially due to Turkish lira

Q2 2015 RESULTS 10
Q2 2015 Consolidated EBITDA
Improvement of Q2 results: EBITDA level reached €22.9m in Q2 2015 (+11.2%), corresponding to 6.9% of EBITDA margin, around 30 bps higher than Q2 2014
Slight increase of percentage of revenue for raw materials & consumables used mainly due to International new activities (Harta) and change in scope essentially due to Etkin (3 months consolidated in 2014 and 6 months in 2015)
Continued cost control in global other operating expenses
2. Business review
in €M Q2 2015 Q2 2014 Change H1 2015 H1 2014 Change
Revenue 333.6 311.7 7.0% 656.0 632.0 3.8%
Payroll costs (208.9) (197.1) (415.5) (398.8)
% of revenue 62.6% 63.2% 63.3% 63.1%
Raw materials & consumables used (75.1) (66.7) (143.8) (138.6)
% of revenue 22.5% 21.4% 21.9% 21.9%
External expenses (20.5) (19.7) (41.8) (41.6)
% of revenue 6.1% 6.3% 6.4% 6.6%
Other operating income & expenses (6.2) (7.6) (12.0) (14.0)
% of revenue 1.9% 2.4% 1.8% 2.2%
Total operating costs (310.7) (291.1) 6.7% (613.1) (593.0) 3.4%
% of revenue 93.1% 93.4% 93.5% 93.8%
EBITDA 22.9 20.6 11.2% 42.9 39.0 10.0%
EBITDA margin 6.9% 6.6% 6.5% 6.2%
Q2 2015 RESULTS
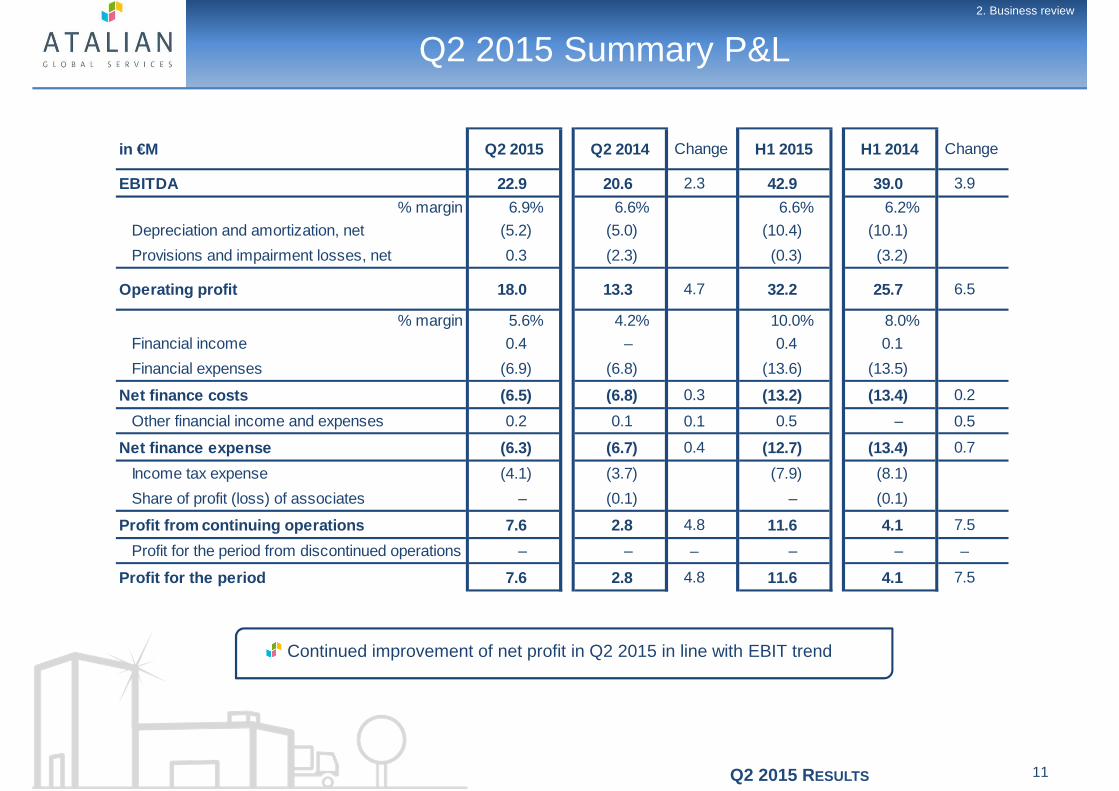
Q2 2015 Summary P&L2. Business review
11
Continued improvement of net profit in Q2 2015 in line with EBIT trend
in €M Q2 2015 Q2 2014 Change H1 2015 H1 2014 Change
EBITDA 22.9 20.6 2.3 42.9 39.0 3.9
% margin 6.9% 6.6% 6.6% 6.2%
Depreciation and amortization, net (5.2) (5.0) (10.4) (10.1)
Provisions and impairment losses, net 0.3 (2.3) (0.3) (3.2)
Operating profit 18.0 13.3 4.7 32.2 25.7 6.5
% margin 5.6% 4.2% 10.0% 8.0%
Financial income 0.4 – 0.4 0.1
Financial expenses (6.9) (6.8) (13.6) (13.5)
Net finance costs (6.5) (6.8) 0.3 (13.2) (13.4) 0.2
Other financial income and expenses 0.2 0.1 0.1 0.5 – 0.5
Net finance expense (6.3) (6.7) 0.4 (12.7) (13.4) 0.7
Income tax expense (4.1) (3.7) (7.9) (8.1)
Share of profit (loss) of associates – (0.1) – (0.1)
Profit from continuing operations 7.6 2.8 4.8 11.6 4.1 7.5
Profit for the period from discontinued operations – – – – – –
Profit for the period 7.6 2.8 4.8 11.6 4.1 7.5

Q2 2015 RESULTS 12
FINANCIAL REVIEW3

Q2 2015 RESULTS
Net debt
In €m Factoring loans
Revolving Credit Facility
Confirmed lines 130.0 18.0
Utilised lines 121.9 -
Head room 8.1 18.0
13
Reported net debt increased to
€332m as of H1 2015 (+€13m vs. net debt as of August 31, 2014)
Net leverage stabilized at 3.5x
3. Financial review
(1) Adjusted of the deconsolidating factoring of rec eivables
(2) Proforma EBITDA Q1 2015 is calculated on a 12-month period and as if the acquisition of Harta realized in November 2014 had occurred on Septe mber 1 st, 2014
in €M H1 2015FY
2014H1 2014
Net cash and cash equivalents 58.1 65.5 61.3
HY bonds 250.0 250.0 250.0
Factoring 54.5 41.2 29.6
Others 17.7 14.4 21.7
Total gross debt 322.2 305.6 301.3
Total net debt 264.1 240.1 240.0
Deconsolidated Factoring 67.4 78.5 88.1
Adjusted Net Debt (1) 331.5 318.6 328.1
Net debt / proforma EBITDA (2) 3.5x 3.5x 4.2x

Q2 2015 RESULTS
Net debt evolution (H1)in € millions
14
3. Financial review

Q2 2015 RESULTS
Key cash flow items
15
Decrease of pre-tax free cash flow of -€23.1m due to:
– Change in working capital: positive effect in Q1 & Q2 2014 mainly due to DSO improvement essentially in Multi-technical Services
– Maintenance capex: continued capex discipline at an average level of 1% of revenue
– Expansion capex: mainly related to the acquisition of Harta in Malaysia, Ekol in Turkey and Metro in Poland
3. Financial review
in €M
2015 2014 Change 2015 2014 Change 2015 2014 Change
EBITDA 20.0 18.4 1.6 22.9 20.6 2.3 42.9 39.0 3.9
Change in Working Capital (6.3) 4.5 (10.8) 4.9 6.4 (1.5) (1.4) 10.9 (12.3)
Capex (10.1) (2.9) (7.2) (13.1) (5.6) (7.5) (23.2) (8.5) (14.7)
o/w maintenance capex, net (4.1) (2.9) (1.2) (2.7) (2.9) 0.2 (6.8) (5.8) (1.0)
o/w expansion capex, net (6.0) – (6.0) (10.4) (2.7) (7.7) (16.4) (2.7) (13.7)
Unlevered pre-tax free cash flow 3.6 20.0 (16.4) 14.7 21.4 (6.7) 18.3 41.4 (23.1)
H1Q1 Q2

Q2 2015 RESULTS
Net cash evolution (H1)in € millions
16
3. Financial review

Q2 2015 RESULTS 17
STRATEGY UPDATE4

Q2 2015 RESULTS
Strategy update and outlook
18
4. Strategy update
INTERNATIONAL
− Asia: steadily increasing
− Morocco / West Africa: some significant targets to be integrated in Q3 2015
FRANCE
− In this challenging environment, the management team will continue to focus on productivity plan, cost control and cash management
− Facility Management :
• Developing an Innovation hub: structuring in progress – key projects for the future of Atalian Group (robotics engineering, connected buildings…)
• Asset divestments in process: exit of non-core activities such as Landscaping, Transportation

Q2 2015 RESULTS 19
Atalian Q2 2015 results
Q&A

Q2 2015 RESULTS 20
APPENDICES

Q2 2015 RESULTS
Summary of consolidated statement of financial position
In €M 1st Half 2015
Year ended August 31, 2014
Intangible assets 441.4 429.8
Property, plant and equipment 41.6 40.5
Other non-current assets 67.6 65.3
Trade receivables 248.6 208.0
Cash and cash equivalents 63.1 69.7
Other current assets 113.5 114.9
Total assets 975.8 928.2
Capital (including non-controlling interests) 139.6 133.1
Financial debt (current and non-current) 322.2 305.7
Other non-current liabilities 8.9 8.9
Trade payables 126.1 115.4
Bank overdrafts 5.0 4.2
Other current liabilities 374.0 360.9
Total liabilities 975.8 928.2
21
Appendices
