at thecenter of connectivity
TRANSCRIPT

Intersi l2 0 0 0 A N N U A L R E P O R T
a t t h e CENTER o f c o n n e c t i v i t y

1
3
7
8
11
12
14
16
17
18
30
30
31
32
33
34
Intersil™ designs and develops silicon-based solutions that enable wireless connectivity for people at home, at the office or on the go.
The company is a leading supplier of semiconductors, reference designs and software for wireless access and communications analog
markets. Intersil applies analog, mixed-signal and radio frequency (RF) expertise to the development of products that address specific
applications within communications — including wireless connectivity to broadband media; data conversion and telecommunications
within wide area networks (WANs); and power management for desktop/laptop PCs, network servers and portable information appliances.
Based in Irvine, California, Intersil employs 3,000 people worldwide. The company trades on the NASDAQ under the ticker symbol ISIL.
More information about Intersil is available on the Internet at www.intersil.com.
INTERSIL
3
11
OUR VISION
WIRELESS ACCESS PORTFOLIO
PRISM® Wireless networking products for work/home
Broadband Wireless Access (BWA) modem solutions for cellular networks
CommLink™ digital radio circuits for cellular networks
COMMUNICATIONS ANALOG PORTFOLIO
Endura™ power management products for computers and mobile devices
Other si l icon solut ions, including interface circuits , switches and converters
SHAREHOLDER LETTER
INTERSIL CUSTOMERS AND APPLICATIONS
FINANCIAL STATEMENTS
Management ’s Discussion and Analysis
Consol idated Statements of Operat ions
Consol idated Statements of Comprehensive Income
Consol idated Balance Sheets
Consol idated Statements of Cash Flows
Consol idated Statements of Shareholders ’ Equity
Notes to Consol idated Financial Statements
I N S I D E

INTERSIL enables persona l f reedom by pu t t ing peop le a t the cen ter o f connec t iv i t y.
Our company is a leading supplier of semiconductors, reference designs and software for communications networks and mobile devices. Our semiconductor architecturesput users at the center of the “wireless revolution”— providing high-speed wireless access to broadband content. At work, at home and on the go, Intersil networkingsolutions connect people to Internet data, voice and video. Our analog semiconductors turn on the Internet, process signals and manage power for high-speed wirelessdevices. Intersil is at the center of connectivity today… and tomorrow.
WAKE UP AND SHOWER… QUICK BREAKFAST… CHECK EMAIL AND NOTIFY
1 • AR 2000

Wireless access from any room in the house.
AT H O M E
INTERSIL • 2

3 • AR 2000
STAFF… CHECK STOCK REPORT AND WEATHER UPDATE… E-MA I L B I L L THE NOTES FROM YESTERDAY ’S EARLY CL I ENT MEET ING… CROSS TOWN TO TRA IN STAT ION… DROP OFF L I ZZ I E AT SCHOOL BY 8:30…
We are the world’s leading provider of sil icon technology for wireless networking systems.
Wireless Access Portfolio
E S T A B L I S H I N G T H E C O N N E C T I O N
WITH A ROAD MAP FOR THE FUTURE
Intersil has an ongoing strategy forevolving our technology and each newgeneration is more integrated, feature-rich and power-efficient than ever.
• Introduced in 1996, our first product— PRISM I — is an eight-chip solution capable of data rates of two megabits-per-second (Mbps).
• The current chip set (operating in thelicense-free 2.4 GHz radio frequency)cuts the number of integrated circuits(ICs) from eight to four, uses 50%less power and operates five timesfaster. Capable of 11 Mbps transmis-sion speeds, PRISM 2.5 is as fast astoday’s wired Ethernet.
• To serve the coming wave of very high speed digital wireless productsand services, Intersil’s next genera-tion PRISM V chip sets (planned for2001) will operate in the 5 GHz radioband, with lightning fast speeds upto 54 Mbps.
OUR ARCHITECTURES DRIVE HIGH DATA RATE CONNECTIVITY
Intersil designs and develops enabling technology for wireless Local AreaNetworks (LANs). A wireless LAN systemuses radio links instead of cables,freeing users to access network servicesfrom many different locations with noplugs, no wires and no hassles.
Intersil’s award-winning PRISM® productfamily is the solution of choice for theworld’s leading networking, computingand telecommunications companies.Over 50 customers have selected ourpioneering wireless technology, using PRISM in more than 100 innovativeproduct designs including desktop andlaptop computers, handheld devicesand digital cameras, to name a few.
A COMPLETE “ANTENNA-TO-COMPUTER™” SOLUTION
Our newest PRISM 2.5 WLAN chip setincludes highly integrated semiconduc-tors, reference designs, evaluation kits,firmware and software. For designersand manufacturers of wireless networkingequipment and mobile devices, PRISMdelivers a complete solution that simplifies the design process and significantly reduces time-to-market.
AND GROWING GLOBAL BRANDS
To increase recognition for our companyand products, we launched a newbranding initiative this year.
• PRISM/work™. Intersil’s PRISM/workteam provides design solutions forenterprise networking and wireless OEM markets. To serve the rapidly growing number of mobile workers,Intersil customers in this sectorrequire standards compatibility, veryfast data rates, robust throughput,enhanced security and network management capability that onlyIntersil can provide.
• PRISM/home™. Products marketedunder the PRISM/home brand aredesigned to deliver low-cost, highperformance wireless networking solutions for the emerging smalloffice and home office (SOHO)networking market. The wirelessarchitecture making this possible is a PRISM-enabled residential gatewayconnected to a cable modem, set-topbox or DSL modem. Planned forrelease in 2001, Intersil’s PRISM IIIsolution reduces the numberof ICs from four to three, and bringshigh-speed Internet entertainment,information, and voice and video connectivity into the home.

FORWARD CL IENT REPORT… MAKE FINAL ADJUSTMENTS TO PRESENTATION ON TRAIN… LISTEN TO NEWS BRIEFS… TIME IN COMPUTER LAB WITH DINOSAUR ASSIGNMENT… BREAKFAST… CHECK TODAY’S HOROSCOPE…
INTERSIL • 4
Intersil is at the forefront of standards development for wireless networking technology.
A T T H E C E N T E R O F W I R E L E S S C O N N E C T I V I T Y
S E T T I N G T H E S T A N D A R D
Wireless Access Portfolio
WirelessHome Security
ResidentialGateway
Wireless HomeEntertainment
PDA and Telephone Connection
Desktop and Laptop
ConnectivityInternet
Appliances
To the Internet via DSL, Cable,
Dialup
In the home, the office or in public places, Intersil products are transforming the communicationslandscape by putting people at the center of wireless connectivity. Intersil pioneered high data ratewireless connectivity, making it possible for people to access data from their local area networks and connect to the Internet at speeds comparable to the wired Ethernet. As seen in the home networkhere, our wireless-to-broadband technologies connect people to the Internet where they can accessdata, watch video, listen to music, even make phone calls using Voice-Over-Internet Protocol.
appliances such as PCs, laptops andPDAs to communicate and inter-operateat work, at home and on the go.Operating at 11 Mbps, the 802.11bstandard is already communicating at speeds comparable to the wiredEthernet. The next generation 802.11astandard promises to truly unleash the power of the wireless Internet bysupporting peak data rates of up to54 Mbps. (Our company is also activelyshaping the emerging IEEE 802.16standard for broadband wireless access technology.)
Intersil plays a major advocacy role instandards development with member-ship in standards groups and industryalliances including IEEE 802.11 Committee,Wireless Ethernet Compatibility Alliance(WECA), Wireless LAN Alliance (WLANA),Bluetooth Special Interest Group (BSIG),HiperLAN2 Global Forum and OFDM Forum.
The development of industry standards is a critical catalyst for the worldwidedeployment of wireless networks and the continuing evolution of wirelessappliances that change the way we work,live and play. Having standards in placedecreases time to market for designers of wireless products and saves money for original equipment manufacturers.Consumers benefit from continuous productimprovements and by having dependablewireless devices enabling seamless anytime, anywhere communications.
Intersil has successfully marketed digital radios used in wired to wirelessEthernet, DSL to wireless, cable modemto wireless and wireless Voice overInternet Protocol (VoIP) — all based on a single, global standard — IEEE’s802.11b. Intersil co-authored this standard which allows information

Connecting to destinations around the globe.
O N T H E R OA D
5 • AR 2000

N I G H T T I M E
Moments of inspiration and insight.
INTERSIL • 6

7 • AR 2000
Intersil is a leading provider of broadband wireless modem ICs for digital microwave radios
In the future, we envision an end-to-endbroadband wireless network, startingwith high capacity wireless infrastructureand ending with low-cost fixed wirelessaccess points and user terminals,providing high-speed wireless Internetaccess to people at home, at work andon the go.
Intersil’s first BWA modem ICs and reference designs were developed toenable digital microwave radios totransmit voice and packet data at veryfast speeds (up to 155 Mbps). Our newbroadband radios will be widely deployedin next generation cellular base stationsand will enable interconnection between2.5G and 3G network infrastructures.This technology will also extend broadband services into buildings inmetropolitan areas that are not currentlyconnected to fiber optic networks.
Our BWA modem IC solution permitsequipment manufacturers to design a single modem that can be software
BROADBAND INTERNET ACCESS
Communications networks in most metropolitan areas are capacity limiteddue to “bottlenecks” caused by thelimitations of using traditional copperwiring in so many neighborhoods andoffice parks. Today, most people stillrely on telephone lines and dial-upmodems for their Internet access.
Intersil’s enabling technology is makingbroadband wireless access (BWA) to theInternet a reality. Together with otherindustry leaders and global standardsgroups such as The Institute of Electricaland Electronics Engineers and EuropeanTelecommunications Standards Institute,Intersil is a leader in the effort toshape the future of broadband wire-less connectivity. Intersil is also amember of the Orthoganal FrequencyDivision Multiplexing Forum, whichincludes wireless industry leaders such as Alcatel, Nokia, and Ericsson.
CONFERENCE CALL LUNCH MEETING WITH CLIENTS… CHECK E-MAIL FOR TEXT CHANGES TO MARKETING REPORT… WORK ON SPELLING GAME AT THE LIBRARY… HEAD BACK HOME AFTER LUNCH… LIST REFINEMENTS
H O W B R O A D B A N D W I R E L E S S W O R K S
Residential
AccessPoint
Switching Center
Internet
The customer contracts with a service provider. The service provider installs a small antenna on the roof of the customer’s house and provides a broadband wireless modem.
1 The customer’s Internet connection is “always on.” The modem receives and transmits data via the home antenna, which communicates with the nearest radio antenna in the service provider’s network.
2
The wireless access point is linked to the nearest switching center using a broadband digital radio.
3 The switching center completes the connection via high capacity lines with links to the worldwide web.
4
Wireless Access Portfolio
I N C R E A S I N G T H E S P E E D
configured to support standard datarates and frequency plans. Our modemsuse advanced modulation and codingtechnology, which enables spectrum to be used very efficiently and reliablyso that broadband wireless servicescan achieve fiber-like quality. And, our modem solution supports point-to-point, ring, or mesh architectures thatwill be the backbone of the end-to-endwireless network of the future.
Intersil is well-positioned to benefitfrom the rapidly growing broadbandwireless market. Leveraging our coretechnology, we are able to developindustry-leading, low-cost radios forbroadband wireless applications. Thismakes it possible for our company todefine the best network architectureswith industry leading customers, anddeliver wireless access solutions thatwill open up the last mile bottleneck…once and for all.

INTERSIL • 8
Intersil is a leading provider of software defined radio ICs for cellular base stations.
communications, enhanced data ratefor GSM evolution, general packet radioservice, code division multiple accessand W-CDMA all in a single design.
CommLink-equipped base stations canbe developed in a fraction of the timerequired versus “fixed configuration”base stations, which means carrierscan deploy new 2.5G and 3G cellularbase station infrastructure more rapidlyto make the promise of mobile wirelessInternet access a reality.
CommLink high speed data conversionICs use advanced analog and digitalsignal processing techniques to convertsignals between analog and digital formats. The quality of this data
Intersil’s integrated circuits (ICs) play a key role in processing the signals that flow through broadband networks.Our CommLink™ family of products performs high performance processingof analog and digital signals in compli-ance with global standards and networkprotocols for high growth wireless communications markets.
CommLink software defined radio(SDR) ICs combine the power of digitalsignal processing with the flexibility of software to lower the cost, powerconsumption, and size of cellular basetransceiver stations.
Our software defined upconverters anddownconverters enable designers toeliminate the cost and implementationcomplexities of analog transceiver circuits. And our devices support all of the worldwide cellular air interfacestandards such as advanced mobilephone service, global system for mobile
FOR WEBSITE LAUNCH… HELP AARON WITH ONLINE ENCYCLOPEDIA SEARCH… RESEARCH BLUE WHALES AND HABITATS… MEETING WITH MANAGERIAL STAFF ON IMPROVING PRODUCTIVITY WITH FOREIGN CLIENTS…
B R E A K I N G D O W N T H E B O U N D A R I E S
Wireless Access Portfolio
conversion process impacts networkperformance. Intersil data convertersare designed to meet the demandingperformance requirements of a new generation of broadband wireless communications equipment such as:
• Cellular Base Stations• Fixed Wireless Access Terminals• Digital Microwave Radios• Satellite Internet Access Terminals• Global Positioning Systems• Network Monitoring & Test Equipment
Our track record of delivering high performance ICs, combined with ourability to help our customers achieve a first-to-market advantage, meansthat CommLink solutions will enablethe global deployment of broadband wireless infrastructure.

DAY T I M E
Keeping up with demands and pressures.
9 • AR 2000

Wireless means freedom.
A N Y T I M E
INTERSIL • 10

11 • AR 2000
As part of Intersil’s vision of puttingpeople at the center of wireless con-nectivity, our company provides siliconsolutions for managing the power in themany devices that enable the wirelesscommunications revolution.
Our Intersil Endura™ product familyaddresses the increasing demands forpower efficiency in high performanceinformation appliances, computermicroprocessors and the ever-growingInternet infrastructure. Intersil is currently designed into over half of theglobal server hot-swap computer powermanagement applications. We are aworld-class leader of power manage-ment solutions for PCs, file servers and portable information appliances.
FOR DESKTOP COMPUTERS AND WORKSTATIONS
As power requirements in PCs andinformation appliances grow in complexity, systems designers arerequired to carefully consider voltagerequirements and power efficiency.Intersil continues to lead the industry
Intersil is a recognized global leader in power management integrated circuits.
CHECK PHONE MESSAGES AND SCHEDULE WITH ASS ISTANT… SHARE NEW SOURCES ON THE WEB WITH RESEARCH PARTNER… CHECK REPORT ON CHILDHOOD VACC INAT IONS… ORDER SHOES… E-MAIL BACK TARA
Communications Analog Portfolio
M A N A G I N G T H E P O W E R
by delivering highly efficient powermanagement products that meet thechallenges of today’s high speed,low voltage microprocessors. Intersil’sEndura DC-DC converters power nearlyone-third of the world’s Pentium® III andPentium® 4-class microprocessors andhalf of all AMD Athlon™ microprocessors.
Intersil is the first to introduce a complete, cost-effective power solutionfor next generation PCs that use a multiphase power configuration toachieve microprocessor speeds greaterthan 1GHz. Endura devices address the increasing demands for power, connectivity and availability of higherperforming information appliancessupporting current and next generationmicroprocessors, information appli-ances and the Internet infrastructure.
FOR FILE SERVERS
Intersil’s “Hot Plug” IC family allowsmaintenance and upgrade of file serversand Redundant Array of IndependentDisks (RAIDs) without interruption tosystem power, enabling enhanced relia-bility in server networks. It is estimatedthat Endura products are found in nearlytwo-thirds of the high performanceservers manufactured worldwide.
FOR NOTEBOOKS AND OTHER
PORTABLE DEVICES
As the trend continues toward smaller,high performance mobile appliances,Intersil has designed its Endura familyof mobile power management devices to meet computer designers’ demandsand to enable high speed informationaccess utilizing portable devices.Intersil's power management productsprovide highly integrated, high efficiencypower control for system and CPUvoltages that are required in notebookPC applications and Internet appliances.The new additions to the mobile productportfolio allows the next generation of mobile computers to operate at desktop speeds.

INTERSIL • 12
Intersil is one of the top 10 U.S. suppliers of analog communications technology.
WITH RESULTS FROM TEST MARKET… TALK WITH BROTHER IN ALBANY… FINISHING TOUCHES ON SARAH’S BOOK REPORT… E-MAIL PHOTOGRAPHS OF BABY TO GRANDPARENTS… FINAL CHECK OF CURRENT NEWS
Communications Analog Portfolio
VOIP GATEWAY ICS
Intersil is also a leading supplier of Subscriber Line Interface Circuits(SLICs) used to interface individualphone and modem subscribers with a central phone exchange. Our newestfamily of SLICs is tailored for theemerging Voice over Internet Protocol(VoIP) market and features the smallestVoIP ringing SLIC in the industry. Thissolution directly addresses the need for increased space efficiency in today’shome gateway and router products.
STANDARD COMMUNICATIONS ANALOG PRODUCTS
Intersil’s analog expertise has manyapplications in today’s wireless accessand communications equipment markets and strongly complements our broadband wireless competency.The portfolio for this product lineincludes mixed signal and digital signalprocessing (DSP) ICs that offer systemdesigners the value, choice and selection they’ve come to expect fromIntersil. Other components includestandard architecture microprocessorsand peripheral support devices for cellular communications, operationalamplifiers and buffers, UHF transistorarrays, interface circuits, video crosspoint switches, Line Card AccessSwitches (LCAS) and plain old telephoneservice (POTS) solutions.
P R O C E S S I N G T H E S I G N A L

A N Y W H E R E
Intersil puts you at the center.
13 • AR 2000

staff worldwide. We are also pursuingtechnology alliances and acquisitionsthat will accelerate profitable growthin the future while carefully consider-ing the short-term issues in globalsemiconductor markets.
A quick recap of 2000 is a reminder of how far Intersil has come since oursuccessful IPO in February — thelargest ever for a U.S. semiconductorcompany. We successfully completedour acquisition of No Wires Needed,giving Intersil an evolutionary path to 54 megabit-per-second (Mbps)wireless local area networking, soft-ware and access point semiconductordesign expertise. Intersil also acquiredSiCOM, Inc., providing us with excitinggrowth potential in the emerging broad-band wireless access (BWA) market.
This past year also marked the begin-ning of strategic alliances with SiliconWave and Sygate that will help extendour lead in wireless networking. Wejoined forces with Silicon Wave todevelop multi-mode communicationsproducts that incorporate Intersil’saward-winning PRISM technology and
Calendar 2000 was a year of excitingchange and growth for IntersilCorporation. With the discrete powersale concluded, Intersil is now completely focused on two excitingsemiconductor markets with out-standing growth potential — wirelessaccess and communications analog.Excluding discrete power, we completedthe year with 50% overall growth —65% growth in our communicationsanalog business and over 200%growth in our wireless access business. Comparing our marginsbefore and after the sale of discretepower, we improved overall gross margins from 37% with discrete products in calendar year 1999 tomore than 50% without discretes in the fourth quarter of 2000.
Today’s Intersil has no debt, a strongbalance sheet with more than $600
million in cash and a global workforcein which one out of three employees is an engineer. We plan to add to ourlead within our target markets withinternally developed solutions withmore than 700 engineers and technical
Bluetooth technology in a single,compatible radio design. The Sygatepartnership will allow us to offerInternet Protocol (IP) software thatwill give wireless LAN users the abilityto roam from “cell to cell” whilemaintaining high-speed connectivityto their network and the Internet.
We feel confident that we are takingthe actions necessary to improve ourefficiency and productivity in the faceof deteriorating market conditionsand an adjustment in customerinventory levels that began in thefourth quarter of 2000. Intersil has a strong balance sheet and is wellpositioned in high-growth communi-cations markets to take advantage of opportunities when global economicconditions improve.
Our wireless access product familyincludes broadband wireless semi-conductors used in the next gen-eration of cellular base stations, and solutions that enable wirelesspoint-to-point communications at thespeed of fiber — up to 155 megabitsper second. We have over 100
INTERSIL • 14
AND EVENTS… DOWNLOAD MUSIC TO NEW MP3 PLAYER AFTER DINNER… SOURCE OUT NEW REFERENCES FOR DATA GATHERING… CHARGE UP CELL PHONE FOR ROAD TRIP… GATHER INFORMATION FOR PROJECT…
LET T E R TO S H A R E H O LD E R S

customer design wins for our PRISM®
wireless LAN products — many ofwhich are about to enter into production— and we’re moving to smaller formfactors and imbedded platforms toenable 11Mbps wireless connectivityfor people at the office, at home or on the go. During 2001, Intersil willunveil its PRISM V family of productsthat offers wireless transmissionspeeds up to 54 megabits per second.
Intersil’s communications analogbusiness, a leading analog entity onits own, provides significant revenuegrowth and cash flow to help fund our development efforts for emergingcommunications markets. Our analogproducts are at the core of servers,high-speed computers and wiredtelecommunications. Today, we “turnon” about half of the world’s AMD
Athlon™ and one-third of Intel’sPentium®-class microprocessors.
At the very heart of all of our effortsare strong relationships with industryleading customers. Intersil’s customerlist reads like a “who’s who” in communications, and includes
Alcatel, Cisco, 3Com, Compaq, Dell,Nokia, Nortel, Samsung, Siemens,Sony and Symbol Technologies; yet no single customer represents morethan 5% of our corporate revenues.Intersil enjoys an enviable trackrecord with our global customers, and we will continue to work closelywith them to develop semiconductors,reference designs and software thatbring added value to their productsand reduce their time to market.
Intersil is a unique semiconductorcompany with substantial revenues,leading global customers, a strongbalance sheet and exciting growthpotential. While proud of our hardwork and progress in developing anew business model during the pasttwo years, our eyes are focused onfuture growth and keeping people at the “Center of Connectivity.”
Greg Williams, President and CEO
15 • AR 2000
E-MAIL SALLY THE RESULTS OF MEET ING… LOOK UP PHOTOGRAPHY FOR PRES IDENT L INCOLN B IOGRAPHY… CHECK ON WEATHER UPDATE ON THE FLOOD ING IN AS IA… ORDER TAKE-OUT ONL INE THROUGH LOCAL

FOCUSED ON WIRELESS ACCESS ANDCOMMUNICATIONS ANALOG MARKETS
Our Wireless Access product line includesour PRISM® Wireless, Broadband WirelessAccess and CommLink™ digital radiointegrated circuits. The CommunicationsAnalog product line consists of ourPower Management Integrated Circuits,Subscriber Line Interface Circuits andStandard Communications Analog product groups.
C U S T O M E R S A N D A P P L I C A T I O N S
INTERSIL • 16
G R OW I N G G LO B A L M A R K ETS
Intersil is capitalizing on our core competencies.
DEL IVERY SERV ICE… LOOK UP NEW DRY CLEANER IN NEW NEIGHBORHOOD… CHECK OUT LOCAL CLUBS FOR EVENING JAZZ EVENTS… BUY CDS ONL INE… REV IEW LATEST F I LM RELEASES FOR DATE SATURDAY…
END MARKETS APPLICATIONS KEY CUSTOMERS
Wireless Access Wireless Data Connectivity, Enterprise, Public and Home Cisco, Compaq, Nokia,Business, Public and Home Wireless LANs, Cellular Nortel, Samsung, Symbol,Area Networks Basestations Sony, 3COM
Communications Analog Communications, File Servers, Personal Alcatel, Asustek, Cisco, Dell,Telecommunications, Computers, PDAs, Residential Hewlett Packard, IBM,Networking, Computing Gateways, Central Switches Motorola, Siemens

17 • AR 2000
F I N A N C I A L H I G H LI G H TS
G R O S S M A R G I N S (By year)
45%37%
CY00CY99
G R O S S M A R G I N S (Trailing four quarters, calendar year 2000)
48%46%
Q4Q3
43%
Q2
41%
Q1
W I R E L E S S A C C E S S S A L E S (Trailing four quarters, calendar year 2000)
+17%+72%+35%+48%
T O T A L R E V E N U E (By product line)
CY99 CY00
$22$30
$60$51
QUARTERLY CHANGE
R E V E N U E S (Trailing four quarters, calendar year 2000)
$0.26$0.24$0.17$0.07
$30025020015010050
(millions) 0
$171 $191 $217$219
ADJUSTED EPS
$70605040302010
(millions) 0
Intersil Holding Corporation
Wireless Access 21%Other Analog 27%
Communications Analog 26%Discrete Power 26%
Discrete Power 32%
Communications Analog 22%
Wireless Access 9%
Other Analog 37%
Q2Q1 Q3 Q4Q4Q3Q2Q1

INTERSIL • 18
M A N AG E M E N T’S D I S C U S S I O N A N D A N A LYS I S
Intersil Holding Corporation
The following discussion should be read in conjunction with, and isqualified in its entirety by reference to our consolidated financial state-ments, including the notes thereto. Except for historical information, the discussions in this section contain forward-looking statements that involverisks and uncertainties. Actual results could differ materially from those discussed below.
This Annual Report contains statements relating to expected future resultsand business trends of the Company that are based upon our current estimates, expectations, and projections about our industry, and uponmanagement’s beliefs, and certain assumptions we have made, that are“forward-looking statements” as defined in the Private Securities LitigationReform Act of 1995. Words such as “anticipates,” “expects,” “intends,”“plans,” “believes,” “seeks,” “estimates,” “may,” “will,” and variationsof these words or similar expressions are intended to identify “forward looking statements.” In addition, any statements that refer to expectations, projections, or other characterizations of future events or circumstances,including any underlying assumptions, are “forward looking statements.”Such statements are not guarantees of future performance and are subjectto certain risks, uncertainties, and assumptions that are difficult to predict.Therefore, our actual results may differ materially and adversely from thoseexpressed in any “forward looking statement” as a result of various factors.These factors include, but are not limited to: global economic and marketconditions, including the cyclical nature of the semiconductor industry and the markets addressed by the Company’s and its customers’ products;demand for, and market acceptance of, new and existing products; successfuldevelopment of new products; the timing of new product introductions; thesuccessful integration of acquisitions; the availability and extent of utilization of manufacturing capacity and raw materials; the need for additional capital; pricing pressures and other competitive factors; changesin product mix; fluctuations in manufacturing yields; product obsolescence;the ability to develop and implement new technologies and to obtain protection of the related intellectual property. These forward-looking statements are made only as of the date hereof, and the Company undertakes no obligation to update or revise the forward-looking statements,whether as a result of new information, future events or otherwise.
OVERVIEW
We are a systems oriented designer and manufacturer of analog and digitalintegrated circuits for the wireless access and communications analogmarkets. We provide system level solutions for the growing communicationssemiconductor market. Communications semiconductors enable the convergence of voice, data and video. Within communications, we arefocused on several key markets including high data rate wireless connectivity,power management and wireless and wired software design to deliver chip
sets, component software and licensable applicable designs for communica-tions equipment customers. We sell over 4,500 products to more than 28,000
customers worldwide.
BASIS OF PRESENTATION
We were formed on August 13, 1999 through a series of transactions, in which we and our wholly owned subsidiary, Intersil, acquired the semicon-ductor business of Harris. Intersil and its wholly owned domestic and foreignsubsidiaries include the operations of the Predecessor.
The total purchase price of the semiconductor business acquisition was$614.3 million, which included transaction costs of approximately $7.8
million and deferred financing costs of $12.2 million. The consideration paidby Intersil Holding was $504.3 million in cash of which $420.0 million wasfinanced through borrowings and the issuance of a $90 million PIK Note toHarris. The acquisition was accounted for using the purchase method ofaccounting and accordingly, the operating results of the semiconductor busi-ness have been included in Intersil’s consolidated financial statements sincethe date of acquisition. The total purchase price was allocated to the assetsand liabilities of the semiconductor business based upon their approximatefair values. The fair values of the net assets acquired exceeded the purchaseprice resulting in negative goodwill of $200.0 million. This negative goodwillwas allocated to the identified intangibles and property and equipment basedon their relative fair values. The most significant effects were to decreaseproperty, plant and equipment and to increase certain intangibles and liabilities.
Certain financial information for the periods prior to August 13, 1999 is not comparable to periods subsequent to August 13, 1999. All statement ofoperations information for the 26 weeks and the 52 weeks ended December 31,1999 represents the combined results of the semiconductor business from July 3, 1999 and January 2, 1999, respectively, through August 13, 1999 andIntersil Holding from August 14, 1999 through December 31, 1999.
Pursuant to a Form 8-K filed on March 29, 2000, we elected to change our fiscal year end from the Friday closest to June 30 to the Friday closest toDecember 31. Our stub calendar year 2000 began on July 1, 2000 and endedDecember 29, 2000. We have also included a supplemental comparison of the52 weeks ended December 29, 2000 with the same time period in calendar year1999 as if we had been on a calendar year reporting basis for the entire year.
In February 2000, we issued 22,000,000 shares of our Class A CommonStock in a registered underwritten initial public offering at a price of$25.00 per share. In September 2000, we issued 3,500,000 shares of ourClass A Common Stock in a registered underwritten public offering at aprice of $48.00 per share. See “Liquidity and Capital Resources.”

M A N AG E M E N T’S D I S C U S S I O N A N D A N A LYS I SContinued
Intersil Holding Corporation
19 • AR 2000
Consistent with our focus on the wireless LAN and broadband accessmarkets, we have renamed the “Wireless” product group to “WirelessAccess” and we have separated the previously reported product group“Analog/Mixed Signal” into two product groups: “Communications Analog”and “Other Analog.” Wireless Access includes our PRISM® Wireless,Broadband Wireless Access and CommLink™ digital radio integratedcircuits. Communications Analog includes Power Management IntegratedCircuits, Subscriber Line Interface Circuits and Standard CommunicationsAnalog product groups.
Additionally, in January 2001, we announced the sale of our Discrete Powerproducts group to Fairchild Semiconductor. See “Recent Developments.”
QUARTERLY RESULTS
The following table sets forth the unaudited historical quarterly revenue of our four product groups and the quarterly total Company gross margin percentage:
Combined Calendar Year 1999
(In millions, except for percentages) Q1 Q2 Q3 Q4
RevenueWireless Access $ 9.1 $ 13.7 $ 11.9 $ 14.9Communications Analog 27.8 32.0 33.0 33.1Other Analog 56.1 59.0 44.1 55.4Discrete Power 42.4 46.0 44.9 54.8
TOTAL $135.4 $150.7 $ 133.9 $ 158.2
TOTAL GROSS MARGIN % 35% 36% 36% 39%
Calendar Year 2000
(In millions, except for percentages) Q1 Q2 Q3 Q4
RevenueWireless Access $ 22.1 $ 29.8 $ 51.4 $ 59.8 Communications Analog 44.3 54.3 56.6 51.8 Other Analog 51.3 54.1 58.1 53.1Discrete Power 53.2 53.0 52.5 52.1
Total $170.9 $191.2 $ 218.6 $ 216.8
TOTAL GROSS MARGIN % 41% 43% 46% 48%
The following table sets forth the pro forma unaudited quarterly gross margin percentages for our Wireless Access, Communications Analog andOther Analog product groups as if we had never owned the Discrete Powerproducts group. These gross margin percentages are based on assump-tions that management believes are reasonable under the circumstances.
However, these gross margin percentages are not necessarily indicative of the margins that would have resulted if we actually had never owned theDiscrete Power products group.
CombinedCalendar Year 1999
Q1 Q2 Q3 Q4
Gross Margin PercentageWireless Access 49% 58% 49% 46%Communications Analog 35 35 35 36Other Analog 45 45 44 43
Calendar Year 2000
Q1 Q2 Q3 Q4
Gross Margin PercentageWireless Access 50% 54% 55% 54%Communications Analog 38 40 47 51Other Analog 43 46 50 52
Our increasing focus on communications related products has resulted in a higher percentage of our sales coming from the communicationsanalog and wireless access markets in calendar year 2000. Revenues fromCommunications Analog and Wireless Access products accounted for 46.4%of our total calendar year 2000 sales versus 30.4% of our total calendaryear 1999 sales.
The semiconductor industry has historically experienced declining sellingprices over the past 15 years, and we expect that trend to continue in thefuture. We expect to realize productivity gains that will offset the decline in average selling prices and therefore we do not anticipate a significantadverse effect on our financial condition.
We experienced growth of over 25% in each of the quarters of calendar year 2000 as compared to the same periods in calendar year 1999 due toincreased demand for our communications products. The introduction ofour new Prism II wireless product introduced in late calendar year 1999
has accelerated growth in the Wireless Access product group.

M A N AG E M E N T’S D I S C U S S I O N A N D A N A LYS I SContinued
Intersil Holding Corporation
INTERSIL • 20
CALENDAR YEAR 2000 COMPARED WITH CALENDAR YEAR 1999
The following table sets forth supplemental statement of operations data indollars and as a percentage of revenue for Intersil Holding and its predecessorfor the periods indicated:
Supplemental
52 Weeks Ended 52 Weeks Ended
Successor Combined Successor Combined(Dollars in thousands) December 29, 2000 December 31, 1999 December 29, 2000 December 31, 1999
Revenue: Wireless Access $163,065 $ 49,555 20.4% 8.6%Communications Analog 206,994 125,853 26.0 21.8Other Analog 216,710 214,624 27.2 37.1Discrete Power 210,787 188,142 26.4 32.5
TOTAL 797,556 578,174 100.0 100.0
Costs and expenses:Cost of product sales 439,683 366,332 55.1 63.4Research and development 96,523 71,804 12.1 12.4Selling, general
and administrative 128,549 91,825 16.1 15.9Intangible amortization 23,248 5,536 2.9 1.0In-process research
and development 25,440 20,239 3.2 3.5Other 1,177 6,153 0.1 1.1
Operating income 82,936 16,285 10.4 2.8Loss on sale of
Malaysian operation 24,825 — 3.1 0.0Interest, net 11,283 23,381 1.4 4.0
Income (loss) before income taxes, extraordinary item and cumulative effect of a change in accounting principle 46,828 (7,096) 5.9 -1.2
Income taxes (benefit) 29,071 (3,350) 3.6 -0.6
Income (loss) before extraordinary item and cumulative effect of a change in accounting principle 17,757 (3,746) 2.2 -0.6
Extraordinary item — loss onextinguishment of debt,net of tax effect (31,409) — -3.9 0.0
Loss before cumulative effect of a change in accounting principle (13,652) (3,746) -1.7 -0.6
Cumulative effect of adoption of SFAS 133, net of tax effect (197) — 0.0 0.0
NET LOSS $ (13,850) $ (3,746) -1.7% -0.6%
Note: Amounts may not add due to rounding.
Revenue
Revenue for the 52 weeks ended December 29, 2000 increased 37.9% to$797.6 million from $578.2 million during the combined 52 weeks endedDecember 31, 1999. The growth is the result of increased demand for communications products and overall improved market conditions. WirelessAccess sales growth of 229% for the 52 weeks ended December 29, 2000
versus the same time period in calendar year 1999 was driven by increasedmarket acceptance of our PRISM® products.
Geographically, 47.5%, 20.4% and 32.1% of product sales were derived in North America, Europe and Asia, respectively, during the 52 weeks endedDecember 29, 2000 compared to 51.0%, 23.6% and 25.4% during the combined 52 weeks ended December 31, 1999. This change in mix is theresult of increased demand from Asian-based customers and from other customers moving manufacturing facilities to Asia.
Gross Margin
Cost of product sales consists primarily of purchased materials, labor andoverhead (including depreciation) associated with product manufacturing,plus licensing, warranty and sustaining engineering expenses pertaining toproducts sold. In the 52 weeks ended December 29, 2000, gross margin onproduct sales increased 69.0% to $357.9 million from $211.8 million in thecombined 52 weeks ended December 31, 1999. As a percent of sales, grossmargin was 44.9% during the 52 weeks ended December 29, 2000 comparedto 36.6% during the combined 52 weeks ended December 31, 1999. Thisincrease was due primarily to a shift in sales from our historical mix ofproducts to a higher percentage of our communications products. Our communications products, which include our Wireless Access products, generally carry higher margins. Increased capacity utilization in all threefabrication facilities, improved product costs from yield enhancements, and manufacturing cost improvement projects contributed to the marginimprovement. We anticipate that future gross profit percentages will continueto be affected by factors such as product mix, the timing of new productintroductions, market conditions and manufacturing volume.
Research and Development (“R&D”)
R&D expenses consist primarily of salaries and costs of employees engagedin product/process research, design and development activities, as well asrelated subcontracting activities, prototype development, cost of designtools and technology license agreement expenses. R&D expenses increased34.4% to $96.5 million during the 52 weeks ended December 29, 2000 from$71.8 million during the combined 52 weeks ended December 31, 1999. Theincrease was the result of our continued investment in PRISM® chip sets and in Power Management integrated circuits, focusing in the categories of

21 • AR 2000
M A N AG E M E N T’S D I S C U S S I O N A N D A N A LYS I SContinued
Intersil Holding Corporation
communications and computing products. As a percent of sales, R&D
expenses declined to 12.1% for the 52 weeks ended December 29, 2000 from12.4% for the combined 52 weeks ended December 31, 1999. We expect R&D
expenses to moderately increase during 2001 as a result of continued develop-ment efforts in our wireless LAN and broadband wireless product initiatives.
In-Process Research and Development
In connection with the acquisition of SiCOM Inc. in October 2000, we allocated$25.4 million of the purchase price to in-process R&D projects. This allocationrepresents the estimated fair value based on risk-adjusted cash flows relatedto the incomplete projects. At the date of the acquisition, the development ofthese projects had not yet reached technological feasibility and the in-processR&D had no alternative future uses. Accordingly, these costs were expensed asa one-time charge to earnings in the 52 weeks ended December 29, 2000.
In making the purchase price allocation, we relied on present value calcula-tions of income, an analysis of project accomplishments and completioncosts and an assessment of overall contribution and project risk. The presentvalue was determined by discounting 2 to 7 years of after tax cash flowprojections depending on the individual project. We used a discount rateranging from 25% – 36%, depending on the risk of the project. The fair valuesassigned to each of the significant projects and the stage of completion arereported below:
Fair Value Stage ofProduct (in millions) Completion
SM/SD 7060 $25.1 86%Other 0.3 56% – 70%
Total $25.4
A discussion of the most significant project follows:
SM/SD 7060 refers to a project researched and in development in the broad-band wireless applications area. This two chip set (modulator and demodulator)design will provide complete modem functionality. The chips will be highlyprogrammable, which allows use in a wide range of broadband wirelessPoint-to-Point (PTP) products ranging from very low capacity (less than45 Mbps) up to 1 Gbps (Gigabytes per second). This chipset is expected to be the first programmable broadband wireless modem chipset on the markettargeted at PTP applications.
Remaining development efforts for these in-process R&D projects includevarious phases of design, development and testing. The anticipated completiondates for the in-process R&D projects will occur within the next 12 months,after which we expect to begin generating economic benefits from thetechnologies. Expenditures to complete these projects are expected to totalapproximately $3.3 million in calendar year 2001.
These estimates are subject to change, given the uncertainties of the devel-opment process, and no assurance can be given that deviations from theseestimates will not occur. We expect to continue these development efforts
and believe we have a reasonable chance of successfully completing theR&D programs. However, there is risk associated with the completion of theprojects and there is no assurance that any will meet either technological orcommercial success.
In connection with the acquisition of the semiconductor business of Harris in calendar year 1999, we allocated $20.2 million of the purchase price to in-process R&D projects. These projects were in various stages of completionranging from 35% – 90%. The present value of $29.0 million of in-processR&D was primarily determined by discounting 10 year after tax cash flow projections of the individual projects using a discount rate of 20%. The valuewas then reduced by negative goodwill resulting from the acquisition.
At the date of acquisition, the development of these projects had not yetreached technological feasibility and the in-process R&D had no alternativefuture uses. Accordingly, these costs were expensed as a one-time charge to earnings in the combined 52 weeks ended December 31, 1999.
At December 29, 2000, all of these in-process R&D projects had either completed all phases of design, development and testing or had been dis-continued. No future development expenses are anticipated for these projects.
Selling, General and Administrative (“SG&A”)
SG&A costs, which include marketing, selling, general and administrativeexpenses increased to $128.5 million during the 52 weeks ended December 29,2000 from $91.8 million during the combined 52 weeks ended December 31,1999. The increase was due to additional selling costs resulting from highersales in calendar year 2000 and additional marketing costs associated withour new company branding initiative. Operating expenses include chargesallocated by Harris to us for legal, financial and other administrativeexpenses of $6.2 million for the combined 52 weeks ended December 31,1999. As a percentage of sales, SG&A costs increased to 16.1% for the 52
weeks ended December 29, 2000 from 15.9% for the combined 52 weeksended December 31, 1999. We expect SG&A expenses to decline in 2001
assuming the completion of the sale of our Discrete Power products group. See “Recent Developments.”
Intangible Assets
Amortization of intangible assets increased to $23.2 million for the 52 weeksended December 29, 2000 from $5.5 million for the same time period incalendar year 1999. The increase was the result of goodwill and other certainintangible assets that were recorded in connection with the acquisitions of No Wires Needed, B.V. in May 2000 and SiCOM, Inc. in October 2000.Additionally, 52 weeks of amortization was recognized in calendar year 2000
on the opening balance sheet intangible assets versus 20 weeks in calendaryear 1999. These assets are being amortized over their useful lives rangingfrom five to 11 years.

Loss on Sale of Malaysian Operation
On June 30, 2000, we completed the sale of our Kuala Lumpur, Malaysia-basedsemiconductor assembly and test operations to ChipPAC, Inc. (“ChipPAC”).As consideration for the sale we received approximately $52.5 million in cashand $15.8 million in ChipPAC preferred convertible stock and we recognizeda non-recurring, non-cash charge of $24.8 million for loss on sale.
Interest Expense
Interest expense for the 52 weeks ended December 29, 2000 is not comparableto interest expense for the combined 52 weeks ended December 31, 1999 dueto changes in our debt and cash positions during those time periods.
Extraordinary Item
During the 52 weeks ended December 29, 2000, we repurchased $51.0
million of our outstanding 13.25% senior subordinated notes in the openmarket. We also repaid approximately $419.0 million of debt incurred throughthe acquisition of the semiconductor business. These repayments includedcertain pre-payment penalties and accrued interest. In connection with theearly extinguishment of debt, we recorded extraordinary charges (net of taxeffect) of $31.4 million. The extraordinary charges consisted of the write-offof deferred financing fees and pre-payment penalties.
Tax Expense
The pro forma tax provision for the 52 weeks ended December 29, 2000 is notcomparable to the pro forma tax benefit for the combined 52 weeks endedDecember 31, 1999 due to differences in our tax structure as compared tothat of our combined tax reporting structure with that of the semiconductorbusiness of Harris.
Backlog
We had backlog at December 29, 2000 of $256.9 million compared to $192.4
million at December 31, 1999. The increase was due to increased demand forour communications products and improved market conditions.
26 WEEKS ENDED DECEMBER 29, 2000 COMPARED WITH COMBINED26 WEEKS ENDED DECEMBER 31, 1999
The following table sets forth statement of operations data in dollars and as a percentage of revenue for Intersil Holding and its predecessor for theperiods indicated:
26 Weeks Ended 26 Weeks Ended
Successor Combined Successor Combined(Dollars in thousands) December 29, 2000 December 31, 1999 December 29, 2000 December 31, 1999
Revenue: Wireless Access $111,180 $ 26,803 25.5% 9.2%Communications Analog 108,411 66,073 24.9 22.6Other Analog 111,304 99,507 25.6 34.1Discrete Power 104,557 99,698 24.0 34.1
TOTAL 435,452 292,081 100.0 100.0Costs and expenses:
Cost of product sales 229,664 182,175 52.7 62.4Research and development 53,019 34,441 12.2 11.8Selling, general
and administrative 69,576 49,160 16.0 16.8Intangible amortization 16,504 4,268 3.8 1.5In-process research
and development 25,440 20,239 5.8 6.9Other — 1,164 0.0 0.4
Operating income 41,249 634 9.5 0.2Interest, net (2,607) 24,242 -0.6 8.3
Income (loss) before income taxes, extraordinary item and cumulative effect of a change in accounting principle 43,856 (23,608) 10.1 -8.1
Income taxes 30,759 1,297 7.1 0.4
Income (loss) before extraordinary item and cumulative effect of a change in accounting principle 13,097 (24,905) 3.0 -8.5
Extraordinary item — loss on extinguishment of debt, net of tax effect (5,891) — -1.4 0.0
Income (loss) before cumulative effect of a change inaccounting principle 7,206 (24,905) 1.7 -8.5
Cumulative effect of adoption of SFAS 133, net of tax effect (197) — 0.0 0.0
NET INCOME (LOSS) $ 7,009 $ (24,905) 1.6% -8.5%
Note: Amounts may not add due to rounding.
INTERSIL • 22
M A N AG E M E N T’S D I S C U S S I O N A N D A N A LYS I SContinued
Intersil Holding Corporation

23 • AR 2000
M A N AG E M E N T’S D I S C U S S I O N A N D A N A LYS I SContinued
Intersil Holding Corporation
Revenue
Revenue for the 26 weeks ended December 29, 2000 increased 49.1% to$435.5 million from $292.1 million during the combined 26 weeks endedDecember 31, 1999. The growth is the result of increased demand for communications products and overall improved market conditions. WirelessAccess sales growth of 315% for the 26 weeks ended December 29, 2000
versus the same time period in calendar year 1999 was driven by increasedmarket acceptance of our PRISM® products.
Geographically, 46.0%, 19.4% and 34.6% of product sales were derived inNorth America, Europe and Asia, respectively, during the 26 weeks endedDecember 29, 2000 compared to 48.9%, 22.9% and 28.2% during the com-bined 26 weeks ended December 31, 1999. This change in mix is the result of increased demand from Asian-based customers and from other customersmoving manufacturing facilities to Asia.
Gross Margin
Gross margin on product sales increased 87.2% to $205.8 million in the 26 weeks ended December 29, 2000 from $109.9 million in the combined 26 weeks ended December 31, 1999. As a percent of sales, gross margin was47.3% during the 26 weeks ended December 29, 2000 compared to 37.6%during the combined 26 weeks ended December 31, 1999. This increase wasdue primarily to a sales shift from our historical mix of products to a higherpercentage of our communications products. Our communications products,which include our Wireless Access products, generally carry higher margins.Increased capacity utilization in all three fabrication facilities, improvedproduct costs from yield enhancements and manufacturing cost improvementprojects contributed to the margin improvement.
R&D
R&D expenses increased 54.0% to $53.0 million during the 26 weeks endedDecember 29, 2000 from $34.4 million during the combined 26 weeks endedDecember 31, 1999. The increase was the result of our continued investmentin PRISM® chip sets and in Power Management integrated circuits, focusing inthe categories of communications and computing products. As a percent ofsales, R&D expenses increased to 12.2% for the 26 weeks ended December 29,2000 from 11.8% for the combined 26 weeks ended December 31, 1999.
In-Process Research and Development
In connection with the acquisition of SiCOM Inc. in October 2000, we allocated$25.4 million of the purchase price to in-process R&D projects. This allocationrepresents the estimated fair value based on risk-adjusted cash flows relatedto the incomplete projects. At the date of the acquisition, the development ofthese projects had not yet reached technological feasibility and the in-processR&D had no alternative future uses. Accordingly, these costs were expensed asa one-time charge to earnings in the 26 weeks ended December 29, 2000.
In making the purchase price allocation, we relied on present value calculationsof income, an analysis of project accomplishments and completion costs andan assessment of overall contribution and project risk. The present value wasdetermined by discounting 2 to 7 years of after tax cash flow projectionsdepending on the individual project. We used a discount rate ranging from25% – 36%, depending on the risk of the project. The fair values assignedto each of the significant projects and the stage of completion are reported below:
Fair Value Stage ofProduct (in millions) Completion
SM/SD 7060 $ 25.1 86%Other 0.3 56% - 70%
Total $ 25.4
A discussion of the most significant project follows:
SM/SD 7060 refers to a project researched and in development in the broad-band wireless applications area. This two chip set (modulator and demodulator)design will provide complete modem functionality. The chips will be highlyprogrammable, which allows use in a wide range of broadband wirelessPoint-to-Point (PTP) products ranging from very low capacity (less than45 Mbps) up to 1 Gbps (Gigabytes per second). This chipset is expected tobe the first programmable broadband wireless modem chipset on the markettargeted at PTP applications.
Remaining development efforts for these in-process R&D projects include various phases of design, development and testing. The anticipated completiondates for the in-process R&D projects will occur within the next 12 months,after which we expect to begin generating economic benefits from the tech-nologies. Expenditures to complete these projects are expected to totalapproximately $3.3 million in calendar year 2001.
These estimates are subject to change, given the uncertainties of the devel-opment process, and no assurance can be given that deviations from theseestimates will not occur. We expect to continue these development effortsand believe we have a reasonable chance of successfully completing theR&D programs. However, there is risk associated with the completion of theprojects and there is no assurance that any will meet either technological or commercial success.
In connection with the acquisition of the semiconductor business of Harris in calendar year 1999, we allocated $20.2 million of the purchase price to in-process R&D projects. These projects were in various stages of completionranging from 35% – 90%. The present value of $29.0 million of in-processR&D was primarily determined by discounting 10 year after tax cash flow pro-jections of the individual projects using a discount rate of 20%. The valuewas then reduced by negative goodwill resulting from the acquisition.
At the date of acquisition, the development of these projects had not yetreached technological feasibility and the in-process R&D had no alternativefuture uses. Accordingly, these costs were expensed as a one-time charge

INTERSIL • 24
M A N AG E M E N T’S D I S C U S S I O N A N D A N A LYS I SContinued
Intersil Holding Corporation
to earnings in the combined 26 weeks ended December 31, 1999. At December29, 2000, all of these in-process R&D projects had either completed all phases ofdesign, development and testing or had been discontinued. No future devel-opment expenses are anticipated for these projects.
SG&A
SG&A costs increased to $69.6 million during the 26 weeks ended December 29,2000 from $49.2 million during the combined 26 weeks ended December 31, 1999.The increase was due to additional selling costs resulting from higher sales in calendar year 2000 and additional marketing costs associated with ournew company branding initiative. Operating expenses include charges allo-cated by Harris to us for legal, financial and other administrative expensesof $1.2 million for the combined 26 weeks ended December 31, 1999. As a percentage of sales, SG&A costs decreased to 16.0% for the 26 weeksended December 29, 2000 from 16.8% for the combined 26 weeks endedDecember 31, 1999.
Intangible Assets
Amortization of intangible assets increased to $16.5 million for the 26 weeksended December 29, 2000 from $4.3 million for the same time period in calendar year 1999. The increase was the result of goodwill and other certainintangible assets that were recorded in connection with the acquisitions of No Wires Needed, B.V. in May 2000 and SiCOM, Inc. in October 2000.Additionally, 26 weeks of amortization was recognized in calendar year 2000
on the opening balance sheet intangible assets versus 7 weeks in calendaryear 1999. These assets are being amortized over their useful lives rangingfrom five to 11 years.
Interest Expense
Interest expense for the 26 weeks ended December 29, 2000 is not comparableto interest expense for the combined 26 weeks ended December 31, 1999 dueto changes in our debt and cash positions during those time periods.
Extraordinary Item
During the 26 weeks ended December 29, 2000, we repurchased $51.0 millionof our outstanding 13.25% senior subordinated notes in the open market. Inconnection with the early extinguishment of debt, we recorded extraordinarycharges (net of tax effect) of $5.9 million. The extraordinary charges consistedof the write-off of deferred financing fees and pre-payment penalties.
Tax Expense
The tax provision for the 26 weeks ended December 29, 2000 is not comparableto the pro forma tax benefit for the combined 26 weeks ended December 31,1999 due to the differences in our tax structure as compared to that of ourcombined tax reporting structure with that of the semiconductor business of Harris.
Backlog
We had backlog at December 29, 2000 of $256.9 million compared to $192.4
million at December 31, 1999. The increase was due to increased demand forour communications products and improved market conditions.
FISCAL YEAR 2000 COMPARED WITH FISCAL YEAR 1999
The following table sets forth statement of operations data in dollars and as percentage of revenue for Intersil Holding and its predecessor for the periods indicated:
Fiscal Year Ended Fiscal Year Ended
Combined Predecessor Combined Predecessor(Dollars in thousands) June 30, 2000 July 2, 1999 June 30, 2000 July 2, 1999
Revenue: Wireless Access $ 78,745 $ 28,906 12.0% 5.4%Communications Analog 164,689 120,619 25.2 22.6Other Analog 204,886 221,516 31.3 41.6Discrete Power 205,865 161,677 31.5 30.4
Total 654,185 532,718 100.0 100.0Costs and expenses:
Cost of product sales 392,194 349,776 60.0 65.7Research and development 77,955 67,079 11.9 12.6Selling, general
and administrative 108,135 83,998 16.5 15.8Harris corporate expense
allocation 1,164 9,303 0.2 1.7Intangible amortization 11,012 2,414 1.7 0.5In-process research
and development 20,239 — 3.1 0.0Other 1,178 — 0.2 0.0
Operating income 42,308 20,148 6.5 3.8Loss on sale of
Malaysian operation 24,825 — 3.8 0.0 Interest, net 38,093 (1,231) 5.8 -0.2
Income (loss) before income taxes and extraordinary item (20,610) 21,379 -3.2 4.0
Income taxes (benefit) (391) (6,027) -0.1 -1.1
Income (loss) beforeextraordinary item (20,219) 27,406 -3.1 5.1
Extraordinary item — loss on extinguishment of debt,net of tax effect (25,518) — -3.9 0.0
NET INCOME (LOSS) $ (45,737) $ 27,406 -7.0 5.1
Note: Amounts may not add due to rounding.
Revenue
Revenue for the fiscal year 2000 increased 22.8% to $654.2 million from $532.7 million in the fiscal year 1999. This growth is the result ofincreased demand for communications products and overall improved market conditions. Wireless sales growth of 181% was driven by increasedmarket acceptance of our PRISM® products. Geographically, 49.2%, 22.0%and 28.8% of product sales were derived in North America, Europe andAsia/ Pacific, respectively, during fiscal year 2000, compared to 53.5%, 24.6%and 21.9%, respectively, in fiscal year 1999. This change in mix is the resultof increased demand from Asian-based customers and from other customersmoving manufacturing facilities to Asia.

25 • AR 2000
M A N AG E M E N T’S D I S C U S S I O N A N D A N A LYS I SContinued
Intersil Holding Corporation
Gross Margin
Gross margin on product sales increased 43.2% to $262.0 million in fiscalyear 2000 from $182.9 million in fiscal year 1999. As a percentage of sales,gross margin was 40.0% in fiscal year 2000 as compared to 34.3% in fiscalyear 1999. This increase was primarily due to increased capacity utilizationin all three fabrication facilities, improved product costs from yield enhance-ments and manufacturing cost improvement projects. Additionally, wirelessproducts, which generally carry higher margins, increased as a percentage of our total sales. Headcount reductions and a decrease in depreciationexpense resulting from a revaluation of our property and equipment dueto purchase accounting also contributed to the margin improvement.
R&D
R&D expenses increased 16.4% to $78.0 million in fiscal year 2000 from$67.0 million in fiscal year 1999. The increase was the result of our contin-ued investment in PRISM® chip sets and in Power Management integrated circuits, focusing in the categories of communications and computingproducts. As a percentage of sales, R&D expenses declined slightly to 11.9%in fiscal year 2000 from 12.6% in fiscal year 1999.
In-Process Research and Development
In connection with the acquisition of the semiconductor business of Harris,we allocated $20.2 million of the purchase price to in-process R&D projects.These projects were in various stages of completion ranging from 35% – 90%.The present value of $29.0 million of in-process R&D was primarily determinedby discounting 10 year after tax cash flow projections of the individual projects using a discount rate of 20%. The value was then reduced by negative goodwill resulting from the acquisition.
At the date of acquisition, the development of these projects had not yetreached technological feasibility and the in-process R&D had no alternativefuture uses. Accordingly, these costs were expensed as a one-time charge to earnings in the combined fiscal year ended June 30, 2000.
SG&A
SG&A costs, which include marketing, selling, general and administrativeexpenses increased 17.1% to $109.3 million in fiscal year 2000 from $93.3 million in fiscal year 1999. The increase was due to additional sellingcosts resulting from higher sales in fiscal year 2000 and additional marketingcosts associated with our new company branding initiative. Operatingexpenses include charges allocated by Harris to us for legal, financialand other administrative expenses of $1.2 million for the six weeks endedAugust 13, 1999, and $9.3 million for the 12 months ended July 2, 1999. As a percentage of sales, SG&A costs decreased to 16.7% in fiscal year 2000 from 17.5% in fiscal year 1999.
Intangible Assets
Certain intangible assets were recorded on the opening balance sheet ofIntersil as part of purchase accounting. We also recorded goodwill in June 2000
as a result of the acquisition of No Wires Needed B.V. These assets are beingamortized over their useful lives ranging from five to 11 years.
Loss on Sale of Malaysian Operation
On June 30, 2000, we completed the sale of our Kuala Lumpur, Malaysia-based semiconductor assembly and test operations to ChipPAC, Inc. As consideration for the sale we received approximately $52.5 million in cashand $15.8 million in ChipPAC preferred convertible stock and we recognized a non-recurring, non-cash charge of $24.8 million for loss on sale.
Interest Expense
In connection with the acquisition of the semiconductor business of Harris,we entered into new credit facilities. Pursuant to the initial public offeringin February 2000, we retired a significant portion of those same credit facilities.Interest expense for the fiscal year 2000 is not comparable to interestexpense for the combined fiscal year 1999.
Extraordinary Item
On February 25, 2000, we issued 22,000,000 shares of our Class A CommonStock in a registered underwritten initial public offering. From the proceedsof the offering, we repaid approximately $419.0 million of debt incurredthrough the acquisition of the semiconductor business. In connection withthe early extinguishment of debt, we recorded extraordinary charges (net oftax effect) of $25.5 million. The extraordinary charges consisted of the write-off of deferred financing fees and pre-payment penalties.
Tax Expense
The tax benefit for the combined 12 months ended June 30, 2000 is not comparable to the 12 months ended July 2, 1999, due to the differences in our tax structure as compared to that of the semiconductor business of Harris.
Backlog
We had backlog at June 30, 2000 of $259.5 million compared to $174.0
million at July 2, 1999. The increase was due to increased demand for ourcommunications products and improved market conditions.

INTERSIL • 26
M A N AG E M E N T’S D I S C U S S I O N A N D A N A LYS I SContinued
Intersil Holding Corporation
FISCAL YEAR 1999 COMPARED WITH FISCAL YEAR 1998
The following table sets forth statement of operations data in dollars and as percentage of revenue for Intersil Holding’s predecessor for the periods indicated:
Fiscal Year Ended Fiscal Year Ended
Predecessor Predecessor(Dollars in millions) July 2, 1999 July 3, 1998 July 2, 1999 July 3, 1998
Revenue $ 532.7 $576.8 100.0% 100.0%Costs and expenses:
Cost of product sales 349.8 369.3 65.7% 64.0%Research and development 67.0 75.1 12.6% 13.0%Selling, general and administrative 84.0 98.2 15.8% 17.0%Harris corporate expense allocation 9.3 10.0 1.7% 1.7%Intangible amortization 2.4 2.3 0.5% 0.4%
Operating income 20.2 21.9 3.8% 3.8%Interest, net (1.2) (0.9) -0.2% -0.2%
Income before income taxes 21.4 22.8 4.0% 4.0%Income taxes (benefit) (6.0) 9.9 -1.1% 1.7%
Net Income $ 27.4 $ 12.9 5.1% 2.2%
Note: Amounts may not add due to rounding.
Revenue
Revenue for the fiscal year 1999 decreased 7.6% to $532.7 million from$576.8 million in the fiscal year 1999. This decrease was the result of continued soft market conditions and resulting adverse effects on semicon-ductor demand. This trend continued through the second quarter of fiscalyear 1999. We believe that the principal causes for the decline were initiallyhigh inventory levels of our products at our distributors, which decreased17% from fiscal year 1998 to fiscal year 1999, as well as high levels ofinventory at customers. This was followed by an overall drop in global semi-conductor demand of 8.5% in calendar year 1998. Particularly hard hit wereour Discrete Power products where prices of power metal oxide semiconductorfield effect transistors, or MOSFET’s, declined by nearly 15%. Additionally,distributors and major original equipment manufacturers reduced the amountof pipeline inventory in the channel, taking advantage of the shorter lead-times and lower prices. During the third fiscal quarter of 1999, we began toexperience an increase in new orders, which resulted in a 9.1% increase insales in the third quarter versus the preceding quarter. The positive trendcontinued into the fourth quarter with an increase in sales of 11.3% from thethird quarter.
Geographically, 53.5%, 24.6% and 21.9% of product sales were derived inNorth America, Europe and Asia/Pacific, respectively, during fiscal year 1999,compared to 53.8%, 28.0% and 18.2%, respectively, in fiscal year 1998.
Gross Margin
Gross margin on product sales declined 11.9% to $182.9 million in fiscalyear 1999 from $207.5 million in fiscal year 1998. As a percentage of sales,gross margin was 34.3% in fiscal year 1999 as compared to 36.0% in fiscalyear 1998. This decrease was substantially due to price pressure worldwidefor our Discrete Power products and a $13.2 million increase in our deprecia-tion expense resulting from the additional capital expenditures that wentinto our 8-inch wafer fab in Mountaintop, Pennsylvania. Our gross margindecline was partially offset by a series of cost reduction initiatives whichresulted in lower operating costs and improved pricing and terms with oursuppliers of raw materials.
R&D
R&D expenses decreased 10.8% to $67.0 million in fiscal year 1999 from$75.1 million in fiscal year 1998. During fiscal year 1999, we focused ourresources on targeted applications and reduced programs that did not support our emphasis. Major investment continued on the PRISM® chip setwhich addresses the wireless local area network market. R&D for productsdesigned for the power management market was principally focused on com-puting and communications which led our growth of new product revenueduring fiscal year 1999.
SG&A
SG&A costs decreased 13.8% to $93.3 million in fiscal year 1999 from $108.2 million in fiscal year 1998. The decrease in SG&A was primarily due toincreased efficiencies resulting from a reorganization of the internal salesforce and external sales representative firms and reduction of administrativeexpenses including headcount reductions. Operating expenses includecharges allocated by Harris to us for legal, financial and other administrativeexpenses of $9.3 million for fiscal year 1999 and $10.0 million for fiscal year1998. As a percentage of sales, SG&A costs decreased to 17.5% in fiscal year 1999 from 18.8% in fiscal year 1998.
Tax Expense
The tax benefit of $6.0 million in fiscal year 1999 was primarily driven bychanges in the Malaysian tax system, resulting in fiscal year 1999 incomenot being subject to tax.
Backlog
We had backlog at July 2, 1999 of $174.0 million compared to $188.5 millionat July 3, 1998. The decrease in backlog was primarily due to shorter industrylead-times.

27 • AR 2000
M A N AG E M E N T’S D I S C U S S I O N A N D A N A LYS I SContinued
LIQUIDITY AND CAPITAL RESOURCES
Our principal capital requirements are to fund working capital needs, tomeet required debt payments and to complete planned maintenance andexpansion. We anticipate that our operating cash flow and our cash on hand,together with available borrowing under the Revolving Credit Facility of$70.0 million, will be sufficient to meet our working capital, capital expendi-ture and interest requirements on our debt obligations for the foreseeablefuture. We may request, subject to the agreement of our lenders, that theamount of the Revolving Credit Facilities be increased to as much as $150
million. The Revolving Credit Facility will mature in 2005 unless terminatedearlier and was undrawn as of December 29, 2000. As of December 29, 2000
our total debt and shareholders’ equity was $65.5 million and $1,011.0
million, respectively.
Our Revolving Credit Facility and the Senior Subordinated Notes containfinancial covenants and restrictions including restrictions on our ability topay cash dividends or to effect mergers or acquisitions, incur certain indebt-edness or to make certain investments without the bank's prior approval. Weare currently in compliance with such financial covenants and restrictions.
On February 25, 2000, we issued 22,000,000 shares of Class A Common Stockat a price of $25.00 per share. We received net proceeds from this offering,after deducting underwriting discounts and commissions and other fees ofapproximately $513.1 million, of which $435.2 million was subsequently usedto repay debt incurred as a result of our acquisition of the semiconductorbusiness of Harris.
On September 20, 2000, we issued 3,000,000 shares of Class A CommonStock at a price of $48.00 per share. We received net proceeds from thisoffering, after deducting the underwriting discount and estimated offeringexpenses of $7.8 million, of approximately $136.2 million. Pursuant to thispublic offering, we issued an additional 500,000 shares of Class A CommonStock at $48.00 per share upon the exercise of the over-allotment option bythe underwriters on September 26, 2000. We received net proceeds from theexercise of the over-allotment option, after deducting the underwriting discount and estimated offering expenses of $1.2 million, of approximately$22.8 million. We used $59.3 million to repurchase $51.0 million in outstanding13.25% senior subordinated notes. We recorded an extraordinary loss in connection with the repurchased notes for prepayment penalties and write-off of deferred financing fees.
We intend to use the remainder of the proceeds from the offering and theexercise of the over-allotment option for general corporate purposes, includingexpenditures for research and development of new products and sales andmarketing efforts. In addition, we intend to use a portion of the proceeds to acquire complementary products, technology or businesses or to retire portions of our outstanding debt.
Net cash generated by operating activities for the 52 weeks and 26 weeksended December 29, 2000 was $112.0 million and $62.7 million respectively.Net cash used in investing activities for the 52 weeks ended December 29,2000 was $4.9 million for capital expenditures to support our operations offset by the sale of our Malaysia-based assembly and test operations toChipPAC, Inc. Net cash used in investing activities for the 26 weeks endedDecember 29, 2000 was $31.2 million for capital expenditures to support ouroperations. Net cash provided by financing activities for the 52 weeks endedDecember 29, 2000 was $204.4 million, primarily from the proceeds of ourFebruary and September 2000 public offerings. Net cash provided by financingactivities for the 26 weeks ended December 29, 2000 was $109.3 million, primarily from the proceeds of our September 2000 public offering. Our cash balance at December 29, 2000 was $352.6 million.
Receivables and Inventories
Trade accounts receivable less the allowance for collection losses totaled$124.0 million at December 29, 2000 compared to $111.7 million at June 30,2000. The increase was due to higher sales. Inventories remained relativelyflat at $126.2 million at December 29, 2000 versus $126.5 million at June 30,2000 on the higher sales volume. We were able to achieve this due to man-agement’s continued efforts to reduce inventory through portfolio management,process improvements and increased outsourcing of manufacturing.
Distributor reserves fluctuate from year to year based on the level ofinventory at distributors. The reserve increased 8.1% to $8.0 million atDecember 29, 2000 from $7.4 million at June 30, 2000. Inventory levels at distribution increased 12% on increased demand during the 26 weeksended December 29, 2000.
Capital Expenditures
Capital expenditures for the 52 weeks ended December 29, 2000 were$53.7 million compared to $34.9 million for the combined 52 weeks endedDecember 31, 1999. Capital expenditures for the 26 weeks ended December29, 2000 were $27.5 million compared to $14.5 million for the combined 26
weeks ended December 31, 1999. We do not anticipate substantial capitalexpenditures in the foreseeable future.
RECENT ACCOUNTING PRONOUNCEMENTS
In December 1999, the Securities and Exchange Commission (“SEC”) issued Staff Accounting Bulletin (“SAB”) No. 101, “Revenue Recognitionin Financial Management” which was required to be implemented no laterthan the fourth quarter of fiscal years beginning after December 31, 1999,and provides guidance on the recognition, presentation and disclosures ofrevenue in financial statements filed with the SEC. SAB No. 101 outlines thebasic criteria that must be met to recognize revenue and provides guidance for disclosures related to revenue recognition policies. The implementationof SAB No. 101 did not have a material effect on our financial position or results of operations.
Intersil Holding Corporation

M A N AG E M E N T’S D I S C U S S I O N A N D A N A LYS I SContinued
Intersil Holding Corporation
In April 2000, the Financial Accounting Standards Board (“FASB”) issuedFASB Interpretation No. 44, “Accounting for Certain Transactions InvolvingStock Compensation”, an Interpretation of Accounting Policy Bulletin (“APB”)Opinion No. 25. Among other issues, that interpretation clarifies the defini-tion of employees for purposes of applying Opinion No. 25, the criteria fordetermining whether a plan qualifies as a non-compensatory plan, theaccounting consequence of various modifications to the terms of a previouslyfixed stock option or award and the accounting for an exchange of stockcompensation awards in a business combination. The implementation of this interpretation did not have a material impact on our financial positionor results of operations.
RECENT DEVELOPMENTS
Sale of Discrete Power Products Group
In January 2001, we announced the sale of our Discrete Power products groupto Fairchild Semiconductor for approximately $338.0 million in cash. TheDiscrete Power products group provides silicon based power devices for the computer, communications, industrial, automotive and space-defense markets. The primary product areas include Metal Oxide Semiconductor FieldEffect Transistors (MOSFETs), Insulated Gate Bipolar Transistors (IGBTs) andHigh-speed Rectifiers. The manufacturing facilities and offices are located inMountaintop, Pennsylvania. This product group is supported by approximately 650
employees in management, engineering, sales, marketing and manufacturing.
Revenues from Discrete Power product sales for the 52 weeks endedDecember 29, 2000 were $210.8 million and $188.1 million during the combined 52 weeks ended December 31, 1999. Revenues from Discrete Powerproduct sales for the 26 weeks ended December 29, 2000 were $104.6 millionand $99.7 million during the combined 26 weeks ended December 31, 1999.
Tender Offer
On March 1, 2001, we tendered all of the $61.4 million in outstanding 13.25%senior subordinated notes. We will record an extraordinary charge of approxi-mately $19.1 million in the first quarter related to pre-payment penaltiesand the write-off of the remaining deferred financing fees. At the completionof the sale of the Discrete Power products group, we will have no outstandinglong-term debt.
QUANTITATIVE AND QUALITATIVE DISCLOSURES ABOUT MARKET RISK
We, in the normal course of doing business, are exposed to the risks associ-ated with foreign currency exchange rates and changes in interest rates.We employ established policies and procedures governing the use of financialinstruments to manage our exposure to these risks.
Effective July 1, 2000, we adopted Financial Accounting Standard No. 133
(FAS 133), “Accounting for Derivative Instruments and Hedging Activities,”as amended, which requires that all derivative instruments be reported on
the balance sheet at fair value and establishes a criterion for designationand effectiveness of hedging relationships. In accordance with the transitionprovisions of FAS 133, we recorded a cumulative-effect-type adjustment, netof tax, of $(0.2) million to recognize the fair value of the derivatives. Thederivatives were also recognized on the balance sheet at their fair value of$(0.4) million at December 29, 2000.
At December 29, 2000 we had open foreign exchange contracts with a notional amount of $29.0 million to hedge anticipated foreign cash flow commitments up to six months. As hedges on anticipated foreign cash flowcommitments do not qualify for deferral, gains and losses on changes in the fair market value of the foreign exchange contracts are recognized inincome. Total net gains on foreign exchange contracts for the 26 weeksended December 29, 2000 were $1.9 million. During the 26 weeks endedDecember 29, 2000 we purchased and sold $34.4 million of foreignexchange forward and option contracts.
Our hedging activities provide only limited protection against currencyexchange risks. Factors that could impact the effectiveness of our hedgingprograms include accuracy of sales estimates, volatility of currency marketsand the cost and availability of hedging instruments. A 10% adverse changein currency exchange rates for our foreign currency derivatives held atDecember 29, 2000, would have an impact of approximately $3.5 million onthe fair values of these instruments. This qualification of exposure to themarket risk associated with foreign exchange financial instruments does not take into account the offsetting impact of changes in the fair values offoreign denominated assets, liabilities and firm commitments.
As of December 29, 2000, we also had fixed rate debt of approximately $65.5
million consisting primarily of the 13.25% Senior Subordinated Notes due2009. For fixed rate debt, changes in interest rates generally affect the fairmarket value, but not earnings or cash flows.
Historical Financials
The following table sets forth selected historical financial data and supple-mental data for Intersil Holding and its predecessor. The historical financialdata as of and for the fiscal years ended 1998 and 1999 and for the sixweeks ended August 13, 1999 are derived from our predecessor’s auditedconsolidated financial statements included elsewhere in this report. The historical financial data as of and for the fiscal years ended 1996 and 1997,which are not included elsewhere in this report, are derived from our predecessor’s unaudited and audited consolidated financial statements,respectively. The historical financial data as of and for the 46 weeks endedJune 30, 2000 and the 26 weeks ended December 29, 2000 are derived fromour audited consolidated financial statements included elsewhere in thisreport. This information should be read in conjunction with the consolidatedfinancial statements included elsewhere in this report and “Management’sDiscussion and Analysis.”
INTERSIL • 28

S E LE C T E D H I STO R I C A L F I N A N C I A L DATA
Intersil Holding Corporation
Predecessor Predecessor Successor Successor
Fiscal Year Six Weeks Ended 46 Weeks Ended 26 Weeks Ended(Dollars in millions, except per share amounts) 1996 1997 1998 1999 August 13, 1999 June 30, 2000 Dececmber 29, 2000
STATEMENT OF OPERATIONS DATA:
Revenue $570.2 $545.3 $576.8 $532.7 $57.4 $596.8 $ 435.5
Costs and expenses
Gross Margin 227.1 199.3 207.5 182.9 17.7 244.3 205.8
Research and development 69.4 75.2 75.1 67.0 8.5 69.5 53.0
Selling, general and administrative 103.6 99.3 98.2 84.0 10.9 97.2 69.6
Harris corporate expense allocation 10.3 10.0 10.0 9.3 1.2 — —
Intangible amortization 2.3 2.3 2.3 2.4 0.3 10.7 16.5
In-process research and development — — — — — 20.2 25.4
Other — — — — — 1.2 —
Operating income (loss) 41.5 12.5 21.9 20.2 (3.2) 45.5 41.3
Loss on sale of Malaysian operation — — — — — 24.8 —
Interest, net (1.0) (0.6) (0.9) (1.2) (0.1) 38.2 (2.6)
Income (loss) before income taxes,
extraordinary item and cumulative effect
of a change in accounting principle 42.5 13.1 22.8 21.4 (3.1) (17.5) 43.9
Income taxes (benefit) 2.6 1.9 9.9 (6.0) (0.1) (0.3) 30.8
Income (loss) before extraordinary item
and cumulative effect of a change in
accounting principle 39.9 11.2 12.9 27.4 (3.0) (17.2) 13.1
Extraordinary item — loss on extinguishment
of debt, net of tax effect — — — — — (25.5) (5.9)
Income (loss) before cumulative effect
of a change in accounting principle 39.9 11.2 12.9 27.4 (3.0) (42.7) 7.2
Cumulative effect of adoption of
SFAS 133, net of tax effect — — — — — — (0.2)
Net income (loss) 39.9 11.2 12.9 27.4 (3.0) (42.7) 7.0
Preferred dividends — — — — — 5.4 —
Net income (loss) to common shareholders $ 39.9 $ 11.2 $ 12.9 $ 27.4 $ (3.0) $ (48.1) $ 7.0
BASIC EARNINGS (LOSS) PER SHARE:
Income (loss) before extraordinary item $ (0.30) $ 0.13
Extraordinary item (0.33) (0.06)
Income (loss) per share $ (0.63) $ 0.07
DILUTED EARNINGS (LOSS) PER SHARE:
Income (loss) before extraordinary item $ (0.30) $ 0.13
Extraordinary item (0.33) (0.06)
Income (loss) per share $ (0.63) $ 0.07
WEIGHTED AVERAGE COMMON SHARE OUTSTANDING:
Basic 76.7 101.0
Diluted 76.7 105.2
BALANCE SHEET DATA (END OF PERIOD):
Cash and cash equivalents $ — $ — $ — $ — $ 1.4 $211.9 $ 352.6
Total assets 647.0 733.3 810.3 761.2 736.1 933.9 1,229.8
Long-term debt, including current portion — 1.4 4.1 4.6 4.5 116.6 65.5
Total shareholders’ equity/business equity 520.9 646.2 699.1 658.9 657.3 679.0 1,011.0
29 • AR 2000

Predecessor Predecessor Predecessor Successor Successor
Fiscal Year Ended Fiscal Year Ended Six Weeks Ended 46 Weeks Ended 26 Weeks Ended(In thousands, except per share amounts) July 3, 1998 July 2, 1999 August 13, 1999 June 30, 2000 December 29, 2000
Revenue
Product Sales $576,836 $532,718 $57,336 $596,849 $435,452
Costs and expenses
Cost of product sales 369,332 349,776 39,681 352,513 229,664
Research and development 75,125 67,079 8,499 69,456 53,019
Selling, general and administrative 98,184 83,998 10,908 97,227 69,576
Harris corporate expense allocation 9,962 9,303 1,164 — —
Intangible amortization 2,292 2,414 326 10,686 16,504
In-process research and development — — — 20,239 25,440
Other — — — 1,178 —
Operating income (loss) 21,941 20,148 (3,242) 45,550 41,249
Loss on sale of Malaysian operation — — — 24,825 —
Interest expense 43 129 — 41,924 6,788
Interest income (957) (1,360) (111) (3,720) (9,395)
Income (loss) before income taxes, extraordinary item and cumulative
effect of a change in accounting principle 22,855 21,379 (3,131) (17,479) 43,856
Income taxes (benefit) 9,944 (6,027) (102) (289) 30,759
Income (loss) before extraordinary item and cumulative
effect of a change in accounting principle 12,911 27,406 (3,029) (17,190) 13,097
Extraordinary item — loss on extinguishment of debt, net of tax effect — — — (25,518) (5,891)
Income (loss) before cumulative effect of a change in accounting principle 12,911 27,406 (3,029) (42,708) 7,206
Cumulative effect of adoption of SFAS 133, net of tax effect — — — — (197)
Net income (loss) 12,911 27,406 (3,029) (42,708) 7,009
Preferred dividends — — — 5,391 —
Net income (loss) to common shareholders $ 12,911 $ 27,406 $ (3,029) $ (48,099) $ 7,009
Basic income (loss) per share:
Income (loss) before extraordinary item $ (0.30) $ 0.13
Extraordinary item (0.33) (0.06)
Net income (loss) $ (0.63) $ 0.07
Diluted income (loss) per share:
Income (loss) before extraordinary item $ (0.30) $ 0.13
Extraordinary item (0.33) $ (0.06)
Net income (loss) $ (0.63) $ 0.07
Weighted average common shares outstanding (in millions):
Basic 76.7 101.0
Diluted 76.7 105.2
Predecessor Predecessor Predecessor Successor Successor
Fiscal Year Ended Fiscal Year Ended Six Weeks Ended 46 Weeks Ended 26 Weeks Ended(In thousands) July 3, 1998 July 2, 1999 August 13, 1999 June 30, 2000 December 29, 2000
Net income (loss) $12,911 $27,406 $(3,029) $(42,708) $ 7,009
Other comprehensive income (loss):
Currency translation adjustments (1,851) (574) 2,475 1,636 (3,309)
Comprehensive income (loss) $11,060 $26,832 $ (554) $(41,072) $ 3,700
See Notes to Consolidated Financial Statements.
INTERSIL • 30
C O N S O LI DAT E D STAT E M E N TS O F O P E R AT I O N S
Intersil Holding Corporation
C O N S O LI DAT E D STAT E M E N TS O F C O M P R E H E N S I V E I N C O M E
Intersil Holding Corporation

C O N S O LI DAT E D B A L A N C E S H E ETS
Intersil Holding Corporation
31 • AR 2000
Predecessor Successor
(In thousands) July 2,1999 June 30, 2000 December 29, 2000
ASSETS
Current Assets
Cash and cash equivalents $ — $211,940 $ 352,597
Trade receivables, less allowances for collection loss ($582 as of July 2, 1999,
$1,341 as of June 30, 2000 and $736 as of December 29, 2000) 100,674 111,695 123,979
Inventories 153,822 126,481 126,198
Prepaid expenses 3,725 10,645 10,569
Income tax receivable 1,527 1,254 —
Deferred income taxes 3,476 25,768 27,756
Total Current Assets 263,224 487,783 641,099
Other Assets
Property, plant and equipment, less allowances for depreciation 410,530 225,484 235,559
Intangibles, less accumulated amortization 45,368 190,150 307,183
Other 42,057 30,521 45,927
Total Other Assets 497,955 446,155 588,669
Total Assets $761,179 $933,938 $1,229,768
LIABILITIES AND SHAREHOLDERS’ EQUITY/BUSINESS EQUITY
Current Liabilities
Trade payables $ 31,068 $ 36,991 $ 43,209
Retirement plan accruals 13,640 6,228 5,507
Accrued compensation 19,283 32,398 28,203
Accrued interest and sundry taxes 3,193 10,512 6,684
Other accrued items 16,418 22,734 26,039
Distributor reserves 6,542 7,366 8,002
Unearned service income 567 129 6
Long-term debt — current portion 360 404 484
Total Current Liabilities 91,071 116,762 118,134
Other Liabilities
Deferred income taxes 7,022 21,992 35,632
Long-term debt 4,207 116,188 64,966
Shareholders’ Equity/Business Equity
Preferred Stock, $1,000 par value, 100,000 shares authorized, no shares issued or outstanding — — —
Class A Common Stock, $.01 par value, voting; 300,000,000 shares authorized, 44,773,152 shares
issued and outstanding at June 30, 2000 and 68,099,740 shares issued and outstanding at December 29, 2000 — 448 680
Class B Common Stock, $.01 par value, non-voting; 300,000,000 shares authorized, 49,746,482 shares issued
and outstanding at June 30, 1999 and 37,206,996 shares issued and outstanding at December 29, 2000 — 497 372
Additional paid-in capital — 719,123 1,051,213
Business equity 661,388 — —
Retained deficit — (42,708) (35,699)
Unearned compensation — — (3,857)
Accumulated other comprehensive (loss) income (2,509) 1,636 (1,673)
Total Shareholders’ Equity/Business Equity 658,879 678,996 1,011,036
Total Liabilities and Shareholders’ Equity/Business Equity $761,179 $933,938 $1,229,768
See Notes to Consolidated Financial Statements.

INTERSIL • 32
C O N S O LI DAT E D STAT E M E N TS O F C AS H F LOWS
Intersil Holding Corporation
Predecessor Predecessor Predecessor Successor Successor
Fiscal Year Ended Fiscal Year Ended Six Weeks Ended 46 Weeks Ended 26 Weeks Ended(In thousands) July 3, 1998 July 2, 1999 August 13, 1999 June 30, 2000 December 29, 2000
OPERATING ACTIVITIES:
Net income (loss) $ 12,911 $ 27,406 $ (3,029) $ (42,708) $ 7,009
Adjustments to reconcile net income (loss) to net cash provided by operating activities
Depreciation 65,036 78,217 8,747 50,602 19,241
Amortization 2,295 2,414 326 10,686 16,504
Provisions for inventory obsolescence 7,317 3,894 1,919 23,906 17,760
Write-off of in-process research and development — — — 20,239 25,440
Write-off of unearned compensation — — — 878 —
Loss on sale of Malaysian operation — — — 24,825 —
Deferred income taxes (461) 1,896 (4,756) (4,680) 18,178
Changes in assets and liabilities:
Trade receivables 1,270 10,001 14,532 (24,991) (11,656)
Inventories $(17,176) 22,516 (3,568) (5,668) (16,850)
Prepaid expenses 506 933 674 (7,737) 364
Trade payables and accrued liabilities (14,399) (13,950) (18,705) 43,036 (1,467)
Unearned service income (32) 319 — (437) (169)
Income taxes (3,866) (4,486) 4,430 2,290 4,642
Other (5,070) (17,911) 2,812 20,898 (16,322)
Net cash provided by operating activities 48,331 111,249 3,382 111,139 62,674
INVESTING ACTIVITIES:
Proceeds from sale of Malaysian operation — — — 52,500 —
Cash paid for acquired business — (1,335) — — (3,649)
Property, plant and equipment (90,184) (38,563) (1,887) (38,813) (27,523)
Net cash provided by (used in) investing activities (90,184) (39,898) (1,887) 13,687 (31,172)
FINANCING ACTIVITIES:
Proceeds from offering — — — 513,114 158,983
Proceeds from exercises of stock plans — — — 1,985 4,574
Proceeds from borrowings 2,750 800 — — —
Payments of borrowings (83) (302) (32) (435,204) (54,226)
Net cash transfer and billings from (to) parent 41,844 (67,030) (1,198) — —
Net cash provided by (used in) financing activities 44,511 (66,532) (1,230) 79,895 109,331
Effect of exchange rates on cash and cash equivalents (2,658) (4,819) 1,177 (158) (176)
Net increase in cash and cash equivalents — — 1,442 204,563 140,657
Cash and cash equivalents at the beginning of the period — — — 7,377 211,940
Cash and cash equivalents at the end of the period $ — $ — $ 1,442 $ 211,940 $352,597
SUPPLEMENTAL DISCLOSURES — NON-CASH ACTIVITIES:
Exchange of Preferred Stock for Common Stock $ 89,500 $ —
Additional Paid-In-Capital from Tax Benefit on Exercise on Non-Qualified Stock Options $ 2,132 $ 1,709
Common Stock Issued in Acquisition of No Wires Needed B.V. $ 111,348 $ —
Common Stock Issued in Acquisition of SiCOM, Inc. $ — $162,620
Preferred Stock Received from Sale of Malaysian Operation $ 15,800 $ —
See Notes to Consolidated Financial Statements.
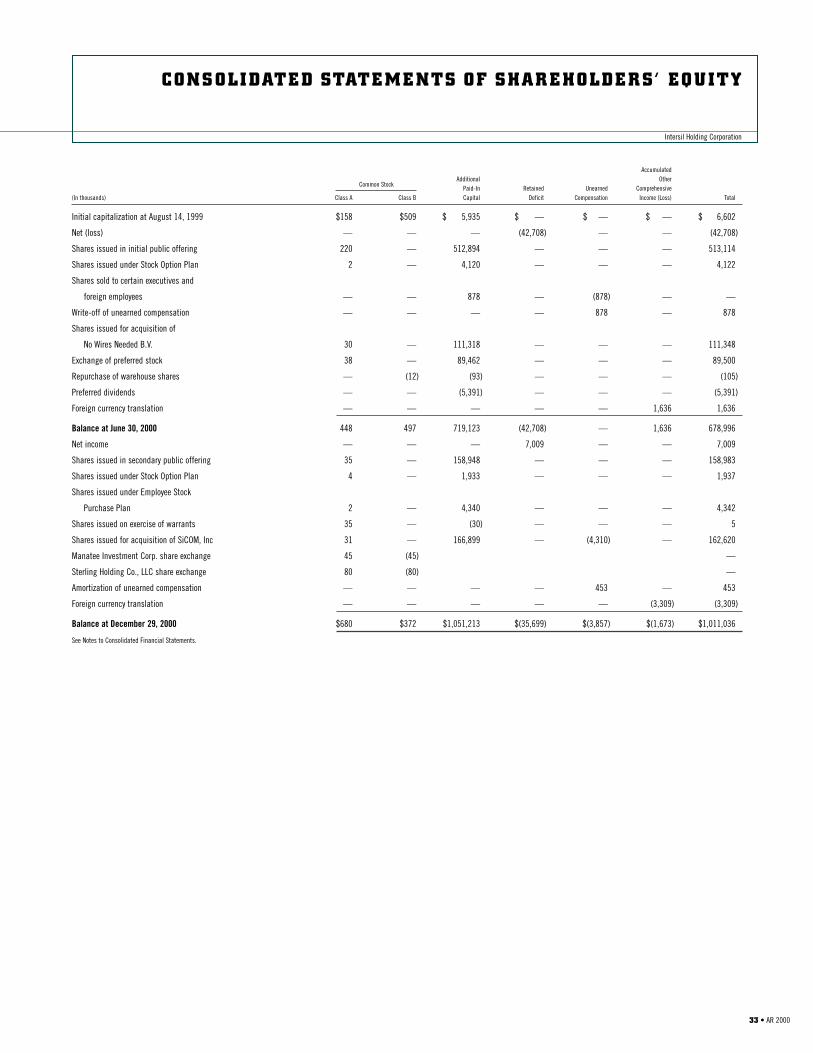
C O N S O LI DAT E D STAT E M E N TS O F S H A R E H O LD E R S’ E Q U I T Y
Intersil Holding Corporation
33 • AR 2000
AccumulatedAdditional Other
Common StockPaid-In Retained Unearned Comprehensive
(In thousands) Class A Class B Capital Deficit Compensation Income (Loss) Total
Initial capitalization at August 14, 1999 $158 $509 $ 5,935 $ — $ — $ — $ 6,602
Net (loss) — — — (42,708) — — (42,708)
Shares issued in initial public offering 220 — 512,894 — — — 513,114
Shares issued under Stock Option Plan 2 — 4,120 — — — 4,122
Shares sold to certain executives and
foreign employees — — 878 — (878) — —
Write-off of unearned compensation — — — — 878 — 878
Shares issued for acquisition of
No Wires Needed B.V. 30 — 111,318 — — — 111,348
Exchange of preferred stock 38 — 89,462 — — — 89,500
Repurchase of warehouse shares — (12) (93) — — — (105)
Preferred dividends — — (5,391) — — — (5,391)
Foreign currency translation — — — — — 1,636 1,636
Balance at June 30, 2000 448 497 719,123 (42,708) — 1,636 678,996
Net income — — — 7,009 — — 7,009
Shares issued in secondary public offering 35 — 158,948 — — — 158,983
Shares issued under Stock Option Plan 4 — 1,933 — — — 1,937
Shares issued under Employee Stock
Purchase Plan 2 — 4,340 — — — 4,342
Shares issued on exercise of warrants 35 — (30) — — — 5
Shares issued for acquisition of SiCOM, Inc 31 — 166,899 — (4,310) — 162,620
Manatee Investment Corp. share exchange 45 (45) —
Sterling Holding Co., LLC share exchange 80 (80) —
Amortization of unearned compensation — — — — 453 — 453
Foreign currency translation — — — — — (3,309) (3,309)
Balance at December 29, 2000 $680 $372 $1,051,213 $(35,699) $(3,857) $(1,673) $1,011,036
See Notes to Consolidated Financial Statements.

INTERSIL • 34
N OT E S TO C O N S O LI DAT E D F I N A N C I A L STAT E M E N TS
Intersil Holding Corporation
NOTE A — ORGANIZATION
Intersil Holding Corporation (Intersil Holding or Successor) was formed onAugust 13, 1999 through a series of transactions in which Intersil Holdingand its wholly owned subsidiary, Intersil Corporation (Intersil), acquired the semiconductor business (semiconductor business or Predecessor) ofHarris Corporation (Harris). Intersil Holding currently has no operations butholds common stock related to its investment in Intersil. Intersil and itswholly owned domestic and foreign subsidiaries include the operations ofthe Predecessor.
Basis of Presentation
The Successor consolidated financial statements subsequent to August 13,1999 include the accounts of Intersil Holding and Intersil (collectively, theCompany). All material intercompany transactions have been eliminated in consolidation. The consolidated balance sheet as of July 2, 1999 and the consolidated statements of operations, comprehensive income and cash flowsfor the fiscal years ended July 3, 1998 and July 2, 1999 and the six weeksended August 13, 1999 include the accounts of the Predecessor company.
The Predecessor’s consolidated statements of operations include all revenuesand costs attributable to the semiconductor business. For cost of sales,material costs are directly attributable to a product line and are chargedaccordingly. Indirect costs are assigned using activity based costing.Operating expenses (engineering, marketing, and administrative & general)have been allocated to the product lines based on sales or labor, as appro-priate. Harris corporate expense allocations were based on a percentage of the semiconductor business’ net sales. Interest expense was provided on direct borrowings of the semiconductor business. Interest expense ofHarris has not been allocated to the semiconductor business.
All of the allocations and estimates in the Predecessor’s consolidated state-ments of operations are based on assumptions that management believesare reasonable under the circumstances. However, these allocations andestimates are not necessarily indicative of the costs that would have resultedif the semiconductor business had been operated on a stand alone basis.
The semiconductor business sold products to other affiliated operations of Harris. Sales to these operations were not material.
Acquisition of Harris’ Semiconductor Business
The total purchase price of the semiconductor business acquisition was$614.3 million, which included transaction costs of approximately $7.8 millionand deferred financing costs of $12.2 million. The consideration paid byIntersil Holding was $504.3 million in cash of which $420.0 million wasfinanced through borrowings from senior credit facilities, 13.25% SeniorSubordinated Notes and 13.5% Subordinated Holding “Pay-In-Kind” (PIK)Note and the issuance of a $90.0 million PIK Note to Harris.
The acquisition was accounted for using the purchase method of accountingand, accordingly, the operating results of the semiconductor business havebeen included in Intersil’s consolidated financial statements since the dateof acquisition. The total purchase price was allocated to the assets andliabilities of the semiconductor business based upon their approximate fairvalues. The fair values of the net assets acquired exceeded the purchaseprice resulting in negative goodwill. This negative goodwill was allocated tothe identified intangibles and property and equipment based on their relativefair values as follows (in millions):
Purchase price:Cash paid to Harris $504.3 13.5% Subordinated PIK Note 90.0Transaction costs and fees 20.0
TOTAL PURCHASE PRICE $614.3
Fair Value of Allocation of AdjustedAcquired Assets Excess Fair Value Fair Value
Net current assets $160.6 $ — $160.6 Other 17.2 — 17.2Property and equipment 481.0 (153.2) 327.8Developed technology 80.0 (23.9) 56.1Customer base 33.0 (10.0) 23.0In-process research
and development 29.0 (8.8) 20.2Assembled workforce 13.5 (4.1) 9.4
$814.3 $(200.0) $614.3
Excess fair value of net assetsacquired over purchase price $200.0
The appraisal of the acquired semiconductor business included $20.2 million of purchased in-process research and development, which was related tovarious products under development. This valuation represents the 10 yearafter-tax cash flow of this in-process technology using a discount rate of20%. The acquired technology had not yet reached technological feasibilityand had no future alternative uses. Accordingly, it was written off at thetime of the acquisition. The remaining identified intangibles (developedtechnology, customer base and assembled work-force) are being amortizedover five to 11 years.
In connection with the acquisition of the semiconductor business, Intersilformulated a restructuring plan that included the termination of the employ-ment of 372 employees of the semiconductor business. At August 13, 1999,Intersil recorded $11.0 million in severance benefits and this was included in the allocation of the acquisition cost. For the 46 weeks ended June 30,2000 and the 26 weeks ended December 29, 2000, approximately $10.1 millionand $10.9 million, respectively, of these restructuring costs had been paid out.As of June 30, 2000 and December 29, 2000 the restructuring liability was $0.9
million and $0.1 million, respectively. Intersil Holding completed all restructuringactivities in August of calendar year 2000. Severance payments will continuethrough March of calendar year 2001.

N OT E S TO C O N S O LI DAT E D F I N A N C I A L STAT E M E N TSContinued
Intersil Holding Corporation
35 • AR 2000
Pursuant to a Form 8-K filed on March 29, 2000, Intersil Holding changed its fiscal year end from the Friday closest to June 30 to the Friday closest toDecember 31. The 26 weeks ended December 29, 2000 is referred to asstub year 2000.
NOTE B — SIGNIFICANT ACCOUNTING POLICIES
Fiscal Year
The 1998 fiscal year includes the 53 weeks ended July 3, 1998; fiscal year1999 includes the 52 weeks ended July 2, 1999; fiscal year 2000 includes the six weeks ended August 13, 1999 and the 46 weeks ended June 30, 2000;and the stub year 2000 includes the 26 weeks ended December 29, 2000.
Cash and Cash Equivalents
Intersil Holding considers all highly liquid investments with maturity of three months or less when purchased to be cash equivalents.
Inventories
Inventories are carried at the lower of standard cost, which approximatesactual cost, determined by the First-In-First-Out (FIFO) method, or market.Shipping and handling costs are classified as a component of cost of productsales in the consolidated statement of operations.
Property, Plant and Equipment
Machinery and equipment are carried on the basis of cost. The estimateduseful lives of buildings range between five and 50 years. The estimateduseful lives of machinery and equipment range between three and 10 years.Depreciation is computed by the straight-line method using the estimateduseful life of the asset.
Revenue Recognition
Revenue is recognized from sales to all customers, including distributors,when a product is shipped. Sales to distributors are made under agreementswhich provide the distributors rights of return and price protection on unsoldmerchandise they hold. Accordingly, sales are reduced for estimated returnsfrom distributors and estimated future price reductions of unsold merchan-dise held by distributors. Product sales to two distributors for the fiscal yearsended July 3, 1998 and July 2,1999, the six weeks ended August 13, 2000, the46 weeks ended June 30, 2000 and the 26 weeks ended December 29, 2000
amounted to 19.0%, 16.6%, 29.3%, 15.7% and 33.9%, respectively, of totalproduct sales.
Research and Development
Research and development costs, consisting of the cost of designing,developing and testing new or significantly enhanced products are expensedas incurred.
Retirement Benefits
Intersil Holding provides retirement benefits to substantially all employeesprimarily through a retirement plan having profit-sharing and savings ele-ments. Contributions by Intersil Holding to the retirement plan are based onprofits and employees’ savings with no other funding requirements. IntersilHolding may make additional contributions to the fund at its discretion.
The savings element of the retirement plan is a defined contribution plan,which is qualified under Internal Revenue Service Code Section 401(k). Allemployees of the Company may elect to participate in the 401(k) retirementplan (the “401(k) plan”). Under the 401(k) plan, participating employees maydefer a portion of their pretax earnings up to certain limits prescribed by theInternal Revenue Service. The Company provides matching contributions underthe provisions of the plan. Employees fully vest in the Company’s matchingcontributions upon the completion of five years of service.
Retirement benefits also include an unfunded limited healthcare plan forU.S.-based retirees and employees on long-term disability. Intersil Holdingaccrues the estimated cost of these medical benefits, which are not material,during an employee’s active service life.
Retirement plans expense was $15.6 million in 1998, $14.8 million in 1999,$1.4 million for the six weeks ended August 13, 1999, $10.4 million for the 46 weeks ended June 30, 2000 and $9.6 million for the 26 weeks endedDecember 29, 2000.
Income Taxes
For the Predecessor financial statements, the semiconductor business wasincluded with its parent, Harris, in a consolidated federal income tax return.Harris required each of its businesses to provide for taxes on financial state-ment pre-tax income or loss at applicable statutory tax rates. United Stateslocal amounts receivable or payable for current and prior years’ income taxeswere treated as intercompany transactions and were recorded in the semi-conductor business equity. Intersil Holding follows the liability method ofaccounting for income taxes. International current income taxes payable anddeferred income taxes resulting from temporary differences between the finan-cial statements and the tax basis of assets and liabilities of Intersil Holding’sinternational subsidiaries are separately classified on the balance sheets.
Asset Impairment
Intersil Holding accounts for long-lived asset impairment under Statement of Financial Accounting Standards No. 121, “Accounting for the Impairmentof Long-Lived Assets and for Long-Lived Assets to Be Disposed Of.” TheCompany recognizes impairment losses on long-lived assets used in operations when indicators of impairment are present and the undiscountedcash flows estimated to be generated by those assets are less than the

INTERSIL • 36
N OT E S TO C O N S O LI DAT E D F I N A N C I A L STAT E M E N TSContinued
Intersil Holding Corporation
assets’ carrying amounts. The impairment loss is measured by comparing the fair value of the asset to its carrying amount. Fair value is estimatedbased on discounted future cash flows. Long-lived assets to be disposed ofare recorded at the lower of their carrying amount or estimated fair valueless cost to sell.
Intangibles
Intangibles resulting from acquisitions are being amortized by the straight-line method over five to 11 years. Recoverability of intangibles is assessedusing estimated undiscounted cash flows of related operations. Intangiblesthat are not expected to be recovered through future undiscounted cashflows are charged to expense when identified. Amounts charged to expenseare amounts in excess of the fair value of the intangible asset. Fair value is determined by calculating the present value of estimated expected futurecash flows using a discount rate commensurate with the risks involved.
Forward Contracts
When Intersil Holding sells products outside the United States or enters intopurchase commitments, the transactions are frequently denominated in currencies other than U.S. dollars. It is Intersil Holding’s policy not to speculatein foreign currencies. Intersil Holding uses foreign exchange contracts tohedge anticipated foreign cash flow commitments up to six months. Hedgeson anticipated foreign cash flow commitments do not qualify for deferraland therefore, gains and losses on changes in fair market value of the foreign exchange contracts are recognized in income.
Foreign Currency Translation
The functional currency for Intersil’s international subsidiaries is the localcurrency. Assets and liabilities are translated at current rates of exchange,and income and expense items are translated at the weighted averageexchange rate for the year. The resulting translation adjustments are recordedas a separate component of shareholders’ equity. Cumulative translationgains (losses) were $(2.5) million, $1.6 million and $(1.7) million at July 2,1999, June 30, 2000 and December 29, 2000, respectively.
Income (Loss) Per Share
Income (loss) per share is computed and presented in accordance with SFAS
No. 128, “Earnings per Share” and the Securities and Exchange CommissionStaff Accounting Bulletin No. 98. Income (loss) per common share is presentedfor the periods subsequent to August 13, 1999 only because it is not mean-ingful for earlier periods since the Company did not have common stockoutstanding for any of the earlier periods.
Use of Estimates
These statements have been prepared in conformity with accounting principlesgenerally accepted in the United States and require management to makeestimates and assumptions that affect the reported amounts of assets andliabilities and disclosure of contingent assets and liabilities at the date ofthe financial statements and the reported amounts of revenue and expensesduring the reporting period. Actual results could differ from those estimates.
Reclassifications
Certain prior year amounts have been reclassified to conform with currentyear classifications.
NOTE C — INVENTORIES
Inventories are summarized below (in thousands):July 2, 1999 June 30, 2000 December 29, 2000
Finished products $ 58,041 $ 45,064 $ 51,583Work in process 102,457 96,278 94,477Raw materials and supplies 11,441 7,072 9,002
171,939 148,414 155,062Less inventory reserves 18,117 21,933 28,864
$153,822 $126,481 $126,198
At July 2, 1999, June 30, 2000 and December 29, 2000 Intersil Holding wascommitted to purchase $22.5 million, $24.9 million and $24.4 million,respectively, of inventory from suppliers. Management believes the cost of this inventory approximates market value.
NOTE D — PROPERTY, PLANT AND EQUIPMENT
Property, plant and equipment are summarized below (in thousands):July 2, 1999 June 30, 2000 December 29, 2000
Land $ 3,966 $ 3,860 $ 3,860Buildings 266,364 78,940 78,693Machinery and equipment 722,816 179,383 208,679
993,146 262,183 291,232Less allowances for depreciation 582,616 36,699 55,673
$410,530 $225,484 $235,559
NOTE E — INTANGIBLES
Intangibles are summarized below (in thousands):Period of Amortization July 2, 1999 June 30, 2000 December 29, 2000
Developed technology 11 years $ — $ 56,925 $ 75,775Customer base 7 years — 23,482 23,482Assembled workforce 5 years — 9,606 11,906Goodwill 5-7 years 65,297 110,823 223,077
65,297 200,836 334,240Less accumulated amortization 19,929 10,686 27,057
$45,368 $190,150 $307,183

37 • AR 2000
N OT E S TO C O N S O LI DAT E D F I N A N C I A L STAT E M E N TSContinued
Intersil Holding Corporation
NOTE F — INCOME (LOSS) PER SHARE
The following table sets forth the computation of basic and diluted income(loss) per share (in thousands, except per share amounts):
June 30, 2000 December 29, 2000
Numerator:Net income (loss) available to common shareholders $(48,099) $ 7,009
Denominator: Denominator for basic earnings per share — weighted average common shares 76,745 101,014
Effect of dilutive securitiesStock options — 1,000Warrants — 3,153
Denominator for diluted earnings per share — adjusted weighted average shares 76,745 105,167
Basic income (loss) per share (0.63) 0.07
Diluted income (loss) per share (0.63) 0.07
The effect of dilutive securities is not included in the computation for the 46 weeks ended June 30, 2000 because to do so would be antidilutive.
NOTE G — LONG-TERM DEBT
Long-term debt consists of the following (in thousands):July 2, 1999 June 30, 2000 December 29, 2000
13.25% Senior Subordinated Notes $ — $112,384 $61,369Other 4,567 4,208 4,081
4,567 116,592 65,450Less current portion 360 404 484
$4,207 $116,188 $64,966
Scheduled future principal payments under the Company’s indebtedness areas follows (in thousands):
2001 $ 4842002 4222003 4222004 3672005 379Thereafter 63,376
$65,450
13.25% Senior Subordinated Notes and Warrants
On August 13, 1999, in connection with the acquisition of the semiconductorbusiness, Intersil completed an offering of 200,000 units consisting of $200
million of its 13.25% Senior Subordinated Notes (“Sub Notes”) due 2009 andwarrants to purchase 3,703,707 shares of Class A Common Stock of IntersilHolding. Each unit consisted of $1,000 principal amount of Sub Notes of
Intersil and one warrant to purchase 18.5185 shares of Class A CommonStock of Intersil Holding. The total gross proceeds from the sale of the SubNotes were $194.0 million, net of $6.0 million of deferred financing fees. The $6.0 million deferred financing fees were treated as additional interestrelated to the Sub Notes and amortized over the life of the Sub Notes on aneffective yield method.
The Sub Notes are unsecured and are fully and unconditionally guaranteed byIntersil Holding and all Intersil’s current and future domestic subsidiaries.The Sub Notes are not guaranteed by Intersil’s foreign subsidiaries. The SubNotes require semi-annual interest payments beginning on February 15, 2000
through maturity on August 15, 2009. The Sub Notes may be redeemed at the option of Intersil Holding after August 15, 2004 upon the payment of certain redemption premiums, although up to 35% of the Sub Notes can beredeemed prior to August 15, 2002 with the proceeds of certain equity offeringsand upon the payment of certain redemption premiums. The Sub Notes containvarious restrictive covenants, including limitations on the incurrence ofadditional indebtedness, restrictions and limitations on payment of dividends,making investments, engaging in transactions with affiliates, consolidating,merging or transferring assets and restrictions and limitations on the salesof certain assets, among others. The Sub Notes also require the maintenanceof certain ratios.
Each warrant entitles the holder to purchase 18.5185 shares of IntersilHolding Class A Common Stock at a price of $.0015 per share. The warrantsare exercisable beginning on the first anniversary of their issue date (August 13,1999) and expire on August 15, 2009. Warrant holders have no voting rights.The warrants were preliminarily valued at $0.3 million and were treated asadditional interest related to the Sub Notes and amortized over the life of the Sub Notes on an effective yield method.
On August 13, 1999, in connection with the acquisition of the semiconductorbusiness, Intersil entered into senior credit facilities with a syndicate offinancial institutions. The senior credit facilities included a $205.0 millionfunded term loan facility (the “Tranche B Senior Term Facility”) and a revolvingline of credit (the “Revolving Credit Facility”). The Revolving Credit Facilityprovides for up to $70.0 million of which no amounts were outstanding as ofJune 30, 2000 or December 29, 2000.
The Revolving Credit Facility bears interest ranging from LIBOR + 2.00% toLIBOR + 3.25%, depending on the results of applicable ratios. The RevolvingCredit Facility matures in 2005.
The senior credit facilities are unconditionally guaranteed, jointly and sever-ally, by Intersil Holding, Intersil and existing and subsequently acquired ororganized domestic subsidiaries. The Company’s obligations and those of theguarantors under the senior credit facilities are secured by a pledge of all of Intersil’s capital stock and by substantially all of the assets of Intersil

N OT E S TO C O N S O LI DAT E D F I N A N C I A L STAT E M E N TSContinued
Intersil Holding Corporation
INTERSIL • 38
Holding, Intersil and each of Intersil’s existing and subsequently acquired ororganized domestic (and, to the extent no adverse consequences will result,foreign) subsidiaries. The senior credit facilities contain various restrictivecovenants, including, incurrence of indebtedness, payment of dividends, makingcertain investments and acquisitions, disposing of assets, among others. Thesenior credit facilities also require the maintenance of certain ratios.
Also on August 13, 1999, in connection with the acquisition of the semicon-ductor business, Intersil Holding issued to Harris a $90.0 million 11.13%Seller Holding PIK Note and issued to Citicorp Mezzanine Partners, L.P. a $30.0 million 13.5% Subordinated PIK Note.
On February 25, 2000, the Company issued 22,000,000 shares of its Class ACommon Stock at a price of $25.00 per share. From the proceeds of the initialpublic offering, the Company paid off approximately $419.0 million of debtincurred through the acquisition of the semiconductor business, includingall amounts then outstanding under the Tranche B Senior Term Facility, the11.13% Seller Holding PIK Note and the 13.5% Subordinated PIK Note. In connection with the early extinguishment of debt, the Company recordedextraordinary charges (net of tax) of $25.5 million.
During the 26 weeks ended December 29, 2000, the Company paid offapproximately $51.0 million of the outstanding 13.25% Senior SubordinatedNotes. In connection with the early extinguishment of debt, the Companyrecorded extraordinary charges (net of tax) of $5.9 million.
The other debt consists of five loans made by agencies of the Commonwealthof Pennsylvania with maturity dates ranging from 2003 to 2017 and aresecured by Intersil’s manufacturing facility in Mountaintop, Pennsylvania,which had a net carrying value of $4.6 million at July 2, 1999, $4.2 million atJune 30, 2000 and $4.1 million at December 29, 2000. The weighted averageinterest rate for this debt was 3% at July 2, 1999, June 30, 2000 andDecember 29, 2000.
No interest was paid in fiscal years 1998 or 1999 or in the six weeks endedAugust 13, 1999. Interest paid in the 46 weeks ended June 30, 2000 was$0.1 million and in the 26 weeks ended December 29, 2000 was $1.4 million.
NOTE H — PREFERRED STOCK
Intersil Holding has 100,000 shares of preferred stock authorized, stated valueof $1,000 per share. The rights of holders of preferred stock will be stipulatedat the time of issuance as determined by the board of directors pursuant tothe adoption of a shareholder rights plan. On August 13, 1999, Intersil Holdingsold 83,434 shares of its 12% Series A Cumulative Compounding PreferredStock to certain buyers, including Sterling Holding Company, LLC, Harris and
certain members of management. The $83.4 million received from the sale wasused as a cash equity contribution from Intersil Holding to Intersil for theacquisition of the semiconductor business. No preferred stock was outstandingat June 30, 2000 or December 29, 2000.
On August 13, 1999, Intersil Holding granted to certain members of management options to purchase 766.67 shares of Series A Preferred Stock at an option price of $250 per share, and a sign-on bonus in the aggregateamount of $575,025, representing the difference between the stated parvalue and the option price. The preferred stock options vested immediately.Intersil Holding recorded compensation expense for the $575,025 as of thegrant date.
Concurrent with the initial public offering, Intersil Holding exchanged all out-standing shares of its 12% Series A Cumulative Compounding Preferred Stockplus accrued and unpaid dividends for approximately 2.6 million shares ofits Class A Common Stock. Also, the outstanding options to purchase 766.67
shares of Series A Preferred Stock were exchanged for options to purchase40,881 shares of Class A Common Stock.
NOTE I — LEASE COMMITMENTS
Total rental expense amounted to $6.3 million in fiscal year 1998, $6.3 millionin fiscal year 1999, $0.6 million for the six weeks ended August 13, 1999,$5.0 million for the 46 weeks ended June 30, 2000 and $3.7 million for the 26 weeks ended December 29, 2000. Future minimum rental commitmentsunder non-cancelable operating leases primarily used for land and officebuildings amounted to approximately $18.4 million at December 29, 2000.These commitments for the years following 2000 (which exclude the estimatedrental expense for annually renewable contracts) are: 2001 – $4.5 million,2002 – $3.6 million, 2003 – $2.9 million, 2004 – $1.9 million, 2005 – $1.2 million and $4.3 million thereafter.
NOTE J — BUSINESS EQUITY
Changes in the business equity of the Predecessor’s financial statements aresummarized as follows (in thousands):
Fiscal Year Ended Six Weeks EndedJuly 3 1998 July 2, 1999 August 13, 1999
Balance at beginning of period $646,173 $699,077 $ 658,879Net income (loss) 12,911 27,406 (3,029)Foreign currency translation adjustments (1,851) (574) 2,475Net cash transfers and billings from (to) Harris 41,844 (67,030) (1,198)Purchase price elimination — — (657,127)
BALANCE AT END OF PERIOD $699,077 $658,879 $ —

N OT E S TO C O N S O LI DAT E D F I N A N C I A L STAT E M E N TSContinued
Intersil Holding Corporation
39 • AR 2000
NOTE K — COMMON STOCK
Intersil Holding is authorized to issue 600.0 million shares of Intersil Holdingcommon stock, par value $0.01 per share, divided into two classes consistingof 300.0 million shares of Intersil Holding Class A Common Stock and 300.0
million shares of Intersil Holding Class B Common Stock. Holders of Class ACommon Stock are entitled to one vote for each share held and holders ofClass B Common Stock have no voting rights. A holder of either class ofIntersil Holding common stock may convert any or all shares into an equalnumber of shares of the other class of Intersil Holding common stock.
On August 13, 1999, Intersil Holding sold 15.76 million shares of Class ACommon Stock and 50.91 million shares of Class B Common Stock forapproximately $5.0 million. The $5.0 million proceeds, along with the $83.4 million proceeds from the sale of Series A Preferred Stock were used as a cash equity contribution from Intersil Holding to Intersil for theacquisition of the semiconductor business.
On August 13, 1999, in connection with the issuance of the 13.5%Subordinated Holding PIK Note, Intersil Holding issued to Citicorp MezzaninePartners, L.P. warrants to purchase 3,703,707 shares of its Class A CommonStock at an exercise price of $.001 per share, subject to certain anti-dilutionadjustments. These warrants may be exercised at any time after August 13,2000 and expire on August 15, 2009. As Intersil Holding prepaid in full the13.5% Subordinated Holding PIK Note within 24 months after issuance, thewarrants became exercisable for 2,222,224 shares of Intersil Holding Class ACommon Stock. The warrants were valued at $0.3 million and were treated asadditional interest related to the 13.5% Subordinated Holding PIK Note. TheCompany agreed to the early exercise of warrants to purchase 360,633
of the underlying shares.
Intersil Holding had an option to purchase 1,161,905 shares (warehouseshares) from a majority shareholder at $0.075 per share pursuant to anagreement executed at the initial capitalization. Intersil Holding repurchasedthe 1,161,905 shares in January 2000.
On February 25, 2000, Intersil Holding completed the filing of a registrationstatement with the Securities and Exchange Commission for a public offeringof shares of its Class A Common Stock. Intersil Holding issued 22,000,000
shares of it Class A Common Stock at a price of $25.00 per share. The netproceeds of this offering, after deducting underwriting discounts and com-missions, were approximately $513.1 million.
In connection with the Company’s initial public offering on February 25, 2000,Intersil Holding effected a 1-for-1.5 reverse stock split of its Class A and Class Bcommon shares as of February 23, 2000. All references to common shares inthe accompanying consolidated financial statements reflect Intersil Holding’sreverse stock split, retroactively applied to all periods presented.
On May 29, 2000, Intersil Holding acquired 100% of the outstanding capitalstock of Bilthoven, The Netherlands-based No Wires Needed B.V. (“NWN”).
Consideration for the acquisition of NWN was 3.35 million shares of IntersilHolding Class A Common Stock valued at $111.3 million at the date of closing.
At June 30, 2000, Intersil had 200,000 outstanding warrants (issued with the13.25% Senior Subordinated Notes) to purchase 3,703,707 shares of Class ACommon Stock of Intersil Holding. Each warrant entitles the holder to pur-chase 18.5185 shares at a price of $.0015 per share. The warrants becameexercisable on August 13, 2000 and expire on August 15, 2009. As ofDecember 29, 2000, 189,050 warrants had been exercised for 3,500,918
shares of Intersil Holding Class A Common Stock. At December 29, 2000,10,950 warrants to purchase 202,789 shares of Class A Common Stockremained outstanding.
During the 46 weeks ended June 30, 2000, Intersil Holding recorded $0.9 millionof unearned compensation for the excess of the fair value of the Class ACommon Stock over the grant price for stock sold to certain executives by themajority shareholder of Intersil Holding. Upon the Company’s initial publicoffering, the stock sold became fully vested and the unearned compensationwas written off.
On September 18, 2000, Manatee Investment Corporation, a wholly ownedsubsidiary of Harris Corporation, converted all 4,531,584 shares of its IntersilHolding Class B Common Stock into an equivalent number of shares ofIntersil Holding Class A Common Stock.
On September 20, 2000, the Company issued 3,000,000 shares of its Class ACommon Stock at a price of $48.00 per share. Net proceeds received fromthis offering, after deducting the underwriting discount and offering expensesof $7.8 million, were approximately $136.2 million. Pursuant to this publicoffering, the Company issued an additional 500,000 shares of its Class ACommon Stock at a price of $48.00 per share upon the exercise of the over-allotment option by the underwriters on September 26, 2000. Net proceedsreceived from the exercise of the over-allotment option, after deducting theunderwriting discount and offering expenses of $1.2 million, were approxi-mately $22.8 million.
Sterling Holding Company, LLC., in connection with the Company’s publicoffering in September 2000, converted 8,007,902 shares of its Intersil HoldingClass B Common Stock into an equivalent number of shares of IntersilHolding Class A Common Stock.
On October 27, 2000, Intersil Holding acquired 100% of the outstanding stockof Scottsdale, Arizona based SiCOM, Inc. (“SiCOM”). Consideration for theacquisition of SiCOM was 3.6 million shares (which includes 0.4 million sharesissuable upon exercise of options) of Intersil Holding Class A Common Stockvalued at $162.6 million. The Company recognized $4.3 million in unearnedcompensation relative to the unvested portion of the options granted in con-nection with the acquisition. The unearned compensation will be amortizedover the remaining vesting period of those options.

INTERSIL • 40
N OT E S TO C O N S O LI DAT E D F I N A N C I A L STAT E M E N TSContinued
Intersil Holding Corporation
NOTE L — INCOME TAXES
The provision (benefit) for income taxes is summarized below (pro forma forpredecessor financial statements) (in thousands):
Successor
46 Weeks Ended 26 Weeks EndedJune 30, 2000 December 29, 2000
Current taxes: Federal $ — $ 4,484State — 166Foreign 4,391 4,155
4,391 8,805Deferred taxes:
Federal $(4,198) $16,565State (482) 1,613
(4,680) 18,178
Income tax expense (benefit) $ (289) $26,983
Predecessor
Fiscal Year Ended Fiscal Year Ended Six Weeks EndedJuly 3, 1998 July 2, 1999 August 13, 1999
United States (benefit) $4,221 $(6,626) $(399)International 4,910 1,605 352State and local (benefit) 813 (1,006) (55)
$9,944 $(6,027) $(102)
The benefit related to tax deductions for the Company’s stock option plans is recorded as an increase to additional paid-in capital when realized. TheCompany realized tax benefits of approximately $2.1 million and $1.7 millionfor the 46 weeks ended June 30, 2000 and the 26 weeks ended December 29,2000, respectively.
The provision (benefit) for income taxes is included in the Company’sConsolidated Statement of Operations as follows (in thousands):
Successor
46 Weeks Ended 26 Weeks EndedJune 30, 2000 December 29, 2000
Income tax expense (benefit)from operations $(289) $30,759
Income tax benefit from extraordinary item and changein accounting principle — (3,776)
Total income tax expense (benefit) $(289) $26,983
The income tax benefit from extraordinary items is attributable to thepay-off of approximately $51.0 million of the outstanding 13.25% SeniorSubordinated Notes as discussed in Note G – Long-Term Debt and theadoption of FAS 133 as discussed in Note P – Adoption of FinancialAccounting Standard No. 133. In connection with the early extinguishment
of debt, the Company recorded extraordinary charges (net of $3.6 million taxbenefit) of $5.9 million. The tax benefit attributable to the extraordinary itemreduced the Company’s current federal and state income tax expense by $3.3 million and $0.3 million, respectively. In connection with the adoption of FAS 133, the Company recorded a cumulative-effect-type adjustment (net of $0.1 million tax benefit) of $0.2 million. The tax benefit attributable to theadoption of FAS 133 reduced the Company’s current federal and state incometax expense by $0.1 million.
In the year 2000, the Malaysian taxing authority converted its income tax system to a self-assessment system. The new self-assessment systemrequires Malaysian corporate taxpayers to begin making estimated tax pay-ments in year 2000 based on year 2000 estimated taxable income. Previously,Malaysian corporate taxpayers submitted tax payments following the year ofassessment. In fiscal year 1999, the semiconductor business made Malaysiantax payments based on fiscal year 1998’s taxable income. As a result of thechange in the Malaysian taxing system, the semiconductor business was notrequired to make tax payments on its fiscal year 1999 Malaysian taxableincome, and therefore has not provided a tax provision for Malaysian taxesfor fiscal year ended July 2, 1999, which would have amounted to approxi-mately $15.1 million. The Malaysian tax holiday is effective for Intersil’s fiscalyear ended July 2, 1999 only, and does not impact the six weeks endedAugust 13, 1999 or the 46 weeks ended June 30, 2000. The components ofdeferred income tax assets (liabilities) are as follows (in thousands):
July 2, 1999 June 30, 2000 December 29, 2000
Current Non-Current Current Non-Current Current Non-Current
Receivables $ — $ — $ 239 $ — $ 246 $ —Inventory — — 8,664 — 9,689 —Fixed Assets — — — (21,590) — (23,592)Intangibles — — — (14,363) — (13,014)Accrued Expenses — — 18,582 — 19,145 —NOL Carryforward — — — 13,961 — 6,000Depreciation — (7,022) — — — —All other — net 3,476 — (1,717) — (1,324) (5,026)
$3,476 $(7,022) $25,768 $(21,992) $27,756 $(35,632)

41 • AR 2000
N OT E S TO C O N S O LI DAT E D F I N A N C I A L STAT E M E N TSContinued
Intersil Holding Corporation
A reconciliation of the statutory United States income tax rate to theCompany’s effective tax rate follows:
Predecessor Successor
Fiscal Year Ended Fiscal Year Ended Six Weeks Ended 46 Weeks Ended 26 Weeks EndedJuly 3, 1998 July 2, 1999 August 13, 1999 June 30, 2000 December 29, 2000
Statutory U.S. incometax rate 35.0% 35.0% 35.0% 35.0% 35.0%
State taxes 2.3 (3.1) 1.1 1.1 5.2International income 5.2 (61.9) (29.7) 7.6 2.7Tax benefit related to
export sales — — — — (1.3)Research credits (2.9) (2.7) 2.2 0.8 (4.4)In-process research
and development — — — (16.5) 26.2Subpart F — — — (7.6) 0.6Goodwill amortization 3.5 4.0 (4.9) (1.2) 11.6Effect of sales of Malaysian
operations — — — (18.0) —Valuation allowance — — — — 1.0Other items 0.4 0.5 (0.5) (0.5) 2.8
Effective income tax rate 43.5% (28.2)% 3.2% 0.7% 79.4%
United States income taxes have not been provided on undistributed earn-ings of international subsidiaries because of Intersil Holding’s intention toreinvest these earnings.
Pretax income (loss) of international subsidiaries was $10.2 million in fiscalyear 1998, $41.9 million in fiscal year 1999, $(1.6) million for the six weeksended August 13, 1999, $21.6 million for the 46 weeks ended June 30, 2000
and $0.4 million for the 26 weeks ended December 29, 2000.
Income taxes paid were $14.8 million in fiscal year 1998, $3.4 million infiscal year 1999, $0.2 million for the six weeks ended August 13, 1999,
$0.6 million for the 46 weeks ended June 30, 2000 and $4.0 million for the26 weeks ended December 29, 2000.
For tax purposes, the Company, at December 29, 2000, has federal and statenet operating loss carryforwards of approximately $15.6 million resulting in a deferred tax asset of $6.0 million. These net operating loss carryforwardsbegin to expire for federal and state purposes in 2016 and 2001, respectively.The Company has foreign net operating loss carryforwards, as of December29, 2000, of approximately $5.2 million resulting in a deferred tax asset of$1.8 million. The Company has recorded a valuation allowance of approxi-mately $1.8 million related to foreign net operating loss carryforwards thatmay not be utilized.
The net change in total valuation allowance for the 26 weeks endedDecember 29, 2000 was $0.3 million and relates to the Company’s expecta-tions regarding utilization of the foreign net operating loss carryforwards.
The federal and state net operating loss and tax credit carryforwards couldbe subject to limitation if, within any three year period prior to the expira-tion of the applicable carryforward period, there is a greater than 50%change in ownership of the Company.
NOTE M — GEOGRAPHIC INFORMATION
Intersil Holding operates exclusively in the semiconductor industry.Substantially all revenues result from the sale of semiconductor products.All intercompany revenues and balances have been eliminated. A summaryof the operations by geographic area is summarized below (in thousands):
Predecessor Successor
Fiscal Year Ended Fiscal Year Ended Six Weeks Ended 46 Weeks Ended 26 Weeks EndedJuly 3, 1998 July 2, 1999 August 13, 1999 June 30, 2000 December 29, 2000
United States OperationsNet sales $563,180 $519,555 $ 54,664 $574,867 $407,799Long-lived assets 386,333 371,448 366,386 333,668 485,357
InternationalNet sales 13,656 13,163 2,672 21,982 27,653Long-lived assets 122,397 121,330 118,277 112,487 103,312
Export sales included in U.S. operations were $258.4 million in fiscal year1998, $254.8 million in fiscal year 1999, $30.4 million for the six weeksended August 13, 1999, $340.3 million for the 46 weeks ended June 30, 2000
and $227.9 million for the 26 weeks ended December 29, 2000.
NOTE N — FINANCIAL INSTRUMENTS
At July 2, 1999, June 30, 2000 and December 29, 2000, the Company’s financialinstruments included cash and cash equivalents, investments, receivables,accounts payable, borrowings and forward foreign currency exchange contracts. The carrying values of cash and cash equivalents, receivables,accounts payable and short-term debt approximates fair value due to theshort-term maturities of these assets and liabilities. Investments, includedin other assets on the consolidated balance sheets, are comprised of lessthan 20% equity interest in companies. The investments are accounted forusing the cost method, which approximates fair value, and were $28.8 millionat June 30, 2000 and December 29, 2000. The fair value of other financialinstruments is based on quoted market prices or pricing models using prevailingfinancial market information at the date of measurement.
The Company continually monitors its positions with, and the credit quality of,the financial institutions that are counterparties to its financial instruments,and does not anticipate nonperformance by the counterparties. The Companywould not realize a material loss as of December 29, 2000 in the event ofnonperformance by any one counterparty. The Company enters into transac-tions only with financial institution counterparties that have a long-termdebt rating of no less than AA by Standard & Poor’s or Aa by Moody’s. Forshort-term debt (a maturity date less that 365 days) the issuer must haveno less than an A1 Standard & Poor’s and a P1 Moody’s credit rating. Inaddition, the Company limits the amount of investment credit exposure withany one institution. At December 29, 2000, the Company did not require andwas not required to collateralize any of its financial instrument obligations.
The Company’s trade receivables and investments do not represent a signifi-cant concentration of credit risk at December 29, 2000, due to the widevariety of customers and markets into which the Company’s products aresold, their dispersion across many geographic areas, and the diversification

INTERSIL • 42
N OT E S TO C O N S O LI DAT E D F I N A N C I A L STAT E M E N TSContinued
Intersil Holding Corporation
of the Company’s portfolio among instruments and issuers. Credit limits,ongoing evaluation and trade receivable monitoring procedures are utilizedto minimize the risk of credit loss. Expected losses are provided for currentlyand actual losses have been within management’s expectations.
Intersil issues letters of credit during the ordinary course of businessthrough major financial institutions as required by certain vendor contracts.Intersil has outstanding letters of credit totaling $2.7 million and $8.1 millionat June 30, 2000 and December 29, 2000, respectively.
Intersil Holding markets its products for sale to customers, including distribu-tors, primarily in the United States, Europe and Asia/Pacific. Credit isextended based on an evaluation of the customer’s financial condition andcollateral is generally not required. Intersil Holding maintains an allowancefor losses based upon the expected collectibility of all accounts receivable.Intersil Holding believes it is adequately reserved with regard to receivablesfrom its domestic and international customers.
In August 1999, Intersil Holding began to use foreign exchange contracts tohedge anticipated foreign cash flow commitments up to six months. Total netgains on foreign exchange contracts were $3.2 million and $1.9 million for the46 weeks and 26 weeks ended June 30, 2000 and December 29, 2000, respec-tively. Realized gains and losses from hedges are classified in the statementof operations consistent with the accounting treatment of the items beinghedged. Open foreign exchange contracts were $30.9 million at June 30, 2000
and $29.0 million at December 29, 2000, all of which were used to hedgeanticipated foreign cash flow commitments. For the year ended June 30, 2000,Intersil purchased and sold $87.4 million of foreign exchange forward con-tracts and for the 26 weeks ended December 29, 2000, Intersil purchased and sold $34.4 million of foreign exchange forward contracts.
Prior to August 1999, Intersil Holding used foreign exchange contracts andoptions to hedge intercompany accounts and off-balance-sheet foreign cur-rency commitments. Specifically, these foreign exchange contracts offset foreign currency denominated inventory and purchase commitments fromsuppliers, accounts receivable from future committed sales to customers andfirm committed operating expenses. Foreign currency financial instrumentswere used to reduce the risks that arise from doing business in internationalmarkets. Such contracts generally had a term of one year or less. At July 2,1999, open foreign exchange contracts were $22.0 million, all of which wereto hedge off-balance-sheet commitments. Additionally, for the year endedJuly 2, 1999, the semiconductor business purchased and sold $120.7 millionof foreign exchange forward contracts.
Deferred gains and losses were included on a net basis in the ConsolidatedBalance Sheet as other assets and are recorded in operations as part of theunderlying transaction when recognized. At July 2, 1999, Intersil Holding haddeferred foreign exchange contract losses on future commitments of approxi-mately $28.6 million.
Total open foreign exchange contracts and options at July 2, 1999, June 30,2000 and December 29, 2000 are described in the table below:
July 2, 1999
Commitments to Buy Foreign Currencies
Contract Amount(In thousands)Deferred Maturities
Currency Foreign Currency U.S. Gains (in months)
Malaysian Ringgit 80,589 $19,000 $2,208 1 – 2
Commitments to Sell Foreign Currencies
Contract Amount(In thousands)Deferred Maturities
Currency Foreign Currency U.S. Gains (in months)
French Franc 10,900 $1,857 $138 1 – 2British Pound 691 1,094 2 1
June 30, 2000
Options to Sell Foreign Currencies
Contract Amount(In thousands)Maturities
Currency Foreign Currency U.S. (in months)
Euro 3,000 $2,883 5 – 6
Commitments to Sell Foreign Currencies
Contract Amount(In thousands)Maturities
Currency Foreign Currency U.S. (in months)
Euro 16,500 $15,697 1 – 6British Pound 2,300 3,572 1 – 6Japanese Yen 1,190,000 11,655 1 – 7
December 29, 2000
Commitments to Sell Foreign Currencies
Contract Amount(In thousands)Maturities
Currency Foreign Currency U.S. (in months)
Euro 21,250 $18,797 1 – 6British Pound 350 532 1Japanese Yen 1,020,000 9,655 1 – 6
NOTE O — EMPLOYEE BENEFIT PLANS
Equity Compensation Plan
On November 5, 1999, Intersil Holding adopted the 1999 Equity CompensationPlan (the “Plan”) which became effective on August 13, 1999 for salariedofficers and key employees. The Plan authorized the grant of options for up to7.5 million shares of Intersil Holding Class A Common Stock and can include(i) options intended to constitute incentive stock options under the InternalRevenue Code, (ii) non-qualified stock options, (iii) restricted stock, (iv) stockappreciation rights, and (v) phantom share awards. The exercise price ofeach option granted under the Plan shall be determined by a committee ofthe Board of Directors (the “Board”). The maximum term of any option shallbe 10 years from the date of grant for incentive stock options and 10 yearsand one day from the date of grant for non-qualified stock options. Optionsgranted under the Plan are exercisable at the determination of the Boardcurrently vesting ratably over approximately four to five years. Employees

43 • AR 2000
N OT E S TO C O N S O LI DAT E D F I N A N C I A L STAT E M E N TSContinued
Intersil Holding Corporation
receiving options under the Plan may not receive in any one year periodoptions to purchase more than 666,667 shares of common stock. TheCompany accounts for the Plan in accordance with Accounting PrinciplesBoard Opinion No. 25, “Accounting for Stock Issued to Employees.” As such,compensation expense is recorded on the date of the grant only if the currentmarket price of the underlying stock exceeds the exercise price. During the 46 weeks ended June 30, 2000 and the 26 weeks ended December 29, 2000,the Company recorded no deferred compensation. Had compensation cost for the Company’s stock option plan been determined consistent with SFAS
Statement No. 123, the Company would have reported a net loss of $43.7
million for the 46 weeks ended June 30, 2000 and net income of $4.2 million for the 26 weeks ended December 29, 2000. The impact to basic and dilutedincome (loss) per share would have been $(0.01) and $(0.03) for the 46 weeksended June 30, 2000 and the 26 weeks ended December 29, 2000, respectively.
The Company estimates the fair value of each option as of the date of grantusing the Black-Sholes pricing model with the following weighted averageassumptions:
June 30, 2000 December 29, 2000 ˜
Expected volatility 0.5 0.877Dividend yield — —Risk-free interest rate 6.25% 5.47– 6.20%Expected life, in years 7 7
A summary of the status of the Company’s stock option plan as of andchanges during the 46 weeks ended June 30, 2000 and 26 weeks endedDecember 29, 2000 are presented in the tables below:
June 30, 2000 December 29, 2000
Weighted WeightedShares Average Shares Average
(in thousands) Exercise Price (in thousands) Exercise Price
Outstanding at beginning of period — $ — 2,955 $15.76
Granted 3,177 15.41 1,325 48.12 Exercised (194) 10.21 (66) 2.25Canceled (28) 15.20 (78) 25.56
Outstanding at end of period 2,955 $15.76 4,136 $25.72
Exercisable at end of period 191 $ 2.89 162 $ 3.01
Weighted average fair value of options granted $ 5.07 $24.16
Information with respect to stock options outstanding and stock optionsexercisable at June 30, 2000 and December 29, 2000, is as follows:
June 30, 2000WeightedAverage
Number Remaining Weighted Number WeightedOutstanding Contractual Average Exercisable Average
(in thousands) Life Exercise Price (in thousands) Exercise Price
$ 2.25 1,422 9.19 $ 2.25 155 $2.25$ 5.63 36 9.19 $ 5.63 36 $5.63$25.00 1,156 9.65 $25.00 — —$28.50–$42.13 208 9.89 $36.62 — —$42.94–$58.50 133 9.89 $47.40 — —
December 29, 2000WeightedAverage
Number Remaining Weighted Number WeightedOutstanding Contractual Average Exercisable Average
(in thousands) Life Exercise Price (in thousands) Exercise Price
$ 2.25 1,392 8.70 $ 2.25 126 $2.25$ 5.63 36 8.62 $ 5.63 36 $5.63$25.00-$35.88 1,118 9.16 $25.11 — —$37.56-$55.13 1,552 9.68 $46.85 — —$57.31-$63.06 38 9.55 $58.33 — —
Employee Stock Purchase Plan
In February 2000, Intersil Holding adopted the Employee Stock Purchase Plan (“ESPP”) whereby eligible employees can purchase shares of IntersilHolding’s common stock. Intersil Holding has reserved 1,333,334 shares ofcommon stock for issuance under the ESPP. The ESPP permits employees topurchase common stock through payroll deductions, which may not exceed10% of an employees compensation, at a price not less than 85% of themarket value of the stock on specified dates. In no event, may any participantpurchase more than $25,000 worth of shares in any calendar year and nomore than 16,667 shares may be purchased by an employee on any purchasedate. Unless sooner terminated by the Board, the ESPP shall terminate uponthe earliest of (1) February 28, 2010, (2) the date on which all shares avail-able for issuance under the ESPP shall have been sold pursuant to purchaserights exercised under the ESPP, or (3) the date on which all purchase rightsare exercised in connection with a Corporate Transaction (as defined in theESPP). No shares have been issued as of June 30, 2000. As of December 29,2000, approximately 169,000 shares have been issued under the ESPP.
NOTE P — ADOPTION OF FINANCIAL ACCOUNTING STANDARD NO. 133
Effective July 1, 2000, the Company adopted Financial Accounting StandardNo. 133 (FAS 133), “Accounting for Derivative Instruments and HedgingActivities,” as amended, which requires that all derivative instruments bereported on the consolidated balance sheets at fair value and establishes a criterion for designation and effectiveness of hedging relationships. Inaccordance with the transition provisions of FAS 133, the Company recorded a cumulative-effect-type adjustment, net of tax, of $(0.2) million to recognizethe fair value of the derivatives. The derivatives were also recognized on the con-solidated balance sheet at their fair value of $(0.4) million on December 29, 2000.
NOTE Q — RECENT ACCOUNTING PRONOUNCEMENTS
In December 1999, the Securities and Exchange Commission (“SEC”) issuedStaff Accounting Bulletin (“SAB”) No. 101, “Revenue Recognition in FinancialStatements” which was required to be implemented no later than the fourthquarter of fiscal years beginning after December 31, 1999, and provides guidance on the recognition, presentation and disclosures of revenue infinancial statements filed with the SEC. SAB No. 101 outlines the basic criteria that must be met to recognize revenue and provides guidance fordisclosures related to revenue recognition policies. The implementation ofSAB No. 101 did not have a material effect on the Company’s financial positionor results of operations.

INTERSIL • 44
N OT E S TO C O N S O LI DAT E D F I N A N C I A L STAT E M E N TSContinued
Intersil Holding Corporation
In April 2000, the Financial Accounting Standards Board (“FASB”) issuedFASB Interpretation No. 44, “Accounting for Certain Transactions InvolvingStock Compensation”, an Interpretation of Accounting Policy Bulletin OpinionNo. 25. Among other issues, that interpretation clarifies the definition ofemployees for purposes of applying Opinion No. 25, the criteria for determin-ing whether a plan qualifies as a non-compensatory plan, the accountingconsequence of various modifications to the terms of a previously fixed stockoption or award and the accounting for an exchange of stock compensationawards in a business combination. The implementation of this interpretationdid not have a material impact on the Company’s financial position orresults of operations.
NOTE R — ACQUISITIONS
On May 29, 2000, Intersil Holding acquired 100% of the outstanding capitalstock of Bilthoven, The Netherlands-based No Wires Needed B.V. (“NWN”).Consideration for the acquisition of NWN was 3.35 million shares of IntersilHolding Class A Common Stock valued at $111.3 million at the date of closing. The NWN acquisition has been accounted for by the purchase methodof accounting and, accordingly, the results of operations of NWN have beenincluded in the accompanying consolidated financial statements since theacquisition date. The purchase price exceeded the fair value of the nettangible assets by approximately $109.0 million. NWN had completed all in-process research and development programs prior to its acquisition.Therefore, none of the purchase price in excess of the fair value of the nettangible assets was allocated to purchased in-process research and develop-ment. The purchase price in excess of fair value of net tangible assets wasallocated to goodwill, which is being amortized on a straight-line basis overseven years.
The following unaudited pro forma consolidated results of operations arepresented as if the NWN acquisition occurred on August 14, 1999 (in millions,except per share data):
46 Weeks EndedJune 30, 2000
Product sales $603.2Net loss before extraordinary item (31.7)Net loss (57.3)Net loss to common shareholders (62.7)Net loss per basic and diluted share (0.79)
The pro forma results of operations include adjustments to give affect toadditional depreciation and amortization related to the increased value ofacquired assets and identified intangibles. The unaudited pro forma infor-mation is not necessarily indicative of the results of operations that wouldhave occurred had the acquisition actually been made at the beginning ofthe period presented or the future results of the combined operations.
On October 27, 2000, Intersil Holding acquired 100% of the outstanding stockof Scottsdale, Arizona-based SiCOM, Inc. (“SiCOM”). Consideration for theacquisition of SiCOM was 3.6 million shares (which includes 0.4 millionshares issuable upon exercise of options) of Intersil Holding Class ACommon Stock valued at $162.6 million. The SiCOM acquisition has beenaccounted for by the purchase method of accounting and, accordingly, theresults of operations of SiCOM have been included in the accompanying consolidated financial statements since the acquisition date. The purchaseprice exceeded the fair market value of the net tangible assets acquired by$160.6 million. The appraisal of the acquired SiCOM business included $25.4
million of purchased in-process research and development, which was relatedto various products under development. The acquired technology had not yetreached technological feasibility and had no future alternative uses.Accordingly, it was written off at the time of acquisition. The remainingintangibles (developed technology, assembled workforce and goodwill) arebeing amortized over five to 11 years. The following unaudited pro forma consolidated results of operations are presented as if the SiCOM acquisitionoccurred on August 14,1999 and July 1, 2000 respectively (in millions, exceptper share data):
46 Weeks Ended 26 Weeks EndedJune 30, 2000 December 29, 2000
Product sales $601.7 $436.6Net income (loss) before extraordinary item (38.4) 3.9Net loss (63.9) (2.2)Net loss to common shareholders (69.3) (2.2)Net loss per basic and diluted share (0.87) (0.02)
The pro forma results of operations include adjustments to give affect toadditional depreciation and amortization related to the increased value ofacquired assets and identified intangibles. The unaudited pro forma infor-mation is not necessarily indicative of the results of operations that wouldhave occurred had the acquisition actually been made at the beginning ofthe period presented or the future results of the combined operations.
NOTE S — SALE OF INTERSIL’S KUALA LUMPUR, MALAYSIA-BASEDSEMICONDUCTOR ASSEMBLY AND TEST OPERATIONS
On June 30, 2000, Intersil Holding completed the sale of its Kuala Lumpur,Malaysia-based semiconductor assembly and test operations to ChipPAC, Inc.(“ChipPAC”) which, under a multi-year supply agreement, will supply inte-grated circuit assembly and test services to Intersil. Under the terms of thetransaction, ChipPAC acquired all of Intersil’s Kuala Lumpur assets, includ-ing a 524,000 square foot semiconductor assembly and test facility, wirelessand analog/mixed signal capabilities, product distribution center as well asthe operation’s management team and approximately 2,900 employees. Asconsideration for the sale, Intersil received approximately $52.5 million incash and $15.8 million in ChipPAC preferred convertible stock. IntersilHolding recognized a non-recurring charge of $24.8 million for the loss onsale in connection with the transaction.

45 • AR 2000
N OT E S TO C O N S O LI DAT E D F I N A N C I A L STAT E M E N TSContinued
Intersil Holding Corporation
NOTE T – TRANSITION PERIOD COMPARATIVE DATA
The following table presents certain financial information for the 26-weekperiods ended December 31, 1999 and December 29, 2000 (in thousands,except per share amounts):
26 Weeks EndedDecember 31, 1999 26 Weeks Ended
(unaudited) December 29, 2000
Net sales $292.1 $435.5
Gross margin 109.9 205.8
Income (loss) before income taxes,extraordinary item and cumulative effectof a change in accounting principle (23.6) 43.9
Income taxes 1.3 30.8
Income (loss) before extraordinary item andcumulative effect of a change inaccounting principle (24.9) 13.1
Extraordinary item — loss on extinguishmentof debt, net of tax effect — (5.9)
Income (loss) before cumulative effect of achange in accounting principle (24.9) 7.2
Cumulative effect of adoption of SFAS 133,net of tax effect — (0.2)
Net income (loss) (24.9) 7.0
Preferred dividends 3.8 —
Net income (loss) to common shareholders $ (28.7) $ 7.0
Basic and diluted income (loss)per share:
Income (loss) per share beforeextraordinary item $ (0.39) $ 0.13
Extraordinary item — (0.06)
Net income (loss) $ (0.39) $ 0.07Weighted average common
shares outstanding 66,673 105,167
NOTE U — SUBSEQUENT EVENTS (UNAUDITED)
On January 22, 2001, the Company announced that it had reached a definitive agreement to sell its Discrete Power products group to FairchildSemiconductor International for approximately $338 million in cash. Intersilanticipates a one-time gain during the quarter ending March 30, 2001 andplans to use the proceeds for complementary communications acquisitions,alliances and product development efforts.
On March 1, 2001, the Company tendered all of the $61.4 million inoutstanding 13.25% senior subordinated notes. The Company will record an extraordinary charge of approximately $19.1 million in the first quarter of 2001 related to pre-payment penalties and the write-off of the remainingdeferred financing fees.
NOTE V — QUARTERLY FINANCIAL DATA (UNAUDITED)
The following is a summary of unaudited quarterly financial information forthe periods indicated:
Quarters Ended
October 1 December 31 March 31 June 30 September 29 December 29(In millions, except per share data) 1999 1999 2000 2000 2000 2000
Net sales $134.0 $158.1 $170.9 $191.2 $218.6 $216.8Gross margin 48.3 61.7 69.4 82.6 101.3 104.5Income (loss) before
extraordinary item(a) (23.1) (1.7) 2.8 1.8 19.4 (6.5)Extraordinary item(b) — — (25.5) — (0.3) (5.6)
Net income (loss) $ (23.1) $ (1.7) $ (22.7) $ 1.8 $ 19.1 $ (12.1)
Net income (loss) tocommon shareholders $ (24.5) $ (4.2) $ (24.2) $ 1.8 $ 19.1 $ (12.1)
Per share (basic):Income (loss) beforeextraordinary item $ (0.37) $(0.06) $ 0.02 $ 0.02 $ 0.20 $ (0.06)Extraordinary item — — (0.34) — — (0.06)
Net income (loss) $ (0.37) $(0.06) $ (0.32) $ 0.02 $ 0.20 $ (0.12)
Per share (diluted):Income (loss) beforeextraordinary item $ (0.37) $(0.06) $ 0.02 $ 0.02 $ 0.19 $ (0.06)Extraordinary item — — (0.34) — — (0.06)
Net income (loss) $ (0.37) $(0.06) $ (0.32) $ 0.02 $ 0.19 $ (0.12)
(a) During the quarter ended October 1, 1999, the Company recorded a charge of $20.2 million for in-processresearch and development in connection with the acquisition of the semiconductor business of Harris. During thequarter ended December 29, 2000, the Company recorded a charge of $25.4 million for in-process research anddevelopment in connection with the acquisition of SiCOM, Inc.
(b) During the quarters ended March 31, 2000, September 29, 2000 and December 29, 2000, the Company recog-nized extraordinary losses (net of tax) of $25.5 million, $0.3 million and $5.6 million, respectively related to theearly extinguishment of debt.
Forward Looking Information
Certain statements in this Annual Report, other than statements of historicalfact, are forward-looking information that involves various risks and uncertainties. These can include, without limitation, statements based on current expectations involving a number of risks and uncertainties relatedto all aspects of the wireless data communications industry. These risks anduncertainties include, but are not restricted to, continued increased demandfor the Company’s products, the Company’s ability to maintain its technologi-cal leadership in the field of high speed data communications, the Company’sability to attract and maintain key employees, the enforceability of theCompany’s patents and the availability of key components. These uncertaintiesmay cause actual results to differ from information contained herein. Therecan be no assurance that such statements will prove to be accurate. Actualresults and future events could differ materially from those anticipated insuch statements. These and all subsequent written and oral forward-lookingstatements are based on the estimates and opinions of management on thedates they are made and expressly qualified in their entirety by this notice.The Company assumes no obligation to update forward-looking statementsshould circumstances or management’s estimates or opinions change.

INTERSIL • 46
I N D E P E N D E N T C E RT I F I E D P U B LI C AC C O U N TA N TS’ R E PO RT
THE BOARD OF DIRECTORSINTERSIL HOLDING CORPORATION
We have audited the accompanying consolidated balance sheet of Harris Semiconductor Business (semiconductor business) (Predecessor), which was whollyowned by Harris Corporation, as of July 2, 1999 and the related statements of operations, comprehensive income and cash flows for each of the two fiscalyears in the period ended July 2, 1999 and the six weeks ended August 13, 1999. We have also audited the accompanying consolidated balance sheets ofIntersil Holding Corporation (“Successor”) as of December 29, 2000 and June 30, 2000 and the related statements of operations, comprehensive income,shareholders’ equity and cash flows for the 26 weeks ended December 29, 2000 and the 46 weeks ended June 30, 2000. These financial statements are theresponsibility of the Company’s management. Our responsibility is to express an opinion on these financial statements based on our audits.
We conducted our audits in accordance with auditing standards generally accepted in the United States. Those standards require that we plan and performthe audit to obtain reasonable assurance about whether the financial statements are free of material misstatement. An audit also includes assessing theaccounting principles used and significant estimates made by management, as well as evaluating the overall financial statement presentation. We believethat our audits provide a reasonable basis for our opinion.
The accompanying Predecessor consolidated financial statements were prepared on the basis of presentation as described in Note A. The results of operationsare not necessarily indicative of the results of operations that would be recorded by semiconductor business on a stand-alone basis.
In our opinion, the financial statements referred to above present fairly, in all material respects, the consolidated financial position of Intersil HoldingCorporation as the Successor and Predecessor companies at December 29, 2000, June 30, 2000 and July 2, 1999 and the consolidated results of their operations and their cash flows for each of the two years in the period ended July 2, 1999 and for the six weeks, 46 weeks and 26 weeks ended August 13,1999, June 30, 2000 and December 29, 2000, respectively, on the basis described in Note A, in conformity with accounting principles generally accepted in the United States.
Jacksonville, FloridaJanuary 22, 2001
Intersil Holding Corporation

C O R PO R AT E I N FO R M AT I O N
SKATING TICKETS FOR THE KIDS ONLINE… ANALYZE DREAM FROM LAST NIGHT… WRITE MOM ABOUT PROMOTION AND MOVE TO D.C.… CHAT ROOM WITH OTHER NEW INVESTORS ABOUT STATUS OF STARTUPS…
INTERSIL OFF ICERS AND KEY CONTACTS
Glenn BoydVice President, Worldwide Sales and Marketing
Lawrence Ciaccia Vice President, General Manager, PRISM® Wireless
Julie Forbes Vice President, Human Resources
Rick Furtney Vice President, General Manager, Power Management
Daniel Heneghan Vice President, Chief Financial Officer
Karl McCalley Vice President, Information Technology
Stephen MoranVice President, General Counsel and Secretary
Keith PrettyjohnsVice President, Broadband Wireless Access
Ken SchultzVice President, Broadband Wireless Access
Larry SimsVice President, General Manager,Communications Analog
Meghan DaltonVice President, Investor Relations
David ZinsnerCorporate Controller & Treasurer
BOARD OF DIRECTORS
Gregory Williams President & Chief Executive Officer of Intersil
James Urry DirectorMr. Urry is a Vice President of Citicorp Venture Capital Ltd.
Gary Gist DirectorMr. Gist is the President and Chief ExecutiveOfficer of Palomar Technological Companies.
Robert Conn, PhD DirectorMr. Conn is the dean of the Jacobs School of Engineering at the University of California,San Diego.
Jan Peeters DirectorMr. Peeters is chairman, president and CEO of Olameter, Inc.
Robert Pokelwaldt DirectorMr. Pokelwaldt is the retired chairman and CEO of YORK International Corporation.
INVESTOR RELATIONS
Contact Intersil’s Investor Relations departmentto ask any investment related question or toreceive additional copies of this report, ourannual report on form 10-K or other financial information free of charge. Call us at1-949-341-7000. In addition, you can write to us at:Investor RelationsIntersil Corporation7585 Irvine Center Drive, Suite 100Irvine, California 92618or send an e-mail to:[email protected]
INDEPENDENT AUDITORS
Ernst & Young LLP
SHAREHOLDER INFORMATION
Our transfer agent can assist you in affecting a change of address or replacing lost stock certificates as well as a variety of other services:Equiserve Trust Company, NA150 Royall StreetCanton, MA 02021Phone: 1-781-575-3400Email: [email protected]

In ters i l Corpora t ion 7585 Irv ine Center Dr ive , Su i te 100 , I rv ine , Ca l i forn ia USA 92618
w w w. i n t e r s i l . c o m
U N L E A S H I N G T H E P O W E R O F C O N N E C T I V I T Y ™
INT
ER
SIL
CO
RP
OR
ATIO
NA
nn
ua
l Re
po
rt 2
00
0