asynchronous data transfers on large scale hpc systems
TRANSCRIPT

ASYNCHRONOUS DATA TRANSFERS ON LARGE
SCALE HPC SYSTEMS WITH EXPERIMENTS ON THECRAY XT3/XT4
BY CIPRIAN DOCAN
A thesis submitted to the
Graduate School—New Brunswick
Rutgers, The State University of New Jersey
in partial fulfillment of the requirements
for the degree of
Master of Science
Graduate Program in Electrical and Computer Engineering
Written under the direction of
Professor Manish Parashar
and approved by
New Brunswick, New Jersey
May, 2008

ABSTRACT OF THE THESIS
Asynchronous Data Transfers on Large Scale HPC Systems
with Experiments on the CRAY XT3/XT4
by CIPRIAN DOCAN
Thesis Director: Professor Manish Parashar
A key challenge faced by the emerging large scale scientific and engineering simulations
is effectively and efficiently managing the large volumes of heterogeneous data generated.
This includes offloading this data from the compute nodes at runtime, and transferring it
over to service nodes or remote clusters for online monitoring, analysis, or archiving. To be
effective, these I/O operations should not impose additional synchronization penalties on
the simulation, should have minimal impact on the computational performance, maintain
overall Quality of Service, and ensure that no data is lost.
This thesis describes the design, implementation, and operation of DART (Decoupled
Asynchronous Remote Transfers). DART is a thin software layer built on RDMA (Remote
Direct Memory Access) communication technology, and specifically the Portals RDMA
library to allow fast, low-overhead access to data from simulations running on compute
elements, and to support high-throughput low latency asynchronous I/O transfer of this
data.
DART is part of the infrastructure for an integrated simulation of fusion plasma in
a Tokamak being developed at the Center for Plasma Edge Simulation (CPES), a DoE
Office of Fusion Energy Science (OFES) Fusion Simulation Projects (FSP). A performance
evaluation on the Cray XT3/XT4 system at Oak Ridge National Laboratory demonstrates
ii

that DART can be used to offload expensive I/O operations to dedicated service nodes
allowing more efficient utilization of the compute elements.
iii

Acknowledgements
I would like to thank my thesis advisor Dr. Manish Parashar for his continuous guidance,
support and encouragements throughout the evolution of this thesis, and for the trust he
invested in my work. I would also like to thank to my friends at Rutgers, especially to
Nicu and Amalia Cornea for their invaluable support during my first and hardest year at
Rutgers.
iv

Dedication
To my parents, Georgeta and Tudorel, whose permanent encouragements and unabated
trust have helped me through every challenge I have faced. .
v
Table of Contents
Abstract . . . . . . . . . . . . . . . . . . . . . . . . . . . . . . . . . . . . . . . . . . ii
Acknowledgements . . . . . . . . . . . . . . . . . . . . . . . . . . . . . . . . . . . iv
Dedication . . . . . . . . . . . . . . . . . . . . . . . . . . . . . . . . . . . . . . . . . v
List of Figures . . . . . . . . . . . . . . . . . . . . . . . . . . . . . . . . . . . . . . viii
1. Introduction . . . . . . . . . . . . . . . . . . . . . . . . . . . . . . . . . . . . . 1
2. Background . . . . . . . . . . . . . . . . . . . . . . . . . . . . . . . . . . . . . . 3
2.1. I/O Models . . . . . . . . . . . . . . . . . . . . . . . . . . . . . . . . . . . . 3
2.2. Testbed System Description . . . . . . . . . . . . . . . . . . . . . . . . . . . 7
2.3. RDMA and Portals Library . . . . . . . . . . . . . . . . . . . . . . . . . . . 8
3. Prior Work . . . . . . . . . . . . . . . . . . . . . . . . . . . . . . . . . . . . . . 13
4. DART Design and Architecture . . . . . . . . . . . . . . . . . . . . . . . . . 16
4.1. The DART Client Layer . . . . . . . . . . . . . . . . . . . . . . . . . . . . . 17
4.2. The DART Streaming Server and Receiver . . . . . . . . . . . . . . . . . . . 19
4.3. DART API and Usage . . . . . . . . . . . . . . . . . . . . . . . . . . . . . . 21
5. DART Implementation and Operation on the Cray XT3/XT4 . . . . . 23
5.1. Compute Node Bootstrap Mechanisms . . . . . . . . . . . . . . . . . . . . . 23
5.2. Data Transfer Protocol . . . . . . . . . . . . . . . . . . . . . . . . . . . . . . 25
6. Experimental Evaluation . . . . . . . . . . . . . . . . . . . . . . . . . . . . . 28
6.1. Data Transfer Rate . . . . . . . . . . . . . . . . . . . . . . . . . . . . . . . . 28
6.2. Overhead on the Simulation . . . . . . . . . . . . . . . . . . . . . . . . . . . 29
vi

6.3. Integration with Simulation Codes . . . . . . . . . . . . . . . . . . . . . . . 32
6.3.1. Integration with GTC . . . . . . . . . . . . . . . . . . . . . . . . . . 33
6.3.2. Integration with XGC-1 . . . . . . . . . . . . . . . . . . . . . . . . . 36
7. Conclusions . . . . . . . . . . . . . . . . . . . . . . . . . . . . . . . . . . . . . . 39
References . . . . . . . . . . . . . . . . . . . . . . . . . . . . . . . . . . . . . . . . . 41
vii

List of Figures
2.1. Jaguar architecture of a Cray XT3/XT4 machine [10] . . . . . . . . . . . . 8
2.2. Node interconnect on the Cray machine [10] . . . . . . . . . . . . . . . . . . 9
2.3. Portals “get” operation [23]. . . . . . . . . . . . . . . . . . . . . . . . . . . . 10
2.4. Portals “put” operation [23]. . . . . . . . . . . . . . . . . . . . . . . . . . . . 11
2.5. Portals “acl” rules [23]. . . . . . . . . . . . . . . . . . . . . . . . . . . . . . 12
4.1. Architectural overview of DART. . . . . . . . . . . . . . . . . . . . . . . . . 16
4.2. Data flow for DART operation. . . . . . . . . . . . . . . . . . . . . . . . . . 21
5.1. DART compute node bootstrap mechanism. . . . . . . . . . . . . . . . . . . 24
5.2. Timing diagrams for the operation of DARTClient and DARTSServer. . . . 26
6.1. Data transfer rate between compute and service nodes. . . . . . . . . . . . . 29
6.2. Overhead of DART on the application for a compute phase of 2 sec. . . . . 31
6.3. Overhead of DART on the application for a compute phase of 4.38 sec. . . 32
6.4. Percentage of I/O and wait time overhead on the GTC simulation measured
at the compute nodes. . . . . . . . . . . . . . . . . . . . . . . . . . . . . . . 34
6.5. Cumulative I/O time times for the GTC simulation measured at the DART
streaming server. . . . . . . . . . . . . . . . . . . . . . . . . . . . . . . . . . 35
6.6. Throughput at the DART server using Portals (compute nodes to service
node) and TCP (service node to remote node). . . . . . . . . . . . . . . . . 35
6.7. Percentage of I/O and wait time overhead on the XGC-1 simulation measured
at the compute nodes . . . . . . . . . . . . . . . . . . . . . . . . . . . . . . 37
viii

1
Chapter 1
Introduction
The current advances in processor speed and architectures (e.g., from single to dual or quad
core processors, and most recently the cell processors), enable scientists and engineers from
different domains to cooperate and simulate complex phenomena with fine grain details
and high accuracy. However, as the computing systems grow in computational capability
and scale, efficiently utilizing these machines at full capacity and with the desired perfor-
mance becomes increasingly challenging. Furthermore, complex scientific and engineering
applications are based on live interactions and couplings across multiple and potentially
distributed computational, data, and information services. For example, current fusion
simulation efforts are exploring coupled models and codes that simultaneously simulate
separate application processes and run on different resources at supercomputing centers.
These codes will need to interact, at runtime, with each other, and with additional services
(e.g., online data monitoring and analysis, data archiving, etc.).
These scientific simulations generate large amounts of data and thus require a robust
substrate for data management and streaming between interacting components. In case of
fusion simulations, for instance, large volumes and heterogeneous types of data generated
have to be continuously streamed from dedicated compute nodes to specialized I/O nodes,
and from there to local data analysis or storage machines or to remote clusters running
coupled simulation components. A key challenge that such a substrate must address is
transferring the large amounts of data generated by these simulations from the compute
nodes to the service node (i.e., the I/O nodes) at runtime, and over to remote clusters for
code coupling, online monitoring and analysis, and data archiving. To be viable and useful,
the substrate has to comply with the simulation constraints for data transfers, i.e., (1) it
should have minimum impact on the execution of the simulation in terms of performance

2
and synchronization requirements, (2) it should satisfy stringent application/user space,
memory, time and quality of service requirements, and (3) it should ensure that no data
is lost. On most large scale parallel machines, a small number of service nodes usually
service a much larger number of compute nodes, and offload their costly I/O operations.
To meet the simulation requirements, the I/O substrate should be able to asynchronously
transfer data from compute nodes to service node with minimal delay and overheads on the
simulation. Technologies such as RDMA and the Portals library allow fast memory access
into the address space of an application without interrupting the computational process,
and provide a mechanism that can support these I/O requirements.
This work describes the DART (Decoupled Asynchronous Remote Transfers) system
that aims to address these challenge and constraints. The objective of DART is to build
a thin communication layer on top of Portals library that allows fast, low-overhead access
to data at the compute elements and supports high-throughput low latency asynchronous
I/O transfers. DART also provides a simple API that corresponds to traditional file I/O
operations used in the simulation codes. This work also describes the design, implementa-
tion and operation of DART, and presents a performance evaluation on the Cray XT3/XT4
system at Oak Ridge National Laboratory. The evaluations demonstrate how DART can be
used to offload expensive I/O operations to dedicated service nodes allowing more efficient
utilization of compute elements. The performance evaluation also presents the results of
using DART with two particle-in-cell FSP simulation codes GTC and XGC-1.
The rest of the thesis is organized as follows. Chapter 2 presents the background on
existing I/O models, describes our testbed, and presents the generic RDMA communication
technology and the Portals implementation of RDMA. Chapter 3 presents an overview of the
related work. Chapter 4 presents the architecture of DART and describes its components.
Chapter 5 discusses the implementation and operation of DART on a CRAY XT3/XT4
machine. Chapter 6 describes our experimental evaluation of DART and discusses the
results, and chapter 7 concludes the thesis and presents directions for future work.

3
Chapter 2
Background
This chapter starts by categorizing and describing the existing I/O programming paradigmes,
and emphasizes on the model that we used in this thesis. Next, it describes our testbed
and its I/O communication features, i.e., support for RDMA data transfers. Following,
we describe the Portals library that is an implementation for the RDMA communication
framework.
2.1 I/O Models
We can categorize existing I/O programming practices or I/O models based on synchro-
nous/asynchronous and blocking/non-blocking characteristics [13] into synchronous block-
ing, synchronous non-blocking, asynchronous blocking and asynchronous non-blocking. Each
model has its own advantages and is suited for applications with a specific I/O pattern.
Synchronous blocking. Applications that implement this model have to synchronize
send requests with receive requests. Thus, a receiver blocks until data from a send request
becomes available or a sender blocks until data is consumed by a receive request.
To measure the I/O time for this model, let us consider the following piece of code:
1: timer start();
2: write( fd, buffer, size );
3: timer stop();
4: /* take the time difference */
When the application process makes the write call on line 2, the system call traps in
kernel mode; the kernel copies data from application address space (or user space) to kernel
space, and then tries to service the request. If, at the time of the call, a receiving process
cannot transfer the available data entirely, the kernel blocks the application process on the

4
completion of the I/O transfer, suspends and moves the process to a waiting queue, and
schedules another process on the CPU. The application process remains suspended during
the data transfer, and upon completion of the transfer, the kernel moves the application
process from the waiting queue to the running queue and the process becomes eligible to
be scheduled again on the CPU. Depending on the number of processes on the system, the
application process can sit for a while in the running queue, until it is selected to run. When
the process gets control back on the CPU, it continues execution with timer stop() on
line 3.
As we measure the total I/O time, we also account for some extra times that were not
spent on actual I/O, e.g., time for the context switch (from user mode to kernel mode),
time to copy data from user to kernel space, time to schedule another process to run, the
running time of the other processes, and the time for a context switch back to our application
process. In this case, the measured total I/O time is larger than the actual transfer time.
This I/O model is suited for applications where the sender and the receiver have to
synchronize, since neither of them can proceed until the data exchange is completed. The
negative side of this model is that it wastes valuable CPU cycles of the sender. While the
sender blocks and waits for the I/O operation to complete, it could complete additional
useful application computations. Due to the extra times required by this model, it is not
well suited for applications that require a high throughput.
The Synchronous Non-blocking model is similar to the previous synchronous block-
ing one in that the sender and the receiver still have to synchronize, and the sender has to
wait for the receiver to consume the data. Unlike the above model, in this case the sender
does not block in the send call, which means that a send call will return immediately, re-
gardless to whether the transfer is complete or not. This model requires the programmer
to ensure the correctness of the transfer (e.g., ensure that a transfer completes). The user
can determine the completeness of a transfer by checking on the return code of the send
call; an error value of EAGAIN indicates the transfer is still in progress.
To measure the I/O time of this model, let us consider the following piece of code:
1: timer start();
2: do {

5
3: rc = write( fd, buffer, size );
4: if( rc > 0 ) {
5: size -= rc;
6: buffer += rc;
7: }
8: else if( rc < 0 && errno != EAGAIN )
9: break;
10: } while( size > 0 );
11: timer stop();
12: /* take the time difference */
When the application process makes the first write call (line 3), it traps into the kernel
mode; the kernel copies the data from user space to kernel space and tries to service the
request. Assuming the file descriptor fd supports non blocking calls, the write system call
returns immediately and does not block the process. If a receiving process is not able to
get the incoming data, the system call returns an error value of EAGAIN and the transfer is
restarted. Moreover, if a receiving process cannot transfer all of the data at once, the system
call returns with the partial value of the data transferred, and the transfer is restarted with
the remaining data.
This I/O model, also accounts for some extra times when measuring the I/O time, e.g.,
time for a context switch from user to kernel mode, time to copy data from user to kernel
space, time to restart the transfers, and so the I/O time is larger then the actual transfer
time. In the worst case, the measured I/O time can equal the I/O time of a synchronous
blocking I/O model. The improvement of the non-blocking model relative to the blocking
I/O model is because the system call returns immediately and thus it does not block the
application process. On a return from the system call, with a non-completion or partial
completion code, the user may decide to do some more computation in the application and
try the I/O operation later on.
This I/O model is suited for applications where the application process is required not to
block (e.g., a server which handles multiple client connections simultaneous). The advantage
6
of the non-blocking feature can be better exploited by the application programmer, but it
introduces additional complexity to the code. Restarting the I/O operation adds penalties
to the I/O performance and thus it degrades the overall throughput. This model is still
inefficient for applications that require a high throughput.
Asynchronous blocking. Applications that implement this I/O model do not have
to block in the I/O send call, but they can block in the data availability notification call
select(). This model allows applications to exchange data in a decoupled way: the sender
and the receiver are no longer required to be tightly synchronized. A sender application
can check the communication channel using the select() system call, and it can send data
only when the channel is available. In this way the send call does not block the application.
Let us consider the following example to analyze the I/O time of this model.
1: rc = select( nfd, NULL, wfds, NULL, &timeout );
2: if( rc > 0 ) {
3: timer start();
4: write( fd, buffer, size );
5: timer stop();
6: /* take the time difference */
7: }
The select() system call traps in the kernel mode and blocks the application for a
maximum specified value of timeout seconds (or milliseconds). The select() system
call can monitor multiple file descriptors for I/O activity for both sending and receiving
operations. When the kernel detects an event on any of the file descriptors monitored
through the select() call, it takes the application process out of the waiting queue and
adds it to the running queue, and selects it later on for the CPU control. When the process
resumes, it continues with the write call on line 4, and at this moment the process knows
that the communication channel is available for sending data and that the I/O call will not
block. For this I/O model, the measurement of the I/O time is more accurate than for
previous models, because the I/O call does not block.
The asynchronous blocking model is the most flexible model so far, because the select()
call can monitor multiple descriptors and can control the total time to block through the

7
timeout parameter. A user can transform this model into a non-blocking one by setting the
timeout parameter to a small value. This way, the model becomes a polling mechanism and
allows the user to schedule other application computations before retrying the I/O call, and
to use its CPU more effectively. This flexibility has the cost of additional code complexity
and the overhead of retrying the I/O operation. The negative side of this model is that it
is not very efficient and it is not suited for high performance applications.
Asynchronous Non-blocking. This I/O model allows two applications to exchange
data in a decoupled way (e.g., sender and receiver don’t have to be synchronized), and al-
lows an application to make the I/O calls without blocking the application process. When
an application process makes an asynchronous I/O call, the asynchronous layer copies in-
formations about the transfer (e.g., a reference to the memory region and the size of the
region), then the call returns, and the application can continue its other computations. The
data transfer should not impact the application run, and should proceed in parallel with
the application. Depending on the implementation of the asynchronous layer, the system
usually requires that the application does not modify the content of the data transfer buffer
until the completion of the operation. The advantage of this model is that it tries to over-
lap data transfers with application computations for a better utilization of the CPU and a
better transfer throughput. Moreover, the performance of this model could be even more
significant if the system has hardware support so that the network interface card (NIC)
can directly access an application memory address space without involving the CPU in the
process (e.g., direct memory access).
2.2 Testbed System Description
The DART system described in this work was developed and tested on the Jaguar and Ewok
machines at Oak Ridge National Labs (ORNL). Jaguar [18] is a CRAY XT3/XT4 parallel
machine with more than 11,000 physical nodes. The nodes are logically divided into two
partitions (Figure 2.1): a compute partition and a service partition. The compute partition
has 11,500 nodes (compute nodes). Each compute node is a dual-core AMD Opteron 2.6GHz
with 4GB memory, and runs the UNICOS/lc Operating System (OS) with the catamount
micro-kernel [11]. The service partition has ∼ 200 nodes (service nodes). Each service node

8
is a single-core AMD Opteron 2.4GHz with 4GB memory, and runs the GNU/Linux OS
with a Linux kernel.
Figure 2.1: Jaguar architecture of a Cray XT3/XT4 machine [10]
The compute and service nodes are located on the same physical machine and the inter-
connect has a 3-D Torus topology using the Cray Seastar router and a very fast proprietary
interconnection bus called the HyperTransport path (Figure 2.2). HyperTransport is a dedi-
cated interconnection bus that is able to deliver 6.4GB/s transfer bandwidth. The compute
nodes are dedicated nodes (i.e., non-shared) that run user batch jobs, whereas the service
nodes are shared nodes that run system services (e.g., ssh, apache, etc.).
Service nodes on Jaguar machine connect to the Ewok cluster through a 5GB/s aggre-
gated link. Ewok is a cluster with 128 nodes, where each node is a 2 Intel Xeon 3.4GHz
CPU with 4GB memory. The nodes are interconnected by an Infiniband switch through
1GB/s links. Ewok is used to run analysis codes and serves as a sink for data generated by
applications running on Jaguar.
On the Jaguar machine, the nodes in the system communicate through the HyperTrans-
port path using the RDMA communication model.
2.3 RDMA and Portals Library
Remote Direct Memory Access. RDMA is a communication paradigm that enables
a process to directly access another process’s memory address space, independent of the
location of the other process (e.g., the other process can be on the same node, or can be on
a node on a remote cluster).

9
Figure 2.2: Node interconnect on the Cray machine [10]
RDMA supports process to process communication models with zero-copy, and OS and
application bypass. The zero-copy feature ensures that two nodes can exchange blocks of
data in an I/O operation directly from the user memory address space, as opposed to first
copying the data to the OS (kernel) memory space, and then exchange it. With the zero-
copy feature, an application can avoid the overhead of making an extra copy of the data it
sends. The OS and application bypass features ensure that an RDMA data transfer does
not involve or interrupt the OS or the application in any phase of the transfer. However,
this communication model does not directly provide a communication protocol, and the
user has to provide, for example, other mechanisms to check for the completion of an I/O
operation. The RDMA communication model restricts the application from accessing and
modifying the memory region involved in the transfer until the completion of the transfer.
A machine provides the RDMA features/enhancements through a dedicated Network
Interface Card (NIC) that can directly access the address space of a process without help
from the operating system. The Jaguar machine exposes RDMA features to the user space
through the Portals library.
Portals Library. The Portals library [3, 23] implements the RDMA communication
model and provides a set of primitives that defines a communication protocol for RDMA
data transfers. The provided primitives are one-side transfer operations. In the Portals

10
Figure 2.3: Portals “get” operation [23].
library, the two processes involved in a data transfer, i.e., the sender and the receiver are
identified as the source and the target. Here, the source is the only active end envolved in
a data transfer operation.
The Portals library supports two types of transfer operations, get shown in (Figure 2.3)
and put shown in (Figure 2.4). The get operation extracts a block of data from a remote
process memory, and the put operation injects a block of data into a remote process memory.
In the get operation, the source initializes the data transfer, but it acts as a receiver for the
transfer, while in the put operation, the source initializes the data transfer, but it acts as a
sender for the transfer.
To support memory to memory data transfers between remote processes, the Portals
library has to expose blocks of memory (memory buffers) from the address space of a
process to the NIC, on the source as well as on the target. It exposes these blocks of
memory through Memory Descriptors (MDs). These are Portals data types that contain
internal bookkeeping information such as buffer start memory address and length, current
transfer offsets, etc.
Portals also provide Access Control List (ACL) see (Figure 2.5) support for the MDs it

11
Figure 2.4: Portals “put” operation [23].
exposes. This way an application can control which processes and nodes have access to its
memory address space. Each MD has to be attached to a Match Entry (ME) in a match
list and each match list has to be associated with an entry in the Portals table. An entry
in the Portals table can have associated multiple match lists linked together, and Portals
checks each list sequentially to find a match for an ACL rule. Multiple applications can use
the same Portals table entry and the same match list as long as they have distinct ACL
matching rules.
Two remote processes can communicate through RDMA protocol provided that they
know each other’s “Portals addresses” and that the target has an ACL rule that matches
the credential of the source. The access for a data transfer is checked only at the target
side. The target and the source can use multiple MDs for communication, but each MD
needs an unique ACL rule access key, so that Portals can identify the exact MD for a data
transfer.
Portals also provides primitives to check the beginning or the completion of a data
transfer operation, which are called events. An event in Portals is a data structure that
defines a small log of an RDMA data transfer (e.g., source and target Portals addresses,

12
Figure 2.5: Portals “acl” rules [23].
number of bytes transfered, source or target offset of the transfer, etc.).
For each MD involved in a transfer, Portals generates events on both the source and the
target. A MD has an Event Queue (EQ) associated with it, and each event generated for
the MD is linked to the EQ.
With the availability of events, the Portals library is well suited to build an implemen-
tation of asynchronous non-blocking API semantics, that allows an application to send a
block of data to a remote process without blocking or interrupting the application during
the transfer.

13
Chapter 3
Prior Work
Many research efforts address the problem of enhancing the I/O performance for a class of
applications in different ways. We can classify these approaches in two categories (1) system
level approaches, and (2) application level approaches. The system level approach extends
the services of the operating system, customizes them for the I/O needs of a specific class
of applications, and preserves the I/O abstractions provided. For example, parallel and
distributed network file systems extend the virtual file system (VFS) layer of the operating
system, and provide the same file abstraction to an application. This approach has the
great advantage of preserving binary compatibility for older applications. The application
level approach consists in various transfer buffering and scheduling techniques, as well as
collective collaboration between nodes of a parallel application. This approach is fine tuned
for specific applications. For example, a database management system allocates and man-
ages the storage system by itself for best performance, and bypasses the operating system
interface.
Projects such as Lustre [9], GPFS [12], or PVFS [8] implement parallel filesystems. A
parallel file system has a metadata server that keeps management information about a file,
i.e., the file name, path, size, attributes or owner, and multiple backend storage servers
that store the content of the file. This file system enhances the I/O performance of an
applications at two levels. First, it separates management information from file content,
and thus reduces the concurrency for file content access. Second, it stripes a file content
across multiple storage servers and allows parallel accesses to the file content (e.g., both
reads and writes). Accesses to a file are mediated by the metadata server, but an application
transfers the content of a file directly and to and from a storage server, independent of the
metadata server.

14
The MPI-IO and ROMIO [26] projects implement an application level solution, and they
mainly target parallel applications. These systems provide a customized I/O interface that
allows the processes of an application to collectively collaborate and write a file in parallel.
The parallel file I/O interface allows an application to define relations such as 1-to-1, or
1-to-many, between compute nodes and the associated files produced, i.e., each compute
node can write its own output file, or multiple compute node can cumulatively write to a
single output file. This approach leverages the I/O performance of an application because
it reduces the concurrency at the metadata server on a parallel file system.
The IO-Lite [22] and Client-Side File Caching [15] (CSFS) projects implement applica-
tion level solution based on customized buffering techniques for specific applications. Thus,
IO-Lite unifies the system caching and buffering mechanism by providing a single physical
copy of the data which is shared between different system components, e.g., file system,
networking system, interprocess communication system, etc. IO-Light improves an appli-
cation I/O performance by avoiding multiple data copies. The CSFS project is specially
tuned for applications that use the MPI-IO communication substrate. CSFS buffers and
schedules the I/O operations at client side and bypasses the more general file system cache.
The Direct Access File System [19] (DAFS) project also implements a caching technique in
user space and bypasses the file system cache. It it optimized for zero-copy data transfers
and is implemented on systems with RDMA support.
The LIVE Data Workspace project [1] at Georgia Tech and the underlying PBIO layer,
has simular overall goals and approach as DART. However, there are several differences in
the design, and the two systems make different tradeoffs. The focus of PBIO is on recon-
figurability and ad hoc connections of components without a priori knowledge of data re-
quirements. PBIO also supports multiple transports including Portals and Inifinband, while
DART currently is only implemented over Portals. DART, in contrast, is more lightweight
and is specifically tuned for streaming and was thus shown to be faster in the tests conducted
at the Oak Ridge National Laboratory.
PDIO [24] is a related effort, and is specially designed to support runtime visualization of
data from parallel simulations. It tries to virtually extend the file-system of Portals-enabled
compute nodes to arbitrary destination locations. The design of PDIO is tightly coupled

15
to the requirements of its target applications.
Asynchronous I/O API [25] is a recent effort that aims to provide a simple I/O interface
capable of integrating with a variety of data transport layers, both synchronous and asyn-
chronous. The goal of the AIO API is to provide an interface that is nearly as simple as
standard Fortran I/O statements, while giving access to the power and flexibility of mature
systems like MPI-IO, HDF-5 [7], parallel netCDF [20], and standard POSIX calls as well as
more experimental systems like DART and the Georgia Tech LIVE system. Additionally,
the data is encoded in a tagged, binary format with data and grouping attributes for easier
data use without the overhead of parsing a plain text data format. The system consists of
three parts: (1) the API that was designed primarily for Fortan use, but also tested with
C, (2) an XML configuration file describing the data types, attributes, data transports, and
buffer specifications selected, and (3) the data transport layer, for example, DART.

16
Chapter 4
DART Design and Architecture
The goal of the DART system is to efficiently manage and transfer large amounts of data
from applications running on the compute nodes of a parallel system or cluster to the
service nodes or remote locations, and support remote application monitoring, data analysis,
coupling, or archiving. Figure 4.1 presents an overview of the DART system.
Figure 4.1: Architectural overview of DART.
The key objectives that DART tries to achieve include minimization of data transfer
overhead on the application, high throughput, low latency data transfers, and prevention of
data losses. To meet these requirements, DART asynchronously offloads the costly data I/O
and streaming operations from the compute nodes to service nodes; on the service nodes,
DART either saves data to local storage, or transfers it to remote locations.
DART system contains three components: a client library (DARTClient), a streaming
server (DARTSServer) and a receiving server (DARTReceiver). DARTClient is a thin soft-
ware layer on the application stack, built on the Portals library, that provides asynchronous
API semantics. It runs on the compute nodes along with the application code and provides
I/O services to the application. DARTSServer is the main component that schedules and

17
initiates the I/O operations from DARTClients. It runs independently on a service node,
extracts data from a running simulation on the compute nodes, and streams the data to
a downstream DARTReceiver. Finally, DARTReceiver runs on nodes of a remote system
(e.g., monitoring/analysis nodes, archiving nodes, nodes running a coupled simulation) and
“consumes” the data streamed by DARTSServer.
4.1 The DART Client Layer
DARTClient is a “light” layer on the application software stack that is implemented di-
rectly on top of the Portals library that provides communication primitives to the above
application layers such as the asynchronous I/O management layer (AIO) or directly to the
simulation layer (e.g., GTC or XGC). It is implemented as a static library that is linked
with the application at compile time.
DARTClient performs two main functions, (1) message signaling and coordination, and
(2) data transfers. The message signaling function serves to notify the streaming server when
the application has data available to send out, and to wait for an acknowledgment from
the streaming server when it completes a data transfer operation or processes a notification
message. For signaling and coordination, DARTClient registers a compute node with an
instance of a streaming server and announces application requests for transfer events at
runtime. During the registration phase, the DARTClient layer at the compute node and the
streaming server at a service node exchange identification and communication parameters
such as unique numerical process identifiers, Portals addresses, communication offsets, and
memory descriptors identifiers (i.e., unique keys for Portals ACL rules). For data transfers,
when the application at the compute nodes executes an I/O operation, DARTClient notifies
the streaming server that it has data ready to be sent, and sets up the parameters and
priorities for the transfer. Afterwards, it is the role of the streaming server to actually
schedule and transfer the data.
DARTClient exposes two classes of memory descriptors to the streaming server, to sup-
port asynchronous and process to process direct memory communication. The first class
is the application level memory descriptor. DARTClient creates these descriptors during

18
the registration phase and communicates their ACL keys to the streaming server. They
persist throughout the lifetime of the application. DARTClient defines two types of appli-
cation level memory descriptors – one is used to notify the streaming server of a request for
transfer, and the other is used to retrieve acknowledgments from the streaming server upon
completion of a data transfer or processing of a notification message.
The second class of memory descriptors is the stream level memory descriptors, which
DARTClient creates for each data stream opened by the application. Here the “data stream”
equals the notion of a file. There are two types of stream level memory descriptors – one is
used for transfer control messaging to store communication and signaling parameters for a
stream, and the other is used to expose to the streaming server the memory area that maps
the actual data written by the application. DARTClient creates these memory descriptors
on-the-fly when a data stream is opened by the application, and announces their ACL key
to the streaming server in a request for transfer message. These memory descriptors persist
only during the lifetime of a data stream; they are destroyed afterwards.
DARTClient layer provides asynchronous API semantics to the above application layers,
and thus enables the application to make asynchronous and non-blocking “write” calls,
and to continue its computation without blocking and waiting for the data transfer to
complete. DARTClient is built on the Portals library described previously, which is OS and
application-bypass enabled, and allows the data transfers from compute nodes to overlap
with application computations.
DARTClient uses multiple buffers to allow multiple data stream write operations to
proceed in parallel. An application running on a compute node can open multiple data
streams of different sizes sequentially (e.g., a diagnosis stream and a checkpoint stream).
The data transfer operation is asynchronous, and transfers from streams of different sizes
can overlap in time. A priority mechanism schedules smaller transfers with a higher priority
to allow them to complete in parallel with larger transfers, but without being blocked by
the larger ones, and thus multiple data streams are serviced in parallel.

19
4.2 The DART Streaming Server and Receiver
DARTSServer is the DART streaming server component that runs as a standalone appli-
cation on the service nodes. It is responsible for scheduling and asynchronously extracting
data from applications that run on the compute nodes, and streaming it to remote nodes
or to local storage. Multiple instances of the DARTSServer can run on different service
nodes and they serve data transfer requests from the large number of compute nodes in a
cooperative manner.
The key functions of DARTSServer include registering communication parameters from
a compute node, waiting for compute node notifications about data availability, scheduling
and managing data transfers from the compute nodes, and streaming the data out to remote
nodes or local storage as requested by the compute nodes. Data transfers have priorities
based on the size of the data blocks and the frequency at which the application generates
them. DARTSServer assigns a higher priority to smaller and more frequent data blocks, and
assigns a lower priority to the less frequent and larger data blocks. This priority mechanism
prevents transfers of smaller blocks from being blocked by the transfer of larger blocks, and
enables them to proceed in parallel with the larger block transfers.
Two key performance goals underlying the DARTSServer are minimization of the trans-
fer latencies and maximization of the transfer throughput. To achieve these goals, the
streaming server pre-allocates resources (i.e., communication buffers associated with the
memory descriptors for remote data transfers) during the server initialization phase at
startup. The specific number of memory descriptors and the size of each buffer allocated is
influenced by multiple factors such as (1) the limit on the number of file descriptors that can
be used by a process (a memory descriptor counts as an open file), (2) the physical memory
available on the service node, and (3) the size of the working set (to avoid trashing behav-
iors). On a Linux system, each process has a default maximum limit of 1024 file descriptors
that it can use at any instant of time. In the current implementation, DARTSServer allo-
cates 512 memory descriptors and a buffer of 4MB for each descriptor to accommodate the
physical memory constraints of the server machine and to keep the communication buffers
as part of the working set and avoid swapping penalties. DARTSServer adapts the data

20
transfer scheduling algorithm to scale beyond 512 compute nodes, and up to 4096 compute
nodes.
In addition to the memory descriptors used for the data transfers, the streaming server
also allocates memory descriptors for node registration and message signaling. DARTSServer
allocates two types of memory descriptors for node registration – one descriptor is used for
compute node registration requests, and the other for service nodes registration requests.
The latter is used when multiple server instances operate in a cooperative mode. When the
DARTSServer runs in cooperative mode (i.e., there are multiple instances in the system),
the first instance of the streaming server, also called the master instance, load balances
the compute node registration across all instances of the streaming servers. The master in-
stance uses the service node registration memory descriptor to also forward compute node
registration requests to other DARTSServer instances to preserve the balance.
For message signaling, DARTSServer also uses two types of descriptors – one descriptor
holds notifications from the compute nodes about data availability, and the other notifies a
compute node when an asynchronous transfer completes. In case of the former, the access
control policy [4] is set to allow the remote node (i.e., the compute node) to manage the
offset for a write (“push”) operation. However, the streaming server establishes the write
offset parameters for each individual node during the registration phase. This descriptor
is large enough to hold requests from all the compute nodes associated with the streaming
server, and is configured (via access control rules) to guarantee that the server does not
miss any request.
The DARTSServer implementation is multi-threaded and consists of three threads in-
cluding the main application process, viz., the “Main” thread t1, the “Portals” thread t2,
and the “Streaming” thread t3. The three threads are associated with three distinct queues
as follows (1) t1 ⇀↽ ebq, (2) t2 ⇀↽ pbq, and (3) t3 ⇀↽ fbq. Furthermore, the pre-allocated
memory descriptors and the buffer are cycled between these threads by assigning them to the
queues according to their status, i.e., available descriptors are assigned to ebq, in-progress
descriptors are assigned to pbq, and used descriptors are assigned to fbq.
The overall data flow associated with the operation of the DARTSServer is illustrated
in Figure 4.2. A data transfer starts when the application running on a compute node

21
Figure 4.2: Data flow for DART operation.
generates a request for transfer message and posts a notification message on the notification
memory descriptor at the streaming server (e.g., message sequence 1 in the figure). Thread
t1 continuously polls this memory descriptor for new incoming notification messages.
When a new notification arrives, t1 extracts it (2), requests an empty buffer (3) for the
transfer from the ebq queue, and starts the data transfer from the corresponding compute
node (4). After t1 thread initiates the asynchronous data transfer, it adds the buffer and
the memory descriptor to the pbq queue (5), and signals thread t2 (6). Thread t2 blocks and
waits for transfer completions, and when a transfer completes (7), it adds the corresponding
buffer and memory descriptor to the fbq queue (8) and signals thread t3 (9). The primary
task of thread t3 is to stream the data from a buffer (10) either to a remote location (11)
or to local storage. Once it finishes streaming the data, it adds the buffer and memory
descriptor back to the ebq queue (12) and signals thread t1 (13).
4.3 DART API and Usage
The DART client layer (DARTClient) provides I/O primitives that are very similar to stan-
dard Fortran file operations, i.e., dart open(), dart write(), and dart close(). The similarity
in naming and signatures of these primitives with the file operations was chosen to make the
library easy to use by scientists and to easily incorporate it into existing application codes.

22
Additionally DART provides function to initialize and finalize the library, i.e., dart init(),
and dart finalize().
DART I/O primitives are asynchronous. A typical usage of the API consists of a
dart open() operation that returns a handle that identifies a data stream, one or more
non-blocking dart write() operations on the handle of the data stream, and a dart close()
operation on the stream. Following the close operation, the stream is closed and the handle
reference is no longer valid to the application (e.g., the application can no longer write to
this stream), but the data transfer for this stream may not be completed yet. DARTClient
releases the resources associated with a data stream only after the streaming server ac-
knowledges the transfer completion. The application has to open another data stream if it
needs to write more data.
Throughout the runtime of the application, an I/O operation may be in one of three
states, “not started”, “in progress” or “finished”. In case of the first two states, DART-
Client maintains status information for the data streams, and when the application calls
dart finalize(), it ensures that all of the in-progress operations are complete. As a result, a
call to dart finalize() can block and it should always be called at the end of the application
so that it does not impact the simulation.
In the current implementation, DART assumes the application does not generate any
sort of concurrency for the file streams (e.g., it does not open the same file from multiple
nodes).

23
Chapter 5
DART Implementation and Operation on the Cray
XT3/XT4
5.1 Compute Node Bootstrap Mechanisms
Compute nodes and service nodes on the Cray XT3/XT4 machine communicate using
RDMA calls via the Portals protocol. Portals identifies each process in the system by
a Portals address that is a tuple composed of unique numerical identifiers for the node
(compute or service) and the process, i.e., “nid” and “pid”. Two processes in the system
can communicate if they know each others Portals addresses.
When a user runs a simulation on the system (e.g., through the batch queuing system),
he/she requests a certain number of compute nodes. However, the specific nodes that are
assigned to the simulation, and consequently their Portals addresses, are only known at run-
time. As a result, to enable the compute nodes to communicate with the streaming server,
DART defines a customized bootstrap mechanism that is independent of the underlying
execution mechanism (e.g., MPI or the batch queuing system). The bootstrap mechanism
requires that the streaming server starts and runs before the application starts.
In the current implementation, DART supports two versions of the bootstrap mech-
anism. The first version relies on the environment variables to communicate the Portals
address (i.e., the tuple {“nid”, “pid”}) of the server to the compute nodes. DARTSServer
sets the values of these variables, the job launching script picks the variables and passes
them to the queuing system, and the queuing system replicates them on each compute node
when it allocates and starts the application on the requested number of compute nodes.
While this approach is simple and elegant, it is not reliable. A job may wait in the
batch queue for an undefined amount of time before its requested number of compute

24
Figure 5.1: DART compute node bootstrap mechanism.
nodes becomes available. During the waiting time in the queue, the system may go down
for maintenance. The queuing system automatically saves and restores the jobs waiting
queue across system reboots, while the user has to manually restart the streaming server
application (i.e., DARTSServer). On a manual restart, the streaming server process gets
a new Portals address (the “nid” value may be the same if the server runs on the same
service node, but it gets a different “pid” value), and this invalidates the address already
announced to the compute nodes.
The second version, shown in Figure 5.1, relies on the file-system that is shared between
the compute and service nodes. The server node writes its Portals address (i.e., the tuple
“nid”, “pid”) to a persistent configuration file. When the application initializes, DART-
Client parses this file and reads the Portals address of the streaming server. As part of the
registration phase, it sends to the streaming server its own Portals address. This bootstrap-
ping approach allows the streaming server to restart, get a different address, and modify the
configuration file multiple times before the application starts on the compute nodes (which
happens after the application is launched through the batch queuing system).
If the DARTSServer runs in cooperative mode, and multiple instances run on different
service nodes, then the first server with the lowest “nid” value acts as a master and writes the
configuration file, and the other servers follow the same bootstrap process as the compute
nodes. During the application initialization phase, the master server maps each compute

25
node to an instance of a streaming server via the bootstrap process, and later each compute
node forwards all the requests to that server instance. At this phase, the master server
uniformly distributes the compute nodes across the streaming servers, so that each server
serves approximately the same number of compute nodes.
In the current implementation of DART, the initial mapping of compute nodes to stream-
ing servers is preserved for the runtime of the applications. This is because the load on the
servers is naturally balanced due to the SPMD (single program multiple data) nature of the
applications. Cooperative load balancing between streaming servers is used in cases where
this is not true (e.g., if local adaptivity is used at the application running on the compute
nodes).
5.2 Data Transfer Protocol
The DARTClient is purposefully lightweight and implements the minimum required func-
tionality so that it does not impact the application layers above. Consequently, DARTSServer
implements all the logic necessary for scheduling, data extraction and data transport.
As described in Section 5.1, DART associates or maps each compute node of an appli-
cation to an instance of DARTSServer during the registration phase through the bootstrap
process. After the registration phase is completed a compute node sends all the I/O re-
quests to the same server instance, and that instance services all the requests coming from
the compute node.
When coupled with the asynchronous management layer AIO layer [25] or directly with
the application, DARTClient caches all I/O operations corresponding to an application data
stream to a communication buffer, until the application closes the stream. A compute node
does not have to wait for a transfer operation corresponding to a data stream to complete,
as DARTClient associates a distinct communication buffer to each stream of data. The
DARTClient releases the resources associated with a data stream either on subsequent I/O
operations, or upon the call to dart finalize().
The data transfer protocol has two stages. First, a compute node sends a small “request
for send” notification message to its associated streaming server instance. Second, the

26
(a) DART client layer (b) DART server
Figure 5.2: Timing diagrams for the operation of DARTClient and DARTSServer.
streaming server schedules the request, extracts the data from the memory of the compute
node, and transfers it to the destination specified in the “request for send” notification (i.e.,
remote node or local storage). The streaming server, processes and services multiple data
notification requests (from the same compute node or from different compute nodes) in a
round robin fashion according to the priorities of the requests.
Figure 5.2 illustrates the operation of the transfer protocol using timing diagrams. Fig-
ure 5.2(a) presents the timing diagram at a compute node while running an application
coupled with the DARTClient layer. An usual run of an application consists of sequences of
computations (identified by ct in the figure), followed by data transfer requests (identified by
wt and rfst in the figure). The data transfer protocol is asynchronous, and after a compute
node posts a “request for send” notification message (e.g., this corresponds to rfst) on the
streaming server, it can continue its computations without waiting for the actual transfer
to complete. Due to this asynchronous nature, a data transfer can proceed in parallel with
the application and can overlap computations, although it may not start immediately. A
compute node may block before sending a notification (i.e., wt), if the streaming server is
busy and has not yet processed a previous notification message from the same compute
node. The effective I/O time at the application level is the sum of wt and rfst times. The
value for rfst represents the time to post a notification message on the server, as well as
the time to encode and cache the application data into the communication buffer.
Similarly, Figure 5.2(b) presents the timing diagram for the transfer of a block of data
from a compute node to a remote node. In the figure, “teb” is the time the server takes for
processing a notification message from a compute node and for scheduling the corresponding
data extraction, “tpb” is the time the server takes for extracting the data from the compute
node using the Portals interface, and “tfb” is the time the server takes to transfer the data
27
to a remote node using the TCP interface. The value of these parameters corresponds to
the processing times of threads t1, t2, and t3 processing time as described in Section 4.
The value for the total I/O time equals the sum of these three values plus some OS thread
scheduling overheads.
28
Chapter 6
Experimental Evaluation
DART performance evaluation includes two sets of experiments. The first set evaluates
the base performance of DART using synthetic testing simulations. The synthetic testing
simulations clone the real simulation behavior by following the same computational pattern,
i.e., a set of one or more computational stages followed by one I/O stage. The experiments
evaluate the main parameters that influence data transfer rates from compute to service
nodes, the amount of overlap between computations and data transfers, and the overhead
of data transfers on the application. This includes (1) the size of data unit transfered, i.e.,
the block size, (2) the number of memory descriptors allocated at the service node, (3) the
frequency of data transfers, and (4) the time required to stream the data, i.e., the time to
store the message at the destination node.
The second set of experiments evaluates the performance of DART when it is integrated
with real simulation codes, i.e., the GTC and XGC-1 fusion simulations. The key metrics
used in these experiments are (1) the effective data transfer rate from the compute nodes
and to the destination nodes, and (2) the overhead of using DART on the performance of
the simulation.
6.1 Data Transfer Rate
This benchmark experiment evaluated the maximum application-level transfer rate that
DART can achieve between compute and service nodes, using RDMA data transfers.
In the set up of this experiment, DART used two compute nodes and one service node,
i.e., one streaming server transfered data from a simulation running on two compute nodes
and measured the transfer rates. In this test, DART serviced a synthetic simulation code
with a compute stage of 1 msec. This parameter however, did not influence the transfer

29
1134
1136
1138
1140
1142
1144
1146
1148
1150
1152
0 10 20 30 40 50 60 70 80 90 100
transfe
r ra
te (
MB
/sec)
message size (MB)
SeaStar Bandwidth Compute-Login Node
transfer bw
Figure 6.1: Data transfer rate between compute and service nodes.
rates since DART measured the transfer times and sizes at the streaming server.
During the test, the simulation varied the size of the data unit (i.e., the block size)
from 1 to 100MB in increments of 4MB, and DART measured the achieved transfer rate
for each value. The synthetic testing simulation ran for 100 iterations, and performed 100
data transfers for each distinct value of the block size.
The average transfer rate (over the 100 iterations) for each block size is plotted in
Figure 6.1. The plot shows that DART can saturate the network link between compute and
service nodes using a minimum block size of 4MB.
It should be noted that the streaming server used the gettimeofday() system call
to measure the transfer times, and as a result, the measured values also include system
operations such as OS process scheduling, etc., which explains the variability in the rate
measurements.
6.2 Overhead on the Simulation
This experiment analyzed the additional overhead that DART transfer operations impose
on a simulation running on the compute nodes, and expressed the value of the overhead as
a percentage of the time the simulation spent in its compute stages.
In the setup of this experiment, DART used 128 compute nodes that ran the synthetic
simulation and streamed the data to one streaming server. At the streaming server, DART

30
used 128 memory descriptors to ensure that it can fetch data blocks from all the compute
nodes in parallel. The testing simulation generated data in blocks of 4MB, and consequently,
for this test, the streaming server allocated 4MB of memory to each memory descriptor to
match the size of the data blocks from the application. Further, the streaming server
transfered the data to a node on a remote cluster.
In order to analyse the influence of the I/O operation frequency on the data transfers
overhead at the application level, the synthetic application simulated different durations for
the compute stage in two different tests. The results of the two tests from this experiment
are presented below. The values for the duration of the compute stages are selected to
demonstrate the effect of I/O frequency on the overhead, and on the ability to overlap I/O
with computations.
It should be noted that the synthetic simulation posted the “request for send” notifica-
tions from all the compute nodes at the same time, while the streaming server processed
these notifications sequentially in round robin fashion. Consequently, the streaming server
could service the i+ 1st notification request from a compute node only after it had serviced
all ith requests from all the other compute nodes. At the streaming server, the most time
consuming operation while servicing a transfer request was streaming the data to the remote
location.
Furthermore, the upper bound for the time the server needed to service two consecutive
requests for the same compute node was tfb ∗ N + tpb, where tfb was the time required to
transfer one block of data to a node in the remote cluster (i.e., Ewok), N was the number
of compute nodes, and tpb was additional time to process and transfer the data from the
compute nodes. The value of tpb is typically negligible as compared to tfb∗N . Subsequently,
the goal was to find a good balance between the duration of a compute stage and the data
size streamed, in order to obtain a better overlap between computations and data transfers.
In each test, DART measured the I/O time, the wait time, the “request to send” time
at the compute nodes, and the total I/O time for an operation (from the “request to send”
notification to the end of streaming) at the streaming server.
In the first test, the testing application simulated a compute stage of 2 sec. This value
was chosen based on previous experiments to demonstrate the effects of poor overlap. The
31
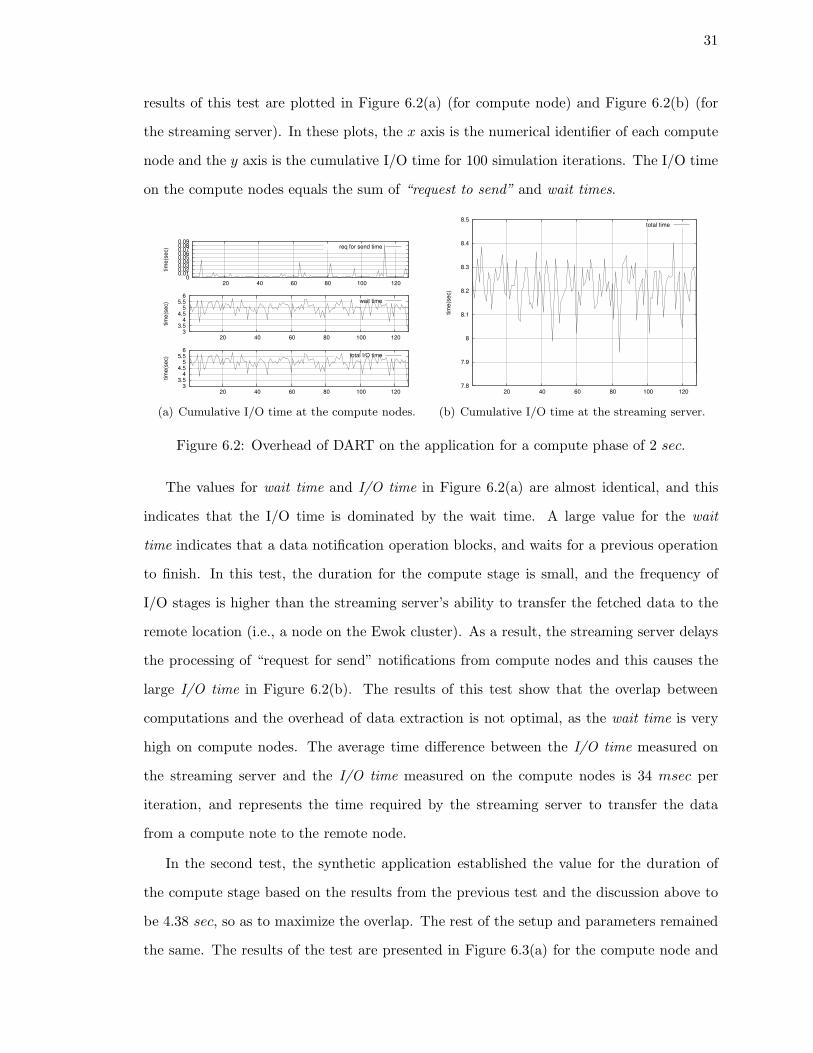
results of this test are plotted in Figure 6.2(a) (for compute node) and Figure 6.2(b) (for
the streaming server). In these plots, the x axis is the numerical identifier of each compute
node and the y axis is the cumulative I/O time for 100 simulation iterations. The I/O time
on the compute nodes equals the sum of “request to send” and wait times.
3 3.5
4 4.5
5 5.5
6
20 40 60 80 100 120
tim
e(s
ec) total I/O time
3 3.5
4 4.5
5 5.5
6
20 40 60 80 100 120
tim
e(s
ec) wait time
0 0.01 0.02 0.03 0.04 0.05 0.06 0.07 0.08 0.09
20 40 60 80 100 120
tim
e(s
ec) req for send time
(a) Cumulative I/O time at the compute nodes.
7.8
7.9
8
8.1
8.2
8.3
8.4
8.5
20 40 60 80 100 120
tim
e(s
ec)
total time
(b) Cumulative I/O time at the streaming server.
Figure 6.2: Overhead of DART on the application for a compute phase of 2 sec.
The values for wait time and I/O time in Figure 6.2(a) are almost identical, and this
indicates that the I/O time is dominated by the wait time. A large value for the wait
time indicates that a data notification operation blocks, and waits for a previous operation
to finish. In this test, the duration for the compute stage is small, and the frequency of
I/O stages is higher than the streaming server’s ability to transfer the fetched data to the
remote location (i.e., a node on the Ewok cluster). As a result, the streaming server delays
the processing of “request for send” notifications from compute nodes and this causes the
large I/O time in Figure 6.2(b). The results of this test show that the overlap between
computations and the overhead of data extraction is not optimal, as the wait time is very
high on compute nodes. The average time difference between the I/O time measured on
the streaming server and the I/O time measured on the compute nodes is 34 msec per
iteration, and represents the time required by the streaming server to transfer the data
from a compute note to the remote node.
In the second test, the synthetic application established the value for the duration of
the compute stage based on the results from the previous test and the discussion above to
be 4.38 sec, so as to maximize the overlap. The rest of the setup and parameters remained
the same. The results of the test are presented in Figure 6.3(a) for the compute node and

32
0 0.01 0.02 0.03 0.04 0.05 0.06 0.07 0.08
20 40 60 80 100 120
tim
e(s
ec) total I/O time
0 0.005
0.01 0.015
0.02 0.025
0.03 0.035
0.04 0.045
20 40 60 80 100 120
tim
e(s
ec) wait time
0 0.01 0.02 0.03 0.04 0.05 0.06 0.07 0.08
20 40 60 80 100 120tim
e(s
ec) req for send time
(a) Cumulative I/O time at the compute nodes.
0.4
0.6
0.8
1
1.2
1.4
1.6
1.8
2
2.2
2.4
20 40 60 80 100 120
tim
e(s
ec)
total time
(b) Cumulative I/O time at the streaming server.
Figure 6.3: Overhead of DART on the application for a compute phase of 4.38 sec.
in Figure 6.3(b) for the streaming server. Again, in these plots the x axis is the numerical
identifier of each compute node and the y axis is the cumulative I/O time for 100 simulation
iterations. The value for the wait time in this case is very small (5 msec), indicating that
the i + 1st fetch operation from a compute node can proceed almost immediately, without
having to wait for the ith transfer to finish. These results demonstrate an efficient overlap
of simulation computations with data extractions, resulting in very low I/O overhead on
the simulation.
These experiments demonstrate that the data transfer latency and the simulation over-
head depend very strongly on the duration of the computation stage (i.e., the frequency of
I/O operations) and the size of the data blocks. At same time the overhead of transferring
data from an application using RDMA calls can be very small if the application overlaps
computations with data transfers.
6.3 Integration with Simulation Codes
In the second set of experiments, real scientific application codes replaced the synthetic
simulations and DART performance was analyzed using multiple criteria. The first criteria
was the throughput of the streaming server on both the Portals (compute nodes to streaming
server) and TCP (streaming server to remote node) interfaces. The second criteria was the
DART I/O overhead on the simulation, and the third criteria was DART scalability with
the number of compute nodes.

33
6.3.1 Integration with GTC
The first application used in this experiment was the Gyrokinetic Toroidal Code [17] (GTC)
simulation. GTC is a highly accurate fusion modeling code that performs a highly complex
analysis of non linear dynamics of plasma turbulence by using numerical simulations, thus
requiring very large-scale computation capabilities.
The GTC code used the DART system as a transfer library and set the simulation
parameters in the runs as described below. The key GTC parameters that influenced the
size of the generated data and the frequency of I/O are micell, mecell, which determine the
size of the domain, npartdom, which determines the number of particles in the domain, and
msnap, which determines the frequency of I/O (e.g., frequency at which checkpoint files are
generated).
To test the scalability of DART, the GTC simulation ran initially on 1024 and later
on 2048 compute nodes. For the test with 1024 compute nodes, the GTC simulation used
the following values for the input parameters 160 for micell and mecell parameters, 16 for
npartdom, and 13 for msnap. Corresponding to these parameter values, the GTC code
generated a checkpoint file of 40MB for every 13 simulation iterations. Each simulation
iteration took 8 sec, and the simulation ran for 200 iterations.
Proportionately, for the test on 2048 compute nodes, the GTC code used the following
values: 160 for micell and mecell input parameters, 32 for npartdom, and 26 for msnap,
and ran the computations for 400 iterations. Corresponding to these parameter values,
the GTC code generated a checkpoint of 40MB every 26 simulation iterations, and each
iteration took 8 sec.
In these experiments, the DART streaming server ran on a dedicated service node (i.e.,
no other users or I/O services were running on the same node). For performance analysis,
DART measured the wait and I/O times at the simulation level for each of the compute
nodes, and the throughput obtained on both Portals and TCP interfaces at the streaming
server. During these experiments, the remote receiver received the data from the streaming
server, but did not perform any processing on the data.

34
0
0.1
0.2
0.3
0.4
0.5
0.6
0.7
0.8
0 200 400 600 800 1000
% o
f tim
e s
pe
nt
in I
/O
compute node id
I/O timeWait time
(a) I/O overhead on the GTC code on 1024 nodes.
0
0.05
0.1
0.15
0.2
0.25
0.3
0.35
0.4
0 500 1000 1500 2000
% o
f tim
e s
pe
nt
in I
/O
compute node id
I/O timeWait time
(b) I/O overhead on the GTC code on 2048 nodes.
Figure 6.4: Percentage of I/O and wait time overhead on the GTC simulation measured atthe compute nodes.
The I/O overhead on the GTC application caused by DART data extraction and stream-
ing is plotted in Figure 6.4 as a percentage of the time taken by the compute stages. The
x axis in these plots is a numerical identifier for each compute node, and the y axis is the
overhead measured at each compute node of the simulation.
In Figure 6.4(a), the average value of the percentage wait time across the 1024 nodes is
less than 0.15%, which indicates that DART was able to efficiently overlap computations
with data extraction and transport. In addition, the average value of the I/O time is
less than 0.65%, which indicates that the overhead on the simulation is very small. In
Figure 6.4(b) the average value for the I/O time for 2048 nodes is still small at less than
0.4%. However, the difference between the I/O and wait time percentages is much smaller
than in the 1024 case, indicating that the streaming server is aproaching the limit for the
maximum number of compute nodes it can service simultaneously. The average value for
the percentage overhead in the test with 2048 nodes was smaller than that for the test
with 1024 nodes because the GTC code was generating the same amount of data for its
checkpoint files, but the length of computing stage was doubled.
Figure 6.5 plots the cumulative I/O times at the streaming server for (1) extracting the
checkpoint from the simulation using the Portals interface, and (2) transporting the data
to a remote node using the TCP interface, for each compute node over the runtime of the
simulation. In these plots, the x axis is a numerical identifier for each compute node and the
y axis is the cumulative I/O time. As expected, the transfer times for the Portals interface

35
0
20
40
60
80
100
120
140
160
180
0 200 400 600 800 1000
tim
e(s
ec)
compute node id
Portals Interface
0
100
200
300
400
500
0 200 400 600 800 1000
tim
e(s
ec)
compute node id
TCP Interface
(a) Cumulative I/O time at the streaming serverservicing 1024 compute nodes.
0
20
40
60
80
100
120
140
160
180
0 500 1000 1500 2000
tim
e(s
ec)
compute node id
Portals Interface
0
100
200
300
400
500
600
0 500 1000 1500 2000
tim
e(s
ec)
compute node id
TCP Interface
(b) Cumulative I/O time at the streaming serverservicing 2048 compute nodes.
Figure 6.5: Cumulative I/O time times for the GTC simulation measured at the DARTstreaming server.
were smaller. The corresponding values for the transfer time on both Portals and TCP were
comparable in the two cases (1024 and 2048 compute nodes), because the buffers that the
streaming server allocated for communication were filled to capacity throughout the tests.
0
10
20
30
40
50
60
70
0 200 400 600 800 1000 1200 1400
% o
f T
CP
pe
ak t
hro
ug
hp
ut
time (sec)
Portals Interface
0
10
20
30
40
50
60
70
0 200 400 600 800 1000 1200 1400
% o
f T
CP
pe
ak t
hro
ug
hp
ut
time (sec)
TCP Interface
(a) DART streaming server servicing 1024 com-pute nodes.
0
10
20
30
40
50
60
70
0 500 1000 1500 2000 2500 3000
% o
f T
CP
pe
ak t
hro
ug
hp
ut
time (sec)
Portals Interface
0
10
20
30
40
50
60
70
0 500 1000 1500 2000 2500 3000
% o
f T
CP
pe
ak t
hro
ug
hp
ut
time (sec)
TCP Interface
(b) DART streaming server servicing 2048 com-pute nodes.
Figure 6.6: Throughput at the DART server using Portals (compute nodes to service node)and TCP (service node to remote node).
A benchmark test using the IPerf tool [14] for the maximum link throughput between
the streaming server and the remote node using the TCP transport protocol, performed
ahead of running these tests, showed a peak measured value of 5.01 Gbps. Figure 6.6 plots
the throughput achieved using DART at the streaming server on both the Portals and TCP
interfaces. In this plot, the x axis represents the runtime of the simulation, and the y axis
represents the throughput as a percentage of the link peak value throughput. In both of
36
the tests with 1024 and 2048 compute nodes, on the TCP interface, DART achieved an
average sustained throughput of 60% of the peak TCP throughput. The streaming server
spent the rest of the time to transfer the data on the Portals interface and to schedule
the transfer operations. The average transfer throughput obtained on the Portals interface
was comparable to the value of the TCP interface, i.e., 60%, which was expected since the
communication buffer at the streaming server was fully utilized and became the bottleneck.
Comparing the values of I/O time on Portals and TCP interfaces in the images of Fig-
ure 6.5(a), TCP transport is slower than Portals, but as the two transports share the same
communication buffer at the streaming server, the Portals throughput adapts to the slower
link.
To summarize, in the experiment with 1024 compute nodes, the simulation ran for 1500
sec and each node generated 550MB of data, resulting in a total of 555GB across the system.
The overhead on the simulation was less then 0.7%. In the experiment with 2048 compute
nodes, the simulation ran for 3000 sec, and each node generated 550MB of data for a total
of 1.2TB across the system and the overhead on the simulation of 0.4%.
6.3.2 Integration with XGC-1
The second application used in the experiment was the Edge Gyrokinetic Code version 1
(XGC-1) [6] simulation code. XGC-1 is an edge turbulence particle-in-cell code, that uses
numerical models to simulate a 2D dimensional density, the temperature, the bootstrap
current and the viscosity profiles in accordance with neoclassical turbulent transport.
In the experiments with XGC-1, DART ran on 1024 compute nodes and one instance
of the streaming server. The DART streaming server allocated the same set of resources as
for the GTC experiment, i.e., 512 memory descriptors, and 4MB for each descriptor.
The numerical model that XGC-1 code is simulating can crash during the simulation
execution, and XGC-1 protects against such crashes by repeatedly generating and saving
checkpoint files. A checkpoint file is a snapshot of the state of the simulation computa-
tions at a given moment of time, and in case of a crash, the simulation can restart the
computations from the latest file before the crash. The main XGC-1 input parameters

37
0
0.05
0.1
0.15
0.2
0.25
0 200 400 600 800 1000
% o
f tim
e s
pe
nt
in I
/O
compute node id
I/O timeWait time
(a) I/O remote node streaming overhead on XGC
0
0.02
0.04
0.06
0.08
0.1
0.12
0.14
0.16
0.18
0.2
0 200 400 600 800 1000
% o
f tim
e s
pe
nt
in I
/O
compute node id
I/O timeWait time
(b) I/O local storage saving overhead on XGC
Figure 6.7: Percentage of I/O and wait time overhead on the XGC-1 simulation measuredat the compute nodes
that influence the size of a generated checkpoint file and the frequency of the I/O oper-
ations are “ptl num”, which defines the number of particles to be used in the simulation,
“sml mstep”, which defines the number of iterations (computation cycles) the simulation
performs, and “sml restart write period”, defining the frequency at which the simulation
generates checkpoint files.
XGC-1 used the DART system as a transfer library in two distinct experiments to (1)
stream the checkpoint files to a remote destination and (2) to save the checkpoint files to a
local storage system.
In the first experiment, DART transfered the data generated by the simulation to a
remote node. In this experiment, the XGC-1 code used the following values for the input
parameters 100 for “sml mstep” parameter, 20 for the “sml restart write period”, and 106 for
the “ptl num”. Corresponding to these values, XGC-1 generated a checkpoint file of 73MB
every 20 iterations, and each iteration took 30 sec. The DART data transfer overhead
on the simulation is plotted in Figure 6.7(a) as percentage of the compute stage duration
(time). The value of the wait time is very small, which indicates that the data transfer
overlapped computations and had a small overhead on the simulation less than 0.2%.
In the second experiment, DART saved the checkpoint files generated by the sim-
ulation to a local storage such as the Lustre [9] parallel file system. The values for
the input parameters were similar, except for “sml mstep”, which was set to 120, and
“sml restart write period”, which was set to 24. Corresponding to these values, XGC-1

38
generated a checkpoint file of 73MB every 24 iterations, and each iteration took 30 sec.
The overhead on the simulation is also expressed as a percentage of the compute stage and
results are plotted in Figure 6.7(b). Again, the value of the wait time is very small and the
impact of data transfers on the simulation is less than 0.2%.
The difference between the two graphs in Figure 6.7 shows the data transfer to a local
storage is more uniform across the nodes than in the streaming case. This behavior was
expected, because Luster is a parallel file system, and the files were striped across multiple
back-end storage servers, while for the streaming test DART used a single remote receiver.
To summarize, the behavior and performance of DART observed in these experiments
were similar to that described above for GTC. The XGC-1 simulation ran for 3020 sec,
and each node generated 760MB of data, resulting in a total of 380GB of data across the
system. The overheads on the simulation due to DART operations was less than 0.2% of the
simulation compute time. The difference in the values for the overhead on the simulation
in the two case (e.g., GTC and XGC-1) is explained by the different values for the compute
stages of the two simulations.
39
Chapter 7
Conclusions
This work presented the design, implementation, operation, and the evaluation of the DART
system. DART is a library for fast, low latency and high throughput data transfers that uses
the RDMA communication paradigm to provide an asynchronous API to the application
layers of a scientific application.
DART system has three key components DARTClient, which is a thin transport layer on
the application stack that runs in line with the application and provides the asynchronous
API to the application, DARTSServer, which is a streaming server that runs as stand-
alone application and transfers data from the application and DARTReceiver, which is an
application that transports data from the streaming server to remote locations.
DART system was built and evaluated on top of Portals framework at Oak Ridge Na-
tional Labs on a Cray XT3/XT4 machine. The evaluation presented three sets of exper-
iments. The first set was a benchmark that measured the maximum data transfer rate
that DART could achieve and sustain between a compute and a service node on the Jaguar
machine. The second set of experiments used a synthetic test application (1) to analyse the
main parameters that influence the performance of a data transfer (e.g., number of nodes
an application runs on, the size of a transfer, the frequency of the transfers), and (2) to
analyse the overhead of a data transfer using DART at the application level. The third set
of experiments used DART as a transfer library for two real scientific applications GTC and
XGC-1 fusion simulation codes.
The experimental results demonstrated that DART can saturate the interconnection
link between a compute and a service nodes and that the performance of data transfers
is strongly dependent on the computational pattern of the application (e.g., the duration
of a compute stage), yet with a proper balance between computations and I/O stages,

40
DART asynchronous transfer mechanism can overlap application computations with data
transfers with a very small overhead on the application itself. Further, the results with real
scientific simulation (i.e., GTC and XGC-1) showed that the DART library is scalable and
can transfer large amounts of data with low overhead on the application, low latency and
high throughput.
DART is currently built on the Cray system using the Portals library, and it is part of
future work to extend and port DART to other platforms that supports RDMA commu-
nications such as BlueGene/P and Infiniband. The main features of DART demonstrated
in this work include data transfers to either local or remote storage, yet DART can build
other communication abstractions on top of it such as an end-to-end code-coupling layer.

41
References
[1] Hasan Abbasi, Matthew Wolf, and Karsten Schwan. LIVE Data Workspace: A Flexi-ble, Dynamic and Extensible Platform for Petascale Applications. In Cluster Comput-ing, Austin, TX, September 2007.
[2] Peter J. Braam, Phil Schwan, and Ron Brighttwell. Portals and networking for thelustre file system. IEEE International Conference on Cluster Computing, September2002.
[3] Ron Brightwell, Trammell Hudson, Kevin Pedretti, Rolf Riesen, and Keith Underwood.Implementation and Performance of Portals 3.3 on the Cray XT3. IEEE InternationalConference on Cluster Computing, September 2005.
[4] Ron Brightwell, Arthur B. Maccabe, and Rolf Riesen. Design, Implementation, andPerformance of MPI on Portals 3.0. International Journal of High Performance Com-puting Applications, 17(1), January 2003.
[5] Ron Brightwell, Rolf Riesen, Bill Lawry, and A. B. Maccabe. Portals 3.0: Protocolbuilding blocks for low overhead communication. Proceedings of the International andDistributed Processing Symposium, pages 1530–2075, 2002.
[6] C.S. Chang, S. Ku, and H. Weitzner. Numerical Study of Neoclassical Plasma Pedestalin a Tokamak Geometry. In Phys. Plasmas, volume 11, pages 2649–2667, 2004.
[7] HDF-5. http://hdf.ncsa.uiuc.edu/products/hdf5/index.html.
[8] W. B. Ligon III and R. B. Ross. Implementation and Performance of a Parallel FileSystem for High Performance Distributed Applications. In Proc. of the Fifth IEEEInternational Symposium on High Performance Distributed Computing (HPDC’ 96),Syracuse, NY, August 1996.
[9] Cluster File Systems Inc. Lustre: A Scalable, High Performance File System.http://lustre.org/docs/whitepaper.pdf.
[10] Cray Inc. Cray XT4 and XT3 Supercomputers.http://www.cray.com/downloads/Cray_XT4_Datasheet.pdf.
[11] Cray Inc. Cray XT3tm Sytem Overview. Technical Report S-2423-13, November 2005.
[12] IBM Inc. Gpfs: A Shared-Disk File System for Large Computing Clusters.www.almaden.ibm.com/StorageSystems/projects/gpfs/Fast02.pdf.
[13] Linux Asynchronous I/O. http://www.ibm.com/developerworks/linux/library/l-async/.
[14] IPerf. http://dast.nlanr.net/projects/iperf/.
42
[15] Wei keng Liao, Avery Ching, Kenin Coloma, Alok N. Choudhary, and Lee Ward. AnImplementation and Evaluation of Client-Side File Caching for MPI-IO. In Paralleland Distributed Processing Symposium (IPDPS’07), Miami, FL, March 2007.
[16] S. Klasky, S. Ethier, Z. Lin, K. Martins, D. McCune, and R. Samtaney. Grid-BasedParallel Data Streaming Implemented for the Gyrokinetic Toroidal Code. November2003.
[17] Z. Lin, T. S. Hahm, W. W. Lee, W. M. Tang, and R. B. White. Turbulent TransportReduction by Zonal Flows: Massive Parallel Simulations. Science, 281(5384):1835–1837, 1998.
[18] Jaguar Cray XT3 Machine. http://info.nccs.gov/resources/jaguar.
[19] Kostas Magoutis, Salimah Addetia, Alexandra Fedorova, Margo I. Seltzer, Jeffrey S.Chase, Andrew J. Gallatin, Richard Kisley, Rajiv G. Wickremesinghe, and Eran Gab-ber. Structure and Performance of the Direct Access File System. In Proc. of USENIXAnnual Technical Conference, Monterey, CA, June 2002.
[20] Parallel netCDF. http://trac.mcs.anl.gov/projects/parallel-netcdf.
[21] B. Nichols, D. Buttlar, and J. P. Farrell. PThreads Programming: A POSIX Standardfor Better Multiprocessing. O’Reilly, Sebastopol, CA, 1996.
[22] Vivek S. Pai, Peter Druschel, and Willy Zwaenepoel. IO-Lite: A Unified I/O Bufferingand Caching System. In Proc. of the Third Symposium on Operating Systems Designand Implementation(OSDI’99), New Orleans, LA, February 1999.
[23] Rolf Riesen, Ron Brightwell, Kevin Pedretti, Arthur B. Maccabe, and Trammell Hud-son. The Portals 3.3 Message Passing Interface - Revision 2.1. Technical ReportSAND20006-0420, April 2006.
[24] Nathan Stone, Doug Balog, Bryon Gill, Brian Johanson, Jim Marsteller, PaulNowoczynski, David Porter, Raghurama Reddy, J. Ray Scott, Derek Simmel, JasonSommerfield, Katie Vargo, and Chad Vizino. PDIO: High-Performance Remote FileI/O for Portals-Enabled Compute Nodes. In PDPTA, pages 925–930, January 2006.
[25] ADaptable IO System. http://hecura.cs.unm.edu/doku.php?id=asynchronous i o api.
[26] Rajeev Thakur, William Gropp, and Ewing Lusk. Data sieving and collective I/Oin ROMIO. In Proceedings of the Seventh Symposium on the Frontiers of MassivelyParallel Computation, pages 182–189. IEEE Computer Society Press, 1999.