asymmetric particles for pulmonary drug delivery · asymmetric particles for pulmonary drug...
TRANSCRIPT

Asymmetric particles for pulmonary drug delivery
Dissertation
zur Erlangung des Grades
des Doktors der Naturwissenschaften
der Naturwissenschaftlich-Technischen Fakultät III
Chemie, Pharmazie, Bio- und Werkstoffwissenschaften
der Universität des Saarlandes
von
Dorothee Anna Luise Kohler Saarbrücken
2010

2
Tag des Kolloquiums: 21.01.2011
Dekan: Prof. Stefan Diebels
Vorsitzender: Prof. Dr. Rolf Hartmann
1. Gutachter: Prof. Dr. Claus-Michael Lehr
2. Gutachter: Prof. Dr. Helmuth Möhwald
Akad. Mitarbeiter: Dr. Ana Melero Zaera

3
In Memoriam
Dr. Michael Krüger

4
Table of Contents Summary .................................................................................................................... 7
Zusammenfassung ..................................................................................................... 8
1. General Introduction ............................................................................................ 9
1.1. Lung Anatomy .............................................................................................. 9
1.1.1. General Considerations ........................................................................ 9
1.1.2. Conducting Zone................................................................................. 10
1.1.3. Gas Exchange Zone ........................................................................... 10
1.2. Particle Engineering for Pulmonary Drug Delivery ..................................... 10
1.2.1. General Considerations ...................................................................... 10
1.2.2. Particle Aerodynamic Diameter........................................................... 11
1.2.3. Aerosolization...................................................................................... 13
1.2.4. Lung Deposition .................................................................................. 14
1.2.5. Particle Clearance............................................................................... 17
1.2.6. Multifunctional Drug Delivery............................................................... 19
1.3. Asymmetric Particles in Vivo ...................................................................... 20
1.3.1. General Considerations ...................................................................... 20
1.3.2. Carbon-Nanotubes.............................................................................. 21
1.3.3. Health Effects...................................................................................... 22
1.3.4. In Vivo Circulation ............................................................................... 22
1.3.5. Macrophage Clearance....................................................................... 23
1.4. Asymmetric Particle Preparation ................................................................ 24
1.4.1. State of the Art .................................................................................... 24
1.4.2. Electrospinning.................................................................................... 25
1.4.3. Tubes by Fiber Template (TUFT)........................................................ 26
1.4.4. Template Technique ........................................................................... 27
2. Aim of this Work ................................................................................................ 40
3. Template assisted Polyelectrolyte Encapsulation of Nanoparticles into
Dispersible, Hierarchically Nanostructured Microfibers ............................................ 41
3.1. Introduction ................................................................................................ 42
3.2. Materials and Methods ............................................................................... 43
3.2.1. Particle Infiltration................................................................................ 43
3.2.2. Microfiber Formation ........................................................................... 44

5
3.2.3. Microfiber Imaging............................................................................... 45
3.3. Results and Discussion .............................................................................. 46
3.3.1. Microfiber Morphology......................................................................... 46
3.3.2. Multifunctional Microfibers................................................................... 48
3.3.3. Polyelectrolyte Capsule Containing Microfibers .................................. 49
3.4. Conclusion ................................................................................................. 51
3.5. Experimental Details .................................................................................. 52
4. Spatial Aspect Ratio Dependent Macrophage Uptake of Biocompatible
Nanostructured Microfibers....................................................................................... 53
4.1. Introduction ................................................................................................ 54
4.2. Materials and Methods ............................................................................... 55
4.2.1. Agarose Infiltration .............................................................................. 55
4.2.2. Nanoparticle Infiltration ....................................................................... 56
4.3. Results and Discussion .............................................................................. 60
4.3.1. Cytotoxicity Test.................................................................................. 60
4.3.2. Macrophage Uptake............................................................................ 61
4.4. Conclusion ................................................................................................. 64
4.5. Experimental Details .................................................................................. 64
5. Aspect Ratio Dependent Aerosolization behaviour of Drug loaded Microfibers. 67
5.1. Abstract ...................................................................................................... 68
5.2. Introduction ................................................................................................ 68
5.3. Template Technique................................................................................... 69
5.4. Generating Drug Loaded Microfibers and Introducing Porosity.................. 70
5.5. Aerosolization of Microfibers ...................................................................... 71
5.6. Results and Discussion .............................................................................. 72
5.7. Conclusion ................................................................................................. 74
5.8. Experimental Details .................................................................................. 75
6. Overall Conclusion and Outlook ........................................................................ 76
7. Annex ................................................................................................................ 77
7.1. Particle Aggregation ................................................................................... 77
7.1.1. General Consideration ........................................................................ 77
7.1.2. Plasma Cleaning ................................................................................. 78
7.1.3. Gold Layer........................................................................................... 79
7.1.4. Gold Layer and Hydrophobisation....................................................... 81
6
7.1.5. Sacrificial Layer................................................................................... 83
7.2. Cytotoxicity Test ......................................................................................... 85
7.2.1. MTT Assay .......................................................................................... 85
7.2.2. LDH Assay .......................................................................................... 86
7.3. Chemical Structures ................................................................................... 86
Curriculum Vitae ......................................................................................................105
Publication List ........................................................................................................107
Acknowledgements .................................................................................................108

7
Summary Targeted drug delivery and controlled release are current challenges in pulmonary
drug delivery. The deposition pattern and clearance from deposition site are two key
parameters for drug delivery carrier design. Asymmetric particles allow an increase in
peripheral drug delivery compared to spherical particles and furthermore, affect
particle clearance mechanisms from the lung. Therefore, the main aim of this thesis
was to develop new synthesis strategies to produce well-dispersible, biocompatible,
biodegradable microfibers with a variety of aspect ratios and porosities. The
macrophage response to the resulting microfibers was investigated. The
aerosolization properties of the resulting microfibers were examined. From the
obtained results it can be concluded that:
1. A new template-assisted synthesis strategy to produce monodisperse
microfibers with defined dimensions has been developed.
2. The technique has been extended to various materials and process
parameters for cell testing, drug loading and aerosolization tests.
3. Microfibers were successfully taken up by macrophages, only when they were
approached from the pointy end.
4. Aerosolization studies showed good dispersion properties of microfibers with
relatively high fine particle fractions.
In summary, this new technique may allow to produce microfibers for pulmonary drug
delivery, which will lead to a better understanding of their in vivo behaviour such as
mucoadhesion, macrophage interaction and deposition behaviour.

8
Zusammenfassung Die aktuellen Herausforderungen der inhalativen Therapie sind die gezielte
Wirkstoffdeposition und die kontrollierte Wirkstofffreisetzung in der Lunge.
Asymmetrische Partikel haben dabei durch ihre erhöhte tiefe Lungendeposition und
ihren Einfluss auf die Clearance-Mechanismen erhöhtes Interesse gefunden. Ziel
dieser Arbeit war daher die Entwicklung einer neuen Herstellungsmethode, um gut
vereinzelte, biokompatible, bioabbaubare Mikrofasern mit variablen
Aspektverhältnissen und Porositäten zu generieren. Weiteres Ziel war die Testung
der Makrophagen-Mikrofaser-Interaktion und des Aerosolisierungsverhaltens. Die
gewonnenen Ergebnisse führen zu folgenden Aussagen:
1. Es wurde eine neue Methode zur Herstellung monodisperser Mikrofasern mit
definierten Maßen entwickelt.
2. Mikrofasern aus diversen Materialien wurden in späteren Versuchen für
Zelltests, Wirkstoffbeladung und Aerosolisierungsstudien verwendet.
3. Die Aufnahme von Mikrofasern durch Makrophagen zeigte eine Korrelation
zum Faserdurchmesser, wobei diese nur vom spitzen Ende her aufgenommen
wurden.
4. Aerosolisierungsstudien zeigten eine gute Dispergierung der Mikrofasern mit
hohen Fine-Particle-Fractions.
Die entwickelte Methode kann zu einer Optimierung der pulmonalen
Wirkstoffapplikation und einem besseren Verständnis des Verhaltens
asymmetrischer Partikel im Körper beitragen. Die Mukoadhesion, die Makrophagen-
Interaktion und das Depositionsverhalten in der Lunge können mittels dieser Fasern
weiter untersucht werden.

9
1. General Introduction
1.1. Lung Anatomy
1.1.1. General Considerations
Large surface area, extensive vascularisation and the ability to avoid the first pass
effect are the main advantages for drug administration via the lung. Furthermore the
presence of a thin epithelial barrier in the lung allows the fastest uptake of any route
of delivery other than intravenous [1].
Anatomically the lung can be divided into two main parts according to their function
during breathing. The first 16 airway generations – conducting or proximal airways -,
including mouth, nose, trachea and bronchiolous terminalis, mainly warm, wet and
clean air. The airway generations 17-23 form the peripheral airways, i.e. gas
exchanges zone, including bronchiolous respiratorus and saccus alveolaris [2].
Figure 1: Comparison of the lung epithelium at different sites within the lungs taken from ref. [3].

10
1.1.2. Conducting Zone
The proximal airways (tracheobronchial compartment) are covered by a layer of
epithelial cells comprising ciliated cells, goblet cells, and a variety of other secretory
cells, with varied cell compositions in different airway generations [4] (Figure 1). The
basal cells are progenitor cells for the epithelium. The goblet cells produce mucus,
which is moved by the ciliated cells, and thus gives rise to the mucociliar clearance
[3].
1.1.3. Gas Exchange Zone
The epithelium of the peripheral compartment is covered by a monolayer composed
of broad and very thin (0.1µm) type 1 cells (95%), and lung surfactant producing type
2 cells (5%) interconnected by tight junctions. This ensures a thin barrier for gas
exchange [5]. The clearance in the alveoli differs from the mucociliar clearance
described above. No cilii are present in the alveoli, leaving macrophages and
dendritic cells responsible for clearance of deposited materials [6].
1.2. Particle Engineering for Pulmonary Drug Delivery
1.2.1. General Considerations
Pulmonary drug delivery has gained significant attention during the past decade. The
large lung surface area (~140m²) and thin epithelial barrier (0.1µm in the alveoli)
make the lung an interesting drug delivery route due to the high drug absorption and
the ability to circumvent the first pass effect [7, 8]. Pulmonary drug delivery can
therefore be used to treat local diseases as cystic fibrosis, asthma and chronical
obstructive pulmonary disease (COPD) as well as systemic diseases i.e. diabetes
(Exubera®, Pfizer).
The effectiveness of drug formulation is closely related to efficient delivery to the lung
[9]. Till now, delivery carriers have been optimized in terms of size, morphology and
structure. The aim of particle engineering is to obtain particles with narrow particle
size distribution (PSD), improved dispersibility, optimum deposition pattern, sustained
release profiles and/or specific targeting.

11
1.2.2. Particle Aerodynamic Diameter
The aerodynamic diameter (daer) has a major impact on particle deposition in the
lung, thus determining the site of drug release. The daer is defined as the diameter of
a unit density sphere having the same terminal settling velocity as the particle
sampled [6]. The daer depends on the particle properties such as geometric size,
shape and density, and can be estimated by
Equ. 1: ρgeoaer dd =
where dgeo is the geometric diameter and ρ is the particle density. To achieve the
desired deposition pattern, the daer can be modified by the geometric diameter and
the particle density ρ i.e. by modifying the porosity [10, 11].
Figure 2: Schematic diagram of an Andresen Cascade Impactor taken from ref. [12].
The aerodynamic diameter can be assessed by cascade impactor testing, described
in both European and US pharmacopeias [13, 14] (Figure 2). Particles moving in air
at constant flow rate are subjected to a change in flow direction allowing for size
separation of particles [15, 16]. A port of entry (preseparator) mimicking the
oropharynx, located immediately behind the inhalation device, collects particles with

12
aerodynamic diameters ≥10 µm. Particles of progressively smaller diameters are
collected on arranged stages with decreasing cut off diameters, as the aerosol flows
through the instrument [16]. Particles pass through plates containing jets of defined
size. Particles are collected on a surface located underneath the plate by deflecting
the flow. The particle inertia causes deposition if their size exceeds a critical value,
while smaller particles remain airborne [15, 16].
1.2.2.1. Particle Size
Particle size and morphology mainly influence the aerosol deposition and clearance
during pulmonary drug delivery. Reducing the amount of deposited particles in the
oropharyngeal region to achieve increased lung deposition requires optimum particle
size formulation. The desired particle size to target the peripheral lung compartments
is reported to be daer = 1-5 µm. Particles having diameters between 0.2-1 µm suffer
the fate of being exhaled, while ultrafine particles of 0.005–0.2µm again show high
deposition efficiencies in the deep lung area [17]. Due to limitation of the
administered amount of drug by ultrafine particles and the absence of formulation
technologies to process these particles, ultrafine particles are not used in pulmonary
drug delivery nowadays. Particles with daer exceeding 10 µm will deposit in the
extrathoracic region.
Another aerosol parameter is the particles size distribution (PSD), which is described
by the median particle diameter and its geometric standard deviation. To target best
aerosol performance, small PSD is required [6].
1.2.2.2. Porosity
Edwards et al. discovered that porous particles are advantageous for pulmonary drug
delivery, as they show small daer while having a bigger dgeo. This results in reduced
particle-particle contact and thus fewer tendencies to aggregate. By this increased
efficiency for deep lung deposition can be achieved [10, 11, 18]. Furthermore, large
porous particles can escape macrophage clearance leading to increased
bioavailability and the opportunity for sustained drug delivery [11, 19].

13
1.2.2.3. Particle Shape
Shape engineering is still at its infancy, but during the past decade research gained
more interest in shape as new design parameter to directly influence the particle fate
in vivo [20]. By particle shape the pulmonary deposition pattern after inhalation can
be optimized. Sturm and Hofmann [21] concluded that fibers show higher probability
to deposit in the peripheral lung compared to spherical particles of the same volume.
This can be explained, as the aerodynamic behaviour of elongated particles is mainly
influenced by the fiber diameter. By these higher doses to treat lung diseases, for
example tuberculosis could be administered, targeting macrophages, reducing
systemic side effects and optimizing therapy [22-24].
Pulmonary clearance mechanisms will be greatly influenced by elongated particles,
as macrophage uptake depends on the particle shape at the point of first contact
[25]. Particle size additionally impacts on the success of phagocytosis or whether
frustrated phagocytosis will occur [26]. Particle aggregation and dispersibility also
show shape dependency [27], thus modifying the deposition pattern during
inhalation. Particle geometry has an additional impact on the degradation behaviour
and thereby on the release kinetics of administered drugs [28]. Therefore, new
synthesis strategies to produce particles with well defined dimension and geometry
are highly attractive.
1.2.3. Aerosolization
1.2.3.1. Fine Particle Fraction / Delivered Dose
The efficiency of drug delivery to the lung is mainly influenced by the delivered dose
(DD). This depends on the emitted dose (ED) from the inhaler and the fine particle
fraction (FPF). High fractions of both, ED and FPF are desired. The FPF is
considered to describe the amount of particles with a daer smaller than 4.7µm [16,
29]. To optimize formulation performance, particle adhesion and cohesion both
affecting FPF and ED due to insufficient disaggregation during inhalation, need to be
controlled [30]. The aggregation can be minimized by increasing the dgeo, lowering
powder bulk density, or using particles with irregular surfaces to reduce the contact
area and forces between particles.

14
1.2.3.2. Crystallinity
Powder dispersibility and disaggregation properties can be changed during storage,
i.e. recrystallization, thus modifying the aerosol performance. Particle formulations for
dry powder inhalers (DPI) therefore need to be in their most stable form, i.e.
crystalline to avoid potential changes during storage. Amorphous forms on the other
hand provide fast dissolution kinetics, and are sometimes the only available form of
active ingredients, i.e. many therapeutic proteins [9]. To obtain optimum particle
performance, crystallinity and stability during shelf-life need to be investigated.
1.2.3.3. Outlook for Particle Formulation
Particle engineering for pulmonary drug delivery is greatly restricted by the number of
excipients approved for lung administration by regulatory agencies such as the
European Medicines Agency (EMEA) and Food and Drug Administration (FDA),
including Lactose, Lecithin, Mannitol and Polysorbat [31]. Furthermore, particle
engineering needs high stability and good dispersibility for long shelf life. Narrow
particle size distribution, low surface energy, high chemical and physical stability as
well as non-spherical morphology and low density or high porosity is needed for
optimal aerosol performance. Additionally, the new particle design paradigm asks for
cell targeting and modified release kinetics, making particle design more complicated
and challenging.
1.2.4. Lung Deposition
The pulmonary particle deposition pattern greatly influences the site of action of
delivered drugs. The patient’s breathing pattern and the administered aerodynamic
particle size are the main parameters. Optimal aerosol performance requires
reduction of the amount of powder deposited in the oropharyngeal region and
increase of the amount reaching the targeted lung area.
Particles avoiding deposition in the extrathoracic region enter the lung, where inertial
impaction is the main deposition mechanism in the first airway generations. With
ongoing airway generation and reducing airway diameter, the flow viscosity rapidly

15
decreases, making gravitational deposition dominate the deposition in small bronchial
airways [6] (Figure 3)
Figure 3: Primary mechanisms of deposition of inhaled particles in the respiratory tract taken from ref. [6].
1.2.4.1. Particle Deposition
Particles deposit inside the lung upon striking the mucus layer covering the
conducting airways or interacting with surfactant in the alveolar region. Five main
mechanisms determine the aerosol deposition pattern:
1. Impaction is the main deposition mechanism for particles >1 µm. The
probability increases with increasing daer and airflow velocity. It is the main
mechanism for extrathoracic deposition (nasal and oral cavities) as well as
deposition in the large bronchi.
2. Sedimentation is important for particles with daer >0.5 µm to deposit in the
small bronchi, bronchioles and alveoli. Deposition by sedimentation increases

16
with prolonged residence time in the airways, i.e. breath hold at the end of
inhalation.
3. Brownian motion greatly influences the deposition pattern of particles with
daer<0.5 µm. Decrease of the geometric diameter and increase of the
residence time result in increased deposition by Brownian motion.
4. Electrostatic interactions play the dominant role for deposition of 0.1-10 µm
charged particles and are most important for their deposition in small airways.
5. Interception is most important for fiber morphology, as it requires that the
particle diameter is a significant fraction of the airway diameter. The center of
gravity of an elongated particle is in the gas phase while on of its ends touches
an airway wall.
The effect of particle size on the deposition pattern in the lung is shown in Figure 4. It
is worth noting that particles with daer 0.2-1 µm can be exhaled and thereby have
reduced deep-lung deposition [32].
Figure 4: The effect of particle size and overall inhalation maneuver on the deposition of aerosol particles in the human respiratory tract taken from ref. [33].

17
1.2.4.2. Fiber Deposition
Fibers are a special class of particles, defined by the WHO in 1985 as elongated
objects for which the aspect ratio – the ratio of length-to-diameter - is greater than 3
[34, 35]. The aerodynamic diameter of a fiber as main parameter for lung deposition
is mainly determined by its geometric diameter, while the length is of minor impact
[21, 25]. Su and Cheng [36] showed that fibers have a higher probability to reach the
peripheral lung due to reduced deposition in the oral and nasal airways compared to
spherical particles of the same aerodynamic diameter (Figure 5). Due to their larger
volume, higher payloads can be administered.
Figure 5: Comparison of the deposition efficiencies between fibers and spherical particles in human oral airway and nasal airway hold taken from ref. [36].
1.2.5. Particle Clearance
1.2.5.1. General Considerations
Particle clearance is defined as the movement away from the initial deposition
location of each individual particle. During normal breathing, air, particles and
microorganisms are inhaled. While bigger particles deposit in the upper airways
(nose and throat), smaller particles can sediment into the lung. The mucus covered

18
cilia of the conducting airways and alveolar macrophages clear deposited particles to
maintain in the lung a sterile environment and to protect its primary function, gas
exchange [37].
1.2.5.2. Mucociliar Clearance
The conducting airways are lined by cilia containing epithelial cells and mucus
producing goblet cells. Particles deposited in the tracheobronchial airways interact
with the mucus layer and are cleared by two major pathways. The major pathway
thereby is mucociliar clearance, where the mucus is transported towards the throat
by metachronal coordinated movement of the cilia followed by swallowing [33]. The
second pathway is the absorption of material across the epithelium. Most particles
deposited on mucus are cleared within 24 – 48 h after deposition [6].
1.2.5.3. Alveolar Clearance
There are no cilia and no mucus in the alveoli. Alveolar macrophages (AM) are
therefore responsible for phagocytosis of foreign material deposited inside the lung.
Particles in the size range 0.5-2µm, with a maximum at 1µm, manifest the highest
deposition probability in the alveolar region [38]. After phagocytosis, the
macrophages are either removed by mucocilliar clearance or penetrate into the
peripheral lung. Long residence times in the peripheral lung might cause diseases
(silicosis, asbestosis). A smaller fraction of particles can be cleared by AM derived
transport across the alveolar epithelium membrane [6].
1.2.5.4. Outlook for Particle Formulation
Sustained drug release in pulmonary drug delivery requires prolonged residence
times of particles within the lung. Thus strategies to slow down mucociliar clearance
as well as to circumvent or prolong particle uptake by alveolar macrophages are
required. These strategies allow release kinetics determined by the dissolution
kinetics of the carrier system. Long acting formulations with reduced clearance will
improve patience compliance due to increased dosing interval.

19
1.2.6. Multifunctional Drug Delivery
The recent times have seen an increase in research effort to design of multifunctional
particles to create, improved and more complex drug delivery systems. Increased
stability, prolonged in vivo circulation, desired biodistribution as well as targeting and
responsive release triggered by physiological stimuli are important characteristics for
drug delivery vehicles [39]. Four main components are most often desired to be
incorporated (Figure 6):
1. Matrix component as basis to incorporate additional components
2. Active pharmaceutical ingredient (API)
3. Imaging domains including organic dyes and/or semiconductor quantum dots
(QD) [40], as well as magnetic sub-domains (Fe3O4) for magnetic resonance
imaging [41]
4. Targeting agent such as antibodies or magnetic sub-domains (Fe3O4) [42-45]
These complex particles will be the next generation of drug carriers, which can be
used as therapeutic and/or diagnostic agents, named theranostics, and offer the
possibility of simultaneous targeted drug delivery of various agents combined with
triggered release kinetics [46].
Figure 6: Multifunctional particle containing multiple sub-components such as API, Fe3O4 particles, imaging probes and targeting agents (i.e. antibodies).
Targeting agent
Imaging probe
Matrix
API

20
1.3. Asymmetric Particles in Vivo
Recently, elongated particles have been rapidly emerging in biomedical and
biotechnological applications. Aspects about distribution and interaction pathways of
asymmetric particles are still not clearly understood due to limited availability of
model particles for intensive studies under controlled conditions. Increased blood
circulation of filomicelles were reported lately [47, 48], as well as shape induced
inhibition of phagocytosis [25]. New synthesis strategies are therefore urgently asked
for.
1.3.1. General Considerations
Asbestos and carbon nanotubes (CNT) represent a group of microfibers widely used
in material science due to their good isolation and electrical properties. Asbestos was
extensively used in the 20th century during house construction and many other
application fields. After the confirmation in 1970 that long term inhalation of Asbestos
can cause malignant lung cancer (mesothelioma), the European Union banned all
use of asbestos. CNT show dimensions comparable to Asbestos, and are therefore
under suspicion to posses comparable health related effects. Due to the fiber
structure and biopersistence Asbestos and CNT exhibit high lung deposition, thereby
causing inflammation and lesions in membrane cells.
Asbestos describes a group of hydrated silicate fibers and can be divided into six
types based on their different chemical and physical properties, namely chrysolite,
crocidolite, amosite, anthophyllite, tremolite and actinolite [49]. Asbestos as natural
occurring silicate shows high heat resistance and has been therefore widely used for
isolation [50]. Due to its fibrous structure it can be easily incorporated into cement
materials, brakes, pipes and boiler insulation, making it an ideal material for large
scale use [51]. Upon ongoing exposure a pandemic of lung diseases in the middle of
twentieth century developed [52], resulting in a deep mistrust in fibrous particles that
are small enough to be inhaled. During the last decade, carbon nanotubes, rolled up
graphene sheets, gained increased attention for their use in medicine, electronics
and aerospace industries due to its shape, electrical, mechanical and thermal
properties [53]. CNT comprise various types of cylindrical carbon forms, differing in

21
shape and/or chemical composition, thereby showing different in vivo response.
Again the toxicology and health effects of such nano-sized fibers are widely
discussed in literature, trying to avoid another upcoming pandemic caused by fibrous
material.
1.3.2. Carbon-Nanotubes
CNT are composed of a single sheet of graphite rolled up to form a cylinder, and are
classified into two categories, multi-walled carbon nanotubes (MWCNT) and single-
walled carbon nanotubes (SWCNT). The length of CNT is determined by the
synthesis time, while the diameters of the SWCNT are controlled by the starting
metal nanoparticles, varying between 0.8 – 3nm for SWCNT and 10-200nm for
MWCNT [54].
The pathogenicity of fibers is influenced by various parameters, where the three Ds:
dose, dimension and durability of fibers have the highest impact. The fiber
dimensions show a major impact on the deposition pattern inside the lung as well as
on the clearance kinetics. Thereby CNT bundle held together due to attractive Van
der Waals forces will have a modified deposition pattern compared to well dispersed
single nanotubes [55]. The higher the administered dose, the higher the fibrosis
incidence is. Durability of fibers inside the lung is mainly influenced by the fiber
dissolution kinetics. The higher the dissolution kinetics, the lower the toxicology
profiles will be [56] as well as the clearance by mucociliar action or phagocytosis.
Furthermore chemical and surface properties will influence the toxicity profile of fibers
inside the lung.
Two factors mainly contribute to the airborne fiber toxicity, namely the surface area
and surface reactivity [57]. CNT contain impurities on the fiber surface caused by
their synthesis strategy, metals like Co, Fe or Ni, of which some are also present in
asbestos, contribute to their toxic effect. Due to the increased surface area per unit
mass for nanoparticles, any intrinsic toxicity of present impurities will be emphasized
[58].

22
1.3.3. Health Effects
Shortness of breath and dry cough are most common symptoms of asbestosis due to
the restrictive defects and the decrease in diffusion capacity [59]. Fibers such as
asbestos cause fibrosis and cancer either due to the direct effects of fibers on cells or
as a result of oxidative stress from fibers on the inflammatory response. Asbestosis
and silicosis are both characterized by a persistent inflammatory response. The
development of asbestosis requires a prolonged exposure to fibrous material; further
factors governing the appearance of the disease are the fiber dose, fiber type and
smoking. Only above a threshold concentration asbestosis will occur [60].
Inflammation and fibrogenesis caused by fibers can be linked to their surface
chemistry as an important driving force for oxidant production and additional harmful
reactions in the lung. Due to the length of fibrous materials, frustrated phagocytosis
by alveolar macrophages can occur, resulting in release of proinflammatory markers
[60]. Inflammation can result in numerous pathological processes such as fibrosis,
airway diseases or cancer [61].
Fiber accumulation in the lung is caused by inefficient phagocytosis by alveolar
macrophage and insufficient degradation under physiological conditions of fibers and
thereby their clearance from the lung [54]. Further Davis and Jones [62] showed that
longer fibers were more fibrogenic than short fibers, which can be explained by the
slower clearance kinetics by macrophages above a threshold of ~16 µm [63], by the
increased surface area and high aspect ratios [64].
Due to the inflammatory effect and resulting severe lung diseases (i.e. fibrosis and
cancer), fibers of inhalable size should undergo extensive toxicological testing before
large scale use.
1.3.4. In Vivo Circulation
Increased in vivo residence time is desired for prolonged drug delivery, in order to
provide sufficient time for complete drug release. Filomicells show ten times longer
blood circulation times compared to spherical particles [47], by this demonstrating the
importance of the drug carrier shape. Increased mucoadhesion in the gastro

23
intestinal tract (GI) of glass beads, where the long nanowires provided the greatest
adhesion was demonstrated by Fischer et al. [65]. This effect could be explained by
increased Van der Waals forces in combination with increased surface area, which
can also be found in gecko feet [66]. Mucoadhesion in the lung would result in
decreased mucociliar clearance, by this enabling prolonged drug release in
pulmonary delivery.
1.3.5. Macrophage Clearance
Target geometry plays an important role during macrophage recognition, being the
first step in target elimination [67]. During phagocytosis, Fc receptors are responsible
for initial recognition by binding to antibody coated targets [68]. The binding of
ligands to the Fc receptors causes activation of intracellular signalling cascades,
resulting in formation of an actin cup, which is essential for phagocytosis.
Polymerization of actin into coordinated structures promotes the membrane to push
around the particle to start and finalize phagocytosis [69]. Particle shape can affect
the ingestion process, while particle size can influence the efficiency of uptake and
the extent of actin organization [70, 71]. Champion et al. compared macrophage
uptake of spherical particles with worm shaped particles, where the internalization of
worms was up to ~20 times slower than that of spheres of the same volume [20, 25].
Figure 7: Coloured scanning electron micrograph of alveolar macrophages (brown) interacting with PS particles (purple). Scale bar = 10µm (a) and 5µm (b,c) respectively hold taken from ref. [69].
Investigation of the target shape at the point of first contact with macrophages and by
this the incidence angle between macrophage and particle determines whether

24
macrophages will only spread on the particle surface or if an actin cup for
phagocytosis will be formed. Elongated particles were only taken up from the pointy
edge (Figure 7). Furthermore, the particle size was found to be the predominant
parameter to influence successfull phagocytosis when the target volume is smaller
than the macrophage volume [72] (Figure 8).
Figure 8: Role of target geometry in phagocytosis hold taken from ref. [72].
1.4. Asymmetric Particle Preparation
1.4.1. State of the Art
To date, polymeric nano-fibers and nano-tubes for therapeutic lung targeting have
had limited importance. Polymeric nano-fibers and nano-tubes can be manufactured
both by methods of self organization and by means of template procedures. The
preparation of polymeric nano-fibers and nano-tubes by template procedures permits,
contrary to the methods of self organization the custom-made tuning of physical,
chemical and biological characteristics of the aimed structures and thus renders a
larger range of variation.
Up to date, four methods are mainly used to synthesise nanofibers or nanotubes, as
described below: electrospinning, co-electrospinning, TUFT process and the template
technique.
C

25
1.4.2. Electrospinning
Electrospinning is an efficient technique for polymer fiber fabrication, as it allows the
production of continuous fibers from various polymers [73]. During the
electrospinning process, a high voltage of several kV is applied onto the spinning
solution, where the positively charged electrode is submerged in the solution and the
negatively charged electrode is located at the collector plate. The spinning solution
forms a droplet at the outlet capillary due to surface tension. By applying the electric
field, charging of the droplet occurs. Increasing the electric field leads to the
elongation of the droplet the moment the electrostatic repulsion overcomes the
surface tension [73], by this forming a charged jet which is ejected from the tip.
During spinning the jet is exposed to circular bending motions causing strong
elongation and jet thinning [74]. The solvent evaporates during the spinning process,
and dried fibers can be collected on the collector plate (Figure 9).
Figure 9: Schematic diagram for electrospinning (modified from www.dfg-nanohale.de).
The main process parameters influencing the product quality are the solution
properties, mainly viscosity, surface tension, elasticity and conductivity. For example
Polymer solution
Capillary tip
Fiber formation
Counter electrode
High voltage

26
higher viscosity will result in larger resulting fiber diameter [75]. Additionally, the
electric potential at the capillary tip has a major impact on the fiber diameter, as with
higher voltage more fluid will eject from the tip. Furthermore the tip-collector distance
determines the diameter and fiber morphology [73]. A precise parameter control is
necessary in order to avoid bead and defect incorporation during spinning.
Continuous fibers with dimensions within the range of several micrometers down to a
few nanometers can be obtained. Drugs can be incorporated directly into fibers by
electrospinning [76]. The infinitely long fibers have to be cut prior to drug delivery to a
given length by mechanical methods or by UV cutting, respectively.
Co-electrospinning allows for the incorporation of nanoparticles (NPs) and functional
polymer segments [73], by blending the spinning solution with NPs [77].
A major drawback of electrospinning is the burst release of incorporated drugs.
Furthermore no precise control over the fiber length is possible during the spinning
process.
1.4.3. Tubes by Fiber Template (TUFT)
The TUFT process uses fibers as templates to create fibers with diameters between
ten nanometres and a few micrometers. The crucial step is the formation of the
template fibers, which are mainly formed by electrospinning [78]. The template fibers
are coated by means of vapour deposition, dipping processes, spraying procedures
or by processes involving plasma treatment [74]. Hollow fibers can be produced
using this technique by removing the template fiber by solvent or annealing after
desired material deposition, yielding hollow fibers (Figure 10).
Figure 10: Schematic diagram of the TUFT process.

27
1.4.4. Template Technique
The template technique is a well established method to produce nanorods and
nanofibers of defined dimensions [79-85]. A hard membrane with straight pores is
used as template, where the pore diameter and membrane thickness define the
resulting microfiber dimension (Figure 11). Infiltration of the desired material with
subsequent template decomposition yields tubes and rods with defined aspect ratios.
Martin established the method by infiltration of monomers and subsequent oxidative
polymerisation, before Steinhart et al. extended the infiltration procedure to polymer
melts and solutions [79, 82-85]. Nowadays various approaches for material
deposition onto the membrane pore are reported in literature. Wetting [83-86],
chemical vapour deposition [87], electrodeposition [80], layer-by-layer (LbL) [88-94]
and in situ polymerization are only few to mention. Tubes have been synthesized for
various applications [95], such as drug delivery [96, 97], bioseparation [98], DNA
delivery [99-101] and MRI imaging [40, 102]. Template degradation yields liberated
nanostructures.
Figure 11: Schematic diagram of the template technique.
To circumvent the template decomposition and thus overcoming a bottleneck of the
template technique, Grimm et al. [103, 104] invented a non-destructive mechanical
release procedure allowing for later scaling-up of the template technique.
1.4.4.1. Template Fabrication
Template fabrication is a crucial step during fiber fabrication using the template
technique, as the resulting fibers are negatives of the pore structure. Commonly two
types of membrane are used, containing straight pores of cylindrical shape, namely
track-etched polymer membranes and nanoporous anodic aluminium oxide (AAO)
[105]. The more uniform and higher the pore density, the greater the number of well

28
structured fibers produced per template membrane [80]. Both membrane types are
commercially available, having advantages and disadvantages for the fiber
preparation as discussed below.
1.4.4.1.1. Anodization
Masuda and Fukada [106] first described the two step electrochemical etching of
Al2O3-structures with ordered pore orientation containing straight pores with
monodisperse diameter ranging from 20 nm-4 µm (Figure 12).
Figure 12: Scanning electron micrographs of a) cross-section and b) top of a commercially available anodically etched alumina membrane.
The electrochemical growth of aluminium oxide from aluminium metal in acidic media
[107, 108] is a four step process as depicted in Figure 13. First a uniform barrier of
oxide is formed on the aluminium substrate. Due to fluctuations at the Al2O3 surface,
field-enhanced dissolution of oxides occurs in the oxide layer [109]. Pore growth
originates from these fluctuations and the field strength focus. Thickening of the film
at the protuberances concentrates the current. The film growth attempts to reach
uniform film thickness in order to maintain constant field strength [110]. O2- and OH-
ions produced by splitting of H2O at the oxide-electrolyte-interface migrate across the
metal and react at the metal-oxide-interface with generated Al3+ ions. An equilibrium
state of oxide formation and field-enhanced dissolution of alumina at the pore bottom
leads to homogeneous pore growth at the pore openings, limited by the chemical
dissolution kinetics.
a
20µm 200nm
b

29
Figure 13: Schematic configuration of pore growth: 1.) growth of barrier-oxide; 2.) formation of fluctuations; 3.) beginning of pore growth; 4.) stable pore growth taken from ref. [111].
For templating AAO membranes have the advantage to be heat stable and resistant
to organic solvents allowing for material infiltration at elevated temperatures and pore
filling of organic materials using organic solvents [105]. Commercially available AAO
suffer from the non-uniformity of their pore-structure. Many pores are interconnected
and do not show homogenous hexagonal orientation (Figure 12). These membranes
are sufficient for proof of concept studies, but for more detailed structure analysis of
prepared tubes, tailor-made membranes should be used [111]. AAO membranes
form tubular structures during etching, comparable to microfibers produced by the
template technique [89, 112]. The chemical identity of microfibers prepared by the
template technique in AAO membranes should therefore be confirmed by different
types of measurements, such as XRD, additional to SEM investigations.
1.4.4.1.2. Track Etching
The track etch method was first described by Fleisher et al. [113]. Nonporous sheets
of desired material are bombarded (“tracked”) with ion beams, producing latent tracts
within the material [105]. During bombarding new polymer chain ends and other
chemically reactive sites are formed, as fast charged particles eject electrons from
Electrode Electrolyte
Al3+↑ Al2O3 O2-/OH-↓
-+
1. 2.
3. 4.
Aluminum

30
atoms close to their path. Pore formation occurs during wet chemical etching of the
produced latent cracks (Figure 14) [80]. Pore diameters down to 10nm can be
obtained by track etching, and pore densities of up to 1010 pores per square
centimetre, where the pore diameter and density can be varied independently. As the
incident ion beams form an angle of up to 34° with respect to the surface normal,
pores may intersect inside the membrane [114].
Polycarbonate is mainly used as track etched membrane for template synthesis [80,
97, 99, 115-117]. Due to interconnected pores, cross-linked particles during template
synthesis may occur. Furthermore the use of track etched membranes is restricted by
their limited heat resistance and instabilities in organic solvents.
Figure 14: SEM images, a) cross-section and b) top of a commercially available track etched polycarbonate membrane.
1.4.4.2. Infiltration
A variety of strategies have been developed to deposit material inside template
membranes in order to synthesise fibers and tubes of defined dimension. Wetting
[83-86], electrodeposition [79, 80, 118, 119], layer by layer (LbL) [88, 89, 91-94, 120]
and in situ polymerization are only few to mention [114].
Martin et al. [80] first described the use of AAO membrane pores as template for
electrodeposition. By coating one side of the membrane with a metal film, a cathode
for electroplating of metal nanowires (i.e. Au, Ni) is formed. The length of the
resulting metal nanowires can be precisely controlled by the deposited amount,
where the deposition time mainly influences the resulting wall thickness [80, 114].
a b
20µm 200nm

31
The material growth on the pore walls can thereby be explained by formation of
polycations, resulting in solvophobic interactions between the polymer and the pore
walls. Nowadays also conductive polymers (i.e. polyanilin and polypyrol) can be used
to form tubes by electrodeposition [121, 122].
Besides electrodeposition, polymerization can be used for material infiltration into
membrane pores, by immersing the membrane into a monomer solution containing
the polymerization agent. As the polymers preferentially nucleate and grow in the
membrane pores, short deposition times result in tube formation, while increased
deposition times yield solid fibers [121, 123].
Template wetting as infiltration technique allows the infiltration of a broad range of
materials. Up to now, it is poorly understood as many parameters influence the rod-
or tube formation during the infiltration process. The wetting process can be
represented by capillary wetting and precursor wetting, both being two different
kinetic routes to the equilibrium of pore wetting, which is characterized by complete
filling of the pores with polymer [124]. Due to wetting of a substrate with liquid, the
surface energy of the substrate will be lowered, resulting in free energy as driving
force of the wetting procedure [111]. Therefore the parameter determining the wetting
mechanism is the energetic and entropic energy required to remove the polymer
chains from the bulk reservoir and draw them into the pores.
Interfacial interactions dominate the infiltration process. According to Young’s law
Equ. 2: LV
SLSV
γγγ
θ−
=cos
with SLγ = interfacial tension of solid-liquid
SVγ = surface tension of the substrate
LVγ = surface tension of the liquid
θ = contact angle
the surface energy of the substrate, the surface tension of the liquid and the liquid-
solid-interfacial energy determine the contact angle at the liquid-vapour-solid

32
interface [105]. A zero contact angle is equivalent to the spreading of the liquid,
resulting in maximization of the liquid-solid contact area [125]. Therefore wetting
occurs when adhesion forces acting between liquid and surface are larger than
cohesion forces inside the liquid.
Figure 15: Schematic diagram of a liquid drop spreading on a smooth substrate taken from ref. [105].
Low surface energy melts spread on high surface energy substrates by the formation
of a precursor film of nanometer thickness [84, 85, 125] (Figure 15). With ongoing
spreading more and more liquid is transferred into the precursor film, where Van der
Waals forces are the underlying driving force for wetting of the complete pore within
tens of seconds [83]. The wetted state is kinetically stable, but thermodynamically
instable. The cohesive forces needed for complete pore filling are weak and need to
overcome the considerably strong viscous forces of the wetting fluid.
If the infiltration conditions do not allow for precursor film formation, filling via
classical capillarity proceeds [105]. As the strong adhesive forces are too weak to
drive single molecules from the bulk reservoir to form the spreading precursor film, a
meniscus is formed and slowly moves into the pores. A solid cylinder of the liquid but
viscous polymer moves until the pore is entirely filled [126]. During solvent
evaporation the polymers adsorb onto the pore walls, where the polymer
concentration is the crucial parameter determining whether solid or hollow tubes are
obtained [127]. Precursor wetting occurs for low molecular weight polymers, while
capillary wetting takes place for higher molecular weight polymers [86, 105]. Solid
polymers melt by heating well above their glass transition temperature and wet high
surface energy pore walls via precursor wetting [124]. Besides the molecular weights
of infiltrated polymers and infiltration temperature, the pore diameters of template
membranes influence the structure of the resulting particle. The pores with diameters
spreading drop
precursor film precursor film
Substrate

33
twice smaller than the gyration radii of the infiltrated polymers result in complete filling
of the hollow space of the pores, thus yielding solid rods [128, 129].
Tubes and rods are obtained either by cooling polymer melts below their solidification
temperature, or via solvent evaporation, allowing processing of high performance
polymers like PTFE [85].
The layer by layer technique offers an additional method for material infiltration into
template pores. By this technique, a nanoscopic multilayer system with precisely
controlled layer composition can be obtained [105]. LbL offers the advantages of
being a well established, simple, versatile and low-cost strategy technique on flat
surfaces [117]. The assembly process details will be discussed below.
1.4.4.3. Layer by Layer Technique
The layer by layer (LbL) technique has been developed for fabrication of multilayers
of tailored architecture by alternate adsorption of polyanions and polycations [130].
By dipping a charged substrate alternating into aqueous solutions of oppositely
charged polyelectrolytes, the polyelectrolytes are deposited LbL onto the substrate
[131, 132] (Figure 16). The electrostatic assembly process is driven by the gain in
entropy due to the release of counterions [133], where electrostatic repulsion restricts
polyelectrolyte adsorption to a single layer [111, 134]. This opens the possibility for
oppositely charged molecules to adsorb during the next deposition step, allowing
controlled build up of multilayers. Due to charge reversal during each adsorption
step, the number of deposited layers can be unlimited. Film thickness can therefore
be tuned by the number of adsorbed layers [91], each having a thickness determined
by the deposition conditions, ranging between several angstroms and few
nanometers [135]. As the process is solution based, the choice of the substrate is not
limited by the surface size and/or morphology [99]. The LbL technique has been
extended for coating spherical particles as substrates [136-138]. Nowadays spherical
particles are widely used in preparation of hollow polyelectrolyte capsules by core
dissolution after polyelectrolyte assembly.

34
Figure 16: Schematic diagram of the layer by layer technique taken from ref. [130].
The interactions to apply the LbL technique have been extended from electrostatic
interactions to various kinds of interactions, including H-bonding [93], hydrophobic
interactions and amide bonds. By this a broad range of materials including biological
macromolecules [139], dyes [140] and nanoparticles [141] can be incorporated. The
easily prepared multilayered films of various compositions allow control of the
permeability and physicochemical properties of the multilayers [142, 143]. Besides
dipping, multilayer build-up can be prepared using spraying [144] or spin coating [79],
opening for more time-efficient assembly processes. The versatile, fast, and simple
preparation with a broad variety of materials being used allows the application of LbL
in various fields, such as drug delivery, implant coating and many others [117].
1.4.4.3.1. Polyelectrolytes
Polyelectrolytes are charged polymers. They can be divided into poylcations bearing
positive charges and polyanions with negative charges. Polymers containing both
positively and negatively charged segments are polyampholites. Most prominent
natural occurring polyelectrolytes are proteins and DNA.
Polyelectrolytes, although having a hydrophobic backbone, are soluble in water due
to the gain in entropy by the release of counter ions into solution [145]. The

35
polyelectrolyte properties depend on the fraction of dissociated groups, solvent
quality for the polymer backbone and the salt concentration. Polyelectrolytes, with
ionization degree independent of the environmental pH are regarded as strong
polyelectrolytes. In contrast, weak polyelectrolytes show pH dependent ionisation,
and the ionization degree can be described by the Henderson-Hasselbalch-equation
Equ. 3: ))()(lg( −+=
AcHAcpHpKa
On account for the non cooperative interactions between neighbouring groups, an
apparent pKa is defined, as unprotonated groups with charged neighbours have
higher effective pKa compared to groups with non charged neighbours, resulting in
broadened titration curves [146].
Due to the electrostatic interactions, polymer conformation in solution is largely
determined by the ionic strength of the solution. Free ions assemble onto charged
groups, thus screening charges along the polyelectrolyte chain. The electrostatic
repulsion along the chain decreases at high salt concentrations allowing
polyelectrolytes to behave as uncharged polymers, leading to coil formation. At low
ionic strength the repulsion between the charges of polycation or polyanion is large,
thus stretching the polymer.
1.4.4.3.2. Layer by Layer Self Assembly
Ladam et al. [147] introduced the zone model to describe multilayer formation during
LbL formation. Multilayered films can be divided into three zones, where the borders
between the zones are not sharp but gradual [131] (Figure 17).

36
Figure 17: Schematic diagram of the zone model of polyelectrolyte multilayer assembly. The concentration profile on the right depicts the strong overlap between adjacent layers taken from ref. [131].
Zone I describes the precursor zone located closest to the substrate. The layer
structure is thereby influenced by the solid substrate, resulting in slightly decreased
layer thickness in zone I compared to the bulk film.
Zone III is the outer zone being in contact with the solution. Polymer chains dangle
into solution and excess charges determine the local zone properties [145].
Zone II is referred to as the bulk phase. During polyelectrolyte adsorption only this
layer grows after zone I and III reached their final composition. The newly deposited
layer will be adsorbed onto the outermost layer comprising zone III, and thus the
transition zone between II and III will move up layer by layer [147].
Multilayer thickness depends on various parameters such as the substrate
composition, polyelectrolyte properties, and the deposition conditions. The choice of
polyelectrolytes mainly impacts upon the growth regime, due to the impact on
penetration depth for diffusing polyions. Exponential growth of multilayers can be
observed during the development of zone III, where the amount of deposited
polyelectrolytes increases with ongoing assembly. After a critical thickness is
reached, determined by the choice of assembled polymers, the penetration depth of

37
polyions is limited, resulting in linear growth of zone II. The diffusion depth thereby
influences the extent of layer interpeneration [131, 145].
By variation of the ionic strength [148], precise control over the layer thickness can
be achieved. High ionic strength mainly influences the polymer coil conformation in
solution. Due to shielding of charges, polymers arrange in low gyration radii. During
adsorption of coiled polymers onto the substrate surface, increased layer thicknesses
are obtained, accompanied by increase in surface roughness [149]. The
rearrangement of chains after multilayer assembly is hindered by the kinetic stability
of the multiple ionic bonds formed between highly interconnected polymers.
The film structure can be modified by high ionic strength [150]. Rearrangement of
polyions can be promoted by high ionic strength. Due to the screening of charges by
small ions, smoothening and additional interdiffusion of polymer chains can be
observed [151]. Very high ionic strength films that are not stabilized by additional
interactions, such as hydrophobic or H-bonding, are decomposed due to loosening of
electrostatic interactions [152].
Weak polyelectrolytes can be assembled into multilayers. These films show pH
sensitivity, since upon pH changes the ionization degree of weak polyelectrolytes is
affected [133, 153]. The generation of electrostatic repulsions between the layers
leads to restructuring of the film network, and thus to swelling, roughness changes or
decomposition, making weak polyelectrolytes suitable building blocks for sacrificial
layers [145, 154-156].
Temperature also influences the internal structure of multilayer assemblies. Köhler et
al. [157] showed that polyelectrolyte capsules shrink in aqueous environment upon
heating. Shrinkage is accompanied by an increase of wall thickness.
The responses of multilayered films to external stimuli [158] render the LbL technique
a versatile method for drug delivery application.
38
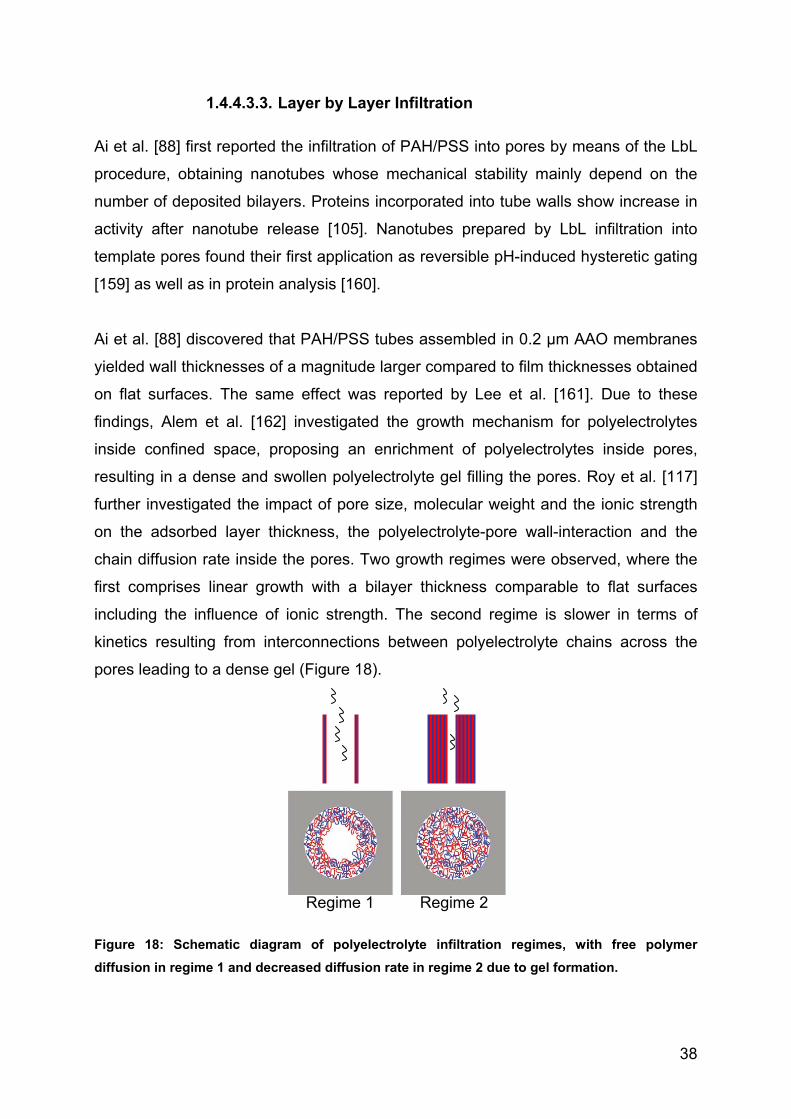
1.4.4.3.3. Layer by Layer Infiltration
Ai et al. [88] first reported the infiltration of PAH/PSS into pores by means of the LbL
procedure, obtaining nanotubes whose mechanical stability mainly depend on the
number of deposited bilayers. Proteins incorporated into tube walls show increase in
activity after nanotube release [105]. Nanotubes prepared by LbL infiltration into
template pores found their first application as reversible pH-induced hysteretic gating
[159] as well as in protein analysis [160].
Ai et al. [88] discovered that PAH/PSS tubes assembled in 0.2 µm AAO membranes
yielded wall thicknesses of a magnitude larger compared to film thicknesses obtained
on flat surfaces. The same effect was reported by Lee et al. [161]. Due to these
findings, Alem et al. [162] investigated the growth mechanism for polyelectrolytes
inside confined space, proposing an enrichment of polyelectrolytes inside pores,
resulting in a dense and swollen polyelectrolyte gel filling the pores. Roy et al. [117]
further investigated the impact of pore size, molecular weight and the ionic strength
on the adsorbed layer thickness, the polyelectrolyte-pore wall-interaction and the
chain diffusion rate inside the pores. Two growth regimes were observed, where the
first comprises linear growth with a bilayer thickness comparable to flat surfaces
including the influence of ionic strength. The second regime is slower in terms of
kinetics resulting from interconnections between polyelectrolyte chains across the
pores leading to a dense gel (Figure 18).
Figure 18: Schematic diagram of polyelectrolyte infiltration regimes, with free polymer diffusion in regime 1 and decreased diffusion rate in regime 2 due to gel formation.
Regime 1 Regime 2

39
In the first growth regime free diffusion of the infiltrated polymer is possible, as the
pore diameter is large enough compared to the hydrodynamical radius of the polymer
chain. If 70% of the pore diameter is filled by assembled polyelectrolyte multilayers,
infiltrating polymer chains establish interconnections across the pore. This
entanglement increases with ongoing deposition cycles resulting in dense gel
formation. The formed gel slows down the diffusion rate and therefore polyelectrolyte
multilayer growth. Even though the influence of ionic strength and the molecular
weight in the second growth regime could not be confirmed in the study by Roy et al.
[117], both parameters influence the polyelectrolyte conformation and may therefore
have an impact on the gel formation.

40
2. Aim of this Work Aerosolization and the deposition site are mainly influenced by the particle size and
morphology. Additionally, pulmonary clearance mechanisms affecting the particle
retention inside the lung and their release properties can also be modified by particle
dimensions. Thus by optimizing the deposition pattern and circumventing the
clearance from targeted lung areas, particle engineering aims for targeted drug
delivery systems [9]. As particle shape may allow for drug delivery to specific cell
types leading to targeted drug delivery, side effects due to untargeted delivery can be
reduced.
The aim of this work was to develop a new and versatile method to produce
biodegradable, biocompatible fibers for controlled drug delivery. These fibers shall
allow for optimized particle deposition in the peripheral lung and furthermore shall
minimize macrophage clearance to allow for systemic and/or retarded aerosol
therapy.
The major aims of this thesis were:
1.) To develop a new and feasible method to produce biocompatible, biodegradable
fibers via the template technique.
2.) To test the macrophage response on fiber shape and size.
3.) To investigate the aerosolization behaviour of the obtained fibers.

41
3. Template assisted Polyelectrolyte Encapsulation of Nanoparticles into Dispersible, Hierarchically Nanostructured Microfibers
This chapter is the pre-peer reviewed version of the following article that will be
published in Advanced Materials:
Kohler D., Schneider M., Krüger M., Lehr C.-M., Möhwald H., Wang D. (2011):
Template-Assisted Polyelectrolyte Encapsulation of Nanoparticles into Dispersible,
Hierarchically Nanostructured Microfibers.
42
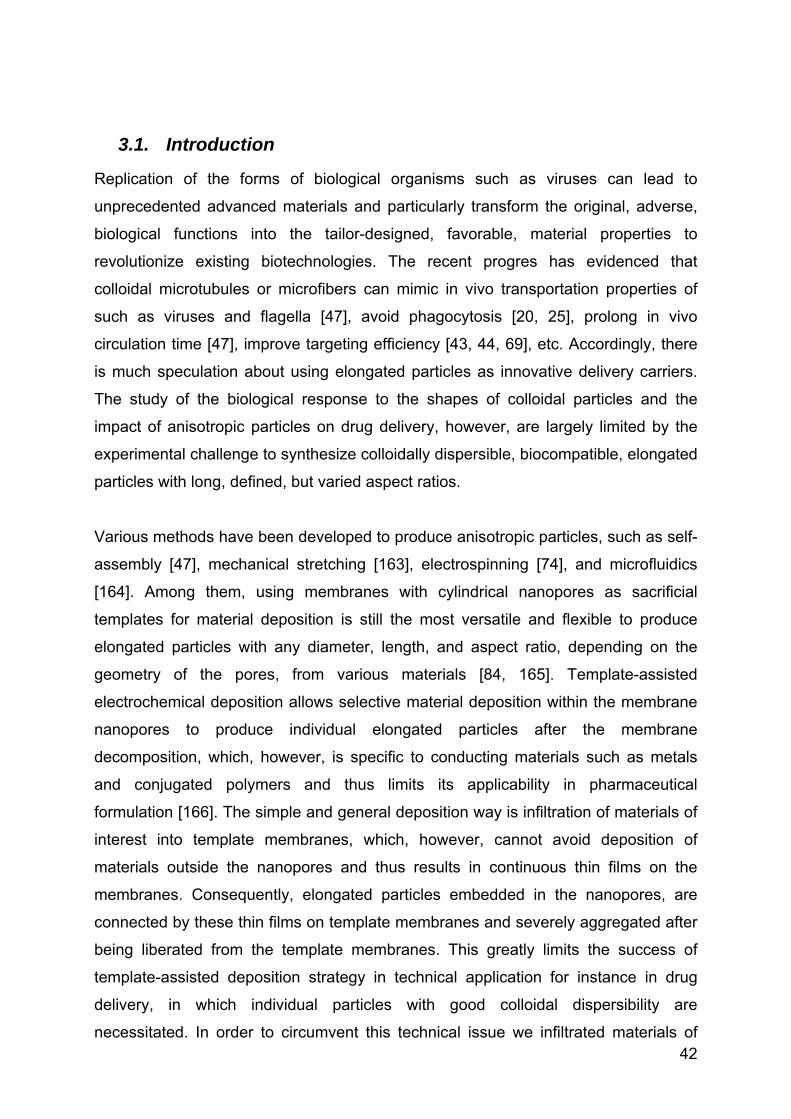
3.1. Introduction
Replication of the forms of biological organisms such as viruses can lead to
unprecedented advanced materials and particularly transform the original, adverse,
biological functions into the tailor-designed, favorable, material properties to
revolutionize existing biotechnologies. The recent progres has evidenced that
colloidal microtubules or microfibers can mimic in vivo transportation properties of
such as viruses and flagella [47], avoid phagocytosis [20, 25], prolong in vivo
circulation time [47], improve targeting efficiency [43, 44, 69], etc. Accordingly, there
is much speculation about using elongated particles as innovative delivery carriers.
The study of the biological response to the shapes of colloidal particles and the
impact of anisotropic particles on drug delivery, however, are largely limited by the
experimental challenge to synthesize colloidally dispersible, biocompatible, elongated
particles with long, defined, but varied aspect ratios.
Various methods have been developed to produce anisotropic particles, such as self-
assembly [47], mechanical stretching [163], electrospinning [74], and microfluidics
[164]. Among them, using membranes with cylindrical nanopores as sacrificial
templates for material deposition is still the most versatile and flexible to produce
elongated particles with any diameter, length, and aspect ratio, depending on the
geometry of the pores, from various materials [84, 165]. Template-assisted
electrochemical deposition allows selective material deposition within the membrane
nanopores to produce individual elongated particles after the membrane
decomposition, which, however, is specific to conducting materials such as metals
and conjugated polymers and thus limits its applicability in pharmaceutical
formulation [166]. The simple and general deposition way is infiltration of materials of
interest into template membranes, which, however, cannot avoid deposition of
materials outside the nanopores and thus results in continuous thin films on the
membranes. Consequently, elongated particles embedded in the nanopores, are
connected by these thin films on template membranes and severely aggregated after
being liberated from the template membranes. This greatly limits the success of
template-assisted deposition strategy in technical application for instance in drug
delivery, in which individual particles with good colloidal dispersibility are
necessitated. In order to circumvent this technical issue we infiltrated materials of

43
interest in the form of nanoparticles (NPs) rather than single molecules into
nanoporous membranes and then encapsulate these NPs located in the nanopores
by polyelectrolytes [61] based on electrostatic attraction (Figure 19). The present
protocol referred to as template-assisted PE encapsulation of NPs, leads to
colloidally dispersible, hierarchical, nanostructured microfibers. It can directly be
generalized for pharmaceutical formulations and the microfibers obtained can be
used as sophisticated carriers for drug loading and delivery.
Figure 19: Schematic depiction of template-assisted polyelectrolyte encapsulation of NPs without polyelectrolyte coating to produce colloidally dispersible, hierarchical, nanostructrured microfibers.
3.2. Materials and Methods
3.2.1. Particle Infiltration
Despite being of theoretical interest for decades [167], packing of spheres in
cylindrical cavities has recently been experimental implemented [168-170]. However,
few experimental protocols developed thus far can be adapted for pharmaceutical
formulations. Commercially available, monodisperse, spherical SiO2 nanoparticles
with the sizes in the range of 400 – 1000 nm were used as models of drug
aggregates in the present proof-of-concept study for the benefit of characterization.
The major technical advantage of using NPs instead of single molecules for
infiltration is threefold: 1) to exclusively block the NPs in the pores of the template
membranes by placing additional membranes with pore sizes much smaller than the
NP sizes underneath the template membranes, as shown in Scheme 1; 2) to easily
fill the template nanopores with a maximum volume fraction of NPs by one or two
times infiltration of dilute NP dispersions (0.1 wt%); 3) to easily wipe away NPs

44
deposited on the membranes by tissue papers, thus obviating the risk of
interconnecting of the NP aggregates confined in the template nanopores.
3.2.2. Microfiber Formation
Negatively charged SiO2 NPs, loaded within the nanopores, were subsequently
encapsulated by alternating infiltration of positively charged polyallylamine
hydrochloride (PAH) and negatively charged poly(sodium 4-styrenesulfonate) (PSS)
through template membranes (Figure 19). Aqueous solution of each PE (3 mg/mL in
the presence of 0.5M NaCl) was infiltrated 3 or 4 times to efficiently encapsulate the
SiO2 NPs in the pores but to minimize the risk of forming continuous PAH/PSS
multilayer films on the membranes. Dye-labeled PAH was used for infiltration (at least
once) to visualize the PE coating and its encapsulated NPs by confocal laser
scanning microscopy (CLSM). Note that the encapsulation protocol was based on
well-established layer-by-layer assembly and a wide spectrum of synthetic and
naturally occurring PEs are available to improve the biocompatibility [130, 171]. 10
μm thick polycarbonate [172] membranes with cylindrical pores of sizes in the range
of 1 – 5 μm were used to template the infiltration of SiO2 NPs and PEs. The
subsequent dissolution of the PC membranes in dichloromethane (DCM) yielded PE-
encapsulated SiO2 NP aggregates microfibers, denoted as SiO2NP@(PAH/PSS)n
microfibers (n is 3 or 4, the infiltration number of each PE).

45
Figure 20: Fluorescence (a) and SEM images (b) of SiO2NP@(PAH/PSS)3 microfibers obtained by infiltration of 841 nm SiO2 NPs through PC membranes with 1 µm cylindrical pores. The microfibers are dispersed in DCM. Rhodamine-labeled PAH was infiltrated once to impart the microfibers with red fluorescence. The high magnification fluorescence micrograph is shown in the inset in Figure 20a. In Figure 20b the microfibers are supported on PTFE membranes.
3.2.3. Microfiber Imaging
The resulting microfibers were collected on a polytetrafluoroethylene (PTFE)
membrane with the pore sizes smaller than the diameters of SiO2 NPs via filtration,
washed three times by DCM to remove free PC chains derived from the membrane
dissolution, and redispersed in DCM.

46
Figure 21: Overlay of fluorescence and transmission CLSM images of SiO2NP@(PAH/PSS)3 microfibers obtained by infiltration of 841 nm SiO2 NPs through PC membranes with 5 µm cylindrical pores. The microfibers are dispersed in DCM. Rhodamine-labeled PAH was infiltrated for once to impart the microfibers with red fluorescence.
3.3. Results and Discussion
3.3.1. Microfiber Morphology
As shown in Figure 20 and Figure 21, SiO2NP@(PAH/PSS)n microfibers are well-
dispersed in DCM and composed of non-fluorescent SiO2 NP chains encapsulated by
fluorescent PE shells. The aspect ratios of the microfibers are comparable to those of
the template pores. The packing structures of SiO2 NPs in the resulting microfibers
were characterized by scanning electron microscopy (SEM), showing a clear
dependence on the size ratio of NPs to the membrane pores (Figure 22).
Figure 22: SEM images of SiO2NP@(PAH/PSS)3 microfibers obtained by infiltration of 841 nm SiO2 NPs through PC membranes with cylindrical pores of diameters of 2 (a) and 5 µm (b), and by infiltration of 403 nm SiO2 NPs through PC membranes with 1 µm cylindrical pores (c). The scale bar is 2 µm. The non-uniformity of the resulting of SiO2NP@(PAH/PSS)3 microfibers is due to the fact that the nanopores of PC templates are not perfectly cylindrical .
a b c

47
SiO2NP@(PAH/PSS)n microfibers with the morphologies precisely defined by the
pores of template membranes were counted with the aid of CLSM, suggesting a
production yield of ~ 60%. The well-dispersibility of SiO2NP@(PAH/PSS)n microfibers
in DCM should arise from the non-negligible contribution of the hydrophobic,
hydrocarbon backbones of PEs to the solubility, as suggested in literature [173, 174].
Figure 23: Fluorescence photographs of a plastic eppendorf tube containing water (upper phase) and DCM (lower phase). SiO2NP@(PAH/PSS)3 microfibers, obtained by infiltration of 841nm SiO2 NPs through PC membranes with 1µm cylindrical pores, were initially dispersed in the DCM phase (left panel), but they were readily to transfer to the water phase after vigorous shaking (right panel). Rhodamine-labeled PAH was infiltrated once to impart the microfibers with red fluorescence. The photographs were shot under irradiation with a UV lamp.
Intriguingly, SiO2NP@(PAH/PSS)n microfibers were readily transferred from DCM to
water when their DCM dispersions were brought in contact with water, followed by
vigorous shaking, which should be a result of excellent hydrophilicity of their PE
coating (Figure 23). SiO2NP@(PAH/PSS)n microfibers remained little changed before
and after phase transfer (Figure 24). It is worth noting that this simple process allows
selective phase transfer of SiO2NP@(PAH/PSS)n microfibers to water from DCM
without removal of free PC chains via filtration through PTFE membranes, allowing
for simple sample preparation for future in vivo application.

48
Figure 24: Fluorescence CLSM image of SiO2NP@(PAH/PSS=3 microfibers obtained by infiltration of 841 nm SiO2 NPs through PC membranes with 5 µm cylindrical pores. The microfibers are dispersed in water. Rhodamine-labeled PAH was infiltrated for once to impart the microfibers with red fluorescence.
3.3.2. Multifunctional Microfibers
In the current work, SiO2 NPs were also coated with defined numbers of PAH/PSS
multilayer shells via layer by layer assembly [136, 175], SiO2@(PAH/PSS)m NPs (m
is the (PAH/PSS) bilayer number). Using nanoporous PC membranes to template
subsequent infiltration of SiO2@(PAH/PSS)m NPs and PEs, followed by the
membrane dissolution by DCM, SiO2@(PAH/PSS)m NP@(PAH/PSS)n microfibers
were obtained (Figure 25).
Figure 25: Schematic depiction of template-assisted polyelectrolyte encapsulation of NPs coated with polyelectrolytes to produce colloidally dispersible, hierarchical, nanostructrured microfibers.
The (PAH/PSS)m shells coated on the SiO2 NPs and the (PAH/PSS)n on the
microfibers were easily distinguished by CLSM microscopy by labeling one PAH layer

49
of them with different fluorescent dyes; the former was labeled by Rhodamine the
latter by Fluorescein (Figure 26). This demonstrates that the present strategy is not
only general for different types of NPs but also flexible to add multiple functions to
microfibers by deliberately adding functional PEs or charged species on NPs before
or after infiltration into template membranes.
Figure 26: Fluorescence (a and b) and transmission (c) CLSM images of SiO2@(PAH/PSS)3NP@(PAH/PSS)3 microfibers, obtained by using PC membranes with 2 µm cylindrical pores to template infiltration of 841 nm SiO2 NPs coated with (PAH/PSS)3 shells, and (d) Overlay of these fluorescence and transmission images. Fluorescein-labeled PAH was infiltrated for once and thus the PE layers encapsulated on the NP microfibers are green fluorescent (a). The (PAH/PSS)3 shells on the NPs contain a layer of Rhodamine-labeled PAH and thus they are red fluorescent (b). The microfibers are dispersed in DCM. The scale bar is 2 µm.
3.3.3. Polyelectrolyte Capsule Containing Microfibers
The present protocol was also extended to encapsulate polystyrene (PS) NPs coated
with (PAH/PSS)m shells (Figure 27).

50
Figure 27: Schematic depiction of template-assisted polyelectrolyte encapsulation of PS NPs coated with polyelectrolytes to produce colloidally dispersible, hierarchical, nanostructrured microfibers.
Because DCM dissolved both PC template membranes and PS NPs, we obtained
dispersible microfibers with closed porous structures, invited to the packing structure
of the original PS NPs (Figure 28 and Figure 29).
Figure 28: SEM image of (PAH/PSS)5@(PAH/PSS)3 microfibers obtained by using PC membranes with 1 µm cylindrical pores to template infiltration of 836 nm PS NPs coated with (PAH/PSS)5 shells. The PS NPs were removed via dissolution in DCM. The inset is the fluorescence micrograph of hollow microfibers dispersed in DCM.
Thanks to extensive studies of using PE microcapsules for drug loading and
controlled release [136, 175], porous (PAH/PSS)m@(PAH/PSS)n microfibers may
provide sophisticated multi-compartment drug delivery carriers.

51
Figure 29: SEM image of (PAH/PSS)5@(PAH/PSS)3 microfibers obtained by using PC membranes with 1 µm cylindrical pores to template infiltration of 428 nm PS NPs coated with (PAH/PSS)5 shells. The PS NPs were removed via dissolution in DCM.
3.4. Conclusion
In summary, we have successfully prepared colloidally dispersible, multifunctional,
and multi-compartment microfibers by using nanoporous membranes as templates of
PE encapsulation of colloidal NPs. The present protocol involves two key techniques:
1) membrane-template infiltration of materials in the form of NPs rather than single
molecules to avoid the severe interconnecting problem of elongated particles
liberated after template removal; 2) alternating infiltration of differently charged PEs
based on electrostatic attraction, which embraces all the advantages associated with
electrostatic self-assembly of PEs, developed thus far, to diversify the structures and
functions of the resulting microfibers. The present protocol is simple and independent
of the chemical nature of NPs and PEs. Thanks to its good dispersibility in a wide
range of solvents of different polarity such as water and DCM, the surface PE coating
allows free transfer of the resulting microfibers into various aqueous and organic
media, thus enabling the present protocol to easily adapt to different formulation
conditions. Our ensuing project is to extend the present protocol to drug NPs of
pharmaceutical interest. In vitro study of the macrophage response to the resulting
microfibers and their cytotoxicity is underway. The recent theoretical study has
suggested that as compared with isotropic ones, anisotropic particles, such as
microfibers, show a higher chance to deposit in the deep lung [21, 36]. As such, the
study of the aerodynamic behavior of the resulting microfibers in human oral and
nasal airways is under exploitation.

52
3.5. Experimental Details
PAH (Aldrich, Mw 56,000) and PSS (Aldrich, Mw 70,000) were dissolved in water at
the concentration of 3 mg/mL in the presence of 0.5M NaCl. PAH was labelled by
rhodamine or fluoresceine isothiocyanate (FITC) as described elsewhere [175]. SiO2
and PS NPs were purchased from Microparticles GmbH, Berlin, Germany. They were
coated by PAH/PSS multilayer shells according to a well-established layer-by-layer
procedure [136, 175]. PC membranes were purchased from Whatman. 0.1 wt%
aqueous suspensions of SiO2 or PS NPs, coated with and without PAH/PSS
multilayer shells, were infiltrated into template PC membranes. In order to efficiently
block the NPs in the pores of the template membranes, additional PC membranes
with the pores much smaller than the NPs were placed underneath the template
membranes. The NP infiltration was repeated 2 times with an ultrasound treatment
for 5min after each step to ensure a dense loading of the NPs in the template pores.
After drying over night at room temperature, NPs deposited on the membrane
surfaces were wiped away with Kimtech Science® tissue. Subsequently, the NP-
loaded membranes were immersed in aqueous solutions of PAH (3mg/ml, containing
0.5M NaCl) for 30 min, followed by 3 times washing with water. The membranes
were consecutively immersed in aqueous solutions of PSS (3 mg/ml, containing 0.5M
NaCl) for 30min, followed by 3 times washing with water. After 3 or 4 repetition of this
cycle, the membranes were dissolved by DCM to liberate the NP microfibers. The
resulting microfibers were collected on PTFE membranes with the pores smaller than
the NPs via filtration, washed three times by DCM to remove free PC chains derived
from the membrane dissolution, and redispersed in DCM. Upon being in contact with
water, the microfibers were transferred from DCM to water by vigorous shaking. The
resulting NP microfibers were visualized by SEM (Gemini LEO 1550, operated at
3kV) and CLSM (Leica DM IRBE with a 30 W UV lamp (λ= 350 nm) as the light
source).

53
4. Spatial Aspect Ratio Dependent Macrophage Uptake of Biocompatible Nanostructured Microfibers
Parts of this chapter will be submitted to Langmuir:
Kohler D., Bai S., Schneider M., Wolkenhauer M., Lehr C.-M., Möhwald H., Wang D.
in prep.:
Versatile loaded biocompatible microfibers studying macrophage response.

54
4.1. Introduction
Recently asymmetric particles have gained increasing attention, as anisotropic
particles have shown to prolong in vivo circulation times in blood [47], and increase
mucoadhesion in the intestine [65]. Combining the prolonged mucoadhesion and the
reduced macrophage uptake reported by Mitragotri will result in prolonged lung
residence time [25, 72]. New interesting drug carrier systems for pulmonary drug
delivery with retarded release kinetics can therefore be achieved. Nowadays
investigations of the macrophage response to asymmetric particles with well defined
geometry and aspect ratio is largely limited by the challenge to synthesize colloidal
dispersible, biocompatible, elongated particles with long, defined, but varied aspect
ratios. Here we fabricate biocompatible asymmetric particles with well defined aspect
ratio by the template technique which can be loaded with hydrophilic or hydrophobic
drugs.
Hydrophobic drugs have recently provoken many challenges in formulation. As most
new high potential drugs suffer from poor water solubility, new formulation strategies
are asked for. Here we rely on a solvent exchange method for loading of hydrophobic
drugs into hydrogels to meet this challenge [176]. The solvent exchange method
allows for direct incorporation of hydrophobic nanoparticles into hydrophilic
hydrogels. Hydrogels can be dispersed in a broad range of solvents, thereby
transferring incorporated hydrophobic nanoparticles from water immiscible organic
solvents to aqueous media.
The present protocol combines the template assisted formation of asymmetric
particles with the solvent exchange method to produce colloidal dispersible
microfibers with well defined dimensions and the ability to be loaded with hydrophilic
or hydrophobic drugs. Despite being of practical interest for drug delivery,
biocompatible microfibers are needed to get a deeper understanding of asymmetric
particle uptake by macrophages, being an important process in particle clearance
from the body [177]. However, few experimental protocols developed thus far can
produce biocompatible microfibers with defined shape and aspect ratio. The first
results from macrophage uptake studies will be presented here.

55
Figure 30: Schematic depiction of template-assisted Agarose infiltration to produce colloidal dispersible microfibers. 1) Hot (100°C) aqueous Agarose solution (1.5 wt%) is placed on a glass slide and drawn into template pores by capillary force. 2) Microfiber liberation by template decomposition in DCM.
4.2. Materials and Methods
4.2.1. Agarose Infiltration
Agarose, as natural sugar with good biocompatibility, is an ideal candidate for drug
delivery application. The hot (100°C) aqueous solution of Agarose (1.5 wt%) was
loaded into nanopores of commercially available membranes (Figure 30). After
cooling of the system, Agarose deposited on the membranes was wiped away by
tissue paper, thus obviating the risk of interconnecting microfibers confined in the
template nanopores. 10 µm thick polycarbonate membranes with cylindrical pores of
sizes in the range of 1 – 5 µm were used to template the infiltration of Agarose. The
subsequent dissolution of the PC membranes in dichloromethane (DCM) yielded well
dispersed Agarose microfibers (Figure 31). The aspect ratios of the microfibers are
comparable to those of the template pores. The resulting microfibers were washed
three times by DCM to remove free PC chains derived from the membrane
dissolution and visualized by confocal laser scanning microscopy (CLSM).

56
Figure 31: Transmission image of Agarose microfibers with (a) 1 µm and (b) 5 µm diameter obtained by infiltration of Agarose into PC membranes with 1 or 5 µm cylindrical pores respectively. The microfibers are dispersed in H2O.
4.2.2. Nanoparticle Infiltration
4.2.2.1. Silica Particle Infiltration
Macrophage interaction studies need fluorescent labelling for in-situ detection under
the CLSM after macrophage uptake. Commercially available, monodisperse,
spherical 841 nm SiO2 nanoparticles (SiO2NPs) coated with one layer Rhodamin
labeled positively charged polyallylamine hydrochloride (PAHRh) denoted as
SiO2NP@PAHRh were used as labels and at the same time as models of drug
particles in the present proof-of-concept study for the benefit of characterization. The
particle coating was done as described elsewhere [136, 178].
Figure 32: Schematic depiction of template-assisted formation of SiO2NPs@PAHRh containing Agarose microfibers.
a
b

57
The SiO2NP@PAHRh particles were infiltrated into the template membranes by
exclusively locking the NPs in the pores by placing additional membranes with the
pore sizes much smaller than the NP sizes underneath the template membranes, and
by one or two times infiltration of dilute NP dispersions (0.1 wt%) a maximum volume
fraction of NP inside template pores can be obtained (Figure 32). The NPs deposited
on the membranes can be easily wiped away by tissue paper. Agarose was
subsequently infiltrated into the SiO2NP@PAHRh filled nanopores, resulting in
SiO2NP@PAHRh containing Agarose microfibers. Well dispersible microfibers with
defined inner packing structure of infiltrated SiO2NP@PAHRh are obtained, where the
aspect ratio is determined by the template pore dimension (Figure 33).
Figure 33: Fluorescence image of SiO2NP@PAHRh containing Agarose microfibers with (a) 1 µm and (b) 5 µm diameter obtained by infiltration of 841 nm SiO2 NPs through PC membranes with 1 or 5 µm cylindrical pores respectively. The microfibers are dispersed in DCM.
4.2.2.2. Quantum Dot Infiltration
Thanks to good solubility in different solvents with largely varied polarity Agarose
allows exchange of the local environment of microfibers from organic media to
aqueous ones. This exchange may overcome the bottleneck from pharmaceutical
industry to formulate high potent hydrophobic drugs, and as well to be suitable for
hydrophilic components.
b
a

58
Figure 34: Schematic depiction of template-assisted formation of CdTe QD’s containing Agarose microfibers.
Hydrophilic model drugs (CdTe Quantum Dots (QDs)) were incorporated into
Agarose microfibers by mixing QDs and tempered Agarose prior to the loading into
nanopores (Figure 34). After liberation of the microfibers from the template
membrane, well dispersed fluorescent microfibers are obtained (Figure 35)
Figure 35: Fluorescence image of 1 µm diameter QD containing Agarose microfibers dispersed in H2O.
4.2.2.3. Fe3O4 Nanoparticle Infiltration
Oleic acid and oleylamine coated iron oxide nanoparticles (Fe3O4 NPs) (8-9 nm) in
DCM were used as model of hydrophobic drugs in the present proof-of-concept study
for the benefit of characterization, while hydrophilic CdTe QDs with sizes in the range
of 2-4 nm were used as models of hydrophilic drugs. Hydrophobic drugs were loaded
into microfibers during the decomposition of the PC template by Fe3O4 NP containing
DCM, where the Fe3O4 NP partition into the Agarose network (Figure 36).

59
Figure 36: Schematic depiction of template-assisted formation of Fe3O4 containing Agarose microfibers.
By transfer of the microfibers into aqueous medium, the Fe3O4 NPs are trapped
inside the hydrophobic surrounding of the hydrogel. By this the solvent exchange
technique yields biocompatible microfibers loaded with hydrophobic drugs. Using
Fe3O4 NP additionally allows introducing superparamagnetic properties, and by this
enabling for targeted drug delivery as was reported by Dames [42] (Figure 37).
Figure 37: Superparamagnetic Fe3O4 NP containing Agarose microfibers (Ø = 5 µm) in H2O after template decomposition and phase transfer in presence of a magnet.

60
4.3. Results and Discussion
4.3.1. Cytotoxicity Test
Cytotoxicity tests were conducted for all microfibers used for macrophage uptake
studies. MTT test for viability testing and LDH test for cytotoxicity studies were
performed [179]. Little toxicity was observed for all microfibers (Figure 38). Viability of
only ~65% was found for SiO2NP@PAHRh containing Agarose microfibers. This
finding can be explained by insufficient SiO2NP@PAHRh coating by Agarose. PAH
being highly cytotoxic [180] can therefore interact with A549-cells, causing cell death.
The viability of nearly 97% found for Fe3O4 NP containing 1 µm diameter Agarose
microfibers confirms this finding. It additionally proved that incorporated Fe3O4 NPs
are not toxic. Furthermore these data showed that microfiber purification and the
removal of free polymer chains after template decomposition was successful. Due to
limited microfiber amounts, and due to lack of quantification of actual microfiber
concentration in solution, no concentration dependent cytotoxicity data were
obtained, but only solutions used for macrophage uptake studies were investigated
for their cytotoxicity. Further cytotoxicity studies are urgently needed, to get a deeper
understanding on the particle shape effect on cytotoxicity.
Figure 38: Cytotoxicity (LDH) and viability (MTT) data after 3h incubation for 1 and 5 µm diameter Agarose microfibers containing (°) SiO2NP@PAHRh or (*) Fe3O4 NP. Triton-X being the pos. control, whereas pure buffer describes neg. control.

61
4.3.2. Macrophage Uptake
Mouse macrophages, MHS cells, were used as model macrophages. Microfibers with
an aspect ratio of α = 2 and 10 were tested, where the microfiber length was fixed to
10 µm. The direction of microfiber uptake was determined as well as the uptake
kinetics.
Figure 39: Schematic depiction of microfiber orientation with respect to cell orientation, with a) parallel alignment of the microfiber with its longitudinal side along the cell wall, b) complete microfiber uptake by the macrophage, c) microfiber being far apart from cells and d) partial uptake of the microfibers by MHS cells.
Four orientations were distinguished (Figure 39):
a) Parallel alignment of the microfiber with its longitudinal side along the
cell wall
b) Complete microfiber uptake by the macrophage
c) Microfiber being far apart from cells
d) Partial uptake of the microfibers by MHS cells.
a b c d

62
Figure 40: Fluorescence images of MHS cells after 1 h, 2 h and 3 h incubation with 1 µm diameter SiO2NP@PAHrh containing Agarose microfibers in MHS medium at 37 °C and 5%CO2. The amount of particle uptake is plotted vs. the particle-cell-orientation.
4.3.2.1. Silica Nanoparticle Containing Microfiber Uptake
1 µm diameter microfibers (α = 10) were incubated for 3 h and each 60 min
microfiber orientation in respect to the cells was examined (Figure 40). 80% of the
microfibers are aligned parallel or not in contact with the cells after 1h incubation,
while only 20% are about to be phagocytosed. After 3 h incubation, all microfibers are
in contact with cells, where 85% are at least partially phagocytosed and only 15% are
aligned parallel to the cell surface, unable to be taken up.
10µm 10µm
10µm
1h 2h
3h

63
Figure 41: Fluorescence images of MHS cells after 1 h, 2 h and 3 h incubation with 5 µm diameter SiO2NP@PAHrh containing Agarose microfibers in MHS medium at 37 °C and 5%CO2. The amount of particle uptake is plotted vs. the particle-cell-orientation.
5µm diameter microfibers (α = 2) show a slower phagocytosis of elongated particles
compared to α = 10 microfibers (Figure 41). Only 30% of the microfibers are
completely phagocytosed after 3 h incubation time for α = 2 compared to 55% for
α = 10 microfibers, while more microfibers are partially phagocytosed for 5 µm
diameter particles (45%) than for 1 µm diameter particles (30%). Again no free
particle without cell contact could be found after a 3 h incubation period. No
comparison to spherical Agarose particles could be performed, as no synthesis
strategy is known to produce monodisperse spherical Agarose particles.
For none of the particles aligned parallel to the cell membrane phagocytosis was
observed, confirming the theory by Mitragotri [72] that elongated particles are only
taken up from the pointy end. Hence the first contact angle theory could not be
confirmed by our observations. Furthermore it was observed, that the smaller the
pointy end is the faster is the rate of phagocytosis. This correlates to the finding for
1h 2h
3h
10µm 10µm
10µm

64
spherical particles, where phagocytosis seems to be optimal for particles in the size
range of 0.5 – 2 µm with a maximum at 1 µm [38].
4.3.2.2. Fe3O4 Nanoparticle Containing Microfiber Uptake
Macrophage uptake studies were prepared with Fe3O4 NP containing microfibers.
Due to little substance amount and difficulties in imaging, only the cell-microfiber
orientation was investigated. Again it was seen that particles aligned parallel with the
longitudinal side to the cell wall were not taken up, while phagocytosis could be
observed from the pointy side only.
4.4. Conclusion
In summary, we have successfully prepared the first biocompatible microfibers
loaded with hydrophilic model drugs during preparation or hydrophobic model drugs
by the solvent exchange method after synthesis of microfibers by using the template
technique in combination with solvent exchange. The present protocol is simple and
independent of the chemical nature of NPs and drugs to be used. By introducing
Fe3O4 NPs superparamagnetic microfibers can be synthesized. Macrophage
interaction studies with the prepared microfibers showed that microfiber orientation
plays a dominant role in particle uptake, as well as a time dependence of microfiber
uptake in dependence on the particle diameter.
Our ensuing project is to extend the present protocol to drug NPs of pharmaceutical
interest. In vitro study of their cytotoxicity is underway. A recent theoretical study has
suggested that as compared with isotropic particles, microfibers, show a higher
probability to deposit in the deep lung [36]. As such, the study of the aerodynamic
behaviour of the resulting microfibers in human oral and nasal airways is under
exploitation.
4.5. Experimental Details
SiO2 NP labelling: PAH (Aldrich, Mw 56,000) was dissolved in water at the
concentration of 3 mg/mL in the presence of 0.5 M NaCl. PAH was labelled by

65
rhodamine as described elsewhere [175]. 841 nm SiO2 NPs were purchased from
Microparticles GmbH, Berlin, Germany. They were coated by one layer PAHRh
according to a well-established procedure [136, 175].
SiO2NP@PAHRh infiltration: PC membranes were purchased from Whatman. 0.1 wt%
aqueous suspensions of coated SiO2 NPs were infiltrated into template PC
membranes. In order to efficiently block the NPs in the pores of the template
membranes, additional PC membranes with the pores much smaller than the NPs
were placed underneath the template membranes. The NP infiltration was repeated 2
times with an ultrasound treatment for 5min after each step to ensure a dense
loading of the NPs in the template pores. After drying over night at room temperature,
NPs deposited on the membrane surfaces were wiped away with Kimtech Science®
tissue.
Microfiber synthesis: Capillary infiltration of 120 °C tempered 1.5% Agarose solution
into bare or SiO2NP@PAHRh-loaded membranes was performed. After cooling down
to room temperature, membranes were peeled of from the glass slide. Agarose
deposited on the membrane surface was wiped away with Kimtech Science® tissue.
SiO2NP@PAHRh-loaded membranes were dissolved by DCM to liberate the
SiO2NP@PAHRh-loaded microfibers. Threefold washing by DCM, followed by
threefold washing in THF and EtOH allowed for redispersion of SiO2NP@PAHRh-
loaded microfibers in water. 1/3 dilution with MHS medium is performed prior to cell
testing.
Fe3O4 NP loading: Fe3O4 NP stabilized by oleic acid and oleylamine provided by S.
Bai were loaded into PC templates containing bare Agarose microfibers, by
dissolving the template in Fe3O4 NP containing DCM. After 4 h incubation Fe3O4 NP
containing microfibers are collected by magnet application, washed three times by
DCM to remove free PC chains derived from the membrane decomposition, and
redispersed in water. 1/3 dilution with MHS medium (500 ml RPMI 1640 containing
2 mM L-Glu, 5 ml Hepes 1 M, 1 mM Sodiumpyruvat, 2,25 g Glucose, 0,75 g
Bicarbonate, 1,95 mg 2-Mercaptoethanol, 50 ml FCS) is performed prior to cell
testing.

66
Macrophage Uptake: 20.000 MHS cells are grown on a 24 well-plate. 500 µl NP
containing microfibers are incubated with MHS cells for 1 h, 2 h and 3 h respectively.
For visualization cell membranes are labelled after particle incubation by 10min
incubation at 37 °C with 0.5 ml WGA-FITC in PBS (1/40). Cells are fixed by 4%
formalin incubation for 10 min prior to visualization by CLSM (Zeiss LSM510 META
with a 30 W UV lamp (λ= 350 nm) as light source).
MTT test: A549 cells are incubated with 200 µl NP containing microfibers (sample),
HBSS buffer (negative control) and 1% Triton-X (positive control) in triplicates for 4 h
at 37 °C, 5% CO2 and 90% humidity. After incubation 10 µl MTT solution (5 mg/ml
HBSS) is added, and incubated at 37 °C, 5% CO2 and 90% humidity for 4 h. After
supernatant is removed, 50 µl DMSO is added to solubilise the formazan crystals,
followed by 20 min incubation under light exclusion. After 1 min shaking, UV
absorbance is measured at 550nm.
LDH test: LDH test is prepared using the Cytotoxicity Detection Kit (LDH) by Roche
Applied Science, Mannheim, Germany. A549 cells are incubated with 200µl NP
containing microfibers (sample), HBSS buffer (negative control) and 1% Triton-X
(positive control) in triplicates for 4 h at 37 °C, 5% CO2 and 90% humidity. 100 µl
supernatant of each well is transferred to a probe sampling plate. 100 µl reaction
mixture is added to each well, followed by 5 min incubation at room temperature in
the dark. Absorption is measured at 492 nm.

67
5. Aspect Ratio Dependent Aerosolization behaviour of Drug loaded Microfibers
Parts of this chapter will be submitted to the Journal of Aerosol Science:
Kohler D., Wolkenhauer M., Möhwald H., Wang D., Lehr C.-M. and Schneider M.,
Generation of Biocompatible Drug Loaded Microfibers by Template Technique.

68
5.1. Abstract
A method of producing monodisperse aerosol fibers with defined aspect ratio is
described. This method involves the infiltration of desired material into membrane
pores, and the subsequent decomposition of the template. Diameter and length of
the fibers could simply be varied by choosing desired pore dimensions for fiber
preparation. Fibers of varying diameter ranging form 1 to 5 µm were produced. It was
found that well dispersed fibers with defined porosity can be formed. Drug loading
was achieved during fiber formation. Further modification of the process is expected
to allow for large scale production of fibers with uniform aspect ratio.
5.2. Introduction
Fibers are a special class of particles, defined by the WHO in 1985 as elongated
objects for which the aspect ratio – the ratio of length of the object to its diameter- is
greater than 3 [34, 35]. The aerodynamic diameter of a fiber as main parameter for
lung deposition is mainly determined by its geometric diameter, where the length is of
minor impact [21, 54]. Su et al. [36] showed that fibers have higher probability to
reach the peripheral lung compared to spherical particles of same aerodynamic
diameter. Furthermore Edwards et al. [11] proved, that introducing porous
architecture and thereby reducing particle density, allows for large particle deposition
in the peripheral lung. Therefore fibers with and without porous structure open a new
way of accessing pulmonary drug delivery systems with high delivered doses.
Particle design for optimized drug delivery gained increasing attention lately [9]. It
was shown that asymmetric particle geometry greatly influences particle
phagocytosis [20, 25, 163], allows for prolonged in vivo circulation time [47, 65] and
improves targeting efficiency [43, 44, 69]. By decreasing macrophage uptake in the
alveoli and increased mucoadhesion in the proximal lung, reduced clearance from
lung and by thus long acting formulations aiming for improved patience compliance
due to decreased dosing interval can be achieved.
Systematic studies on the pathways of asymmetric particles are limited by the
existence of suitable model particles. New synthesis strategies allowing for large

69
scale production of elongated particles with well defined dimensions are urgently
asked for. We present a method, which allows for the production of biocompatible,
biodegradable, highly monodisperse fibers with variable aspect ratio using the
template technique.
5.3. Template Technique
We used the template technique based on the approach of Martin [80] to produce
biocompatible, biodegradable microfibers. Commercially available track etched
polycarbonate membranes (Nucleopore, Whatman Inc., Florham Park, New Jersey,
USA) containing straight pore structures are used as template for fiber generation.
Fiber dimensions are defined by the pore dimensions, where the membrane
thickness and pore diameter determine fiber length and diameter, respectively.
Material deposition is accomplished by capillary infiltration of aqueous solution of
desired material into pores and subsequent drying (Figure 42).
Figure 42: Schematic depiction of template-assisted formation of sugar microfibers.
After template decomposition in Dichloromethane (DCM) followed by three fold
washing to remove free polymer chains, freeze drying is performed. Well dispersible
microfiber powders are obtained.

70
Figure 43: Microscopic images in transmission mode of lactose microfibers, obtained by using
PC membranes with (a) 1 μm and (b) 5 µm cylindrical pores. The microfibers are freeze dried
after template decomposition and subsequent washing.
The fibers of Figure 43 are composed of lactose. Fibers of various aspect ratios were
prepared using PC-templates of various pore diameters (1 to 5 µm), with constant
membrane thickness of 10 µm. Aspect ratios ranging from 2 to 10 were produced.
Further increase of the aspect ratio can easily be achieved by using smaller pore
sizes. A 20% aqueous lactose solution was infiltrated. Drying was performed at 80°C
for 3 h. After template dissolution in DCM and freeze drying overnight, microscopic
pictures on a CLSM (Leica DM IRBE with a 30 W UV lamp (λ= 350 nm) as light
source) were taken.
5.4. Generating Drug Loaded Microfibers and Introducing
Porosity
Fenoterol HBr as short acting β-Sympathomimetikum used in asthma therapy was
incorporated into Mannitol microfibers. Mannitol was used to achieve higher degree
of crystallinity compared to Lactose microfibers. Fenoterol HBr – Mannitol–Water
solution (1-20-100) was prepared and infiltrated into the membrane pores. After
infiltration into membrane pores and subsequent drying monodisperse fibers
containing drug and carrier material are obtained after template decomposition. Drug
incorporation was confirmed by UV spectra after dissolution of the freeze dried
powder in water.
To further modify the deposition behaviour of microfibers, porosity was introduced
into the fiber morphology. Polystyrene nanoparticles (PS NPs) are physically
a b

71
entrapped into membrane pores prior to material infiltration. A membrane with pore
size smaller than the infiltrated PS NPs is placed into a commercially available
membrane holder (Sartorius Stedim Biotech GmbH, Goettingen, Germany)
underneath the template membrane to avoid particle penetration through the pores.
Three times PS NPs infiltration with Ultrasound treatment of 5 min between each
infiltration step resulted in close packed PS NPs. After drying overnight material
deposition is performed as described above. During PC template decomposition, PS
NPs are dissolved in DCM, resulting in porous fiber structure.
5.5. Aerosolization of Microfibers
The aerosolization properties were tested in an Andresen Cascade Impactor (ACI). A
four stage Anderson Cascade Impactor was used to determine the fine particle
fraction (FPF) of prepared microfibers and reference powder. A capsule containing
5 mg of Mannitol-Fenoterol-Microfibers, pure micronized Fenoterol or material
blended with Mannitol (1/5) was placed in a HandiHaler®. The capsule was
punctured and a pump simulated inspiration of 20 l/min for 12.3 sec. The powder was
deposited on Brij 35 coated stainless steel plates or glass fiber filters depending on
their aerodynamic diameter. Plates were washed after three capsule actuations with
water, and fine particle fraction of particles with aerodynamic diameters below 5 µm
determined by UV spectra quantification of Fenoterol HBr. Pure and 1/5 Mannitol
blended microfibers of 1, 2 and 5 µm diameter as well as 1 µm microfibers containing
836 nm pores were tested in comparison to micronized Fenoterol HBr and a 1/5
powder blend of micronized Fenoterol / Mannitol. Due to limited powder amounts,
each experiment was repeated twofold.

72
Figure 44: Fine particle fraction of Mannitol-Fenoterol-Microfibers (7.5% Fenoterol content) and pure micronized Fenoterol (100%) or material blended with Mannitol (1/5) tested in an Andresen Cascade Impactor at a flow rate of 20 l/min for 12.3 sec.
5.6. Results and Discussion
This method has proven to allow for generation of fibers consisting of various sugars.
SEM imaging of the resulting fibers proved that particles with defined inner structure
can be obtained by infiltration of PS NPs
Figure 45: SEM images of lactose microfibers, obtained by using PC membranes with 1 μm
cylindrical pores to template infiltration of (a) 428 nm and (b) 836 nm PS NPs. The microfibers are freeze dried after template decomposition and subsequent washing.
a b
73
The effect of PS NP diameter on the inner porosity of microfibers has been
determined, and is shown in Figure 45. The inner porous structure is determined by
the ratio of infiltrated PS NP diameter to the pore diameter.
From observations of Figure 46 it can be seen that the particle morphology is
independent of the additional incorporation of water-soluble drugs. Well dispersible
fibers of various aspect ratios can be obtained by using defined pore diameters. This
observation suggests that a broad variety of materials can be blended into sugars as
carrier material without changing microfiber dimensions.
Figure 46: Microscopic images in transmission mode of Fenoterol loaded Mannitol microfibers, obtained by using PC membranes with (a) 1 µm and (b) 5 µm cylindrical pores. The microfibers are freeze dried after template decomposition and subsequent washing.
The UV-spectrum of Figure 47 proved the incorporation of Fenoterol HBr into
Mannitol fibers. After fiber purification, freeze drying and subsequent dissolution in
water, the Fenoterol HBr peak at 276 nm is present.
a b

74
Figure 47: UV-spectrum of Fenoterol loaded lactose fibers (red) after washing and subsequent dissolution in water in comparison to Fenoterol solution (blue).
FPF determination (Figure 44) shows that fibers of various aspect ratios (2 to 10)
provide FPF in the range of micronized Fenoterol Mannitol blends (FPF ~ 60%).
Compared to pure micronized Fenoterol powder having FPF ~ 3.5%, improved
particle deposition for all fibers can be observed. No conclusion can be drawn upon
the aspect ratio effect, as insufficient data are available for statistic evidence due to
limited availability of powder material. 1 µm porous particles showed FPF of up to
67%, confirming the effect reported by Edwards [11], that large porous particles
having small daer have higher FPF compared to dense particles of the same
diameter. Due to impurities of aggregated particles and remnant polymer chains from
template decomposition lowering the powder quality, FPF results need to be handled
with care and further follow up investigations are needed.
Fiber purification for improved aerosolization properties should allow for better
investigation of the aspect ratio effect on the FPF, and improved evidence for the
influence of porosity onto the deposition pattern.
5.7. Conclusion
In summary, we have successfully prepared the first drug loaded microfibers from
approved excipients for pulmonary drug delivery with tailored porosity. The present
protocol is simple and reproducible technique that allows for microfiber preparation
with well dimensions. Aerosolization studies with prepared microfibers showed higher

75
FPF for microfibers compared to micronized Fenoterol, where porosity of microfibers
seems to positively impact the FPF.
Our ensuing project is to extend the present protocol to further drugs of
pharmaceutical interest. Additional data on aerosolization properties are underway to
further investigate parameters modifying microfiber deposition in human airways.
5.8. Experimental Details
PS infiltration: PC membranes (1, 2 and 5 µm pore diameter) were purchased from
Whatman. 0.1 wt% aqueous suspensions of PS NPs (428 and 836 nm) purchased
from Microparticles were infiltrated into template PC membranes. In order to
efficiently block the NPs in the pores of the template membranes, additional PC
membranes with the pores much smaller than the NPs were placed underneath the
template membranes. The NP infiltration was repeated 2 times with an ultrasound
treatment for 5 min after each step. After drying over night at room temperature, NPs
deposited on the membrane surfaces were wiped away with Kimtech Science®
tissue.
Microfiber synthesis: Capillary infiltration of 20% sugar solution (Mannitol and
Lactose provided by Boehringer Ingelheim) into bare or PS NP-loaded membranes
was performed. After drying at 80°C for 3 h in the oven, membranes were peeled of
from the glass slide. Sugar deposited on the membrane surface was wiped away with
Kimtech Science® tissue. Membranes were dissolved by DCM to liberate the
microfibers, and to decompose PS NPs resulting in porous microfibers. Threefold
washing by DCM, followed by freeze drying yielded well dispersible powder.
Microfiber-Mannitol-(1/5) blending was performed for selected samples prior to
aerosolization studies by 30 min mixing in a Turbola Mixer.
Aerosolization properties: A 5 mg capsule of Mannitol-Fenoterol-Microfibers, pure
micronized Fenoterol or material blended with Mannitol (1/5) was placed in a
HandiHaler®. After HandiHaler® attachment onto a four stage ACI, a pump
simulated inspiration of 20 l/min for 12.3 sec. was performed. Brij 35 coated stainless
steel plates of the ACI were washed after three capsule actuations with water, and
FPF5µm determined by UV spectra Fenoterol HBr quantification at 276 nm.

76
6. Overall Conclusion and Outlook The European Lung Foundation assumes that in 2020 11.9 million death will be
caused by lung diseases around the world, where COPD (4.7 million) and
tuberculosis (2.5 million) account for half of the death rate [181]. 102 billion euro
expenses caused by COPD, asthma, pneumonia and tuberculosis need to be
covered by the European health system in 2010. Improved drug therapy can help to
lower the costs and improve patience compliance. Specific targeting and prolonged
drug release are two major objects of drug carrier design, in order to reduce systemic
side effects and to reduce dosing intervals. Asymmetric particles showing optimized
deposition behaviour seem to be promising candidates for next generation drug
delivery devices for lung application.
In this context the template technique represents a valuable tool to synthesise
promising microfibers, which will allow for deeper understanding of asymmetric
particle–cell interaction, microfiber fate in vivo, as well as improving pulmonary drug
delivery. A most important result from the work presented is that well dispersible,
biocompatible microfibers of tuneable porosity and aspect ratio can be prepared. The
finding, that macrophage uptake depends on the fiber diameter and that the
microfiber orientation mainly impacts on the success of phagocytosis, will help in
developing optimized carrier shape with respect to the application. Future
experiments to test the mucoadhesive behaviour of microfibers in order to allow for
prolonged drug release after inhalation are needed. Intense aerosolization studies in
the future require scale up of the invented method in order to produce sufficient
microfiber material. Microfiber release from the template pores, avoiding template
decomposition, will therefore be one of the major challenges that need to be solved
to allow for commercial large scale production.
The new synthesis approach allows producing high quality microfibers of various
materials with tailored properties, such as modified porosity, versatile drug loading
approaches as well as aspect ratio dependent macrophage uptake. It allows for
optimizing pulmonary drug delivery, and thereby fighting costs and death caused by
lung diseases.

77
7. Annex
7.1. Particle Aggregation
7.1.1. General Consideration
Microfiber aggregation is a major drawback of the template technique. Due to
untargeted material deposition outside template pores, microfibers are severely
interconnected after template decomposition (Figure 48).Therefore many approaches
to arrive at a successful preparation failed. This section therefore describes and
discusses these approaches to help future generations of scientists.
Figure 48: Formation of particle aggregates during polymer deposition on PC templates. Bare membranes (a) are coated with 8bilayers PAH/PSS (b). Big particle aggregates are obtained after template decomposition (c) caused by untargeted material deposition outside template pores.
Resulting microfiber aggregates will show different biological response compared to
well separate microfibers in vivo. Various strategies to overcome untargeted material
deposition and/or to remove the interconnecting film were tested. Plasma-Cleaning
a b c
a b c
1µm 1µm
1µm 2µm 10µm
2µm

78
was applied to etch untargeted material, while gold layer and sacrificial layer attempts
were used to mechanically remove undesired material. All strategies aimed for the
post-deposition removal of interconnecting material in order to obtain well dispersible
microfibers after template decomposition. The deposition of a gold layer and their
subsequent hydrophobization on the template surface on the other side aimed to
avoid undesired material deposition outside template pores during microfiber
preparation. All strategies are discussed below.
7.1.2. Plasma Cleaning
Plasma is a highly reactive ionized gas phase, created by using high frequency
electric fields. The ionic, high energetic species can react with surface located
species on the material to be cleaned by collision. Produced gaseous products can
be removed by applied vacuum. Ions of the plasma vibrate due to the absorbed
electrical energy followed by temperature increase used to generate the plasma,
thereby scrubbing the surface [182].
Oxygen plasma cleaner (Plasma Cleaner / Sterilizer PDC-32G, Harrick, Ithaka, USA)
was used to clean membrane surfaces after LbL deposition in order to avoid
microfiber aggregation after template decomposition. Plasma power (100, 200 and
500 Watt) and etching time (1 to 60 min) were varied. The influence of plasma
etching on particle morphology and membrane were studied.
200 and 500 Watt resulted in complete destruction of the PC-membrane. 100 Watt
for 5min removed the polyelectrolyte coating on the PC template surface, yielding
well separated microfibers. The obtained results were not reproducible. Plasma
appeared to not selectively remove surface material, but to affect template and pore
structure, thereby modifying microfiber morphology (Figure 49).

79
Figure 49: SEM images of (PAH/PSS)8 microfibers obtained using PC membranes with 0.2 µm cylindrical pores. Intact aggregated (PAH/PSS)8 microfibers (a) obtained without Plasma treatment, (b) separated microfibers after Plasma treatment (100 Watt, 5 min) and subsequent template dissolution in DCM (b) and bare PC membrane with affected pore structure after Plasma treatment (100 Watt, 5 min).
AAO templates treated at 100 Watt for 5 min showed smaller aggregates. Microfibers
inside the AAO template pores were affected by the plasma, producing instable
porous microfibers (Figure 50).
Figure 50: SEM images of (PAH/PSS)8 microfibers obtained using AAO membranes with 0.2 µm cylindrical pores. Intact aggregated (PAH/PSS)8 microfibers (a) obtained without Plasma treatment, (b) separated microfibers after Plasma treatment (100 Watt, 5 min) and subsequent template dissolution in DCM (b) and magnification (c).
Plasma Cleaning allows for the production of smaller aggregates, but is unsuccessful
to yield reproducible well dispersible microfibers with intact morphology.
7.1.3. Gold Layer
Material adsorption outside template pores was shown to be avoided by gold
sputtering of the membrane faces [183]. Furthermore gold layers were peeled off
after partial template dissolution, thereby removing adsorbed material from the
membrane surface.
a b c
2µm 1µm 2µm
10µm 2µm 300nm
a b c

80
25 nm gold was sputtered onto the membrane faces and 8 bilayers PAH/PSS
deposited via the LbL technique as described previously. PC and AAO templates
were processed differently.
AAO templates were partially dissolved by 1min immersion in 1 M NaOH,
forming a gap between the gold layer and the template, followed by peeling off
the gold layer by tweezers, and AAO template decomposition in 1 M NaOH for
24 h. Liberated microfibers were filtered through 0.2 µm PTFE membrane,
washed three times with water to remove free salt, and visualized by SEM
(Gemini LEO 1550, operated at 3 kV).
PC templates were placed in a solution (0.4 mg/ml K4Fe(CN)6, 3.3 mg/ml
K3Fe(CN)6, 19 mg/ml K2S2O3 x H2O, 56 mg/ml KOH) to decompose the gold
layer, and thereby remove the adjacent polyelectrolyte multilayers. PC templates
were dissolved in DCM for 2 h. Liberated microfibers were filtered through
0.2 µm PTFE membrane, washed three times by DCM to remove free polymer
chains and visualized by SEM.
No gap between template and gold was found for the partially etched AAO templates.
Therefore the gold layer could not be removed, resulting in strongly aggregated
microfibers comparable to aggregates formed without prior gold sputtering of the
AAO template. The etching strategy to remove the gold could not be applied to the
AAO template, as it takes place at high pH values, decomposing the AAO template.
Figure 51: SEM images of (a) close up and (b) overview of aggregated (PAH/PSS)8 microfibers obtained by using 25 nm gold sputtered 1 µm pore size PC membranes after gold layer decomposition.
a b
2µm 10µm

81
Big aggregates were found after dissolution of the gold layer and subsequent
decomposition of the PC template (Figure 51). Unmodified gold sputtering onto PC
template faces is insufficient to prevent polyelectrolyte adsorption, and etching of
gold is furthermore unsuccessful to remove deposited material from the surface.
7.1.4. Gold Layer and Hydrophobisation
Hydrophobisation of gold sputtered membranes is promising to avoid untargeted
material deposition outside on template faces. Preventing the formation of
interconnecting films will allow for preparation of well dispersible microfibers.
25 nm gold was sputtered onto one membrane surface, followed by 2 h
incubation in 1 mg/ml hexadecanthiol (C16SH) solution in Toluol, and five times
washing in EtOH, while the other template face remained untreated. Contact
angle measurements were performed to confirm successful hydrophobisation.
Only one membrane side was sputtered to compare bare and hydrophobised
membrane sides after template decomposition.
8 bilayers PAH/PSS were deposited via the LbL technique as described above. PC
templates were dissolved in DCM for 2h, while AAO templates were decomposed by
immersion in 5% H3PO4 for 24h. Liberated microfibers were filtered through 0.2 µm
PTFE membrane, washed by DCM three times to remove free polymer and
visualized by SEM (Gemini LEO 1550, operated at 3 kV).
Figure 52: SEM images of 0.2 µm pore diameter AAO membranes sputtered with 25 nm gold after hydrophobisation with C16SH, before (a) and after (b) 8bilayer deposition of PAH/PSS.
a b
1µm 200nm

82
Successful hydrophobisation of AAO and PC templates was confirmed by
contact angle measurements showing angles >90°.
AAO membranes show open pore structure after gold sputtering and subsequent
hydrophobisation. Polyelectrolyte deposition was confirmed by membrane
surface observations by SEM following multilayer deposition (Figure 52). The
rough structures present on template faces prove the deposition of
polyelectrolyte multilayers.
Figure 53: SEM images of 0.2 µm pore diameter AAO membranes sputtered with 25 nm gold after hydrophobisation with C16SH, before (a) and after (b) 8bilayer deposition of PAH/PSS.
Different multilayer structures can be observed after AAO template
decomposition, as one template side was sputtered followed by
hydrophobisation, while the other side remained untreated. Rough multilayer
composition was observed for microfiber aggregates after template
decomposition, comparable to multilayer roughness of interconnecting films on
untreated template without gold sputtering. The other microfiber aggregation side
was smoother (Figure 53). Therefore it can be concluded, that gold sputtering
with subsequent hydrophobisation allows limiting multilayer formation on
template substrates, but does not avoid adsorption completely. Therefore
aggregation can be decreased by hydrophobisation, but not prevented.
b c
3µm 1µm 1µm
a

83
Figure 54: SEM images of 0.2 µm pore diameter PC membranes sputtered with 25 nm gold after hydrophobisation with C16SH, before (a) and after (b) 8bilayer deposition of PAH/PSS.
PC templates hydrophobised showed no polyelectrolyte adsorption after
multilayer assembly (Figure 54). No microfibers could be observed in SEM after
template decomposition. Gold sputtering selectively coats the template surface,
therefore membrane pores should remain hydrophilic during surface
hydrophobisation by C16SH. As no microfibers are formed, investigations of the
pore walls need to be carried out, to investigate the pore environment.
7.1.5. Sacrificial Layer
Ono et al. [184] reported the successful application of sacrificial layers to form free-
standing polyelectrolyte films. By pH responsive decomposition of LbL assembled
polyelectrolyte multilayers, free standing pH insensitive multilayer films were
prepared. Therefore this strategy was tested for its ability to dismantle the surface
polymer coatings on porous membranes.
Sacrificial layer deposition was prepared as described above. Subsequently
uncoated membranes were immersed in aqueous solutions of PAH (3 mg/ml,
containing 0.5 M NaCl, pH = 2) for 30min, followed by 3 times washing with water.
The membranes were consecutively immersed in aqueous solutions of polyacrylic
acid (PAA) (3 mg/ml, containing 0.5M NaCl, pH = 2) for 30 min, followed by 3 times
washing with water. Membranes are denoted as (PAH/PAA)n. After desired
repetitions of this cycle, deposition of pH insensitive multilayers is performed.
a b
1µm 2µm
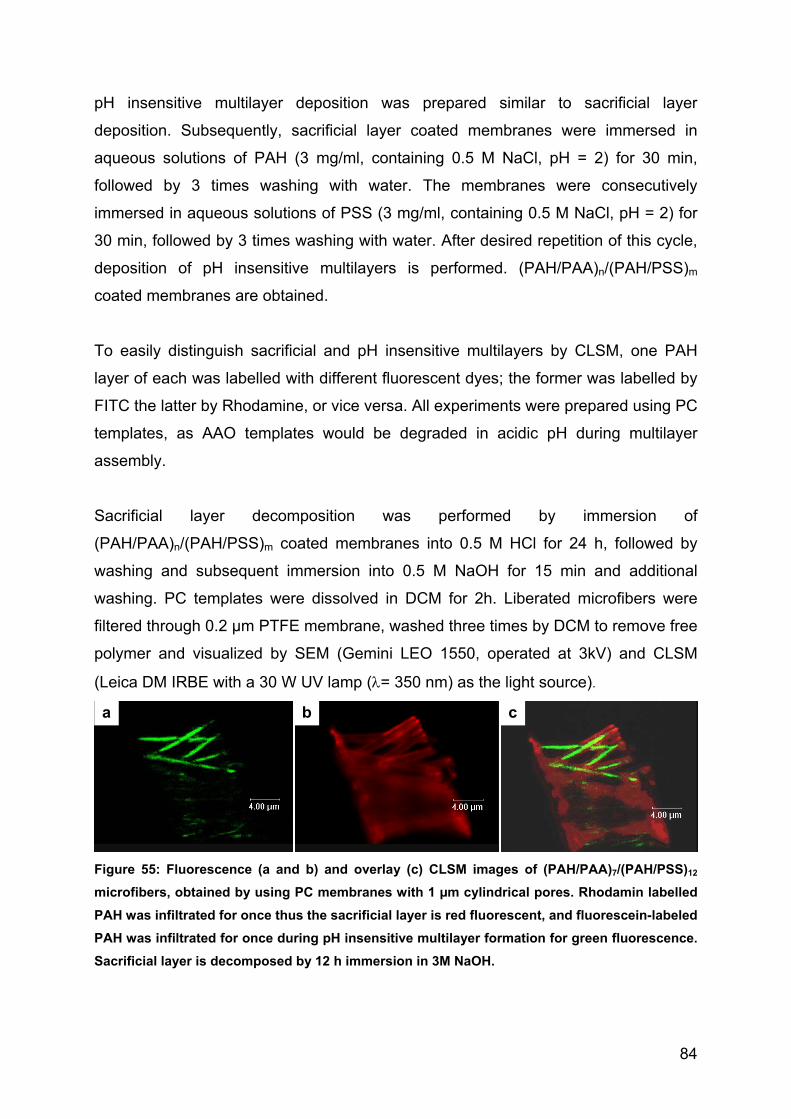
84
pH insensitive multilayer deposition was prepared similar to sacrificial layer
deposition. Subsequently, sacrificial layer coated membranes were immersed in
aqueous solutions of PAH (3 mg/ml, containing 0.5 M NaCl, pH = 2) for 30 min,
followed by 3 times washing with water. The membranes were consecutively
immersed in aqueous solutions of PSS (3 mg/ml, containing 0.5 M NaCl, pH = 2) for
30 min, followed by 3 times washing with water. After desired repetition of this cycle,
deposition of pH insensitive multilayers is performed. (PAH/PAA)n/(PAH/PSS)m
coated membranes are obtained.
To easily distinguish sacrificial and pH insensitive multilayers by CLSM, one PAH
layer of each was labelled with different fluorescent dyes; the former was labelled by
FITC the latter by Rhodamine, or vice versa. All experiments were prepared using PC
templates, as AAO templates would be degraded in acidic pH during multilayer
assembly.
Sacrificial layer decomposition was performed by immersion of
(PAH/PAA)n/(PAH/PSS)m coated membranes into 0.5 M HCl for 24 h, followed by
washing and subsequent immersion into 0.5 M NaOH for 15 min and additional
washing. PC templates were dissolved in DCM for 2h. Liberated microfibers were
filtered through 0.2 µm PTFE membrane, washed three times by DCM to remove free
polymer and visualized by SEM (Gemini LEO 1550, operated at 3kV) and CLSM
(Leica DM IRBE with a 30 W UV lamp (λ= 350 nm) as the light source).
Figure 55: Fluorescence (a and b) and overlay (c) CLSM images of (PAH/PAA)7/(PAH/PSS)12 microfibers, obtained by using PC membranes with 1 µm cylindrical pores. Rhodamin labelled PAH was infiltrated for once thus the sacrificial layer is red fluorescent, and fluorescein-labeled PAH was infiltrated for once during pH insensitive multilayer formation for green fluorescence. Sacrificial layer is decomposed by 12 h immersion in 3M NaOH.
a b c

85
Sacrificial layer was only partially decomposed at low pH, determined by CLSM
investigations (Figure 55). Strong interpenetration during multilayer formation
prevents complete sacrificial layer decomposition. To avoid aggregation after
sacrificial layer decomposition, thicker sacrificial layers need to be deposited.
Thereby gap formation during sacrificial layer decomposition accompanied by
removal of microfiber interconnecting pH insensitive material outside of template
pores might be achieved. Increased sacrificial layer thickness can be achieved by
increasing multilayer numbers, or by using salt solution during washing steps.
Further optimization to control sacrificial layer interpenetration and the removal of
undesired deposited multilayer material should be carried out in future.
7.2. Cytotoxicity Test
7.2.1. MTT Assay
Cytotoxicity of materials can be determined by a standard colorimetric assay. Viable
cells have the ability to reduce the tetrazolium salt MTT by a mitrochondrial
dehydrogenase enzyme (Figure 56). The enzyme cleaves the tetrazolium rings of
MTT, resulting in a color change from pale yellow MTT to dark purple formazan. The
dark purple formazan crystals accumulate in healthy cells due to their impermeability
to cross the cell membranes. Liberation of the crystals is achieved by solubilisation of
the cells, allowing for determination of the metabolic cell activity, as it is proportional
to the concentration of formed crystals. The color of the formazan product can be
quantified by colorimetric assays [179].
N N+
NN
S
NBr
SN
N
N NH
N
mitochondrial
Reductase

86
Figure 56: Principle of MTT-test: Reduction of water soluble, yellow colored 3-(4,5-Dimethylthiazol-2-yl)-2,5-diphenyltetrazoliumbromide (MTT) to form water insoluble, violet Formazan.
7.2.2. LDH Assay
Cell membrane damage can be used to quantify cytotoxicity of applied materials. Cell
death is accompanied by cell membrane damage and irreparable loss of its integrity.
Therefore cytoplasmic enzymes are released into cell culture supernatant. Due to this
leakage lactate dehydrogenase (LDH) activity can be used to determine cytotoxic
effects of administered material.
LDH oxidises lactate to form pyruvate, and in parallel reduces NAD+ to NADH/H+. In
a second step a catalyst transfers hydrogen from NADH/H+ onto the slightly yellow
colored tetrazolium salt INT (2-[4-Iodophenyl]-3-[4-nitrophenyl]-5-
phenyltetrazoliumchloride), by thus reducing it to red colored formazan salt. The color
of the formazan product can be quantified by colorimetric assays. The cytotoxicity is
proportional to LDH released into the supernatant. The amount of released LDH
correlates with the amount of formazan formed, and can therefore be used to quantify
cytotoxicity of a defined cell number [179].
7.3. Chemical Structures
OO
O
OH
OHOH
OH
OHn
OH
ClH
H
Cl
Agarose Dichloromethane (DCM)

87
NH
OH
OH
OH
CH3 OH
OO OH
N
HOOC
S Fenoterol Fluoresceinisothiocyanate (FITC)
N N+
NN
I
NO2 (2-[4-Iodophenyl]-3-[4-nitrophenyl]-5-phenyltetrazoliumchlorid) (INT)
O
OO
OH
OH
OHCH2OH
CH2OHOH
OH
OH
CH2OHHOHHOHOHH
CH2OHOHH
Lactose D – Mannitol

88
N N+
NN
S
N
Br
(3-(4,5-Dimethylthiazol)-2,5-diphenyltetrazolium bromide (MTT)
OH
O
NH2
Oleic acid Oleylamine
**
O OH
n
**
NH3+
n
Cl
Polyacrylic acid (PAA) Polyallylamine hydrochloride (PAH)
O O
O
** n
CH3 CH3
**n
Polycarbonate (PC) Polystyrene (PS)

89
**
SO3
n
- Na+
Poly (sodium 4-styrenesulfonate) (PSS)
O N+
N
CH3
CH3
CH3
CH3
COOH
Cl
Rhodamine B
OO
Hn
Triton X

90
8. List of Abbreviations AAO: Anodic Aluminium Oxide
ACI: Andresen Cascade Impactor
API: Active Pharmaceutical Ingredient
AM: Alveolar Macrophage
CNT: Carbon Nanotubes
COPD: Chronical Obstructive Pulmonary Disease
daer: Aerodynamic Diameter
DCM: Dichloromethane
dgeo: Geometric Diameter
DD: Delivered Dose
DPI: Dry Powder Inhalers
ED: Emitted Dose
EMEA: European Medicines Agency
FDA: Food and Drug Administration
FITC: Fluorescein isothiocyanate
FPF: Fine Particle Fraction
GI: Gastro Intestinal Tract
INT: (2-[4-Iodophenyl]-3-[4-nitrophenyl]-5-phenyltetrazoliumchloride)
LbL: Layer-by-Layer
LDH: Lactate Dehydrogenase
MRI: Magnetic Resonance Imaging
MTT: 3-(4,5-Dimethylthiazol-2-yl)-2,5-diphenyltetrazoliumbromide
MWCNT: Multi-walled Carbon Nanotubes
NPs: Nanoparticles
PAA: Polyacrylic Acid
PAH: Polyallylamine Hydrochloride
PC: Polycarbonate
PEs: Polyelectrolyte
PS: Polystyrene
PSD: Particle Size Distribution
PSS: Poly (sodium 4-styrenesulfonate)
QD: Quantum Dots

91
SEM: Scanning Electron Micrograph
SWCNT: Single-walled Carbon Nanotubes

92
9. References
1. Patton, J.S., C.S. Fishburn, and J.G. Weers, The lungs as a portal of entry for systemic drug delivery. Proc Am Thorac Soc, 2004. 1(4): p. 338-344.
2. Klinke, R., H.C. Pape, and S. Silbernagel, Physiologie. Georg Thieme Verlag, Stuttgart, 2005. 5.
3. Patton, J.S. and P.R. Byron, Inhaling medicines: Delivering drugs to the body through the lungs. Nature Reviews Drug Discovery, 2007. 6(1): p. 67-74.
4. Lippmann, M., D.B. Yeates, and R.E. Albert, DEPOSITION, RETENTION, AND CLEARANCE OF INHALED PARTICLES. British Journal of Industrial Medicine, 1980. 37(4): p. 337-362.
5. Weibel, E.R., MORPHOLOGICAL BASIS OF ALVEOLAR-CAPILLARY GAS-EXCHANGE. Physiological Reviews, 1973. 53(2): p. 419-495.
6. Gehr, P. and J. Heyder, Particle-Lung-Interactions. Marcel Dekker, NY, 2000.
7. Gill, S., et al., Nanoparticles: Characteristics, mechanisms of action, and toxicity in pulmonary drug delivery - A review. Journal of Biomedical Nanotechnology, 2007. 3(2): p. 107-119.
8. Sung, J.C., B.L. Pulliam, and D.A. Edwards, Nanoparticles for drug delivery to the lungs. Trends in Biotechnology, 2007. 25(12): p. 563-570.
9. Chow, A.H.L., et al., Particle engineering for pulmonary drug delivery. Pharmaceutical Research, 2007. 24(3): p. 411-437.
10. Edwards, D.A., A. Ben-Jebria, and R. Langer, Recent advances in pulmonary drug delivery using large, porous inhaled particles. 1998. p. 379-385.
11. Edwards, D.A., et al., Large porous particles for pulmonary drug delivery. Science, 1997. 276(5320): p. 1868-1871.
12. Pharmacotherapy, Pharmacotherapy publications. 2004.
13. Europäisches Arzneibuch 6. Ausgabe. Deutscher Apotheker Verlag, 2008.
14. United States Pharmacopeia 34. 2010.
15. Marple, V.A. and B.Y.H. Liu, CHARACTERISTICS OF LAMINAR JET IMPACTORS. Environmental Science & Technology, 1974. 8(7): p. 648-654.
16. Mitchell, J., S. Newman, and H.K. Chan, In Vitro and In Vivo Aspects of Cascade Impactor Tests and Inhaler Performance: A Review. Aaps Pharmscitech, 2007. 8(4): p. 12.
17. Dolovich, M.A., et al., Consensus statement: aerosols and delivery devices. American Association for Respiratory Care. Respir Care, 2000. 45(6): p. 589-96.

93
18. Vallet-Regi, M., F. Balas, and D. Arcos, Mesoporous materials for drug delivery. Angewandte Chemie-International Edition, 2007. 46(40): p. 7548-7558.
19. Duddu, S.P., et al., Improved lung delivery from a passive dry powder inhaler using an engineered PulmoSphere (R) powder. Pharmaceutical Research, 2002. 19(5): p. 689-695.
20. Mitragotri, S., In Drug Delivery, Shape Does Matter. Pharmaceutical Research, 2009. 26(1): p. 232-234.
21. Sturm, R. and W. Hofmann, A theoretical approach to the deposition and clearance of fibers with variable size in the human respiratory tract. Journal of Hazardous Materials, 2009. 170(1): p. 210-218.
22. Gelperina, S., et al., The Potential Advantages of Nanoparticle Drug Delivery Systems in Chemotherapy of Tuberculosis. Am. J. Respir. Crit. Care Med., 2005. 172(12): p. 1487-1490.
23. Muttil, P., C.C. Wang, and A.J. Hickey, Inhaled Drug Delivery for Tuberculosis Therapy. Pharmaceutical Research, 2009. 26(11): p. 2401-2416.
24. Pandey, R. and G.K. Khuller, Antitubercular inhaled therapy: opportunities, progress and challenges. Journal of Antimicrobial Chemotherapy, 2005. 55(4): p. 430-435.
25. Champion, J. and S. Mitragotri, Shape Induced Inhibition of Phagocytosis of Polymer Particles. Pharmaceutical Research, 2009. 26(1): p. 244-249.
26. Morgan, A., Effect of length on the clearance of fibres from the lung and on body formation. IARC Sci Publ, 1980(30): p. 329-35.
27. Bhaskar, S., et al., Towards Designer Microparticles: Simultaneous Control of Anisotropy, Shape, and Size. Small, 2010. 6(3): p. 404-411.
28. Simone, E.A., T.D. Dziubla, and V.R. Muzykantov, Polymeric carriers: role of geometry in drug delivery. Expert Opinion on Drug Delivery, 2008. 5(12): p. 1283-1300.
29. Shekunov, B.Y., et al., Particle size analysis in pharmaceutics: Principles, methods and applications. Pharmaceutical Research, 2007. 24(2): p. 203-227.
30. Shekunov, B.Y., et al., Aerosolisation behaviour of micronised and supercritically-processed powders. Journal of Aerosol Science, 2003. 34(5): p. 553-568.
31. Pilcer, G. and K. Amighi, Formulation strategy and use of excipients in pulmonary drug delivery. International Journal of Pharmaceutics, 2010. 392(1-2): p. 1-19.
32. Byron, P.R., PREDICTION OF DRUG RESIDENCE TIMES IN REGIONS OF THE HUMAN RESPIRATORY-TRACT FOLLOWING AEROSOL INHALATION. Journal of Pharmaceutical Sciences, 1986. 75(5): p. 433-438.

94
33. Henning, A.M., Nanoparticle Clearance from the Airways. Saarbrücken, 2008.
34. Oberdoerster, G., E. Oberdoerster, and J. Oberdoerster, Nanotoxicology: An emerging discipline evolving from studies of ultrafine particles. Environmental Health Perspectives, 2005. 113(7): p. 823-839.
35. WHO, Referenz Method for Measuring Airborne Man-Made Mineral Fibres (MMMF).Enivronmental Health Report 4. Environmental Health Report 4, 1985: p. 16-35.
36. Su, W.C. and Y.S. Cheng, Deposition of fiber in a human airway replica. Journal of Aerosol Science, 2006. 37(11): p. 1429-1441.
37. Bechthold-Peters, K. and H. Luessen, Pulmonary Drug Delivery. Editio Cantor Verlag, 2005.
38. Tabata, Y. and Y. Ikada, Effect of the size and surface charge of polymer microspheres on their phagocytosis by macrophage. Biomaterials, 1988. 9(4): p. 356-362.
39. Torchilin, V.P., Multifunctional nanocarriers. Advanced Drug Delivery Reviews, 2006. 58(14): p. 1532-1555.
40. Zhou, H.J., et al., Water-Dispersible, Multifunctional, Magnetic, Luminescent Silica-Encapsulated Composite Nanotubes. Small, 2010. 6(3): p. 412-420.
41. Chen, D., et al., Thin Film Instabilities in Blends under Cylindrical Confinement. Macromolecular Rapid Communications, 2009. 30(4-5): p. 377-383.
42. Dames, P., et al., Targeted delivery of magnetic aerosol droplets to the lung. Nature Nanotechnology, 2007. 2(8): p. 495-499.
43. Nunes, J., et al., Multifunctional Shape and Size Specific Magneto-Polymer Composite Particles. Nano Letters, 2010. 10(4): p. 1113-1119.
44. Park, J.H., et al., Magnetic iron oxide nanoworms for tumor targeting and imaging. Advanced Materials, 2008. 20(9): p. 1630-1635.
45. Veiseh, O., J.W. Gunn, and M.Q. Zhang, Design and fabrication of magnetic nanoparticles for targeted drug delivery and imaging. Advanced Drug Delivery Reviews, 2010. 62(3): p. 284-304.
46. Delcea, M., et al., Multicompartmental Micro- and Nanocapsules: Hierarchy and Applications in Biosciences. Macromolecular Bioscience, 2010. 10(5): p. 465-474.
47. Geng, Y., et al., Shape effects of filaments versus spherical particles in flow and drug delivery. Nat Nano, 2007. 2(4): p. 249-255.
48. Nishiyama, N., Nanomedicine: Nanocarriers shape up for long life. Nat Nano, 2007. 2(4): p. 203-204.

95
49. Veblen, D.R. and A.G. Wylie, MINERALOGY OF AMPHIBOLES AND 1/1 LAYER SILICATES, in Health Effects of Mineral Dusts, G.D. Guthrie and B.T. Mossman, Editors. 1993, Mineralogical Soc America: Washington. p. 61-137.
50. Dodson, R.F., M.A.L. Atkinson, and J.L. Levin, Asbestos fiber length as related to potential pathogenicity: A critical review. American Journal of Industrial Medicine, 2003. 44(3): p. 291-297.
51. Currie, G.P., S.J. Watt, and N.A. Maskell, An overview of how asbestos exposure affects the lung. British Medical Journal, 2009. 339: p. 9.
52. Donaldson, K. and C.A. Poland, NANOTOXICOLOGY New insights into nanotubes. Nature Nanotechnology, 2009. 4(11): p. 708-710.
53. Lam, C.W., et al. Pulmonary toxicity of single-wall carbon nanotubes in mice 7 and 90 days after intratracheal instillation. in 42nd Annual Meeting of the Society-of-Toxicology. 2003. Salt Lake City, Utah: Oxford Univ Press.
54. Donaldson, K., et al., Carbon nanotubes: A review of their properties in relation to pulmonary toxicology and workplace safety. Toxicological Sciences, 2006. 92(1): p. 5-22.
55. Thess, A., et al., Crystalline ropes of metallic carbon nanotubes. Science, 1996. 273(5274): p. 483-487.
56. Eastes, W. and J.G. Hadley, A mathematical model of fiber carcinogenicity and fibrosis in inhalation and intraperitoneal experiments in rats. Inhalation Toxicology, 1996. 8(4): p. 323-343.
57. Tran, C.L., et al., Inhalation of poorly soluble particles. II. Influence of particle surface area on inflammation and clearance. Inhalation Toxicology, 2000. 12(12): p. 1113-1126.
58. Lippmann, M., Effects of fiber characteristics on lung deposition, retention, and disease. Environmental Health Perspectives, 1990. 88: p. 311-317.
59. CRITERIA FOR THE DIAGNOSIS OF ASBESTOSIS AND CONSIDERATIONS IN THE ATTRIBUTION OF LUNG-CANCER AND MESOTHELIOMA TO ASBESTOS EXPOSURE. International Archives of Occupational and Environmental Health, 1982. 49(3-4): p. 357-361.
60. Mossman, B.T. and A. Churg, Mechanisms in the pathogenesis of asbestosis and silicosis. American Journal of Respiratory and Critical Care Medicine, 1998. 157(5): p. 1666-1680.
61. Mauderly, J.L., Y.S. Cheng, and M.B. Snipes, PARTICLE OVERLOAD IN TOXICOLOGICAL STUDIES - FRIEND OR FOE. Journal of Aerosol Medicine-Deposition Clearance and Effects in the Lung, 1990. 3: p. S169-S187.
62. Davis, J.M.G. and A.D. Jones, COMPARISONS OF THE PATHOGENICITY OF LONG AND SHORT FIBERS OF CHRYSOTILE ASBESTOS IN RATS. British Journal of Experimental Pathology, 1988. 69(5): p. 717-737.

96
63. Coin, P.G., V.L. Roggli, and A.R. Brody, PERSISTENCE OF LONG, THIN CHRYSOTILE ASBESTOS FIBERS IN THE LUNGS OF RATS. Environmental Health Perspectives, 1994. 102: p. 197-199.
64. Miller, F.J., Dosimetry of particles in laboratory animals and humans in relationship to issues surrounding lung overload and human health risk assessment: A critical review. Inhalation Toxicology, 2000. 12(1-2): p. 19-57.
65. Fischer, K.E., et al., Biomimetic Nanowire Coatings for Next Generation Adhesive Drug Delivery Systems. Nano Letters, 2009. 9(2): p. 716-720.
66. Autumn, K., et al., Adhesive force of a single gecko foot-hair. Nature, 2000. 405(6787): p. 681-685.
67. Doshi, N. and S. Mitragotri, Macrophages Recognize Size and Shape of Their Targets. Plos One, 2010. 5(3): p. 6.
68. Beningo, K.A. and Y.L. Wang, Fc-receptor-mediated phagocytosis is regulated by mechanical properties of the target. Journal of Cell Science, 2002. 115(4): p. 849-856.
69. Champion, J.A., Y.K. Katare, and S. Mitragotri. Particle shape: A new design parameter for micro- and nanoscale drug delivery carriers. in 4th International Nanomedicine and Drug Delivery Symposium. 2006. Omaha, NE: Elsevier Science Bv.
70. Cannon, G.J. and J.A. Swanson, THE MACROPHAGE CAPACITY FOR PHAGOCYTOSIS. Journal of Cell Science, 1992. 101: p. 907-913.
71. Gratton, S.E.A., et al., The effect of particle design on cellular internalization pathways. Proceedings of the National Academy of Sciences of the United States of America, 2008. 105(33): p. 11613-11618.
72. Champion, J.A. and S. Mitragotri, Role of target geometry in phagocytosis. Proceedings of the National Academy of Sciences of the United States of America, 2006. 103(13): p. 4930-4934.
73. Huang, Z.M., et al., A review on polymer nanofibers by electrospinning and their applications in nanocomposites. Composites Science and Technology, 2003. 63(15): p. 2223-2253.
74. Greiner, A., et al., Biohybrid nanosystems with polymer nanofibers and nanotubes. Applied Microbiology and Biotechnology, 2006. 71(4): p. 387-393.
75. Doshi, J. and D.H. Reneker, ELECTROSPINNING PROCESS AND APPLICATIONS OF ELECTROSPUN FIBERS. Journal of Electrostatics, 1995. 35(2-3): p. 151-160.
76. Kenawy, E.R., et al., Release of tetracycline hydrochloride from electrospun poly(ethylene-co-vinylacetate), poly(lactic acid), and a blend. Journal of Controlled Release, 2002. 81(1-2): p. 57-64.

97
77. Yoo, H.S., T.G. Kim, and T.G. Park, Surface-functionalized electrospun nanofibers for tissue engineering and drug delivery. Advanced Drug Delivery Reviews, 2009. 61(12): p. 1033-1042.
78. Bognitzki, M., et al., Polymer, metal, and hybrid nano- and mesotubes by coating degradable polymer template fibers (TUFT process). Advanced Materials, 2000. 12(9): p. 637-640.
79. Martin, C.R., TEMPLATE SYNTHESIS OF POLYMERIC AND METAL MICROTUBULES. Advanced Materials, 1991. 3(9): p. 457-459.
80. Martin, C.R., NANOMATERIALS - A MEMBRANE-BASED SYNTHETIC APPROACH. Science, 1994. 266(5193): p. 1961-1966.
81. Martin, C.R., R. Parthasarathy, and V. Menon, Template synthesis of electronically conductive polymers - A new route for achieving higher electronic conductivities. Synthetic Metals, 1993. 55(2-3): p. 1165-1170.
82. Martin, C.R., et al., TEMPLATE SYNTHESIS OF ORGANIC MICROTUBULES. Journal of the American Chemical Society, 1990. 112(24): p. 8976-8977.
83. Steinhart, M., et al., Nanotubes by template wetting: A modular assembly system. Angewandte Chemie-International Edition, 2004. 43(11): p. 1334-1344.
84. Steinhart, M., et al., Polymer nanotubes by wetting of ordered porous templates. Science, 2002. 296(5575): p. 1997-1997.
85. Steinhart, M., J.H. Wendorff, and R.B. Wehrspohne, Nanotubes a la carte: Wetting of porous templates. Chemphyschem, 2003. 4(11): p. 1171-1176.
86. Schlitt, S., A. Greiner, and J.H. Wendorff, Cylindrical polymer nanostructures by solution template wetting. Macromolecules, 2008. 41(9): p. 3228-3234.
87. Kyotani, T., L.F. Tsai, and A. Tomita, Preparation of ultrafine carbon tubes in nanochannels of an anodic aluminum oxide film. Chemistry of Materials, 1996. 8(8): p. 2109-2113.
88. Ai, S.F., et al., Highly flexible polyelectrolyte nanotubes. Journal of the American Chemical Society, 2003. 125(37): p. 11140-11141.
89. Dougherty, S. and J. Liang, Fabrication of segmented nanofibers by template wetting of multilayered alternating polymer thin films. Journal of Nanoparticle Research, 2009. 11(3): p. 743-747.
90. Dougherty, S.A., D.W. Zhang, and J.Y. Liang, Fabrication of Protein Nanotubes Using Template-Assisted Electrostatic Layer-by-Layer Methods. Langmuir, 2009. 25(22): p. 13232-13237.
91. Hou, S.F., et al., Layer-by-layer nanotube template synthesis. Journal of the American Chemical Society, 2004. 126(18): p. 5674-5675.

98
92. Tian, Y., et al., Fabrication of protein nanotubes based on layer-by-layer assembly. Biomacromolecules, 2006. 7(9): p. 2539-2542.
93. Tian, Y., et al., Assembly of nanotubes of poly(4-vinylpyridine) and poly(acrylic acid) through hydrogen bonding. Chemistry-a European Journal, 2006. 12(18): p. 4808-4812.
94. Tian, Y., et al., Fabrication of fluorescent nanotubes basel on layer-by-layer assembly via covalent bond. Langmuir, 2006. 22(1): p. 360-362.
95. Hillebrenner, H., et al., Template synthesized nanotubes for biomedical delivery applications. Nanomedicine, 2006. 1(1): p. 39-50.
96. Son, S.J., et al., Template synthesis of multifunctional nanotubes for controlled release. Journal of Controlled Release, 2006. 114(2): p. 143-152.
97. Yang, Y., et al., Assembled alginate/chitosan nanotubes for biological application. Biomaterials, 2007. 28(20): p. 3083-3090.
98. Mitchell, D.T., et al., Smart nanotubes for bioseparations and biocatalysis. Journal of the American Chemical Society, 2002. 124(40): p. 11864-11865.
99. He, Q., et al., Layer-by-layer assembly of magnetic polypeptide nanotubes as a DNA carrier. Journal of Materials Chemistry, 2008. 18(7): p. 748-754.
100. Hou, S.F., J.H. Wang, and C.R. Martin, Template-synthesized DNA nanotubes. Journal of the American Chemical Society, 2005. 127(24): p. 8586-8587.
101. Li, S.F.Y., S.S. Mark, and L.J. Kricka, Polymeric Nanotubes and Nanorods for Biomedical Applications. Current Nanoscience, 2009. 5(2): p. 182-188.
102. Son, S.J., et al. Template synthesis of multifunctional nanotubes for controlled release. in 3rd International Nanomedicine and Drug Delivery Symposium. 2005. Baltimore, MD: Elsevier Science Bv.
103. Grimm, S., et al., Nondestructive replication of self-ordered nanoporous alumina membranes via cross-linked polyacrylate nanofiber arrays. Nano Letters, 2008. 8(7): p. 1954-1959.
104. Grimm, S., et al., Nondestructive mechanical release of ordered polymer microfiber arrays from porous templates. Small, 2007. 3(6): p. 993-1000.
105. Steinhart, M., Supramolecular Organization of Polymeric Materials in Nanoporous Hard Templates, in Self-Assembled Nanomaterials Ii: Nanotubes. 2008, Springer-Verlag Berlin: Berlin. p. 123-187.
106. Masuda, H. and K. Fukuda, ORDERED METAL NANOHOLE ARRAYS MADE BY A 2-STEP REPLICATION OF HONEYCOMB STRUCTURES OF ANODIC ALUMINA. Science, 1995. 268(5216): p. 1466-1468.
107. Baker, L.A. and S.P. Bird, Nanopores - A makeover for membranes. Nature Nanotechnology, 2008. 3(2): p. 73-74.

99
108. Baker, L.A., P. Jin, and C.R. Martin, Biomaterials and biotechnologies based on nanotube membranes. Critical Reviews in Solid State and Materials Sciences, 2005. 30(4): p. 183-205.
109. Osulliva.Jp and G.C. Wood, MORPHOLOGY AND MECHANISM OF FORMATION OF POROUS ANODIC FILMS ON ALUMINIUM. Proceedings of the Royal Society of London Series a-Mathematical and Physical Sciences, 1970. 317(1531): p. 511-&.
110. Thompson, G.E., et al., NUCLEATION AND GROWTH OF POROUS ANODIC FILMS ON ALUMINUM. Nature, 1978. 272(5652): p. 433-435.
111. Schlitt, S., NANOSTRUKTUREN DURCH LÖSUNGSBENETZUNG VON PORÖSEN TEMPLATEN. Dissertation, 2007.
112. Xiao, Z.L., et al., Fabrication of alumina nanotubes and nanowires by etching porous alumina membranes. Nano Letters, 2002. 2(11): p. 1293-1297.
113. Fleisher, R.L., P.B. Price, and R.M. Walker, Nuclear tracks in solids. University of California Press, Berkley, CA, 1975.
114. Hulteen, J.C. and C.R. Martin, A general template-based method for the preparation of nanomaterials. Journal of Materials Chemistry, 1997. 7(7): p. 1075-1087.
115. Ai, S.F., et al., Conductive polypyrrole and poly(allylamine hydrochloride) nanotubes fabricated with layer-by-layer assembly. Macromolecular Rapid Communications, 2005. 26(24): p. 1965-1969.
116. He, Q., H. Mohwald, and J.B. Li, Layer-by-Layer Assembled Nanotubes as Biomimetic Nanoreactors for Calcium Carbonate Deposition. Macromolecular Rapid Communications, 2009. 30(18): p. 1538-1542.
117. Roy, C.J., et al., Growth Mechanism of Confined Polyelectrolyte Multilayers in Nanoporous Templates. Langmuir, 2010. 26(5): p. 3350-3355.
118. Gong, X.Z., et al., Preparation and characterization of La-Co alloy nanowire arrays by electrodeposition in AAO template under nonaqueous system. Transactions of Nonferrous Metals Society of China, 2008. 18(3): p. 642-647.
119. Huang, J. and T. Kunitake, Nanotubings of titania/polymer composite: template synthesis and nanoparticle inclusion. Journal of Materials Chemistry, 2006. 16(43): p. 4257-4264.
120. Dougherty, S. and J. Liang, Core-shell polymer nanorods by a two-step template wetting process. Nanotechnology, 2009. 20(29): p. 7.
121. Parthasarathy, R.V. and C.R. Martin, TEMPLATE-SYNTHESIZED POLYANILINE MICROTUBULES. Chemistry of Materials, 1994. 6(10): p. 1627-1632.

100
122. Yang, S.M., K.H. Chen, and Y.F. Yang, Synthesis of polyaniline nanotubes in the channels of anodic alumina membrane. Synthetic Metals, 2005. 152(1-3): p. 65-68.
123. Parthasarathy, R.V. and C.R. Martin, SYNTHESIS OF POLYMERIC MICROCAPSULE ARRAYS AND THEIR USE FOR ENZYME IMMOBILIZATION. Nature, 1994. 369(6478): p. 298-301.
124. Zhang, M.F., et al., Wetting transition in cylindrical alumina nanopores with polymer melts. Nano Letters, 2006. 6(5): p. 1075-1079.
125. DeGennes, P.G., WETTING - STATICS AND DYNAMICS. Reviews of Modern Physics, 1985. 57(3): p. 827-863.
126. Moon, S.I. and T.J. McCarthy, Template synthesis and self-assembly of nanoscopic polymer "pencils". Macromolecules, 2003. 36(12): p. 4253-4255.
127. Martin, J. and C. Mijangos, Tailored Polymer-Based Nanofibers and Nanotubes by Means of Different Infiltration Methods into Alumina Nanopores. Langmuir, 2009. 25(2): p. 1181-1187.
128. Steinhart, M., et al., Morphology of polymer/liquid-crystal nanotubes: Influence of confinement. Advanced Functional Materials, 2005. 15(10): p. 1656-1664.
129. Zheng, R.K., et al., A simple and convenient route to prepare poly(vinylidene fluoride trifluoroethylene) copolymer nanowires and nanotubes. Chemical Communications, 2005(11): p. 1447-1449.
130. Decher, G., Fuzzy nanoassemblies: Toward layered polymeric multicomposites. Science, 1997. 277(5330): p. 1232-1237.
131. Decher, G. and J.B. Schlenoff, Multilayer Thin Films. Wiley-VCH Verlag GmbH & Co. KGaA, 2002.
132. Iler, R.K., MULTILAYERS OF COLLOIDAL PARTICLES. Journal of Colloid and Interface Science, 1966. 21(6): p. 569-&.
133. Ariga, K., J.P. Hill, and Q.M. Ji, Layer-by-layer assembly as a versatile bottom-up nanofabrication technique for exploratory research and realistic application. Physical Chemistry Chemical Physics, 2007. 9(19): p. 2319-2340.
134. Bertrand, P., et al., Ultrathin polymer coatings by complexation of polyelectrolytes at interfaces: suitable materials, structure and properties. Macromolecular Rapid Communications, 2000. 21(7): p. 319-348.
135. Volodkin, D. and M. Mohwald, Drug Delivery: Polyelectrolyte Multilayers. Encyclopedia of Surface and Colloida Science, 2009. Second Edition.
136. Caruso, F., Hollow capsule processing through colloidal templating and self-assembly. Chemistry-a European Journal, 2000. 6(3): p. 413-419.
137. Caruso, F., Hollow inorganic capsules via colloid-templated layer-by-layer electrostatic assembly. Colloid Chemistry Ii, 2003. 227: p. 145-168.

101
138. Caruso, F., R.A. Caruso, and H. Moehwald, Nanoengineering of inorganic and hybrid hollow spheres by colloidal templating. Science, 1998. 282(5391): p. 1111-1114.
139. Lynn, D.M., Layers of opportunity: nanostructured polymer assemblies for the delivery of macromolecular therapeutics. Soft Matter, 2006. 2(4): p. 269-273.
140. Cooper, T.M., A.L. Campbell, and R.L. Crane, FORMATION OF POLYPEPTIDE-DYE MULTILAYERS BY AN ELECTROSTATIC SELF-ASSEMBLY TECHNIQUE. Langmuir, 1995. 11(7): p. 2713-2718.
141. Fendler, J.H., Self-assembled nanostructured materials. Chemistry of Materials, 1996. 8(8): p. 1616-1624.
142. De Geest, B.G., et al., Release mechanisms for polyelectrolyte capsules. Chem Soc Rev, 2007. 36(4): p. 636-49.
143. Manna, U. and S. Patil, Dual Drug Delivery Microcapsules via Layer-by-Layer Self-Assembly. Langmuir, 2009. 25(18): p. 10515-10522.
144. Schlenoff, J.B., S.T. Dubas, and T. Farhat, Sprayed polyelectrolyte multilayers. Langmuir, 2000. 16(26): p. 9968-9969.
145. Köhler, K., Temperature-Induced Rearrangements of Polyelectrolyte Multilayer Capsules: Mechanisms and Applications. Dissertation, 2006: p. 142.
146. Elsner, N., Nanomechanik und Adhäsion von Polyeletrolytemulitschicht-Hohlkapseln. Dissertation, 2005.
147. Ladam, G., et al., In situ determination of the structural properties of initially deposited polyelectrolyte multilayers. Langmuir, 2000. 16(3): p. 1249-1255.
148. Dubas, S.T. and J.B. Schlenoff, Factors controlling the growth of polyelectrolyte multilayers. Macromolecules, 1999. 32(24): p. 8153-8160.
149. Losche, M., et al., Detailed structure of molecularly thin polyelectrolyte multilayer films on solid substrates as revealed by neutron reflectometry. Macromolecules, 1998. 31(25): p. 8893-8906.
150. Dubas, S.T. and J.B. Schlenoff, Swelling and smoothing of polyelectrolyte multilayers by salt. Langmuir, 2001. 17(25): p. 7725-7727.
151. Jomaa, H.W. and J.B. Schlenoff, Salt-induced polyelectrolyte interdiffusion in multilayered films: A neutron reflectivity study. Macromolecules, 2005. 38(20): p. 8473-8480.
152. Dubas, S.T., T.R. Farhat, and J.B. Schlenoff, Multiple membranes from "true" polyelectrolyte multilayers. Journal of the American Chemical Society, 2001. 123(22): p. 5368-5369.
153. Dubas, S.T. and J.B. Schlenoff, Polyelectrolyte multilayers containing a weak polyacid: Construction and deconstruction. Macromolecules, 2001. 34(11): p. 3736-3740.
102
154. Cho, J. and F. Caruso, Polymeric multilayer films comprising deconstructible hydrogen-bonded stacks confined between electrostatically assembled layers. Macromolecules, 2003. 36(8): p. 2845-2851.
155. Sukhishvili, S.A. and S. Granick, Layered, erasable, ultrathin polymer films. Journal of the American Chemical Society, 2000. 122(39): p. 9550-9551.
156. Sukhishvili, S.A. and S. Granick, Layered, erasable polymer multilayers formed by hydrogen-bonded sequential self-assembly. Macromolecules, 2002. 35(1): p. 301-310.
157. Köhler, K. and G.B. Sukhorukov, Heat treatment of polyelectrolyte multilayer capsules: A versatile method for encapsulation. Advanced Functional Materials, 2007. 17(13): p. 2053-2061.
158. Mansouri, S., F.M. Winnik, and M. Tabrizian, Modulating the release kinetics through the control of the permeability of the layer-by-layer assembly: a review. Expert Opinion on Drug Delivery, 2009. 6(6): p. 585-597.
159. Lee, D., et al., pH-induced hysteretic gating of track-etched polycarbonate membranes: Swelling/deswelling behavior of polyelectrolyte multilayers in confined geometry. Journal of the American Chemical Society, 2006. 128(26): p. 8521-8529.
160. Dai, J.H., G.L. Baker, and M.L. Bruening, Use of porous membranes modified with polyelectrolyte multilayers as substrates for protein arrays with low nonspecific adsorption. Analytical Chemistry, 2006. 78(1): p. 135-140.
161. Lee, D., R.E. Cohen, and M.F. Rubner, Heterostructured magnetic nanotubes. Langmuir, 2007. 23(1): p. 123-129.
162. Alem, H., et al., Layer-by-layer assembly of polyelectrolytes in nanopores. Macromolecules, 2007. 40(9): p. 3366-3372.
163. Champion, J.A., Y.K. Katare, and S. Mitragotri, Making polymeric micro- and nanoparticles of complex shapes. Proceedings of the National Academy of Sciences of the United States of America, 2007. 104(29): p. 11901-11904.
164. Dendukuri, D., et al., Continuous-flow lithography for high-throughput microparticle synthesis. Nature Materials, 2006. 5(5): p. 365-369.
165. Martin, C.R., R. Parthasarathy, and V. Menon, Template synthesis of electronically conductive polymers--preparation of thin films. Electrochimica Acta, 1994. 39(8-9): p. 1309-1313.
166. Hurst, S.J., et al., Multisegmented one-dimensional nanorods prepared by hard-template synthetic methods. Angewandte Chemie-International Edition, 2006. 45(17): p. 2672-2692.
167. Erickson, R.O., Tubular Packing of Spheres in Biological Fine Structure. Science, 1973. 181(4101): p. 705-716.

103
168. Li, F., et al., Fabrication of colloidal crystals with tubular-like packings. Journal of the American Chemical Society, 2005. 127(10): p. 3268-3269.
169. Li, F., et al., Synthesis of porous wires from directed assemblies of nanospheres. Journal of the American Chemical Society, 2003. 125(52): p. 16166-16167.
170. Tymczenko, M., et al., Colloidal crystal wires. Advanced Materials, 2008. 20(12): p. 2315-2318.
171. Quinn, J.F., et al., Next generation, sequentially assembled ultrathin films: beyond electrostatics. Chemical Society Reviews, 2007. 36(5): p. 707-718.
172. Botterhuis, N.E., et al., Hollow silica spheres with an ordered pore structure and their application in controlled release studies. Chemistry-a European Journal, 2006. 12(5): p. 1448-1456.
173. Duan, H.W., et al., Colloidally stable amphibious nanocrystals derived from poly {[2-(dimethylamino)ethyl] methaerylate} capping. Angewandte Chemie-International Edition, 2005. 44(11): p. 1717-1720.
174. Mao, Z.W., et al., Hydrogen-Bond-Selective Phase Transfer of Nanoparticles across Liquid/Gel Interfaces. Angewandte Chemie-International Edition, 2009. 48(27): p. 4953-4956.
175. Peyratout, C.S. and L. Dähne, Tailor-made polyelectrolyte microcapsules: From multilayers to smart containers. Angewandte Chemie - International Edition, 2004. 43(29): p. 3762-3783.
176. Bai, S., et al., Using Hydrogels to Accommodate Hydrophobic Nanoparticles in Aqueous Media via Solvent Exchange. Advanced Materials, 2010. 22(30): p. 3247-3250.
177. Kreyling, W. and G. Scheuch, Clearance of Particles Deposited in the Lungs. Particle-Lung-Interaction, 2000: p. 323-376.
178. Sukhorukov, G., A. Fery, and H. Mohwald, Intelligent micro- and nanocapsules. Progress in Polymer Science (Oxford), 2005. 30(8-9): p. 885-897.
179. Daum, N., et al., In Vitro Systems for Studying Epithelial Transport of Macromolecules. 2010. p. 1-14.
180. Chanana, M., et al., Interaction of Polyelectrolytes and Their Composites with Living Cells. Nano Letters, 2005. 5(12): p. 2605-2612.
181. http://www.de.european-lung-foundation.org/index.php?id=181, 28.10.2010.
182. Atkins, P.W., Physical Chemistry. Oxford University Press, 1994 (5th Edition).
183. Hou, S.F., J.H. Wang, and C.R. Martin, Template-synthesized protein nanotubes. Nano Letters, 2005. 5(2): p. 231-234.

104
184. Ono, S.S. and G. Decher, Preparation of ultrathin self-standing polyelectrolyte multilayer membranes at physiological conditions using pH-responsive film segments as sacrificial layers. Nano Letters, 2006. 6(4): p. 592-598.

105
Curriculum Vitae Personal Data: Date of Birth: 18.08.1983 Place of Birth: Hamburg, Germany Nationality: German
Education: Since 2008: PhD
“Preparation of asymmetric particles” Supervision: Prof. C.M. Lehr, Jun. Prof. M. Schneider, Prof. H. Möhwald, Prof. D. Wang, Dr. M. Wolkenhauer Collaboration: Pharmaceutical Technology at Saarland University Department of Pharmaceutics and Pharmaceutical Technology, Max Planck Institute of Colloids and Interfaces, Boehringer Ingelheim
2002 – 2007 : University
Degree in Pharmacy at University of Bonn (Germany) 2007 : Clinical traineeship
Alte Apotheke, Bonn (Germany) 2007 : Clinical traineeship
Boehringer Ingelheim, Ingelheim (Germany), Pharmaceutical Company Pulmonary drug delivery, clinical traineeship 2005 : Erasmus (8month)
Erasmus project at University of Tromso (Norway) at the pharmaceutical technology department under supervision of Prof. A. Bauer Brandl
1993 – 2002 : A-levels Gutenberg Schule, Wiesbaden (Germany) 1999 - 2000 : Boarding School King’s Hospital (Dublin/Ireland)
Internship: 2006 : Internship (3weeks)
Institute of clinical pharmacy, Bonn (Germany), pharmaceutical advisory research under supervision of Prof. U. Jaehde and Dr. S. Simons
2004 : Internship (2weeks) Boehringer Ingelheim, Ingelheim (Germany), Pharmaceutical Company Introduction in the development of new products 2003 : Internship (4weeks) Falkenapotheke, Naurod (Germany), clinical traineeship (4weeks) Introductions in workflow in the official pharmacy 2003 : Internship (4weeks)
Institute of pharmaceutical chemistry, Bonn (Germany), clinical traineeship under supervision of Prof. C. Müller, Dr. M. Andrä,

106
Language Competences:
• English (speak, read and write fluently) • German (native speaker)
Fields of research:
• Nanoparticles • Synthesis of asymmetric particles • Layer by Layer method • Pulmonary drug delivery
Conference Contributions: 1. Biological barriers 2010, Saarbrücken, Germany. Talk: “Elongated asymmetric
polyelectrolyte particles from particles” (2010). 2. Controlled Release society 2010, Portland, USA. Talk: “Preparation of elongated
polyelectrolyte particles from particles” (2010). 3. NanoBio 2010, Zürich, Swiss, Poster: “Elongated asymmetric polyelectrolyte particles from
particles” (2010).
Awards: Travel grant, Controlled release society, German chapter (2010) 1st price: Photo competition, NanoBioNet (2010) “Gefrorene Welle”

107
Publication List
Contribution to Scientific Conferences
Podium:
Kohler D., Schneider M., Lehr C.-M., Krüger M., Möhwald H., Wang, D.: Preparation
of elongated polyelectrolyte particles from particles. 8th international conference and
workshop on biological barriers, Saarbrücken, Germany, March 2010
Kohler D., Schneider M., Lehr C.-M., Krüger M., Möhwald H., Wang, D.: Preparation
of elongated polyelectrolyte particles from particles. 37th Annual Meeting and
Exposition of the Controlled Release Society, Portland, USA, July 2010
Posters:
Schoenbrodt T., Egen M., Heyder K., Kohler D., Kranz Y., Mueller C., Schiewe J.:
Method Developement for Deposition Studies in a Nasal Cast. Respiratory Drug
Delivery, Orlando, USA, April 2010-10-13
Kohler D., Schneider M., Lehr C.-M., Krüger M., Möhwald H., Wang, D.: Preparation
of elongated polyelectrolyte particles from particles. 3rd International NanoBio
Conference, Zurich, Switzerland, August 2010

108
Acknowledgements First, I would like to thank Prof. Dr. Claus-Michael Lehr for giving me the opportunity
to join his working group and write my Ph.D. thesis there.
I owe my deepest gratitude to Prof. Dr. Helmuth Möhwald, in whose institute was
allowed to carry out most of my experiments. In this department there was always an
open, international atmosphere as well as outstanding equipment placed at my
disposal. Thank you for the invaluable scientific input and for all your personal advice
over the past three years.
This thesis would not have been possible without the numerous discussions with
Prof. Dayang Wang, who helped to successfully move my thesis forward with all his
ideas and suggestions for optimizing the techniques used.
Furthermore I would like to thank Jun. Prof. Marc Schneider, my supervisor in
Saarbrücken, for his scientific input and assistance with administrative questions.
Without the co-operation of Boehringer Ingelheim, in particular Dr. Michael Krüger,
Dr. Regis Cartier and Dr. Markus Wolkenhauer, this thesis would not have been
possible. Thanks for all the brainstorming sessions and for providing me access to
Boehringer Ingelheim facilities to carry out experiments.
Without “the coffee corner” and all the members of my working group the past three
years would not have been as stimulating and lively. I am indebted to my many
colleagues for their support. I am especially grateful to my constant summerschool
roommate Stephanie Riedel for always being there when I needed her. My thanks
also go to Dmitri Fix for his company in the basement during endless CLSM
measurements and for all his help with various computer programs. I am grateful to
all my office colleagues for the great working atmosphere, all their help with SEM
measurements (Dr. Zhengwei Mao and Dr. Wei Li), and for the new laughter lines on
my face (Dr. Marta Kolasińska, Prof. Dr. Ali Abou Hassan und Dr. Antonio Stocco).

109
Furthermore I would like to thank my hockey team for helping me maintain a healthy
balance between work and leisure; I have had an unforgettable time in Berlin.
Finally and most importantly, I would like to thank my family, who have suffered with
me in bad times and shared the joy in good times. Thanks for your endless love and
support for everything I do.