asx/media announcement asx: ypb 31 october...
TRANSCRIPT

Review of Q3 2018 Activities
• Q3 net operating cash burn falls 8% on Q2, 38% on Q1
• Most significant sales period in YPB’s history
• Major technology breakthrough with smartphone readability
• Strategic investors to lead listing YPB Token in Q4 2018
Anti-Counterfeit and Customer Engagement solutions provider YPB Group Ltd (ASX: YPB) presents a summary of activities for the quarter ended 30 September 2018.
Operating cashflows improve
The improved trend of reduced cash consumption continued in the September quarter with net operating cash burn falling 8% from Q2 and 38% from Q1 to $1.1m. The true operational improvement in Q3 from Q2 was masked by an R&D tax refund in Q2 not repeated in Q3. Removing that impact, Q3 saw a 24% improvement in net operating cash burn on Q2.
Reduced overhead was the biggest contributor to the Q3 improvement being 14% or $240,000 lower than Q2 - nearly $1m annualised. This reflected further benefit from the cost reduction programme begun in 2017 and continued tight cost management. The main contributor to the lower overhead was lower staff costs driven by full period benefits of prior cost cuts, lower headcount and better alignment of role cost with role contribution.
As advised to the market on 22 October 2018, non-COGS cash overhead has been cut a further $1.5m annualised effective 1 October 2018 to take the total reduction in cost since the programme began to $6.1m or 55%. The new annual cash overhead will be $5.0m from $6.5m. This has been achieved while lifting operational effectiveness and increasing reve-nue generating roles. As previously advised, non-recurring cash restructuring costs of the October 2018 initiative of $120k will be felt primarily in Q4 with a further minor payment in Q1 2019.
Cash receipts in Q3 rose 6%. Revenue for the quarter essentially continued the flat trend of 2018 with annualised revenue running at circa $2m. Q4 2018, however, is expected to see an obvious rise in both revenue and receipts as the slew of client wins since June 2018 begin contributing revenue and cash.
Significantly, the flat revenue and receipts trend of the first three quarters masks a valuable improvement in earnings quality. This is observable in COGS/revenue falling from 45% in Q2 to 25% in Q3 - in other words cash gross margin lifted from 55% in Q2 to 75% in Q3. That
ASX/MEDIA ANNOUNCEMENT
ASX: YPB 31 October 2018

reflects a revenue mix shift in the quarter in favour of high margin proprietary anti-counterfeit and engagement solutions and away from third-party anti-theft solutions. Although gross margin will fluctuate periodically, it should increase and be sustained at high levels over time due to an increased proportion of proprietary solutions sales. Selling more own-IP so-lutions will be one of the key paths to profitability as almost the entirety of each incremental revenue dollar converts to profit.
Technology breakthrough smartphone reading of Motif Micro mark
As announced 24 August 2018, YPB achieved a major breakthrough with its Motif Micro technology in successfully reading a forensic anti-counterfeit mark with unmodified smartphone. YPB owns the global perpetual rights to the Motif Micro patent family. The application is developed for IOS and ready to be implemented more widely. Its commer-cial potential is substantial due to it being a true mass market solution. This step was proof of concept and development to full commercial launch will occur in 2019.
Significant business progress
Q3 2018 is the first period in which the benefits of the major operational restructure since mid-2017 have become visible in the form of client wins. In the four month period from mid-June to mid October 2018 the number of new client signings was quadruple that achieved in the preceding 12 months and was the highest number of client wins in such a short period in YPB’s history. That recent operational momentum reflects the benefits of the stronger sales team, culture and processes and a more focussed targeting of prospective sectors.
Further, the new client wins include more high value clients with greater potential to grow into multi-million dollar accounts than any prior time in YPB’s history. Global majors in wine, autos, lubricants and consumer electronics became clients for the first time with most expected to contribute revenue in Q4 2018 and to drive the visible improvement in revenue and receipts expected in Q4 as noted above.
The greater client wins also demonstrates the benefits of new channel partners secured in Q2 or Q3 and more generally the effectiveness of YPB’s channel partner strategy:
• Cannabis industry in partnership with Namaste Technologies – 4 vape manufacturer clients signed with products and components to be marked with ProtectCode for anti-counterfeit protection and ultimately customer engagement. The Cannabis Confirmed initiative with Namaste seeks to become the authentication standard for the Canadian, Australian and ultimately global cannabis industries;
• China – 3 new channel partners with 4 new clients – each partner is a supplier to, or assembler for, global major clients in auto components, lubricants and consumer electronics and YPB tracer will mark components to protect against counterfeit;
• Australian Made Campaign – 2 clients – Ugg Since 1978 and Bluey Merino – seeking to demonstrate authenticity and develop customer engagement capabilities;

• Wine industry – Accolade Wines, a global wine major – initially on the Grant Burge range for both anti-counterfeit and engagement with a globally dispersed customer base;
• Pakistan – in partnership with an impeccably connected former FMCG executive – Dalda Foods – Pakistan’s dominant edible oils producer. Soon after signing with YPB, Dalda ran a consumer response campaign based on potato chip packets bearing YPB QR codes and was delighted with a far greater than expected response.
An important regulatory development in the period was the new China Cross-Border E-Commerce law of August 2018. The new law is in part intended to ensure Chinese consumers buying online from offshore are protected from counterfeit and receive the authentic product they intended to purchase. At a minimum, the new law will raise awareness of the need for anti-counterfeit solutions for brands exporting to China. The introduction date of 1 January 2019 will launch an interesting test of the Government’s implementation intent.
Funding and Token Sale Initiative
A new equity raise of $1.62m at 1.8 cents per share was completed in August 2018 and followed a USD100k placement to cannabis sector partner Namaste at 3 cents per share earlier in Q3.
A further $1.5m was raised via a Convertible Note to a group of token-related strategic investors. The note was subject to approval at an EGM held 30 October 2018 where share-holder approval was secured.
The consortium of Note investors is experienced and well networked in crypto token and currency circles and will list the YPB Token directly on relevant exchanges. Listing increases the probability of successfully raising token funds, although realisation of cash is likely over a 12-24 month period. The investors have demonstrated their view of the likely success of the YPB Token by investing in YPB itself and are very optimistic as to the token’s likely success. The raise target remains US$30m and listing is intended in Q4 2018.
YPB Executive Chairman John Houston said: “Q3 was encouraging in terms of clients se-cured and net cash consumption falling further. It’s particularly gratifying to see sales pro-gress after a lean period due to the necessary but painful restructuring of the past 16 months. Over time, higher revenues, lowers costs and a likely mix shift in favour of high mar-gin proprietary products will work together to create positive jaws that can lift the company to profitability. We are intent on achieving that as quickly as possible.”

For further information please contact:
Mr. John Houston Mr. Gerard Eakin Executive Chairman Director YPB Group Limited YPB Group Limited T: +61 458 701 088 T: +61 427 011 596 E: [email protected] E: [email protected]
About YPB:
YPB Group Ltd (ASX:YPB) lives by three words - certainty of authenticity. We deliver on this through our experience in creating revolutionary, patented anti-counterfeit and customer engagement solutions. Solutions that detect and prove certainty of authenticity and con-nect brands directly to their customers, empowering them to engage one-on-one.
In an evolving marketplace and with the rapid growth of cross border commerce, our ex-pertise presently focuses on the rapidly growing markets of Australia, South East Asia and China.
www.ypbsystems.com

Appendix 4C Quarterly report for entities subject to Listing Rule 4.7B
+ See chapter 19 for defined terms 1 September 2016 Page 1
+Rule 4.7B
Appendix 4C
Quarterly report for entities subject to Listing Rule 4.7B Introduced 31/03/00 Amended 30/09/01, 24/10/05, 17/12/10, 01/09/16
Name of entity
YPB Group Limited ABN Quarter ended (“current quarter”)
68 108 649 421 September 2018
Consolidated statement of cash flows Current quarter $A’000
Year to date
(9 months) $A’000
1. Cash flows from operating activities
1.1 Receipts from customers 495 1,509
1.2 Payments for - (147)
(a) research and development
(b) product manufacturing and operating costs
(124) (550)
(c) advertising and marketing (31) (54)
(d) leased assets (98) (266)
(e) staff costs (1,033) (3,578)
(f) administration and corporate costs (395) (1,578)
1.3 Dividends received (see note 3) - -
1.4 Interest received 1 13
1.5 Interest and other costs of finance paid 0 (33)
1.6 Income taxes paid (8) (8)
1.7 Government grants and tax incentives - 341
1.8 Other (provide details if material) 62 176
1.9 Net cash from / (used in) operating activities
(1,131) (4,175)
2. Cash flows from investing activities
2.1 Payments to acquire:
(a) property, plant and equipment (23)
(b) businesses (see item 10) (1,444)
(c) investments
Appendix 4C Quarterly report for entities subject to Listing Rule 4.7B
+ See chapter 19 for defined terms 1 September 2016 Page 2
Consolidated statement of cash flows Current quarter $A’000
Year to date
(9 months) $A’000
(d) intellectual property
(e) other non-current assets
2.2 Proceeds from disposal of:
(a) property, plant and equipment
(b) businesses (see item 10)
(c) investments
(d) intellectual property
(e) other non-current assets
2.3 Cash flows from loans to other entities
2.4 Dividends received (see note 3)
2.5 Other (provide details if material)
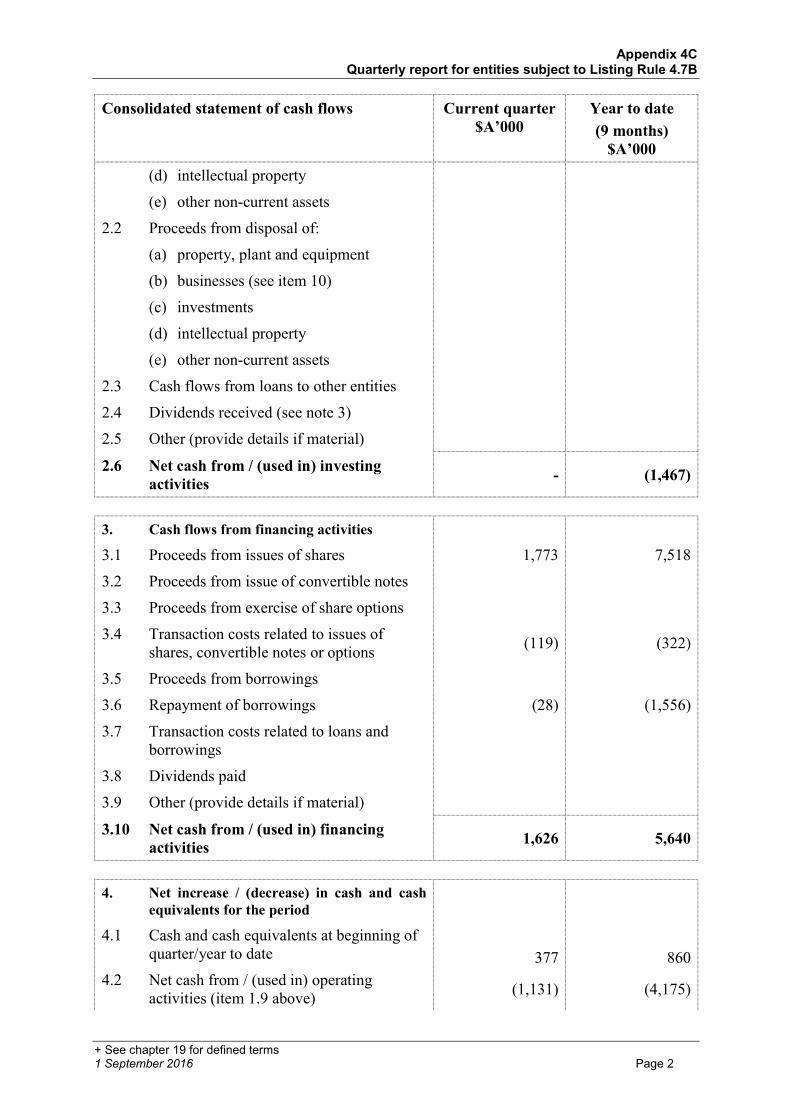
2.6 Net cash from / (used in) investing activities
- (1,467)
3. Cash flows from financing activities
3.1 Proceeds from issues of shares 1,773 7,518
3.2 Proceeds from issue of convertible notes
3.3 Proceeds from exercise of share options
3.4 Transaction costs related to issues of shares, convertible notes or options
(119) (322)
3.5 Proceeds from borrowings
3.6 Repayment of borrowings (28) (1,556)
3.7 Transaction costs related to loans and borrowings
3.8 Dividends paid
3.9 Other (provide details if material)
3.10 Net cash from / (used in) financing activities
1,626 5,640
4. Net increase / (decrease) in cash and cash
equivalents for the period
377 860
4.1 Cash and cash equivalents at beginning of quarter/year to date
4.2 Net cash from / (used in) operating activities (item 1.9 above)
(1,131) (4,175)

Appendix 4C Quarterly report for entities subject to Listing Rule 4.7B
+ See chapter 19 for defined terms 1 September 2016 Page 3
Consolidated statement of cash flows Current quarter $A’000
Year to date
(9 months) $A’000
4.3 Net cash from / (used in) investing activities (item 2.6 above)
- (1,467)
4.4 Net cash from / (used in) financing activities (item 3.10 above) 1,626 5,640
4.5 Effect of movement in exchange rates on cash held
(6) 8
4.6 Cash and cash equivalents at end of quarter
866 866
5. Reconciliation of cash and cash
equivalents at the end of the quarter (as shown in the consolidated statement of cash flows) to the related items in the accounts
Current quarter $A’000
Previous quarter $A’000
5.1 Bank balances 866 377
5.2 Call deposits
5.3 Bank overdrafts
5.4 Other (provide details)
5.5 Cash and cash equivalents at end of quarter (should equal item 4.6 above)
866 377
6. Payments to directors of the entity and their associates Current quarter
$A'000
6.1 Aggregate amount of payments to these parties included in item 1.2
130
6.2 Aggregate amount of cash flow from loans to these parties included in item 2.3
-
6.3 Include below any explanation necessary to understand the transactions included in items 6.1 and 6.2

Appendix 4C Quarterly report for entities subject to Listing Rule 4.7B
+ See chapter 19 for defined terms 1 September 2016 Page 4
7. Payments to related entities of the entity and their associates Current quarter $A'000
7.1 Aggregate amount of payments to these parties included in item 1.2
-
7.2 Aggregate amount of cash flow from loans to these parties included in item 2.3
-
7.3 Include below any explanation necessary to understand the transactions included in items 7.1 and 7.2
8. Financing facilities available
Add notes as necessary for an understanding of the position
Total facility amount at quarter
end $A’000
Amount drawn at quarter end
$A’000
8.1 Loan facilities - -
8.2 Credit standby arrangements - -
8.3 Other (please specify) - -
8.4 Include below a description of each facility above, including the lender, interest rate and whether it is secured or unsecured. If any additional facilities have been entered into or are proposed to be entered into after quarter end, include details of those facilities as well.
9. Estimated cash outflows for next quarter $A’000
9.1 Research and development (20)
9.2 Product manufacturing and operating costs (200)
9.3 Advertising and marketing (63)
9.4 Leased assets (93)
9.5 Staff costs (1,131)
9.6 Administration and corporate costs (372)
9.8 Other (provide details if material) -
9.9 Total estimated cash outflows (1,879)

Appendix 4C Quarterly report for entities subject to Listing Rule 4.7B
+ See chapter 19 for defined terms 1 September 2016 Page 5
10. Acquisitions and disposals of business entities (items 2.1(b) and 2.2(b) above)
Acquisitions Disposals
10.1 Name of entity
10.2 Place of incorporation or registration
10.3 Consideration for acquisition or disposal
10.4 Total net assets
10.5 Nature of business
Compliance statement
1 This statement has been prepared in accordance with accounting standards and policies which comply with Listing Rule 19.11A.
2 This statement gives a true and fair view of the matters disclosed. Sign here: ............................................................
Date: ............................................. (Director/Company secretary)
Print name: ......................................................... Notes 1. The quarterly report provides a basis for informing the market how the entity’s activities
have been financed for the past quarter and the effect on its cash position. An entity that wishes to disclose additional information is encouraged to do so, in a note or notes included in or attached to this report.
2. If this quarterly report has been prepared in accordance with Australian Accounting Standards, the definitions in, and provisions of, AASB 107: Statement of Cash Flows apply to this report. If this quarterly report has been prepared in accordance with other accounting standards agreed by ASX pursuant to Listing Rule 19.11A, the corresponding equivalent standard applies to this report.
3. Dividends received may be classified either as cash flows from operating activities or cash flows from investing activities, depending on the accounting policy of the entity.