asx release - westpac
TRANSCRIPT

ASX Release 15 April 2019
Westpac Group 2019 Interim Financial Results Template
The Westpac Group has today released the template for its 2019 Interim Financial Results. The Excel template outlines the changes that are expected to be made in the presentation of Westpac’s Interim Financial Results and details how key information will be presented (including providing updated comparative data).1 The template is available on the Westpac website at www.westpac.com.au/investorcentre.
The changes can be summarised as:
1. Changes associated with the adoption of new accounting standards; 2. Changes to the income statement and balance sheet to improve how information is
presented; and 3. Changes across divisional earnings and divisional balance sheets (which have no impact
on the Group result).
The changes have no impact on the Group’s cash earnings, reported net profit or total assets/liabilities in prior periods but do impact profit and loss (P&L) line items and components of the balance sheet. To improve comparability, as the accounting standard changes apply prospectively from 1H19, Westpac is providing proforma cash earnings for FY18 comparatives. These proforma changes appear in the template.
Appendices 1 and 2 provide details of these changes as well as providing additional background on how the calculation of impairment charges and provisions have changed. Tables showing selected updated disclosures are provided in Appendix 3.
It is important to note that these changes do not reflect the recent update to the Group’s organisational structure announced on 19 March 2019. This was effective on 1 April 2019 and will be reflected in the Group’s Full Year 2019 results.
The Westpac Group is scheduled to announce its 2019 Interim Financial Results on Monday, 6 May 2019. An Excel spreadsheet of the Interim Financial Results will also be published on the Westpac website on that date. Ends. For Further Information David Lording Head of Media Relations M. 0419 683 411
Andrew Bowden Head of Investor Relations T. 02 8253 4008 M. 0438 284 863
1 Some of these changes are subject to review and may change in our 2019 Interim Financial Results
WESTPAC BANKING CORPORATION ABN 33 007 457 141
Appendix 1
For financial year 2019, Westpac adopted new accounting standards (AASB 9 and AASB 15). In addition, the Group has elected to make certain presentation changes to the balance sheet and income statement to improve consistency and relevance to users. A summary of key changes follows:
1. AASB 15 has provided more precise guidance around netting of income and expenses. Certain items previously netted will now be presented on a gross basis. This includes support payments from credit card scheme providers which were previously netted against related expenditures such as marketing, product development, and IT development. The gross amount received and the expenses incurred are now reflected in fee income and operating expenses respectively;
2. New accounting standards have defined ‘interest’ income more precisely. As a result, Business Bank line fees are now treated as net interest income;
3. Costs related to redeeming credit card loyalty points were previously in operating expenses but are now in fee income, alongside card related income linked to the loyalty program. Both these items are recognised as points are redeemed;
4. Westpac adopted AASB 9 from 1 October 2018. This means impairment charges have moved to an expected loss model. This impacts the calculation of impairment charges (P&L) and impairment provisions (balance sheet). These changes have not been applied to prior periods;
5. As previously advised, on transition to AASB 9 the treatment of the interest carrying adjustment has changed. This increases both the impairment charge and net interest income.2
6. Changes have been made to the classification and presentation of certain balance sheet items. Some balance sheet items had been classified by the nature of the counterparty (for example regulatory deposits with central banks and balances due to/from financial institutions). These items will now be classified based on the nature of the item. This has no impact on total loans, total assets, total deposits or total liabilities. These changes will be presented in Westpac’s 2019 Interim Financial Results announcement, and have not been included in the template;
7. We have realigned divisional earnings and balance sheet disclosures where the management of certain customers or customer groups belong to a different division:
• Certain commercial customers, previously managed in Business Bank have been migrated to Westpac Institutional Bank (WIB). The lending, deposits and revenues associated with these customers are now reported in WIB; and
• Following a review, some revenue recognised in Consumer Bank related to Business Bank and BT Financial Group customers. This revenue has now been allocated to the appropriate division;
8. The Group’s expense allocation methodology has been refined to improve the allocation of support costs to divisions. This will see a greater proportion of strategy, human resources, finance and risk management costs allocated to divisions from Group Businesses; and
9. Following a review, the allocation of total committed exposures has been refined. Treasury exposures (related to balance sheet management and liquidity) were previously reflected in WIB. These are now included in Group Businesses. In addition, the total committed exposures relating to certain small business customers have now been allocated to Consumer Bank from Business Bank. These changes also impact certain credit metrics in Consumer Bank, Business Bank and WIB.
2 This is because the interest carrying adjustment now only applies to Stage 3 loans (impaired and 90+ day past due and not impaired).

Explanatory slides on impact of changes in accounting standards for Westpac 15 April 2019
Westpac Banking Corporation | ABN 33 007 457 141
Financial results based on cash earnings unless otherwise stated. Refer to the 2018 Full Year Investor Discussion Pack for definition.
Appendix 2

Slides supporting Interim Financial Results template - April 2019
Summary
1 See slide 3 for further details.
No change to FY18 cash earnings of $8,065m • Changes have no impact on cash earnings or reported net profit for prior
periods • However certain line items within cash earnings have changed and
therefore some performance metrics are impacted Proforma FY18 cash earnings line item comparatives provided
• Prior period line items have been prepared on a proforma basis • Statutory accounting changes apply prospectively to reported net profit
from 1 October 2018 Major line item presentational changes
• AASB 15 has provided more precise guidance around netting. Certain income and expenses previously reported on a net basis are now presented on a gross basis
• All Business Bank line fees are now included in interest income (some were previously in fee income)
• Costs related to redeeming credit card loyalty points are now in fee income, alongside card related income linked to the loyalty program
• As advised in our FY18 results, the treatment of the interest carrying adjustment has changed, increasing both net interest income and impairment charges1
Adoption of AASB 9 at 1 October 2018 • On adoption, impairment charges moved to an expected loss model. As
previously advised, this impacted the calculation of impairment charges (P&L) and impairment provisions (balance sheet). These changes have not been applied to prior periods
2
In FY19, Westpac has implemented new accounting standards and revised certain disclosures. This has a number of implications on the way the Group’s financial statements will be presented and how impairment charges are determined. This pack, together with the results template, explain the changes that have been implemented in 1H19.
Fix format
Statutory net profit ($m) FY18 as reported
FY18 (updated
disclosure)
Reported net profit 8,095 8,095
Cash earnings ($m) FY18 as reported Changes FY18
Proforma
Net interest income 16,339 848 17,187
Non-interest income 5,612 (634) 4,978
Net operating income 21,951 214 22,165
Operating expenses (9,586) (112) (9,698)
Impairment charges (710) (102) (812)
Cash earnings 8,065 - 8,065
Net interest margin (%) 2.11% 11bps 2.22%
Impairment charges to average loans (bps) 10bps 2bps 12bps
Expense to income ratio (%) 43.67% 8bps 43.75%

1 All on a proforma basis except card loyalty redemptions which are restated in reported net profit. 2 Expenditure includes marketing, product development and IT system development costs. 3 This is because the interest carrying adjustment now only applies to Stage 3 loans (Impaired and 90+ day past due and not impaired).
FY18 Cash earnings ($m) Line fees
Card scheme support and card related
expenditure
Card loyalty redemption costs
Interest carrying adjustment Other Proforma
impact
Net interest 667 - - 115 66 848 Non-interest (667) 190 (126) - (31) (634) Expenses - (190) 126 - (48) (112) Impairments - - - (115) 13 (102) Total 0 0 0 0 0 0 How changes will be reflected in Westpac’s accounts ( = updated for changes, = no change)
Cash earnings – will be presented on a proforma basis to assist comparability1
FY18 proforma FY19 Reported net profit – Majority of changes apply prospectively from 1H19 so comparisons between FY19 and FY18 will be difficult FY18 FY19
• Accounting standards have defined ‘interest’ income more precisely. As a result Business Bank line fees are now treated as net interest income
• Certain items previously netted are now presented on a gross basis. This includes support payments from credit card scheme providers which were netted against related expenditure2. The gross amount received and expenses incurred are now reflected in fee income, and operating expenses respectively
• Costs related to redeeming credit card loyalty points were previously in operating expenses but are now in fee income, alongside card related income linked to the loyalty program. Both these items are recognised as points are redeemed
• As previously advised, on transition to AASB 9 the treatment of the interest carrying adjustment changes. This increases both impairment charges and net interest income3
• Variety of smaller, non-volume related charges now in operating expenses, as opposed to being netted against revenue
• Cost of debt recoveries were previously netted in impairment charges, now in expenses
Slides supporting Interim Financial Results template - April 2019
Presentational changes
3

0.14 0.39 0.55
98.92
Stage 2 category reflects loans that are graded as still performing in our internal risk grades but have experienced a significant
increase in credit risk since origination. Migration from Stage 1 to Stage 2 is driven primarily by changes in PD2 risk grade. In
retail portfolios, customer and account behaviours, including arrears, are key
drivers of risk grade movements
Slides supporting Interim Financial Results template - April 2019
AASB 9 : Changes to calculation of impairment charges
1 Diagram is not to scale for comparability purposes. 2 Probability of default.
4
Fully performing
Watchlist & substandard
Impaired
90+ day past due and not impaired
Stage 1
Stage 2
Stage 3
Collective provisions
Impaired asset provisions
Conceptual comparison of prior disclosure with new disclosure1
• Stage 1: Performing • Provision amount: 12 months expected loss
based on future economic conditions • Provision compared to AASB 139: Similar
methodology, dependent on AASB 139 emergence period.
• Stage 2: Performing but significant increase in
credit risk since origination • Provision amount: Lifetime expected loss
based on future economic conditions • Provision compared to AASB 139: Increase
in provision to reflect lifetime expected losses
• Stage 3: Non-performing and impaired assets • Provision amount: Lifetime expected credit
losses based on future economic conditions • Provision compared to AASB 139:
Generally consistent with AASB 139
Exposures as a % of TCE (not to scale)
30-Sep-18 1-Oct-18
Non-stressed but significant
increase in credit risk

Appendix 3
2019 Interim Financial Results Template
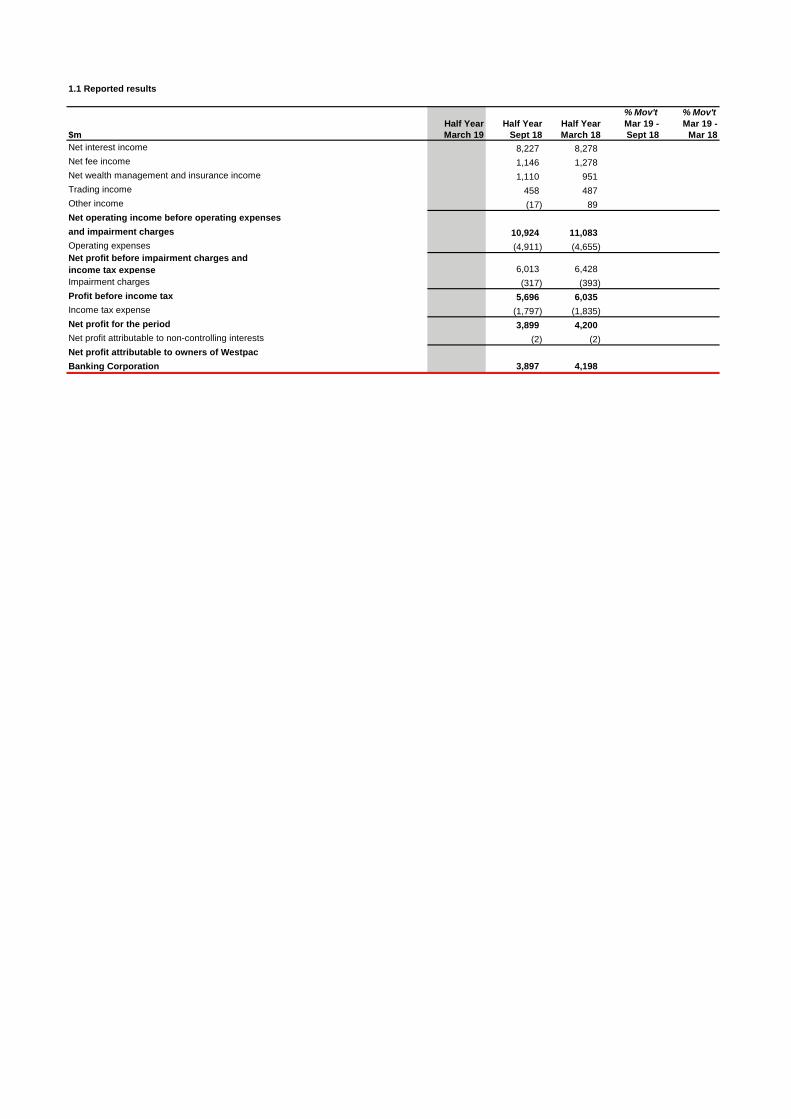
1.1 Reported results
% Mov't % Mov't Half Year Half Year Half Year Mar 19 - Mar 19 -$m March 19 Sept 18 March 18 Sept 18 Mar 18Net interest income 8,227 8,278Net fee income 1,146 1,278Net wealth management and insurance income 1,110 951Trading income 458 487Other income (17) 89Net operating income before operating expensesand impairment charges 10,924 11,083Operating expenses (4,911) (4,655)Net profit before impairment charges and income tax expense 6,013 6,428Impairment charges (317) (393)Profit before income tax 5,696 6,035Income tax expense (1,797) (1,835)Net profit for the period 3,899 4,200Net profit attributable to non-controlling interests (2) (2)Net profit attributable to owners of WestpacBanking Corporation 3,897 4,198
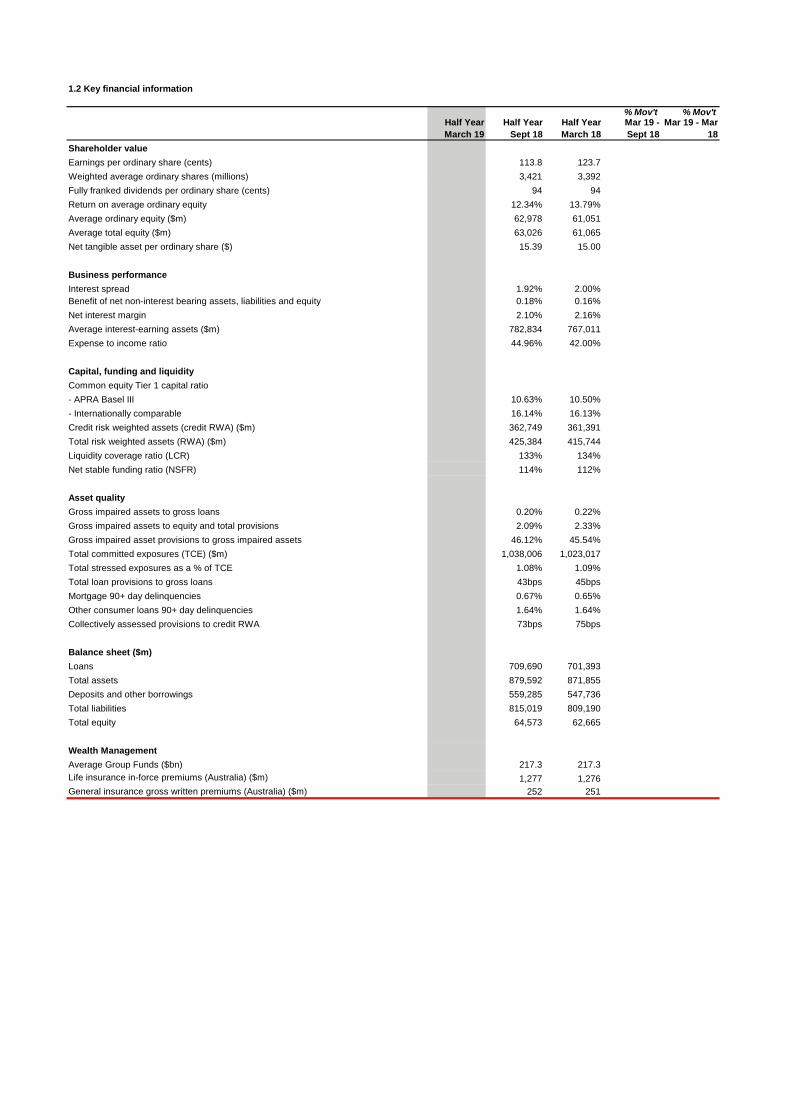
1.2 Key financial information
% Mov't % Mov'tHalf Year March 19
Half Year Sept 18
Half Year March 18
Mar 19 - Sept 18
Mar 19 - Mar 18
Shareholder valueEarnings per ordinary share (cents) 113.8 123.7Weighted average ordinary shares (millions) 3,421 3,392Fully franked dividends per ordinary share (cents) 94 94Return on average ordinary equity 12.34% 13.79%Average ordinary equity ($m) 62,978 61,051Average total equity ($m) 63,026 61,065Net tangible asset per ordinary share ($) 15.39 15.00
Business performanceInterest spread 1.92% 2.00%Benefit of net non-interest bearing assets, liabilities and equity 0.18% 0.16%Net interest margin 2.10% 2.16%Average interest-earning assets ($m) 782,834 767,011Expense to income ratio 44.96% 42.00%
Capital, funding and liquidityCommon equity Tier 1 capital ratio- APRA Basel III 10.63% 10.50%- Internationally comparable 16.14% 16.13%Credit risk weighted assets (credit RWA) ($m) 362,749 361,391Total risk weighted assets (RWA) ($m) 425,384 415,744Liquidity coverage ratio (LCR) 133% 134%Net stable funding ratio (NSFR) 114% 112%
Asset qualityGross impaired assets to gross loans 0.20% 0.22%Gross impaired assets to equity and total provisions 2.09% 2.33%Gross impaired asset provisions to gross impaired assets 46.12% 45.54%Total committed exposures (TCE) ($m) 1,038,006 1,023,017Total stressed exposures as a % of TCE 1.08% 1.09%Total loan provisions to gross loans 43bps 45bpsMortgage 90+ day delinquencies 0.67% 0.65%Other consumer loans 90+ day delinquencies 1.64% 1.64%Collectively assessed provisions to credit RWA 73bps 75bps
Balance sheet ($m)Loans 709,690 701,393Total assets 879,592 871,855Deposits and other borrowings 559,285 547,736Total liabilities 815,019 809,190Total equity 64,573 62,665
Wealth ManagementAverage Group Funds ($bn) 217.3 217.3Life insurance in-force premiums (Australia) ($m) 1,277 1,276General insurance gross written premiums (Australia) ($m) 252 251

1.3 Cash earnings results
% Mov't % Mov't
$mHalf Year March 19
Half Year Sept 18
Half Year March 18
Mar 19 - Sept 18
Mar 19 - Mar 18
Net interest income 8,470 8,717Non-interest income 2,456 2,522Net operating income 10,926 11,239Operating expenses (5,007) (4,691)Core earnings 5,919 6,548Impairment charges (368) (444)Operating profit before income tax 5,551 6,104Income tax expense (1,735) (1,851)Net profit 3,816 4,253Net profit attributable to non-controlling interests (2) (2)Cash earnings 3,814 4,251
1.3.1 Key financial information - cash earnings basis
% Mov't % Mov'tHalf Year March 19
Half Year Sept 18
Half Year March 18
Mar 19 - Sept 18
Mar 19 - Mar 18
Shareholder valueCash earnings per ordinary share (cents) 111.2 125.0Economic profit ($m) 1,395 2,049Weighted average ordinary shares (millions) 3,429 3,400Dividend payout ratio 84.66% 75.28%Cash earnings on average ordinary equity (ROE) 12.08% 13.96%Cash earnings on average tangible ordinary equity (ROTE) 14.27% 16.60%Average ordinary equity ($m) 62,978 61,051Average tangible ordinary equity ($m) 53,327 51,344
Business performanceInterest spread 1.98% 2.11%Benefit of net non-interest bearing assets, liabilities and equity 0.18% 0.17%Net interest margin 2.16% 2.28%Average interest-earning assets ($m) 782,834 767,011Expense to income ratio 45.83% 41.74%Full time equivalent employees (FTE) 35,029 35,720Revenue per FTE ($ '000's) 309 317Effective tax rate 31.26% 30.32%
Impairment chargesLoan impairment charges to average loans annualised 10bps 13bpsNet write-offs to average customer loans annualised 14bps 13bps
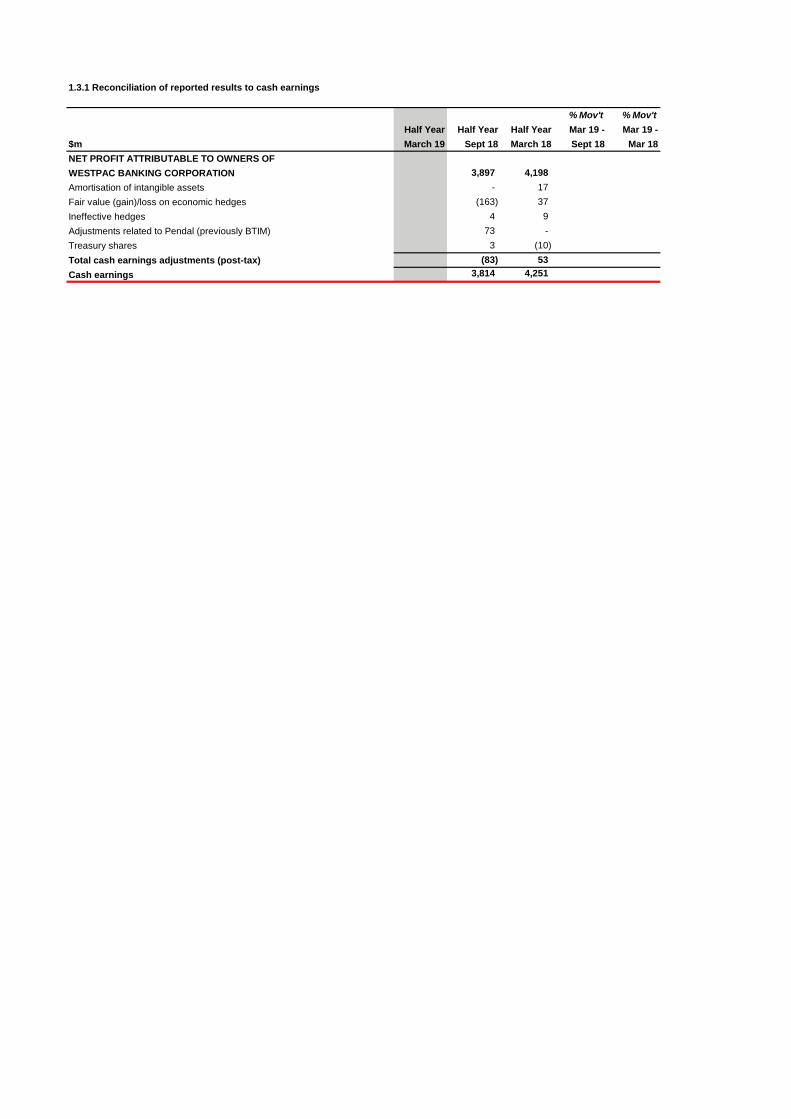
1.3.1 Reconciliation of reported results to cash earnings
% Mov't % Mov't Half Year Half Year Half Year Mar 19 - Mar 19 -$m March 19 Sept 18 March 18 Sept 18 Mar 18NET PROFIT ATTRIBUTABLE TO OWNERS OF WESTPAC BANKING CORPORATION 3,897 4,198Amortisation of intangible assets - 17Fair value (gain)/loss on economic hedges (163) 37Ineffective hedges 4 9Adjustments related to Pendal (previously BTIM) 73 -Treasury shares 3 (10)Total cash earnings adjustments (post-tax) (83) 53Cash earnings 3,814 4,251

2.1 Divisional cash earnings summary
Half Year March 19 BT Financial Westpac Westpac
Consumer Business Group Institutional New Zealand Group
$m Bank Bank (Australia) Bank (A$) Businesses Group
Net interest income
Non-interest income
Net operating income
Operating expenses
Core earnings
Impairment (charges) / benefits
Operating profit before income tax
Income tax expense
Net profit
Non-controlling interests
Cash earnings
Half Year Sept 18 BT Financial Westpac Westpac
Consumer Business Group Institutional New Zealand Group
$m Bank Bank (Australia) Bank (A$) Businesses Group
Net interest income 3,760 2,362 302 754 917 375 8,470
Non-interest income 392 315 735 812 181 21 2,456
Net operating income 4,152 2,677 1,037 1,566 1,098 396 10,926
Operating expenses (1,883) (967) (682) (771) (429) (275) (5,007)
Core earnings 2,269 1,710 355 795 669 121 5,919
Impairment (charges) / benefits (236) (164) (4) 9 13 14 (368)
Operating profit before income tax 2,033 1,546 351 804 682 135 5,551
Income tax expense (620) (466) (110) (264) (188) (87) (1,735)
Net profit 1,413 1,080 241 540 494 48 3,816
Non-controlling interests - - - (2) - - (2)
Cash earnings 1,413 1,080 241 538 494 48 3,814
Mov't Mar 19 - Sept 18 BT Financial Westpac Westpac
Consumer Business Group Institutional New Zealand Group
% Bank Bank (Australia) Bank (A$) Businesses Group
Net interest income
Non-interest income
Net operating income
Operating expenses
Core earnings
Impairment (charges) / benefits
Operating profit before income tax
Income tax expense
Net profit
Non-controlling interests
Cash earnings

2.1 Divisional cash earnings summary
Half Year March 19 BT Financial Westpac Westpac
Consumer Business Group Institutional New Zealand Group
$m Bank Bank (Australia) Bank (A$) Businesses Group
Net interest income
Non-interest income
Net operating income
Operating expenses
Core earnings
Impairment (charges) / benefits
Operating profit before income tax
Income tax expense
Net profit
Non-controlling interests
Cash earnings
Half Year March 18 BT Financial Westpac Westpac
Consumer Business Group Institutional New Zealand Group
$m Bank Bank (Australia) Bank (A$) Businesses Group
Net interest income 4,089 2,328 294 688 882 436 8,717
Non-interest income 370 311 881 753 192 15 2,522
Net operating income 4,459 2,639 1,175 1,441 1,074 451 11,239
Operating expenses (1,766) (948) (590) (678) (426) (283) (4,691)
Core earnings 2,693 1,691 585 763 648 168 6,548
Impairment (charges) / benefits (250) (148) (4) 6 (35) (13) (444)
Operating profit before income tax 2,443 1,543 581 769 613 155 6,104
Income tax expense (734) (463) (175) (212) (173) (94) (1,851)
Net profit 1,709 1,080 406 557 440 61 4,253
Non-controlling interests - - - (3) - 1 (2)
Cash earnings 1,709 1,080 406 554 440 62 4,251
Mov't Mar 19 - Mar 18 BT Financial Westpac Westpac
Consumer Business Group Institutional New Zealand Group
% Bank Bank (Australia) Bank (A$) Businesses Group
Net interest income
Non-interest income
Net operating income
Operating expenses
Core earnings
Impairment (charges) / benefits
Operating profit before income tax
Income tax expense
Net profit
Non-controlling interests
Cash earnings

2.2.1 Net interest income
% Mov't % Mov't
$mHalf Year March 19
Half Year Sept 18
Half Year March 18
Mar 19 - Sept 18
Mar 19 - Mar 18
Net interest incomeNet interest income excluding Treasury & Markets 8,082 8,258Treasury net interest income 322 396Market net interest income 66 63Net interest income 8,470 8,717Average interest-earning assetsLoans 665,227 651,943Third party liquid assets 97,909 93,357Other interest-earning assets 19,698 21,711Average interest-earning assets 782,834 767,011Net interest marginGroup net interest margin 2.16% 2.28%Group net interest margin excluding Treasury & Markets 2.06% 2.16%
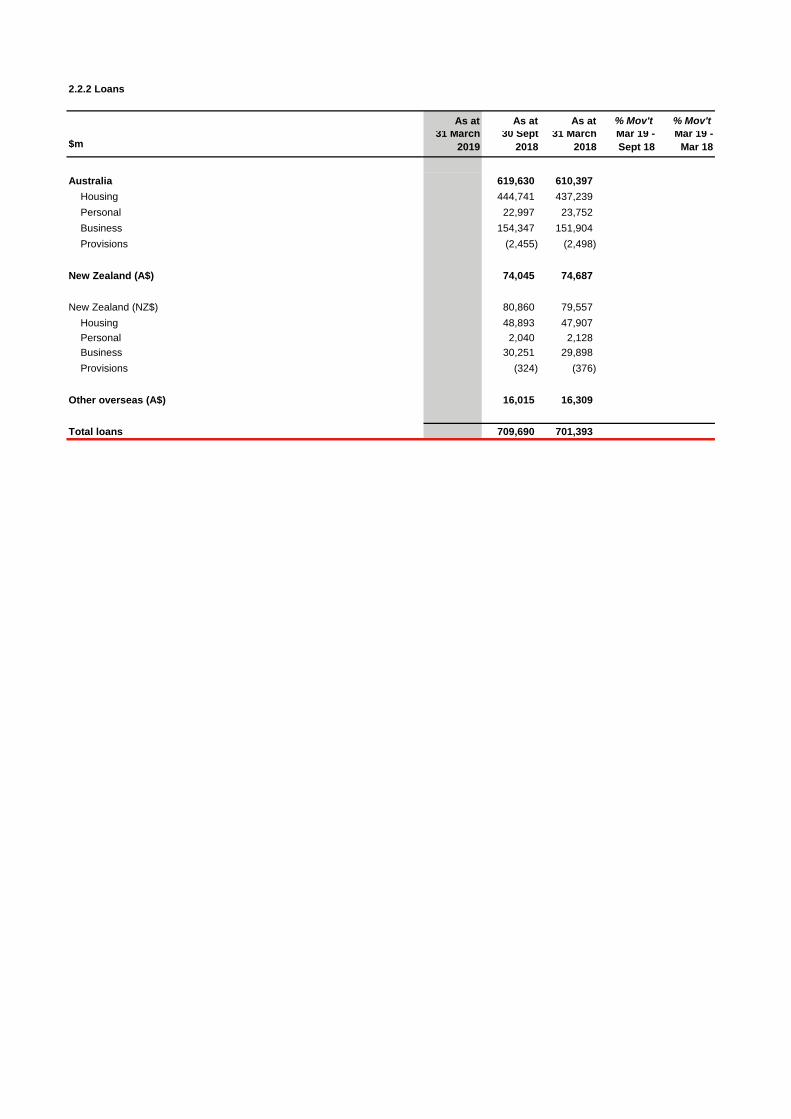
2.2.2 Loans
As at As at As at % Mov't % Mov't
$m31 March
201930 Sept
201831 March
2018Mar 19 - Sept 18
Mar 19 - Mar 18
Australia 619,630 610,397Housing 444,741 437,239Personal 22,997 23,752Business 154,347 151,904Provisions (2,455) (2,498)
New Zealand (A$) 74,045 74,687 New Zealand (NZ$) 80,860 79,557
Housing 48,893 47,907Personal 2,040 2,128Business 30,251 29,898Provisions (324) (376)
Other overseas (A$) 16,015 16,309
Total loans 709,690 701,393

2.2.3 Deposits and other borrowings
As at As at As at % Mov't % Mov't
$m31 March
201930 Sept
201831 March
2018Mar 19 - Sept 18
Mar 19 - Mar 18
Customer depositsAustralia 446,667 429,852
At call 233,052 227,021Term 171,832 161,864Non-interest bearing 41,783 40,967
New Zealand (A$) 56,671 57,856
New Zealand (NZ$) 61,887 61,628At call 23,339 24,164Term 32,645 31,595Non-interest bearing 5,903 5,869
Other overseas (A$) 14,413 14,355
Total customer deposits 517,751 502,063
Certificates of deposit 41,534 45,673Australia 28,746 30,387New Zealand (A$) 1,116 521Other overseas (A$) 11,672 14,765
Total deposits and other borrowings 559,285 547,736

2.2.5 Non-Interest Income
% Mov't % Mov't
$mHalf Year March 19
Half Year Sept 18
Half Year March 18
Mar 19 - Sept 18
Mar 19 - Mar 18
Net fee income 893 1,017Net wealth management and insurance income 1,088 929Trading income 419 507Other income 56 69Non-interest income 2,456 2,522
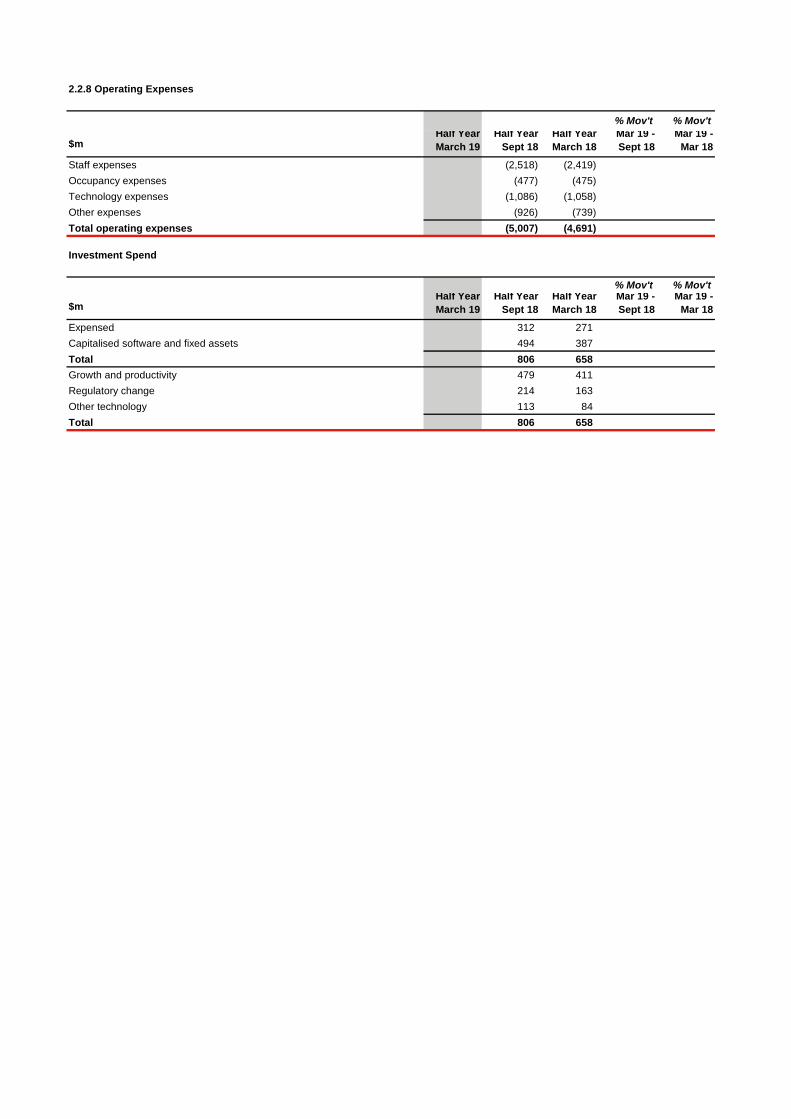
2.2.8 Operating Expenses
% Mov't % Mov't
$mHalf Year March 19
Half Year Sept 18
Half Year March 18
Mar 19 - Sept 18
Mar 19 - Mar 18
Staff expenses (2,518) (2,419)Occupancy expenses (477) (475)Technology expenses (1,086) (1,058)Other expenses (926) (739)Total operating expenses (5,007) (4,691)
Investment Spend
% Mov't % Mov't
$mHalf Year March 19
Half Year Sept 18
Half Year March 18
Mar 19 - Sept 18
Mar 19 - Mar 18
Expensed 312 271Capitalised software and fixed assets 494 387Total 806 658Growth and productivity 479 411Regulatory change 214 163Other technology 113 84Total 806 658

2.2.9 Impairment charges
% Mov't % Mov't
$mHalf Year March 19
Half Year Sept 18
Half Year March 18
Mar 19 - Sept 18
Mar 19 - Mar 18
Individually assessed provisions (IAPs)New IAPs (198) (173)Write-backs 83 67Recoveries 85 107Total IAPS, writebacks and recoveries (30) 1Collectively assessed provisions (CAPs)Write-offs (428) (430)Other changes in CAPs 90 (15)Total new CAPs (338) (445)Impairment charges (368) (444)

2.3.1 Credit Quality key metrics
As at As at As at31 March 30 Sept 31 March
2019 2018 2018Stressed exposures by credit grade as a % of TCE:Impaired 0.14% 0.15%90 days past due and not impaired 0.39% 0.37%Watchlist and substandard 0.55% 0.57%Total stressed exposures 1.08% 1.09%
Gross impaired assets to TCE for business and institutional:
Business Australia 0.54% 0.55%Business New Zealand 0.50% 0.74%Institutional 0.02% 0.04% Mortgage 90+ day delinquencies:Group 0.67% 0.65%Australia 0.72% 0.69%New Zealand 0.11% 0.16% Other consumer loans 90+ day delinquencies:Group 1.64% 1.64%Australia 1.73% 1.71%New Zealand 0.62% 0.86% Other:Gross impaired assets to gross loans 0.20% 0.22%Gross impaired asset provisions to gross impaired assets 46.12% 45.54%Total loan provisions to gross loans 43bps 45bpsCollective assessed provisions to credit risk weighted assets 73bps 75bpsTotal provisions to credit risk weighted assets 84bps 88bpsLoan impairment charges to average loans annualised 10bps 13bpsNet write-offs to average loans annualised 14bps 13bps

2.4.1 Balance sheet
As at As at As at % Mov't % Mov't
$m31 March
201930 Sept
201831 March
2018Mar 19 - Sept 18
Mar 19 - Mar 18
AssetsCash and balances with central banks 26,788 21,932Collateral paid 4,787 3,835Trading securities and financial assets measured at fair value,available-for-sale securities and investment securities 84,251 86,450Derivative financial instruments 24,101 26,904Loans 709,690 701,393Life insurance assets 9,450 10,481Other assets 20,525 20,860Total assets 879,592 871,855LiabilitiesCollateral received 2,184 3,331Deposits and other borrowings 559,285 547,736Other financial liabilities 28,105 29,750Derivative financial instruments 24,407 24,066Debt issues 172,596 174,138Life insurance liabilities 7,597 8,763Loan capital 17,265 18,333Other liabilities 3,580 3,073Total liabilities 815,019 809,190EquityTotal equity attributable to owners of Westpac Banking Corporation 64,521 62,615Non-controlling interests 52 50Total equity 64,573 62,665

3.1 Consumer Bank
% Mov't % Mov't
$mHalf Year March 19
Half Year Sept 18
Half Year March 18
Mar 19 - Sept 18
Mar 19 - Mar 18
Net interest income 3,760 4,089Non-interest income 392 370Net operating income 4,152 4,459Operating expenses (1,883) (1,766)Core earnings 2,269 2,693Impairment charges (236) (250)Operating profit before tax 2,033 2,443Tax and non-controlling interests (620) (734)Cash earnings 1,413 1,709
Economic profit 822 1,255Expense to income ratio 45.35% 39.61%Net interest margin 2.14% 2.40%
As at As at As at % Mov't % Mov't
$bn31 March
201930 Sept
201831 March
2018Mar 19 - Sept 18
Mar 19 - Mar 18
DepositsTerm deposits 63.9 58.1 Other 142.3 141.3
Total deposits 206.2 199.4 Net loans
Mortgages 373.0 366.0 Other 13.3 13.6 Provisions (0.9) (0.9)
Total net loans 385.4 378.7 Deposit to loan ratio 53.50% 52.65%Total assets 392.5 386.0 TCE 452.7 445.7 Average interest-earning assets 350.3 342.2
As at As at As at31 March
201930 Sept
201831 March
2018Credit quality
Loan impairment charges to average loans annualised 0.12% 0.13%Mortgage 90+ day delinquencies 0.74% 0.72%Other consumer loans 90+ day delinquencies 1.50% 1.61%Total stressed assets to TCE 0.65% 0.64%
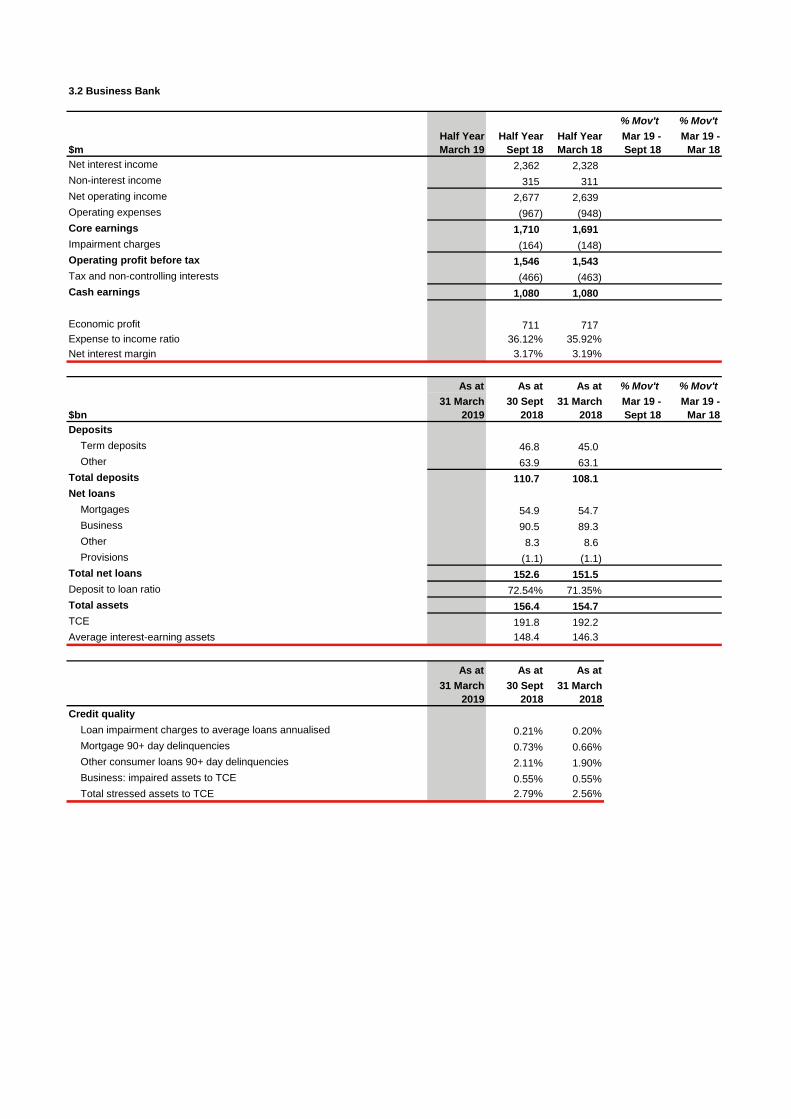
3.2 Business Bank
% Mov't % Mov't
$mHalf Year March 19
Half Year Sept 18
Half Year March 18
Mar 19 - Sept 18
Mar 19 - Mar 18
Net interest income 2,362 2,328Non-interest income 315 311Net operating income 2,677 2,639Operating expenses (967) (948)Core earnings 1,710 1,691Impairment charges (164) (148)Operating profit before tax 1,546 1,543Tax and non-controlling interests (466) (463)Cash earnings 1,080 1,080
Economic profit 711 717Expense to income ratio 36.12% 35.92%Net interest margin 3.17% 3.19%
As at As at As at % Mov't % Mov't
$bn31 March
201930 Sept
201831 March
2018Mar 19 - Sept 18
Mar 19 - Mar 18
DepositsTerm deposits 46.8 45.0 Other 63.9 63.1
Total deposits 110.7 108.1 Net loans
Mortgages 54.9 54.7 Business 90.5 89.3 Other 8.3 8.6 Provisions (1.1) (1.1)
Total net loans 152.6 151.5 Deposit to loan ratio 72.54% 71.35%Total assets 156.4 154.7 TCE 191.8 192.2 Average interest-earning assets 148.4 146.3
As at As at As at31 March
201930 Sept
201831 March
2018Credit quality
Loan impairment charges to average loans annualised 0.21% 0.20%Mortgage 90+ day delinquencies 0.73% 0.66%Other consumer loans 90+ day delinquencies 2.11% 1.90%Business: impaired assets to TCE 0.55% 0.55%Total stressed assets to TCE 2.79% 2.56%
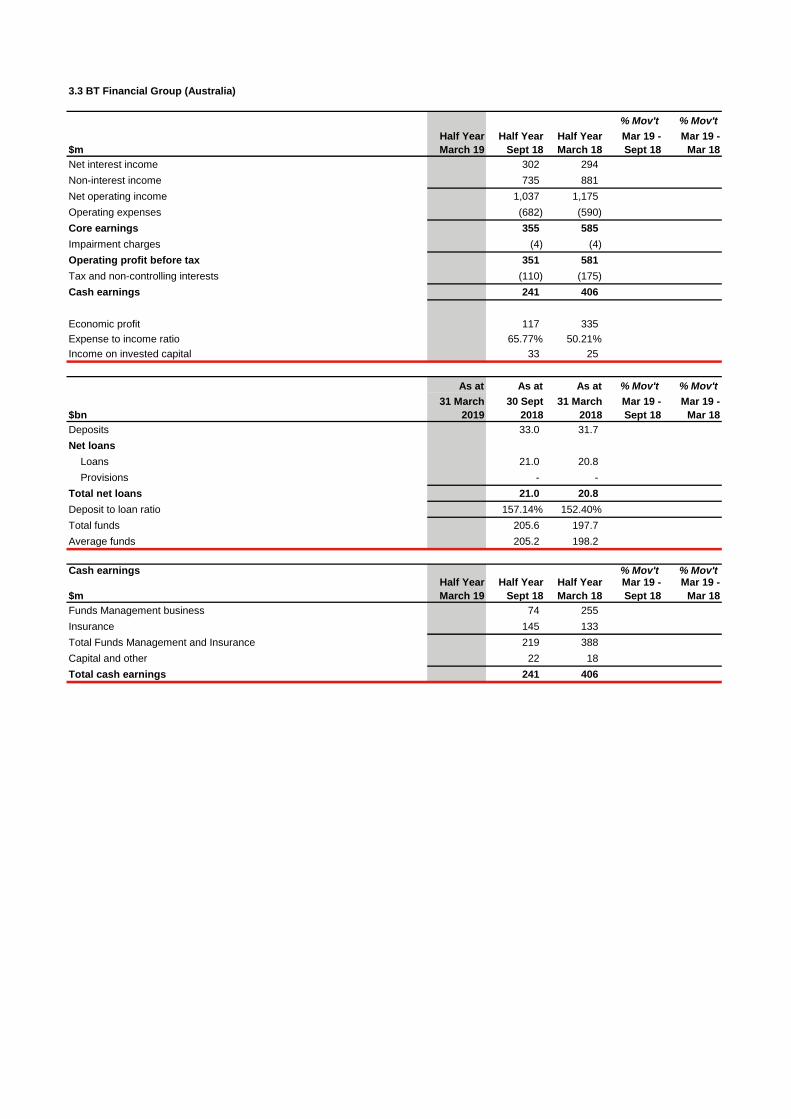
3.3 BT Financial Group (Australia)
% Mov't % Mov't
$mHalf Year March 19
Half Year Sept 18
Half Year March 18
Mar 19 - Sept 18
Mar 19 - Mar 18
Net interest income 302 294Non-interest income 735 881Net operating income 1,037 1,175Operating expenses (682) (590)Core earnings 355 585Impairment charges (4) (4)Operating profit before tax 351 581Tax and non-controlling interests (110) (175)Cash earnings 241 406
Economic profit 117 335Expense to income ratio 65.77% 50.21%Income on invested capital 33 25
As at As at As at % Mov't % Mov't
$bn31 March
201930 Sept
201831 March
2018Mar 19 - Sept 18
Mar 19 - Mar 18
Deposits 33.0 31.7 Net loans
Loans 21.0 20.8 Provisions - -
Total net loans 21.0 20.8Deposit to loan ratio 157.14% 152.40%Total funds 205.6 197.7 Average funds 205.2 198.2
Cash earnings % Mov't % Mov't
$mHalf Year March 19
Half Year Sept 18
Half Year March 18
Mar 19 - Sept 18
Mar 19 - Mar 18
Funds Management business 74 255Insurance 145 133Total Funds Management and Insurance 219 388Capital and other 22 18 Total cash earnings 241 406

3.3.1 Funds Management business
% Mov't % Mov't
$mHalf Year March 19
Half Year Sept 18
Half Year March 18
Mar 19 - Sept 18
Mar 19 - Mar 18
Net interest income 300 290Non-interest income 434 614Net operating income 734 904Operating expenses (619) (533)Core earnings 115 371Impairment charges (4) (5)Operating profit before tax 111 366Tax and non-controlling interests (37) (111)Cash earnings 74 255Expense to income ratio 84.33% 58.96%
Movement of Group Funds
As at As at As at % Mov't % Mov't31 March
2019Net
FlowsOtherMov't
30 Sept 2018
31 March 2018
Mar 19 - Sept 18
Mar 19 - Mar 18
Superannuation 39.3 37.4Platforms 122.9 118.6Packaged Funds 39.6 38.0Other 3.8 3.7Total Funds 205.6 197.7
3.3.2 Insurance business
% Mov't % Mov't
$mHalf Year March 19
Half Year Sept 18
Half Year March 18
Mar 19 - Sept 18
Mar 19 - Mar 18
Net interest income 2 3Non-interest income 269 243Net operating income 271 246Operating expenses (60) (55)Core earnings 211 191Impairment (charges) / benefits - -Operating profit before tax 211 191Tax and non-controlling interests (66) (58)Cash earnings 145 133Expense to income ratio 22.14% 22.36%
Cash earnings % Mov't % Mov't
$mHalf Year March 19
Half Year Sept 18
Half Year March 18
Mar 19 - Sept 18
Mar 19 - Mar 18
Life Insurance 71 75General Insurance 62 43Lenders Mortgage Insurance 12 15Total cash earnings 145 133
Insurance key metrics
Life Insurance in-force premiums % Mov't % Mov't
$mHalf Year March 19
Half Year Sept 18
Half Year March 18
Mar 19 - Sept 18
Mar 19 - Mar 18
Life Insurance in-force premiums at start of period 1,276 1,068Sales / New Business 80 283Lapses (79) (75)Life Insurance in-force premiums at end of period 1,277 1,276
Claims ratios for Insurance Business % Mov't % Mov't
(%)Half Year March 19
Half Year Sept 18
Half Year March 18
Mar 19 - Sept 18
Mar 19 - Mar 18
Life Insurance 42 44General Insurance 37 54Lenders Mortgage Insurance 11 20
Gross written premiums % Mov't % Mov't
$mHalf Year March 19
Half Year Sept 18
Half Year March 18
Mar 19 - Sept 18
Mar 19 - Mar 18
General Insurance gross written premium 252 251Lenders Mortgage Insurance gross written premium 90 90
$bn Inflows Outflows
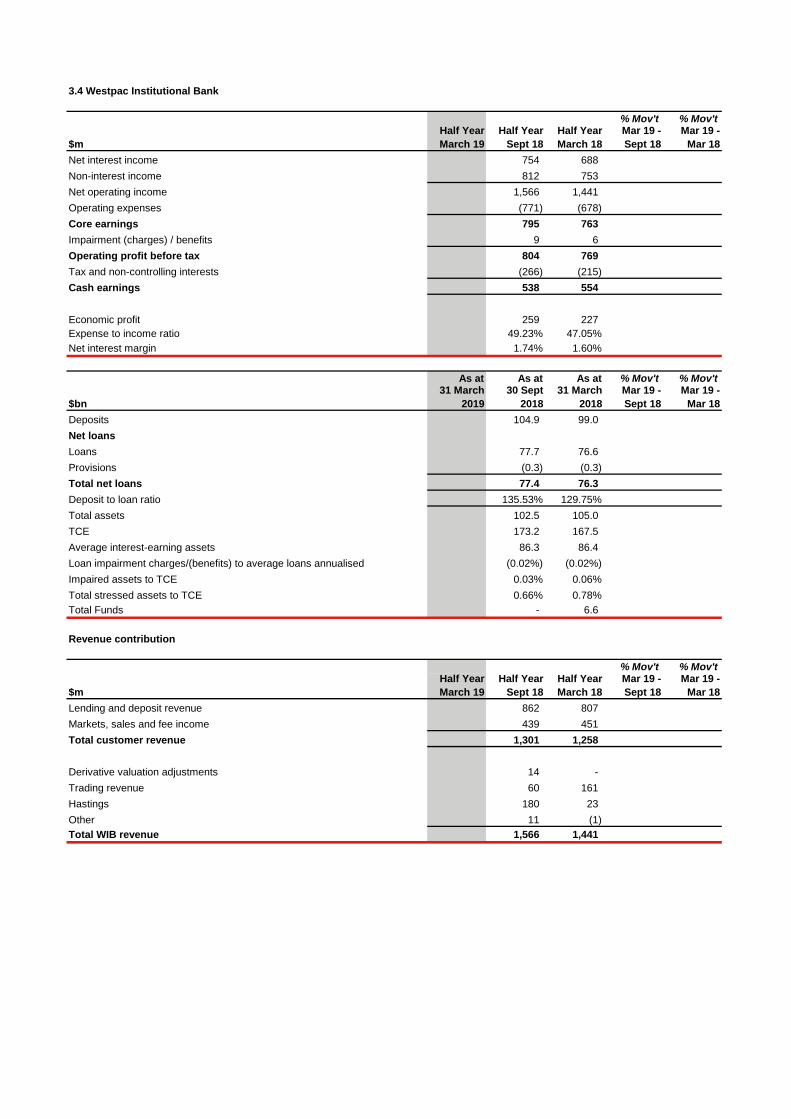
3.4 Westpac Institutional Bank
% Mov't % Mov't
$mHalf Year March 19
Half Year Sept 18
Half Year March 18
Mar 19 - Sept 18
Mar 19 - Mar 18
Net interest income 754 688Non-interest income 812 753Net operating income 1,566 1,441Operating expenses (771) (678)Core earnings 795 763Impairment (charges) / benefits 9 6Operating profit before tax 804 769Tax and non-controlling interests (266) (215)Cash earnings 538 554
Economic profit 259 227Expense to income ratio 49.23% 47.05%Net interest margin 1.74% 1.60%
As at As at As at % Mov't % Mov't
$bn31 March
201930 Sept
201831 March
2018Mar 19 - Sept 18
Mar 19 - Mar 18
Deposits 104.9 99.0 Net loansLoans 77.7 76.6 Provisions (0.3) (0.3) Total net loans 77.4 76.3 Deposit to loan ratio 135.53% 129.75%Total assets 102.5 105.0 TCE 173.2 167.5 Average interest-earning assets 86.3 86.4 Loan impairment charges/(benefits) to average loans annualised (0.02%) (0.02%)Impaired assets to TCE 0.03% 0.06%Total stressed assets to TCE 0.66% 0.78%Total Funds - 6.6
Revenue contribution
% Mov't % Mov't
$mHalf Year March 19
Half Year Sept 18
Half Year March 18
Mar 19 - Sept 18
Mar 19 - Mar 18
Lending and deposit revenue 862 807Markets, sales and fee income 439 451Total customer revenue 1,301 1,258
Derivative valuation adjustments 14 -Trading revenue 60 161Hastings 180 23Other 11 (1)Total WIB revenue 1,566 1,441

3.5 Westpac New Zealand
% Mov't % Mov't
NZ$mHalf Year March 19
Half Year Sept 18
Half Year March 18
Mar 19 - Sept 18
Mar 19 - Mar 18
Net interest income 994 964Non-interest income 196 210Net operating income 1,190 1,174Operating expenses (464) (466)Core earnings 726 708Impairment (charges) / benefits 13 (38)Operating profit before tax 739 670Tax and non-controlling interests (205) (188)Cash earnings 534 482
Economic profit 252 207Expense to income ratio 38.99% 39.69%Net interest margin 2.25% 2.24%
As at As at As at % Mov't % Mov't
NZ$bn31 March
201930 Sept
201831 March
2018Mar 19 - Sept 18
Mar 19 - Mar 18
Customer DepositsTerm deposits 32.6 31.6 Other 29.3 30.0
Total customer deposits 61.9 61.6 Net loans
Mortgages 48.9 47.9 Business 29.8 29.5 Other 2.0 2.1 Provisions (0.3) (0.4)
Total net loans 80.4 79.1 Deposit to loan ratio 76.99% 77.88%Total assets 90.0 89.8 TCE 112.0 111.7 Third party liquid assets 7.5 8.6 Average interest-earning assets 88.1 86.3 Total Funds 10.7 10.3
As at As at As at31 March
201930 Sept
201831 March
2018Credit quality
Loan impairment charges/(benefits) to average loans annualised (0.03%) 0.10%Mortgage 90+ day delinquencies 0.11% 0.16%Other consumer loans 90+ day delinquencies 0.62% 0.86%Impaired assets to TCE 0.15% 0.21%Total stressed assets to TCE 1.57% 1.86%
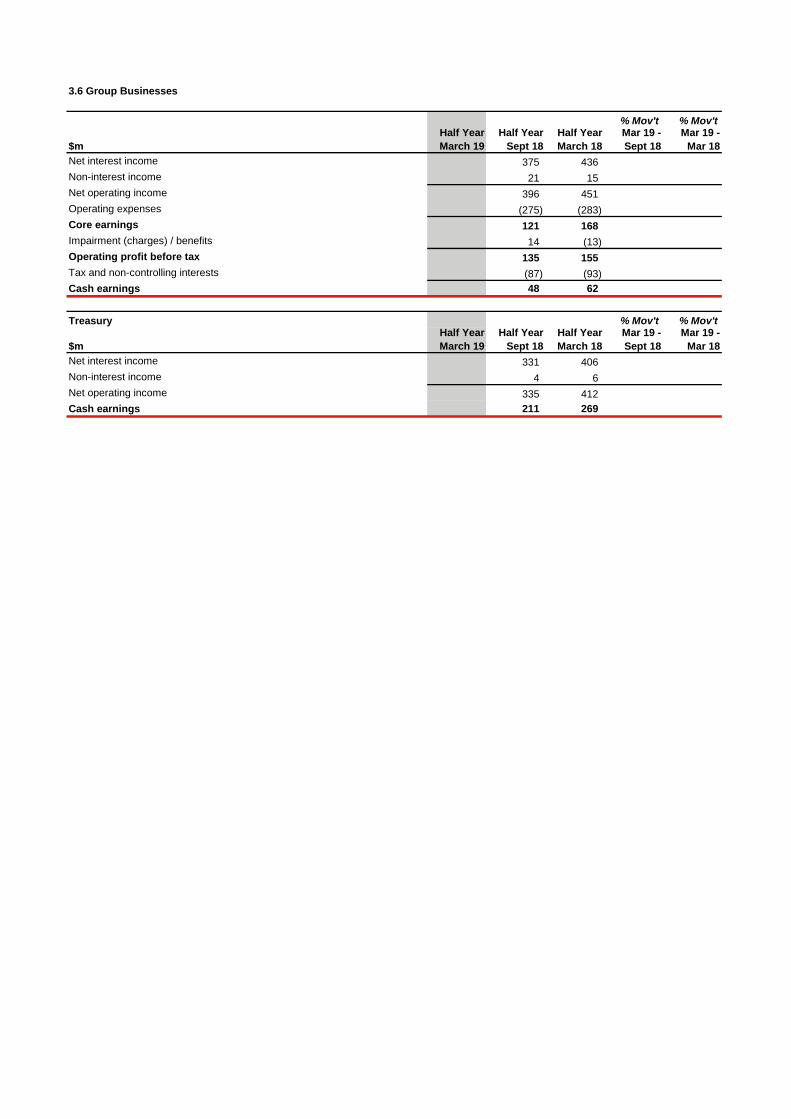
3.6 Group Businesses
% Mov't % Mov't
$mHalf Year March 19
Half Year Sept 18
Half Year March 18
Mar 19 - Sept 18
Mar 19 - Mar 18
Net interest income 375 436Non-interest income 21 15Net operating income 396 451Operating expenses (275) (283)Core earnings 121 168Impairment (charges) / benefits 14 (13)Operating profit before tax 135 155Tax and non-controlling interests (87) (93)Cash earnings 48 62
Treasury % Mov't % Mov't
$mHalf Year March 19
Half Year Sept 18
Half Year March 18
Mar 19 - Sept 18
Mar 19 - Mar 18
Net interest income 331 406Non-interest income 4 6Net operating income 335 412Cash earnings 211 269

Note 1. Interest spread and margin analysis (cash earnings basis)
Half Year March 19
Half Year Sept 18
Half Year March 18
GroupAverage interest-earning assets ($m) 782,834 767,011Net interest income ($m) 8,470 8,717Interest spread 1.98% 2.11%Benefit of net non-interest bearing assets, liabilities and equity 0.18% 0.17%Net interest margin 2.16% 2.28%
Analysis by division
Average interest-earning assets ($m)Consumer Bank 350,332 342,168Business Bank 148,434 146,252BT Financial Group 18,950 18,388Westpac Institutional Bank 86,250 86,380Westpac New Zealand (A$) 81,291 79,021Group Businesses 97,577 94,802Group total 782,834 767,011Westpac New Zealand (NZ$) 88,132 86,309
Net interest income ($m)Consumer Bank 3,760 4,089Business Bank 2,362 2,328BT Financial Group 302 294Westpac Institutional Bank 754 688Westpac New Zealand (A$) 917 882Group Businesses 375 436Group total 8,470 8,717Westpac New Zealand (NZ$) 994 964
Interest marginConsumer Bank 2.14% 2.40%Business Bank 3.17% 3.19%BT Financial Group 3.18% 3.21%Westpac Institutional Bank 1.74% 1.60%Westpac New Zealand (NZ$) 2.25% 2.24%Group Businesses 0.77% 0.92%Group total 2.16% 2.28%

Note 2. Average balance sheet and interest rates (cash earnings basis)
Average Interest Average Average Interest Average Average Interest Average balance rate balance rate balance rate $m $m % $m $m % $m $m %AssetsInterest earning assetsCollateral paid 8,242 74 1.8 7,927 55 1.4Trading securities and other financial assets measured at fair value 23,591 281 2.4 24,648 283 2.3Available-for-sale securities 62,054 984 3.2 61,023 930 3.1Investment securities - - - - - -Loans and other receivables 688,947 15,579 4.5 673,413 15,251 4.5Total interest earning assets and interest income 782,834 16,918 4.3 767,011 16,519 4.3Non-interest earning assetsDerivative financial instruments 35,271 34,130Life insurance assets 10,575 10,753All other assets 64,525 64,102Total non-interest earning assets 110,371 108,985Total assets 893,205 875,996
LiabilitiesInterest bearing liabilitiesCollateral received 3,035 27 1.8 2,782 18 1.3Deposits and other borrowings 505,047 4,653 1.8 494,871 4,368 1.8Loan capital 18,059 398 4.4 17,935 376 4.2Other interest bearing liabilities 196,064 3,370 3.4 193,188 3,040 3.2Total interest bearing liabilities and interest expense 722,205 8,448 2.3 708,776 7,802 2.2Non-interest bearing liabilitiesDeposits and other borrowings 48,053 47,108Derivative financial instruments 38,089 36,916Life insurance policy liabilities 8,736 9,013All other liabilities 13,096 13,118Total non-interest bearing liabilities 107,974 106,155Total liabilities 830,179 814,931Shareholders' equity 62,978 61,051Non-controlling interests 48 14Total equity 63,026 61,065Total liabilities and equity 893,205 875,996
Loans and other receivablesAustralia 583,743 13,339 4.6 573,588 13,149 4.6New Zealand 74,892 1,815 4.8 72,907 1,776 4.9Other overseas 30,312 425 2.8 26,918 326 2.4
Deposits and other borrowingsAustralia 424,214 3,728 1.8 419,786 3,580 1.7New Zealand 52,458 619 2.4 50,272 577 2.3Other overseas 28,375 306 2.2 24,813 211 1.7
Half Year Half Year Half Year31 March 2019 30 September 2018 31 March 2018

Note 3. Net interest income (cash earnings basis)
% Mov't % Mov't Half Year Half Year Half Year Mar 19 - Mar 19 -$m March 19 Sept 18 March 18 Sept 18 Mar 18Interest incomeCash and balances with central banks 185 141Collateral paid 74 55Net ineffectiveness on qualifying hedges - -Trading securities and financial assets measured at FVIS 281 283Available-for-sale securities 984 930Investment securities - -Loans 15,375 15,094Other interest income 19 16Total interest income 16,918 16,519
Interest expenseCollateral received (27) (18)Deposits and other borrowings (4,653) (4,368)Trading liabilities (579) (564)Debt issues (2,392) (2,088)Loan capital (398) (376)Bank levy (192) (186)Other interest expense (207) (202)Total interest expense (8,448) (7,802)Total net interest income 8,470 8,717
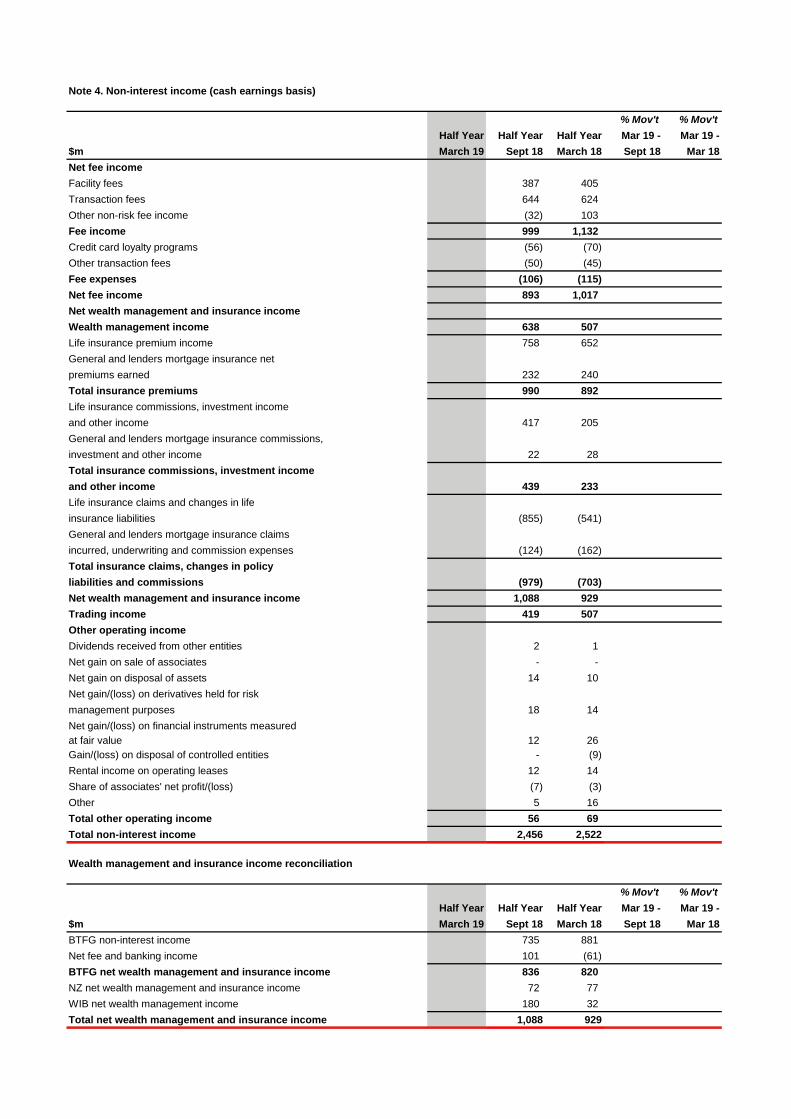
Note 4. Non-interest income (cash earnings basis)
% Mov't % Mov't Half Year Half Year Half Year Mar 19 - Mar 19 -$m March 19 Sept 18 March 18 Sept 18 Mar 18Net fee incomeFacility fees 387 405Transaction fees 644 624Other non-risk fee income (32) 103Fee income 999 1,132Credit card loyalty programs (56) (70)Other transaction fees (50) (45)Fee expenses (106) (115)Net fee income 893 1,017Net wealth management and insurance incomeWealth management income 638 507Life insurance premium income 758 652General and lenders mortgage insurance netpremiums earned 232 240Total insurance premiums 990 892Life insurance commissions, investment incomeand other income 417 205General and lenders mortgage insurance commissions,investment and other income 22 28Total insurance commissions, investment income and other income 439 233Life insurance claims and changes in lifeinsurance liabilities (855) (541)General and lenders mortgage insurance claims incurred, underwriting and commission expenses (124) (162)Total insurance claims, changes in policy liabilities and commissions (979) (703)Net wealth management and insurance income 1,088 929Trading income 419 507Other operating income Dividends received from other entities 2 1Net gain on sale of associates - -Net gain on disposal of assets 14 10Net gain/(loss) on derivatives held for riskmanagement purposes 18 14Net gain/(loss) on financial instruments measuredat fair value 12 26Gain/(loss) on disposal of controlled entities - (9)Rental income on operating leases 12 14Share of associates' net profit/(loss) (7) (3)Other 5 16Total other operating income 56 69Total non-interest income 2,456 2,522
Wealth management and insurance income reconciliation
% Mov't % Mov't Half Year Half Year Half Year Mar 19 - Mar 19 -$m March 19 Sept 18 March 18 Sept 18 Mar 18BTFG non-interest income 735 881Net fee and banking income 101 (61)BTFG net wealth management and insurance income 836 820NZ net wealth management and insurance income 72 77WIB net wealth management income 180 32Total net wealth management and insurance income 1,088 929

Note 5. Operating expenses (cash earnings basis)
% Mov't % Mov't
$mHalf Year March 19
Half Year Sept 18
Half Year March 18
Mar 19 - Sept 18
Mar 19 - Mar 18
Staff expensesEmployee remuneration, entitlements and on-costs 2,202 2,140Superannuation expense 189 197Share based payments 47 48Restructuring costs 80 34Total staff expenses 2,518 2,419 Occupancy expensesOperating lease rentals 313 319Depreciation of property and equipment 79 85Other 85 71Total occupancy expenses 477 475
Technology expensesAmortisation and impairment of software assets 317 303Depreciation and impairment of IT equipment 68 73Technology services 383 346Software and maintenance and licenses 169 193Telecommunications 110 105Data processing 39 38Total technology expenses 1,086 1,058
Other expensesProfessional and processing services 482 420Amortisation and impairment of intangible assets 95 18Postage and stationery 87 95Advertising 98 105Non-lending losses 93 40Other expenses 71 61Total other expenses 926 739Operating expenses 5,007 4,691

Note 8. Group earnings reconciliation
Six months to 31 March 2019 Fair value
Amortisation (gain)/loss Adjustment
Reported of intangible on economic Ineffective related to Treasury Presentation Cash
$m results assets hedges hedges Pendal shares changes earningsNet interest incomeNon-interest income
Net operating income
Operating expenses
Core earningsImpairment charges
Operating profit before taxIncome tax expense
Net profitNet profit attributable to
non-controlling interests
NET PROFIT ATTRIBUTABLE TO
OWNERS OF WBC
WBC Cash Earnings adjustments:
Amortisation of intangible assets
Fair value (gain)/loss on economic
hedges
Ineffective hedges
Adjustment related to Pendal
Treasury shares
Cash earnings Six months to 31 March 2019 Policyholder Merchants Other Interest
Operating tax and card fees and carrying Presentation
$m leases recoveries Line Fees schemes expenses adjustment changesNet interest income
Non-interest income
Net operating income
Operating expenses
Core earningsImpairment charges
Operating profit before taxIncome tax expense
Net profitNet profit attributable to
non-controlling interests
NET PROFIT ATTRIBUTABLE TO
OWNERS OF WBC
Six months to 30 September 2018 Fair value
Amortisation (gain)/loss Adjustment
Reported of intangible on economic Ineffective related to Treasury Presentation Cash
$m results assets hedges hedges Pendal shares changes earningsNet interest income 8,227 - (194) 5 - - 432 8,470
Non-interest income 2,697 - (38) - 104 2 (309) 2,456
Net operating income 10,924 - (232) 5 104 2 123 10,926
Operating expenses (4,911) - - - - - (96) (5,007)
Core earnings 6,013 - (232) 5 104 2 27 5,919Impairment charges (317) - - - - - (51) (368)
Operating profit before tax 5,696 - (232) 5 104 2 (24) 5,551Income tax expense (1,797) - 69 (1) (31) 1 24 (1,735)
Net profit 3,899 - (163) 4 73 3 - 3,816Net profit attributable to
non-controlling interests (2) - - - - - - (2)
NET PROFIT ATTRIBUTABLE TO
OWNERS OF WBC 3,897 - (163) 4 73 3 - 3,814
WBC Cash Earnings adjustments:
Amortisation of intangible assets - - - - - - - -
Fair value (gain)/loss on economic
hedges (163) - 163 - - - - -
Ineffective hedges 4 - - (4) - - - -
Adjustment related to Pendal 73 - - - (73) - - -
Treasury shares 3 - - - - (3) - -
Cash earnings 3,814 - - - - - - 3,814
Cash earnings adjustments
Cash Earnings adjustments
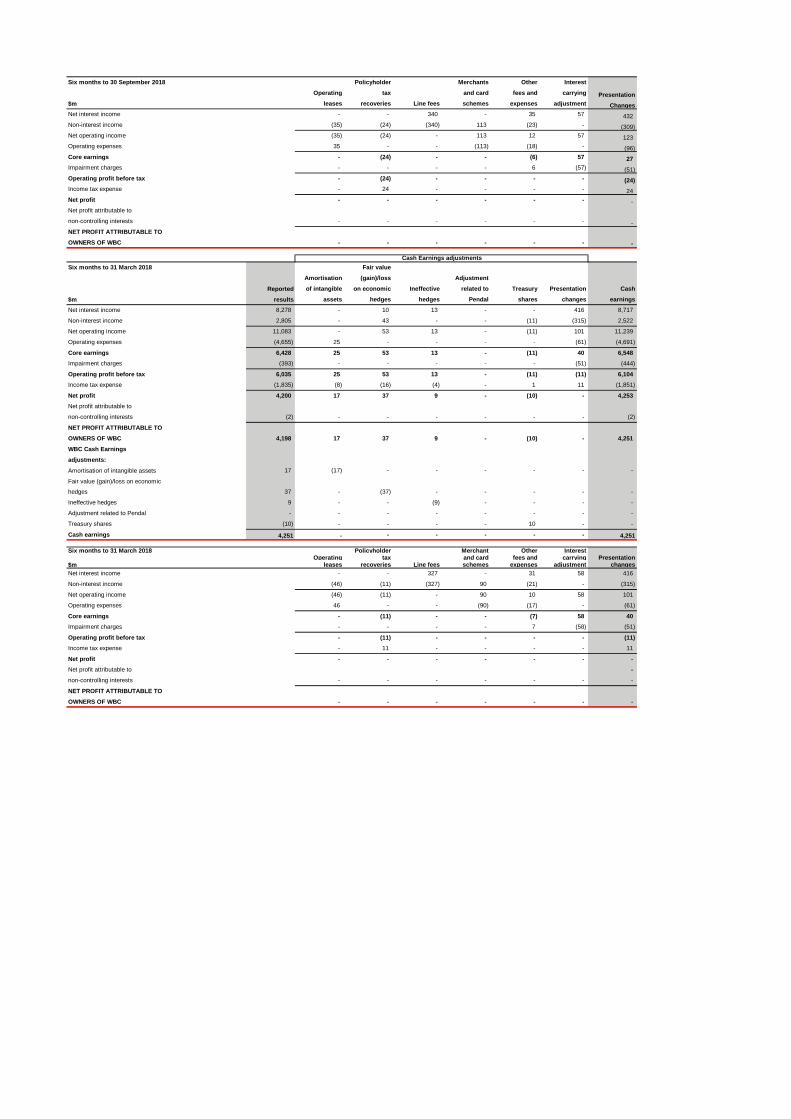
Six months to 30 September 2018 Policyholder Merchants Other Interest Operating tax and card fees and carrying Presentation$m leases recoveries Line fees schemes expenses adjustment ChangesNet interest income - - 340 - 35 57 432Non-interest income (35) (24) (340) 113 (23) - (309)Net operating income (35) (24) - 113 12 57 123Operating expenses 35 - - (113) (18) - (96)Core earnings - (24) - - (6) 57 27Impairment charges - - - - 6 (57) (51)Operating profit before tax - (24) - - - - (24)Income tax expense - 24 - - - - 24Net profit - - - - - - -Net profit attributable to
non-controlling interests - - - - - - -NET PROFIT ATTRIBUTABLE TO
OWNERS OF WBC - - - - - - -
Six months to 31 March 2018 Fair value
Amortisation (gain)/loss Adjustment
Reported of intangible on economic Ineffective related to Treasury Presentation Cash
$m results assets hedges hedges Pendal shares changes earningsNet interest income 8,278 - 10 13 - - 416 8,717
Non-interest income 2,805 - 43 - - (11) (315) 2,522
Net operating income 11,083 - 53 13 - (11) 101 11,239
Operating expenses (4,655) 25 - - - - (61) (4,691)
Core earnings 6,428 25 53 13 - (11) 40 6,548Impairment charges (393) - - - - - (51) (444)
Operating profit before tax 6,035 25 53 13 - (11) (11) 6,104Income tax expense (1,835) (8) (16) (4) - 1 11 (1,851)
Net profit 4,200 17 37 9 - (10) - 4,253Net profit attributable to
non-controlling interests (2) - - - - - - (2)
NET PROFIT ATTRIBUTABLE TO
OWNERS OF WBC 4,198 17 37 9 - (10) - 4,251
WBC Cash Earnings
adjustments:
Amortisation of intangible assets 17 (17) - - - - - -
Fair value (gain)/loss on economic
hedges 37 - (37) - - - - -
Ineffective hedges 9 - - (9) - - - -
Adjustment related to Pendal - - - - - - - -
Treasury shares (10) - - - - 10 - -
Cash earnings 4,251 - - - - - - 4,251
Six months to 31 March 2018 Policyholder Merchant Other Interest Operating tax and card fees and carrying Presentation$m leases recoveries Line fees schemes expenses adjustment changesNet interest income - - 327 - 31 58 416
Non-interest income (46) (11) (327) 90 (21) - (315)
Net operating income (46) (11) - 90 10 58 101
Operating expenses 46 - - (90) (17) - (61)
Core earnings - (11) - - (7) 58 40Impairment charges - - - - 7 (58) (51)
Operating profit before tax - (11) - - - - (11)Income tax expense - 11 - - - - 11
Net profit - - - - - - -Net profit attributable to -non-controlling interests - - - - - - -
NET PROFIT ATTRIBUTABLE TO
OWNERS OF WBC - - - - - - -
Cash Earnings adjustments

Note 9. Divisional result and economic profit
Six months to 31 March 2019 BT Financial Westpac Consumer Business Group Institutional Westpac New$m Group Bank Bank (Australia) Bank ZealandReported resultsCash earnings adjustmentsCash earningsFranking benefitAdjusted cash earningsAverage equityCapital chargeEconomic profitReturn on average equity
(including intangibles)
Six months to September 2018 BT Financial Westpac Consumer Business Group Institutional Westpac New$m Group Bank Bank (Australia) Bank ZealandReported results 3,897 1,413 1,080 168 538 497Cash earnings adjustments (83) - - 73 - (3)Cash earnings 3,814 1,413 1,080 241 538 494Franking benefit 1,054 434 326 77 156 -Adjusted cash earnings 4,868 1,847 1,406 318 694 494Average equity 62,978 18,595 12,607 3,641 7,895 4,708Capital charge (3,473) (1,025) (695) (201) (435) (260)Economic profit 1,395 822 711 117 259 234Return on average equity
(including intangibles) 12.1% 12.6% 14.0% 8.4% 12.7% 19.0%
Six months to 31 March 2018 BT Financial Westpac Consumer Business Group Institutional Westpac New$m Group Bank Bank (Australia) Bank ZealandReported results 4,198 1,694 1,078 406 554 450Cash earnings adjustments 53 15 2 - - (10)Cash earnings 4,251 1,709 1,080 406 554 440Franking benefit 1,147 513 324 123 123 -Adjusted cash earnings 5,398 2,222 1,404 529 677 440Average equity 61,051 17,626 12,527 3,545 8,196 4,614Capital charge (3,349) (967) (687) (194) (450) (253)Economic profit 2,049 1,255 717 335 227 187Return on average equity
(including intangibles) 14.0% 16.0% 14.1% 14.5% 12.6% 17.3%

6.7.2 Westpac New Zealand division performance (A$ Equivalent to Section 3.5)
% Mov't % Mov't
$mHalf Year March 19
Half Year Sept 18
Half Year March 18
Mar 19 - Sept 18
Mar 19 - Mar 18
Net interest income 917 882Non-interest income 181 192Net operating income 1,098 1,074Operating expenses (429) (426)Core earnings 669 648Impairment (charges) / benefits 13 (35)Operating profit before tax 682 613Tax and non-controlling interests (188) (173)Cash earnings 494 440
Economic profit 234 187Expense to income ratio 38.99% 39.69%Net interest margin 2.25% 2.24%
As at As at As at % Mov't % Mov't
$bn31 March
201930 Sept
201831 March
2018Mar 19 - Sept 18
Mar 19 - Mar 18
Customer deposits 56.7 57.9Net loans 73.6 74.3Deposit to loan ratio 76.99% 77.88%Total assets 82.4 84.3TCE 102.5 104.9Third party liquid assets 6.9 8.1Average interest-earning assets 81.3 79.0Total funds 9.8 9.7