asx appendix 4e - newcrest mining limited appendix 4e annual financial report 30 june 2014 newcrest...
TRANSCRIPT

ASX Appendix 4E Annual Financial Report 30 June 2014
NEWCREST MINING LIMITED AND CONTROLLED ENTITIES
ASX APPENDIX 4E AND ANNUAL FINANCIAL REPORT
FOR THE YEAR ENDED 30 JUNE 2014
TABLE OF CONTENTS
Newcrest Mining Limited – Annual Financial Report – Year Ended 30 June 2014
A. ASX Appendix 4E - Results for Announcement to the Market
B. Directors’ Report
C. Operating and Financial Review
D. Letter from Chairmen and Remuneration Report
E. Financial Statements
F. Independent Auditor’s Report
ASX APPENDIX 4E RESULTS FOR ANNOUNCEMENT TO THE MARKET
Newcrest Mining Limited – Annual Financial Report – Year Ended 30 June 2014 A 1
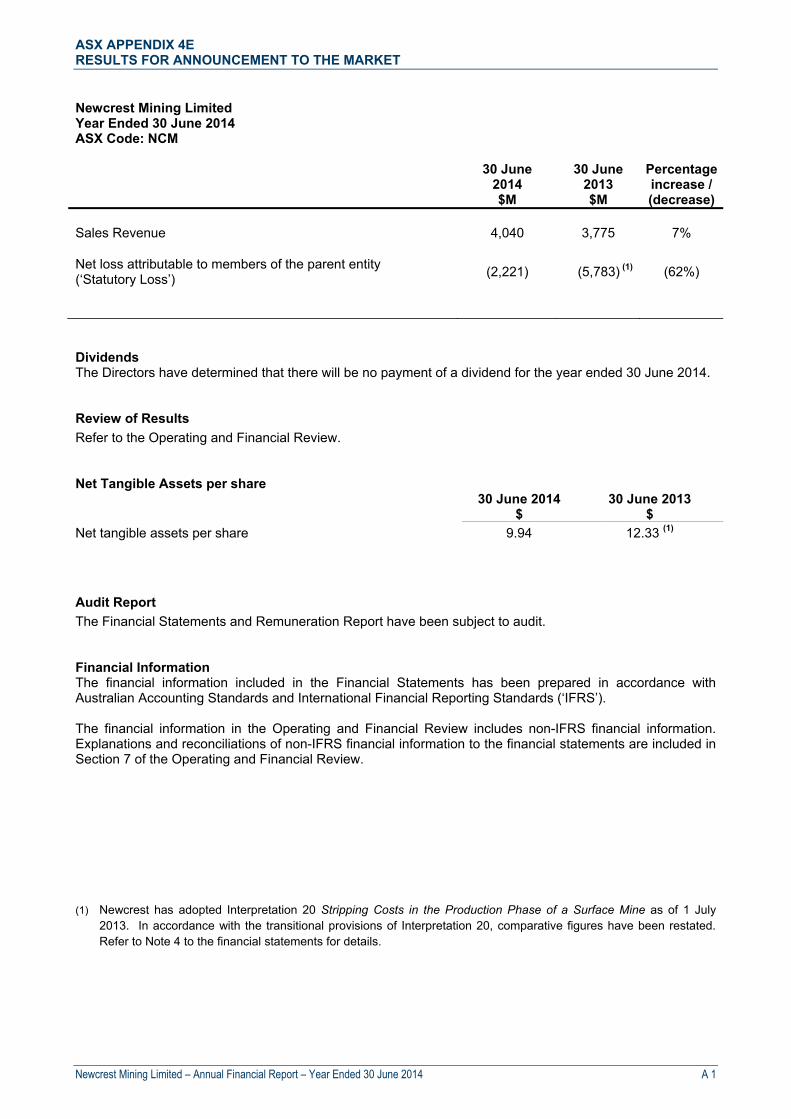
Newcrest Mining Limited Year Ended 30 June 2014 ASX Code: NCM
30 June 2014 $M
30 June 2013 $M
Percentage increase / (decrease)
Sales Revenue 4,040 3,775 7%
Net loss attributable to members of the parent entity (‘Statutory Loss’)
(2,221) (5,783) (1) (62%)
Dividends The Directors have determined that there will be no payment of a dividend for the year ended 30 June 2014. Review of Results
Refer to the Operating and Financial Review. Net Tangible Assets per share 30 June 2014 30 June 2013 $ $
Net tangible assets per share 9.94 12.33 (1)
Audit Report
The Financial Statements and Remuneration Report have been subject to audit. Financial Information The financial information included in the Financial Statements has been prepared in accordance with Australian Accounting Standards and International Financial Reporting Standards (‘IFRS’). The financial information in the Operating and Financial Review includes non-IFRS financial information. Explanations and reconciliations of non-IFRS financial information to the financial statements are included in Section 7 of the Operating and Financial Review. (1) Newcrest has adopted Interpretation 20 Stripping Costs in the Production Phase of a Surface Mine as of 1 July
2013. In accordance with the transitional provisions of Interpretation 20, comparative figures have been restated. Refer to Note 4 to the financial statements for details.

ASX APPENDIX 4E RESULTS FOR ANNOUNCEMENT TO THE MARKET
Newcrest Mining Limited – Annual Financial Report – Year Ended 30 June 2014 A 2
This page is intentionally blank.

DIRECTORS’ REPORT
Newcrest Mining Limited – Annual Financial Report – Year Ended 30 June 2014 B 1
The Directors present their report together with the consolidated financial report of the Newcrest Mining Limited Group, comprising the Company and its controlled entities, for the year ended 30 June 2014 and the Auditor’s Report thereon. Directors
The Directors of the Company during the year ended 30 June 2014, and until the date of this report are set out below. All Directors held their position except as noted.
Peter Hay Non-Executive Director and Non-Executive Chairman (1)
Sandeep Biswas Managing Director and Chief Executive Officer (2)
Gerard Bond Finance Director and Chief Financial Officer
Philip Aiken AM Non-Executive Director
Vince Gauci Non-Executive Director
Winifred Kamit Non-Executive Director
Richard Knight Non-Executive Director
Rick Lee Non-Executive Director
Tim Poole Non-Executive Director
John Spark Non-Executive Director
Don Mercer Non-Executive Director and Non-Executive Chairman (3)
Greg Robinson Managing Director and Chief Executive Officer (4) (1) Appointed as a Non-Executive Director on 8 August 2013 and Non-Executive Chairman on 1 January 2014. (2) Appointed Executive Director and Chief Operating Officer on 1 January 2014. Sandeep Biswas succeeded Greg
Robinson as Managing Director and Chief Executive Officer on 4 July 2014.
(3) Retired from the Board and as Non-Executive Chairman on 31 December 2013.
(4) Retired from the Board and was succeeded by Sandeep Biswas as referred to in note (2) above.
Principal Activities
The principal activities of the Group during the year were exploration, mine development, mine operations and the sale of gold and gold/copper concentrate. There were no significant changes in those activities during the year. Consolidated Result
The loss after tax attributable to Newcrest shareholders (‘Statutory Loss’) for the year ended 30 June 2014 was a net loss of $2,221 million (2013: loss of $5,783 million). Refer to the Operating and Financial Review for further details. The Operating and Financial Review forms part of this Directors’ Report. The financial information in the Operating and Financial Review includes non-IFRS financial information. Explanations and reconciliations of non-IFRS financial information to the financial statements are included in Section 7 of the Operating and Financial Review. Dividends
The Directors have determined that there will be no payment of a dividend for the year ended 30 June 2014.

DIRECTORS’ REPORT
Newcrest Mining Limited – Annual Financial Report – Year Ended 30 June 2014 B 2
Significant Changes in the State of Affairs
Refer to the Operating and Financial Review for the significant changes in the state of affairs of the Group. Future Developments
Refer to the Operating and Financial Review for information on likely developments and future prospects of the Group. Subsequent Events
On 22 July 2014, Slater & Gordon Lawyers commenced a representative proceeding in the Federal Court of Australia against Newcrest in relation to Newcrest’s market disclosure prior to Newcrest’s 7 June 2013 market release. The proceeding is brought on behalf of persons who acquired Newcrest shares between 13 August 2012 and 6 June 2013. The claimants seek declarations, damages and compensation all of which are unquantified. Newcrest intends to vigorously defend the proceedings. There have been no other matters or events that have occurred subsequent to 30 June 2014 that have significantly affected or may significantly affect the operations of the Group, the results of those operations or the state of affairs of the Group in subsequent financial years. Share Rights
During the year an aggregate of 241,646 rights were exercised, resulting in the issue of 241,646 ordinary shares of the Company for nil consideration. At the date of this report there were 3,113,052 unissued shares under rights (3,138,930 at 30 June 2014). Auditor Independence and Non-Audit Services
A copy of the Auditor’s Independence Declaration as required under section 307C of the Corporations Act 2001 is attached. During the year, other assurance related services and advisory services were provided by Ernst & Young (auditor to the Company) – refer Note 31 to the financial statements. The Directors are satisfied that the provision of these services did not impair the Auditor’s Independence. Rounding of Amounts
Newcrest Mining Limited is a company of the kind referred to in ASIC Class Order 98/100 and, in accordance with that Class Order, amounts in the Directors’ Report and the Financial Report are rounded to the nearest $1,000,000 except where otherwise indicated. Currency
All references to dollars in the Directors’ Report and the Financial Report are a reference to Australian dollars, ($ or A$) unless otherwise specified.

DIRECTORS’ REPORT
Newcrest Mining Limited – Annual Financial Report – Year Ended 30 June 2014 B 3
Environmental Regulation and Performance
The Managing Director reports monthly to the Board on all significant safety, health and environmental incidents. The Board also has a Safety and Sustainability Committee which has oversight of the safety, health and environmental performance of the Group. The Directors are not aware of any environmental matters which would have a materially adverse impact on the overall business of the Group. The operations of the Group are subject to environmental regulation under the jurisdiction of the countries in which those operations are conducted, including Australia, Indonesia, Papua New Guinea, Cote d’Ivoire and Fiji. Each mining operation is subject to particular environmental regulation specific to their activities as part of their operating licence or environmental approvals. Each of our sites are required to also manage their environmental aspects in accordance with our corporate environmental policies and standards. Where they can add value, selected voluntary industry-specific environmental codes of practice are also adopted by our mining operations, including the Australian Minerals Industry Sustainability Code “Enduring Value”, and the Business and Biodiversity Offset Program. The environmental laws and regulations that cover each of our sites, combined with our policies and standards, address the potential impact of the Group’s activities in relation to water and air quality, noise, land disturbance, waste and tailings management, and the potential impact upon flora and fauna. The Group releases an annual Sustainability Report in accordance with the Global Reporting Initiative that details our activities in relation to management of material environmental aspects. The Group has a uniform internal reporting system across all sites. All environmental events, including breaches of any regulation or law, are assessed according to their actual or potential environmental consequence. Five levels of environmental incidents are tracked based on factors such as spill volume, incident location (onsite or offsite) and potential or actual environmental impacts. These levels include: I (insignificant), II (minor), III (moderate), IV (major) and V (catastrophic). Data on Category I incidents are only collected at a site level and are not reported in aggregate for the Group. The number of events reported in each category during the year is shown in the following table. In all cases, environmental authorities were notified of those events where required and remedial action undertaken. During the reporting period, a Category IV (major) environmental incident occurred at Hidden Valley when an estimated 20,000 to 25,000 litres of semi-treated sewerage sludge overflowed from a storage tank and discharged into the environment. Necessary measures were immediately taken to prevent further discharge, clean up quantities of the spilled material and report the incident to the regulator. The investigation report that was shared with the regulator found that there were no significant environmental or health risks posed to the local community or local environment resulting from the incident.
Category II III IV V
2014 - Number of incidents 13 4 1 0
2013 - Number of incidents 46 3 1 0
Indemnification and Insurance of Directors and Officers
Newcrest maintains a Directors’ and Officers’ insurance policy that, subject to some exceptions, provides insurance cover to past, present or future Directors, Secretaries or Executive Officers of the Group and its subsidiaries. The Company has paid an insurance premium for the policy. Indemnification of Auditors
To the extent permitted by law, the Company has agreed to indemnify its auditors, Ernst & Young, as part of the terms of its audit engagement agreement against claims by third parties arising from the audit (for an unspecified amount). No payment has been made to indemnify Ernst & Young during or since the end of the financial year.

DIRECTORS’ REPORT
Newcrest Mining Limited – Annual Financial Report – Year Ended 30 June 2014 B 4
Information on Directors Details of the Directors’ qualifications, experience and special responsibilities are detailed below. Peter Hay Independent Non-Executive Chairman LLB, FAICD, 64 Mr Hay was appointed as Non-Executive Chairman of the Board on 1 January 2014, after being appointed as a Non-executive Director on 8 August 2013. Mr Hay has a strong background and breadth of experience in business, corporate law, finance and investment banking advisory work, with a particular expertise in relation to mergers and acquisitions. He has also had significant involvement in advising governments and government-owned enterprises. Mr Hay was Chief Executive Officer of the legal firm Freehills until 2005, where he had been a partner since 1977. Listed Directorships Director of CFX Co Ltd and Commonwealth Managed Investments Limited (effectively a single board) (from 2014) Director of GUD Holdings Limited (from 2009) Other Directorships/appointments Director of Landcare Australia Director of Australian Institute of Company Directors (AICD) Member of AICD Corporate Governance Committee Member of the Australian Government Takeovers Panel Former Listed Directorships (last 3 years) Director of Alumina Limited (2002-2013) Director of the Australia and New Zealand Banking Group Limited (2008 - 2014) Director of Myer Holdings Limited (2010 - 2014) Sandeep Biswas Managing Director and Chief Executive Officer (appointed 4 July 2014) BEng (Chem) (Hons), 52 Mr Biswas joined Newcrest on 1 January 2014, as an Executive Director and Chief Operating Officer and was appointed Managing Director and Chief Executive Officer effective 4 July 2014. Skills, experience and expertise Mr Biswas was previously Chief Executive Officer of Pacific Aluminium, a wholly owned subsidiary within the Rio Tinto group, which incorporated the bauxite, alumina, refining and smelting operations in Australia and New Zealand. He began his career with Mount Isa Mines, working in both Australia and Europe. Mr Biswas has also worked for Western Mining in Australia and Rio Tinto in Canada and Australia. He has experience in research, operations, business development and projects, across commodities including aluminium, copper, lead, zinc and nickel. Other Directorships/Appointments Director of the Minerals Council of Australia Director of the World Gold Council
DIRECTORS’ REPORT
Newcrest Mining Limited – Annual Financial Report – Year Ended 30 June 2014 B 5
Information on Directors (continued) Gerard Bond Finance Director and Chief Financial Officer BComm, Graduate Diploma Applied Finance and Investment, Chartered Accountant, F Fin, 46 Mr Bond was appointed to the Board as an Executive Director in February 2012, after joining Newcrest as Finance Director and Chief Financial Officer in January 2012. Skills, experience and expertise Mr Bond has experience in the global financial and resources industry with Newcrest, BHP Billiton, Coopers & Lybrand and Price Waterhouse. Prior to joining Newcrest, Mr Bond was with BHP Billiton for over 14 years where he held a number of senior executive roles in Europe and Australia including in Mergers and Acquisitions, Treasury, as Deputy CFO of the Aluminium business, CFO and then Acting President of the Nickel business, and most recently was BHP Billiton’s Head of Group Human Resources. Other Directorships/Appointments Alternate Director of the World Gold Council Philip Aiken AM Independent Non-Executive Director BEng (Chemical), Advanced Management Program (HBS), 65 Mr Aiken was appointed to the Board in April 2013. He is a member of the Human Resources and Remuneration Committee and the Safety and Sustainability Committee. Skills, experience and expertise Mr Aiken has extensive Australian and international business experience, principally in the engineering and resources sectors. He was Group President Energy BHP Billiton, President BHP Petroleum, Managing Director BOC/CIG, Chief Executive of BTR Nylex and Senior Advisor Macquarie Bank (Europe). Current Listed Directorships Director of National Grid plc (from 2008) Chairman of Aveva plc (from 2012) Former Listed Directorships (last 3 years) Chairman of Robert Walters plc (2007-2012) Director of Miclyn Express Offshore Ltd (2010-2012) Senior Independent Director of Kazakhmys plc (2008-2013) Senior Independent Director of Essar Energy plc (2010-2014) Director of Essar Oil Limited (a listed subsidiary of Essar Energy plc) (2012-2014) Vince Gauci Independent Non-Executive Director BEng (Mining), 72 Mr Gauci was appointed to the Board in December 2008. He is a member of the Safety and Sustainability Committee and the Human Resources and Remuneration Committee. Skills, experience and expertise Mr Gauci has more than 40 years’ experience in the global mining industry, culminating in his role as Managing Director of MIM Ltd. He is a former Chairman of Runge Limited and was a Director of Liontown Resources Limited and of Coates Hire Limited. Other Directorships/appointments Chairman of the Broken Hill Community Foundation

DIRECTORS’ REPORT
Newcrest Mining Limited – Annual Financial Report – Year Ended 30 June 2014 B 6
Information on Directors (continued) Lady Winifred Kamit Independent Non-Executive Director BA, LLB, 61 Lady Kamit was appointed to the Board in February 2011. She is a member of the Human Resources and Remuneration Committee and the Safety and Sustainability Committee. Skills, experience and expertise Lady Kamit has extensive business experience and broad community knowledge of Papua New Guinea. She is currently a consultant at Gadens Lawyers in Port Moresby and was formerly a senior partner at that firm. Lady Kamit was a Director of Lihir Gold Limited from 2004 until 2010. Listed Directorships Director of Steamships Trading Company Limited (from 2005) Other Directorships/appointments Councillor of the Papua New Guinea Institute of National Affairs and Chairperson of Coalition for Change PNG (an initiative against violence against women and children). Director of Nautilus Minerals Niugini Limited Director of ANZ Banking Group (PNG) Limited Director of Post Courier Limited Director of South Pacific Post Limited Richard Knight Independent Non-Executive Director BSc (Mining Engineering), MSc (Mine Production Management), Chartered Engineer, FAICD, 73 Mr Knight was appointed to the Board in February 2008. He is Chairman of the Safety and Sustainability Committee and a member of the Audit and Risk Committee. Skills, experience and expertise Mr Knight has over 40 years of varied experience across all phases of the mining industry and in a wide spread of jurisdictions around the world. He is a former Executive Director of North Limited, President and Chief Executive Officer of Iron Ore Company of Canada and Energy Resources Australia Limited. He is a former Director of OZ Minerals Limited, Zinifex Limited, St. Barbara Limited, Portman Limited, Northern Orion Resources Inc. and Asia Pacific Resources Ltd. Other Directorships/appointments Chairman of the Mining Engineering Advisory Board, Monash University Director of Mining Education Australia
DIRECTORS’ REPORT
Newcrest Mining Limited – Annual Financial Report – Year Ended 30 June 2014 B 7
Information on Directors (continued) Rick Lee Independent Non-Executive Director BEng (Chemical) (Hons), MA (Econ) (Oxon), FAICD, 64 Mr Lee was appointed to the Board in August 2007. He is Chairman of the Human Resources and Remuneration Committee and a member of the Audit and Risk Committee. Skills, experience and expertise Mr Lee has extensive resource banking, finance and international commercial experience. His previous senior executive roles include 16 years with CSR Limited and nine years as Chief Executive Officer of NM Rothschild Australia Limited. He is a former Chairman of the Australian Institute of Company Directors and also C. Czarnikow Limited. Listed Directorships Chairman of Oil Search Limited (Director 2012, Chairman 2013) Former Listed Directorships (last 3 years) Director of CSR Limited (2005-2011) Deputy Chairman of Ridley Corporation Limited (2001-2013) Chairman Salmat Limited (2002 – 2013) Tim Poole Independent Non-Executive Director BComm, CA, 45 Mr Poole was appointed to the Board in August 2007. He is a member of the Audit and Risk Committee and the Human Resources and Remuneration Committee. Skills, experience and expertise Mr Poole has more than 15 years’ experience as a director and chairman of ASX listed and unlisted companies across the financial services, infrastructure, aged care and resources industries. He was formerly Managing Director of Hastings Funds Management Limited, and chairman of Asciano Limited. Listed Directorships Chairman of Lifestyle Communities Limited (from 2007) Director of McMillan Shakespeare Limited (from 2013) Director of Japara Healthcare Limited (from 2014) Other Directorships/appointments Chairman of Westbourne Credit Management Limited Director of AustralianSuper Pty Ltd and chairman of its investment committee

DIRECTORS’ REPORT
Newcrest Mining Limited – Annual Financial Report – Year Ended 30 June 2014 B 8
Information on Directors (continued) John Spark Independent Non-Executive Director BComm, FCA, MAICD 65 Mr Spark was appointed to the Board in September 2007 and is Chairman of the Audit and Risk Committee. Skills, experience and expertise Mr Spark has an extensive background in company reconstruction, accounting, profit improvement and financial analysis. He is a registered company auditor and former Managing Partner of Ferrier Hodgson, Melbourne. He is a former Director of ANL Limited, Baxter Group Limited and Macarthur Coal Limited. Listed Directorships Chairman of Ridley Corporation Limited (Director 2008, Chairman 2010) Information on Former Directors Don Mercer Independent Non-Executive Chairman BSc, MA (Econ), 73 Mr Mercer was appointed to the Board as Non-Executive Chairman in October 2006. Skills, experience and expertise Mr Mercer has extensive business experience obtained as a senior executive of major international organisations including as a former Managing Director and Chief Executive Officer of the ANZ Banking Group Limited. He is a former Chairman of Orica Limited, the AICD, Orchestra Victoria and Australia Pacific Airports Corporation Limited and Chancellor of RMIT University. Other Directorships/Appointments Chairman of Air Liquide Australia Limited Mr Mercer retired from the Board on 31 December 2013. Greg Robinson Managing Director and Chief Executive Officer BSc (Hons), MBA (Columbia University), MAICD, 52 Mr Robinson was appointed to the Board as an Executive Director in November 2006. Mr Robinson was appointed Managing Director and Chief Executive Officer of Newcrest in July 2011 after serving as Director Finance of Newcrest from 2006 to 2011. Prior to joining Newcrest, Mr Robinson was with the BHP Billiton Group from 2001 to 2006 in various executive roles, including Chief Finance and Chief Development Officer, Energy and Chief Financial Officer, Petroleum. Mr Robinson was also a member of the Group Executive Committee. Before joining BHP Billiton, he was a Director of Investment Banking at Merrill Lynch & Co. Mr Robinson is a Director of St. Vincent’s Institute. Mr Robinson retired from the Board on 4 July 2014.
DIRECTORS’ REPORT
Newcrest Mining Limited – Annual Financial Report – Year Ended 30 June 2014 B 9
Information on Company Secretary Francesca Lee Company Secretary and General Counsel BComm, LLB (Hons), LLM, Grad. Dip. CSP, AGIA, 58 Ms Lee joined Newcrest as General Counsel and Company Secretary on 31 March 2014. She was General Counsel and Company Secretary of OZ Minerals Limited from 2008 until 2014, and its antecedent companies from 2003. Ms Lee has more than 26 years’ experience working across various senior legal and commercial roles within the mining industry including BHP Billiton, Rio Tinto Limited and Comalco Limited, including as General Manager Internal Audit and Risk at Rio Tinto Limited. She also spent several years as Vice President Structured Finance with Citibank Limited. Ms Lee is a member of the Australian Government Takeovers Panel. Peter Larsen Deputy Company Secretary BA, LLB (Hons), 46 Mr Larsen joined Newcrest in March 2006 as Senior Counsel in the legal and secretariat team. He was formally appointed as Deputy Company Secretary in May 2010. Prior to joining Newcrest, Mr Larsen worked as a lawyer in the London office of Ashurst, a major international commercial law firm from 2001 to 2006, practising in the energy, projects and infrastructure team, following roles in house and in private practice in Melbourne. Directors’ Meetings
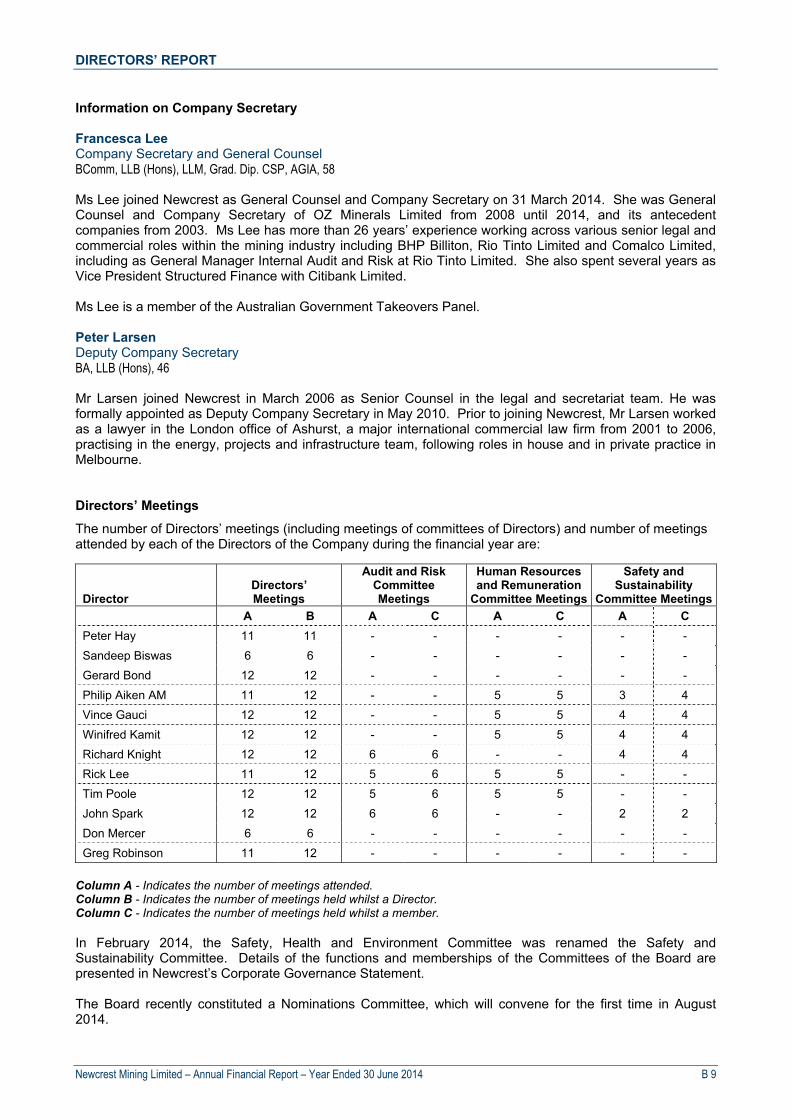
The number of Directors’ meetings (including meetings of committees of Directors) and number of meetings attended by each of the Directors of the Company during the financial year are:
Director Directors’ Meetings
Audit and Risk Committee Meetings
Human Resources and Remuneration
Committee Meetings
Safety and Sustainability
Committee Meetings
A B A C A C A C
Peter Hay 11 11 - - - - - -
Sandeep Biswas 6 6 - - - - - -
Gerard Bond 12 12 - - - - - -
Philip Aiken AM 11 12 - - 5 5 3 4
Vince Gauci 12 12 - - 5 5 4 4
Winifred Kamit 12 12 - - 5 5 4 4
Richard Knight 12 12 6 6 - - 4 4
Rick Lee 11 12 5 6 5 5 - -
Tim Poole 12 12 5 6 5 5 - -
John Spark 12 12 6 6 - - 2 2
Don Mercer 6 6 - - - - - -
Greg Robinson 11 12 - - - - - -
Column A - Indicates the number of meetings attended. Column B - Indicates the number of meetings held whilst a Director. Column C - Indicates the number of meetings held whilst a member. In February 2014, the Safety, Health and Environment Committee was renamed the Safety and Sustainability Committee. Details of the functions and memberships of the Committees of the Board are presented in Newcrest’s Corporate Governance Statement. The Board recently constituted a Nominations Committee, which will convene for the first time in August 2014.
DIRECTORS’ REPORT
Newcrest Mining Limited – Annual Financial Report – Year Ended 30 June 2014 B 10
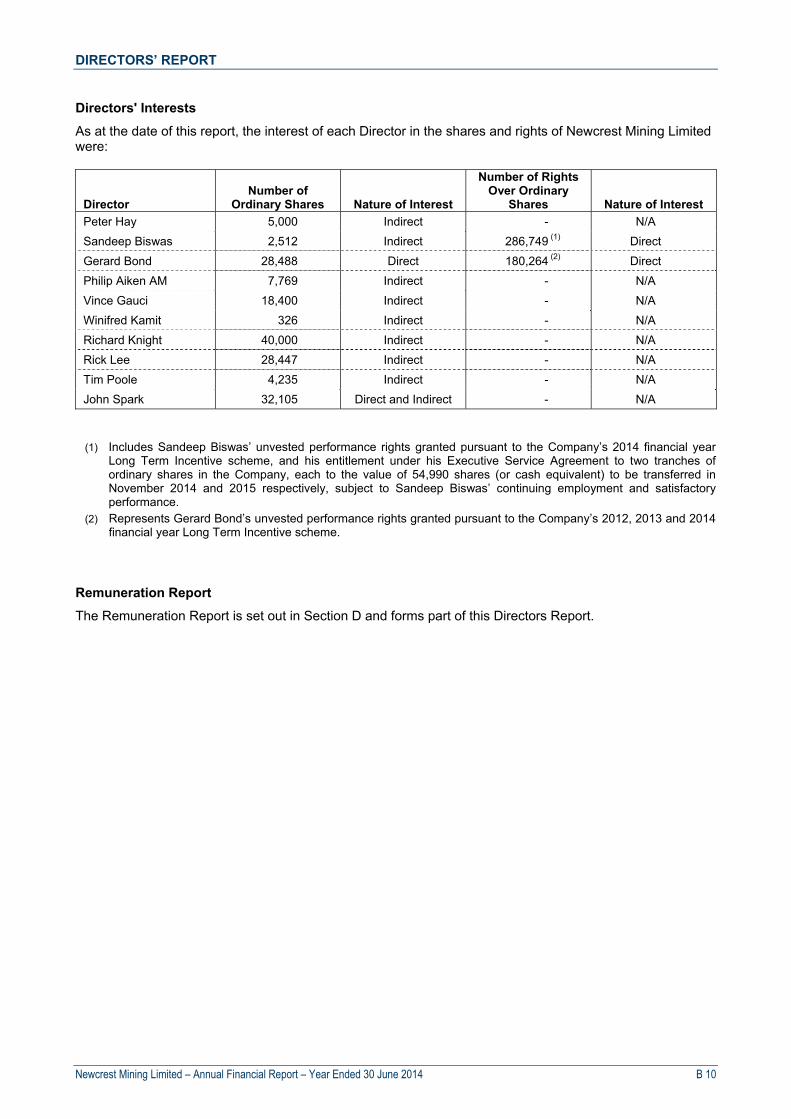
Directors' Interests
As at the date of this report, the interest of each Director in the shares and rights of Newcrest Mining Limited were:
Director Number of
Ordinary Shares Nature of Interest
Number of Rights Over Ordinary
Shares Nature of Interest
Peter Hay 5,000 Indirect - N/A
Sandeep Biswas 2,512 Indirect 286,749 (1) Direct
Gerard Bond 28,488 Direct 180,264 (2) Direct
Philip Aiken AM 7,769 Indirect - N/A
Vince Gauci 18,400 Indirect - N/A
Winifred Kamit 326 Indirect - N/A
Richard Knight 40,000 Indirect - N/A
Rick Lee 28,447 Indirect - N/A
Tim Poole 4,235 Indirect - N/A
John Spark 32,105 Direct and Indirect - N/A
(1) Includes Sandeep Biswas’ unvested performance rights granted pursuant to the Company’s 2014 financial year Long Term Incentive scheme, and his entitlement under his Executive Service Agreement to two tranches of ordinary shares in the Company, each to the value of 54,990 shares (or cash equivalent) to be transferred in November 2014 and 2015 respectively, subject to Sandeep Biswas’ continuing employment and satisfactory performance.
(2) Represents Gerard Bond’s unvested performance rights granted pursuant to the Company’s 2012, 2013 and 2014 financial year Long Term Incentive scheme.
Remuneration Report
The Remuneration Report is set out in Section D and forms part of this Directors Report.
A member firm of Ernst & Young Global LimitedLiability limited by a scheme approved under Professional Standards Legislation
Ernst & Young8 Exhibition StreetMelbourne VIC 3000 AustraliaGPO Box 67 Melbourne VIC 3001
Tel: +61 3 9288 8000Fax: +61 3 8650 7777ey.com/au
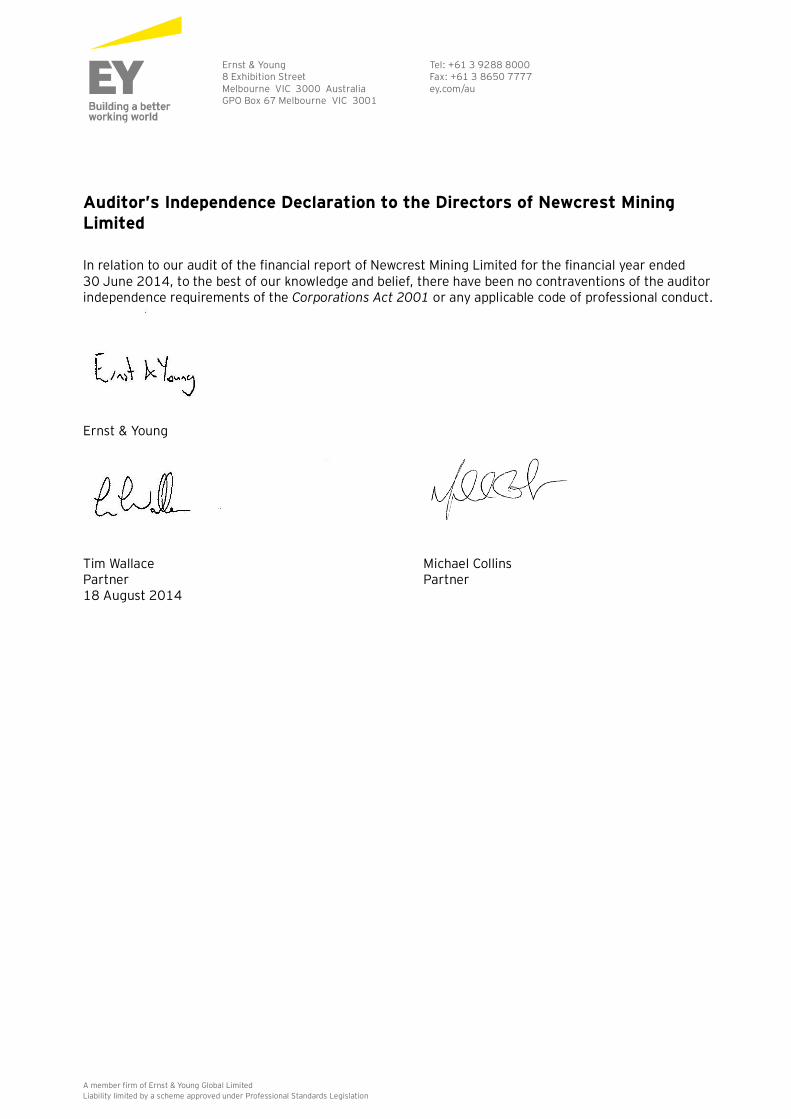
Auditor’s Independence Declaration to the Directors of Newcrest MiningLimited
In relation to our audit of the financial report of Newcrest Mining Limited for the financial year ended30 June 2014, to the best of our knowledge and belief, there have been no contraventions of the auditorindependence requirements of the Corporations Act 2001 or any applicable code of professional conduct.
Ernst & Young
Tim WallacePartner
Michael CollinsPartner
18 August 2014
OPERATING AND FINANCIAL REVIEW
Newcrest Mining Limited – Annual Financial Report – Year Ended 30 June 2014 C 1
1 Summary of Results for the Year Ended 30 June 2014 1,2
Key points
Statutory loss3 of A$2,221 million and Underlying profit4,6 of A$432 million Significant items representing a net loss after tax of A$2,653 million, due primarily to A$2,353 million
of asset impairments at Lihir, Telfer, Bonikro and Hidden Valley EBITDA5,6 of A$1,514 million and EBIT5,6 of A$821 million Gold production of 2,396,023 ounces and gold sales of 2,405,163 ounces was 14% and 17% higher
than the prior year Free cash flow7 was an inflow of A$133 million compared with a net outflow of A$1,417 in the prior
year, with all operations free cash flow positive in the current year except Hidden Valley Cash flow from operating activities was an inflow of A$1,037 million All-In Sustaining Cost6,8 of A$976 per ounce (US$897 per ounce at an A$:US$ exchange rate of
$0.91879) was 24% (32%) lower than the prior year Gearing10 of 33.8% at 30 June 2014 A$1,808 million11 in cash and undrawn, committed bank facilities at 30 June 2014 No dividend for the twelve months ended 30 June 2014
Full year results
Newcrest’s operating and financial performance for the twelve months ended 30 June 2014 reflects the Company’s focus on improving productivity, reducing costs and capital expenditure and maximising free cash flow while maintaining growth options.
Increased gold and copper production and free cash flow generation in the 2014 financial year follows major expansion investments at Cadia Valley and Lihir, improved operating performance across all operations, and a reduction in All-In Sustaining Cost expenditure.
Newcrest’s 2014 financial year gold production of 2.4 million ounces exceeded guidance of 2.0 to 2.3 million ounces. Full year copper production of 86 thousand tonnes also exceeded guidance of 75 to 85 thousand tonnes. Total capital expenditure in the 2014 financial year of A$843 million, All-In Sustaining Cost expenditure of A$2.33 billion and exploration expenditure of A$62 million were also below their guidance of A$895 to A$1,025 million, A$2.45 to A$2.73 billion and A$80 to A$90 million, respectively.
Statutory loss for the current year was A$2,221 million (compared with a prior year statutory loss of A$5,783 million), including significant items after tax totalling A$2,653 million. The significant items comprise asset impairments of A$2,353 million, an additional income tax expense for the period of A$120 million as a result of the voluntary amendment of research and development claims in prior periods12, restructure costs of A$34 million and A$146 million in write downs of inventory, property, plant and equipment at Lihir and Cadia Valley.
The asset impairments were primarily a result of Newcrest’s review of physical, cost, capital and economic assumptions applied in the valuation of Newcrest’s assets as at 30 June 2014. The outcome of this review, and total asset impairments of A$2,353 million, primarily reflects applying updated operating and capital cost assumptions at Lihir, Bonikro and Hidden Valley, and the impact of applying updated foreign exchange assumptions at Telfer.
Underlying profit for the twelve months ended 30 June 2014 was A$432 million (prior year A$446 million) and primarily reflects the impact of a 9% lower average realised gold price partially offset by a 17% increase in gold sales volumes.
EBITDA of A$1,514 million and EBIT of A$821 million for the current year represent EBITDA margins and EBIT margins of 37.5% and 20.3% respectively.

OPERATING AND FINANCIAL REVIEW
Newcrest Mining Limited – Annual Financial Report – Year Ended 30 June 2014 C 2
Free cash flow, being cash flow from operating activities less cash flow from investing activities of the Company, for the twelve months ended 30 June 2014 was an inflow of A$133 million, A$1,550 million higher than the prior year outflow (of A$1,417 million). All operations were free cash flow positive in the current year except Hidden Valley.
Cash flow from operating activities for the twelve months ended 30 June 2014 was A$1,037 million, A$110 million lower than the prior year (of A$1,147 million), reflecting higher revenue compared to the prior year as a result of increased sales volumes offset by the continued effect of a lower average realised gold price for the current year and the unwinding of approximately A$200 million of favourable working capital balances as at 30 June 2013. Cash flow from operating activities in the current year was also adversely impacted by a A$64 million increase in interest payments associated with higher average debt levels during the current year, a A$70 million cash tax payment associated with the Company’s voluntary amendment of its past Australian research and development claims, and A$65 million of restructuring expenditure associated with office closure and redundancy costs.
Consistent with the Company’s stated aim of focusing on free cash flow generation, a number of initiatives were implemented during the current year. These initiatives included reducing mining activity and increased stockpile processing at Lihir, the cessation of processing low-grade stockpiles at Cadia Valley and reduced open pit activity at Telfer. These initiatives, combined with the completion of major production stripping programs at Telfer and Bonikro, resulted in a reduction in open pit material movements across the Company. Cost reduction activity has also resulted in the transition to new contracts with reduced unit rates across consumables and labour services, reduction in workforce numbers through restructuring, and improved consumption rates for power, reagents and consumables.
Cash flow from investing activities for the twelve months ended 30 June 2014 was an outflow of A$904 million, A$1,660 million lower than the prior year (an outflow of A$2,564 million). This was primarily the result of the completion of the Lihir expansion project and the commencement of commercial production at Cadia East Panel Cave 1 in the prior year, lower sustaining capital in the current year, and a lower level of production stripping activity (primarily at Telfer and Bonikro). Exploration expenditure of A$62 million was A$90 million lower than the prior year.
Newcrest’s All-In Sustaining Cost per ounce sold for the twelve months ended 30 June 2014 was A$976 per ounce (US$897 per ounce), A$307 per ounce lower than the prior year result of A$1,283 per ounce (US$1,318 per ounce). This improvement is primarily the result of the higher sales volumes, production efficiencies and reductions in sustaining capital expenditure and production stripping activity.
Capital structure
As at 30 June 2014, Newcrest’s gearing level was 33.8%. Under current market and operating conditions, the Board remains comfortable with gearing being at this level in the short to medium term given the near term cash flow growth outlook of the Group.
As at 30 June 2014 Newcrest had an equivalent of A$1,808 million in cash and undrawn, committed bank facilities. As announced on 28 March 2014, Newcrest extended the tenor of many of its existing bilateral bank loan facilities to provide a smoother and longer average maturity profile of its debt facilities.
Consistent with the Company’s dividend policy - with dividend levels set with regard to profitability, balance sheet strength, and reinvestment options in the business - the Newcrest Board has determined there will be no dividend for the 2014 financial year having regard to the level of profitability and free cash flow in the current year, the level of gearing at 30 June 2014, and the planned application of operating cash flow to Cadia East Panel Cave 2 in the 2015 financial year.
OPERATING AND FINANCIAL REVIEW
Newcrest Mining Limited – Annual Financial Report – Year Ended 30 June 2014 C 3
Outlook13
All sites achieved production and cost guidance for the current year, with some sites performing significantly better. Looking ahead, Newcrest is firmly focused on realising the full potential of each of the Company’s assets, with a focus on the following:
operational discipline (including safety); cash; and profitable growth
The Company expects to be free cash flow positive14,15in the 2015 financial year at an average realised gold price of US$1,250 per ounce, subject to market and operating conditions, with the following guidance:
Group gold production is expected to be in the range of 2.2 to 2.4 million ounces Group copper production is expected to be in the range of 75,000 to 85,000 tonnes Group silver production is expected to be in the range of 2.2 to 2.5 million ounces Group All-In Sustaining Cost expenditure is expected to be in the range of A$2,300 to A$2,60015
million Total capital expenditure (inclusive of project and development capital, production stripping and
sustaining capital) is expected to be in the range of A$660 to A$740 million, including approximately A$240 to A$280 million relating to the development of Cadia East Panel Cave 2
Total exploration expenditure (inclusive of on-site exploration) is expected to be in the range of A$60 to A$70 million
Depreciation and amortisation of site assets (including production stripping) is expected to be in the range of A$600 to A$670 million, including the amortisation of capitalised production stripping.
1 All figures in this Report relate to businesses of the Newcrest Mining Limited Group (‘Newcrest’ or ‘the Company’) for the 12 months
ended 30 June 2014 (‘current year’) compared with the 12 months ended 30 June 2013 (‘prior year’), except where otherwise stated. All references to $ are a reference to Australian dollars unless otherwise stated.
2 Newcrest has adopted International Financial Reporting Interpretation Committee (IFRIC) Interpretation - 20 Stripping Costs in the Production Phase of a Surface Mine as of 1 July 2013. In accordance with the transitional provisions of Interpretation 20, comparative figures have been restated. The impact of this restatement on the comparative Income Statement, Statement of Financial Position and Statement of Cash Flows is outlined in Note 4 of the financial statements.
3 Statutory profit/(loss) is profit after tax attributable to owners of the parent Company.
4 Underlying profit/(loss) is profit after tax before significant items attributable to owners of the parent Company. Refer to section 7 for further detail.
5 EBITDA is ‘Earnings before interest, tax, depreciation and amortisation, and significant items’. EBIT is ‘Earnings before interest, tax and significant items’.
6 EBITDA, EBIT, Underlying profit and All-In Sustaining Cost are non-IFRS financial information used by Newcrest to measure performance and have not been subject to audit by the Company’s external auditor. Refer to section 7 for further detail.
7 Free cash flow is calculated as cash flow from operating activities less cash flow related to investing activities. Free cash flow is non-IFRS financial information. Refer to section 4 for further details.
8 AISC is All-In Sustaining Cost as per World Gold Council Guidance Note on Non-GAAP Metrics, released 27 June 2013.
9 All-In Sustaining Costs in USD terms are converted to USD at an average A$:US$ exchange rate for the 12 months ended 30 June 2014 of $0.9187.
10 Gearing is calculated as net debt expressed as a percentage of net debt plus equity. Refer to section 6 for further details. 11 Comprises undrawn bilateral loan facilities of US$1,520 million and an additional unutilised US$50 million loan facility at a closing
foreign exchange rate of AUD/USD $0.9420, and cash and cash equivalents of A$141 million. 12 Refer to Market Release of 17 October 2013. 13
Disclaimer: These materials include forward looking statements. Often, but not always, forward looking statements can generally be identified by the use of forward looking words such as “may”, “will”, “expect”, “intend”, “plan”, “estimate”, “anticipate”, “continue”, and “guidance”, or other similar words and may include, without limitation, statements regarding plans, strategies and objectives of management, anticipated production or construction commencement dates and expected costs or production outputs. Forward looking statements inherently involve known and unknown risks, uncertainties and other factors that may cause the Company’s actual results, performance and achievements to differ materially from any future results, performance or achievements. Relevant factors may include, but are not limited to, changes in commodity prices, foreign exchange fluctuations and general economic conditions, increased costs and demand for production inputs, the speculative nature of exploration and project development, including the risks of obtaining necessary licenses and permits and diminishing quantities or grades of reserves, political and social risks, changes to the regulatory framework within which the Company operates or may in the future operate, environmental conditions including extreme weather conditions, recruitment and retention of personnel, industrial relations issues and litigation.

OPERATING AND FINANCIAL REVIEW
Newcrest Mining Limited – Annual Financial Report – Year Ended 30 June 2014 C 4
Forward looking statements are based on the Company and its management’s good faith assumptions relating to the financial, market, regulatory and other relevant environments that will exist and affect the Company’s business and operations in the future. The Company does not give any assurance that the assumptions on which forward looking statements are based will prove to be correct, or that the Company’s business or operations will not be affected in any material manner by these or other factors not foreseen or foreseeable by the Company or management or beyond the Company’s control. Although the Company attempts and has attempted to identify factors that would cause actual actions, events or results to differ materially from those disclosed in forward looking statements, there may be other factors that could cause actual results, performance, achievements or events not to be as anticipated, estimated or intended, and many events are beyond the reasonable control of the Company. Accordingly, readers are cautioned not to place undue reliance on forward looking statements. Forward looking statements in these materials speak only at the date of issue. Subject to any continuing obligations under applicable law or any relevant stock exchange listing rules, in providing this information the Company does not undertake any obligation to publicly update or revise any of the forward looking statements or to advise of any change in events, conditions or circumstances on which any such statement is based.
14 Refer to the Company’s forward looking statements disclaimer above 15 Assumes weighted average gold price of US$1,250 per ounce, copper price of US$3.00 per pound, silver price of US$20 per ounce
and AUD/USD exchange rate of 0.93
OPERATING AND FINANCIAL REVIEW
Newcrest Mining Limited – Annual Financial Report – Year Ended 30 June 2014 C 5
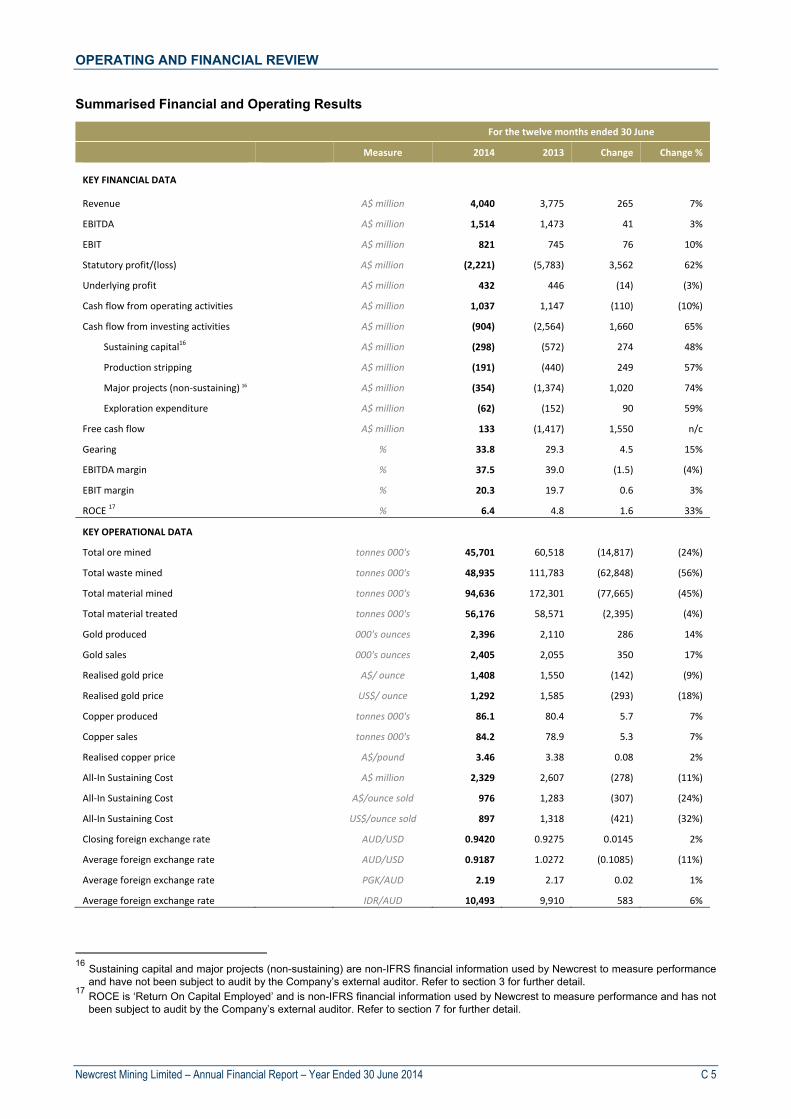
Summarised Financial and Operating Results
For the twelve months ended 30 June
Measure 2014 2013 Change Change %
KEY FINANCIAL DATA
Revenue A$ million 4,040 3,775 265 7%
EBITDA A$ million 1,514 1,473 41 3%
EBIT A$ million 821 745 76 10%
Statutory profit/(loss) A$ million (2,221) (5,783) 3,562 62%
Underlying profit A$ million 432 446 (14) (3%)
Cash flow from operating activities A$ million 1,037 1,147 (110) (10%)
Cash flow from investing activities A$ million (904) (2,564) 1,660 65%
Sustaining capital16 A$ million (298) (572) 274 48%
Production stripping A$ million (191) (440) 249 57%
Major projects (non‐sustaining) 16 A$ million (354) (1,374) 1,020 74%
Exploration expenditure A$ million (62) (152) 90 59%
Free cash flow A$ million 133 (1,417) 1,550 n/c
Gearing % 33.8 29.3 4.5 15%
EBITDA margin % 37.5 39.0 (1.5) (4%)
EBIT margin % 20.3 19.7 0.6 3%
ROCE 17 % 6.4 4.8 1.6 33%
KEY OPERATIONAL DATA
Total ore mined tonnes 000's 45,701 60,518 (14,817) (24%)
Total waste mined tonnes 000's 48,935 111,783 (62,848) (56%)
Total material mined tonnes 000's 94,636 172,301 (77,665) (45%)
Total material treated tonnes 000's 56,176 58,571 (2,395) (4%)
Gold produced 000's ounces 2,396 2,110 286 14%
Gold sales 000's ounces 2,405 2,055 350 17%
Realised gold price A$/ ounce 1,408 1,550 (142) (9%)
Realised gold price US$/ ounce 1,292 1,585 (293) (18%)
Copper produced tonnes 000's 86.1 80.4 5.7 7%
Copper sales tonnes 000's 84.2 78.9 5.3 7%
Realised copper price A$/pound 3.46 3.38 0.08 2%
All‐In Sustaining Cost A$ million 2,329 2,607 (278) (11%)
All‐In Sustaining Cost A$/ounce sold 976 1,283 (307) (24%)
All‐In Sustaining Cost US$/ounce sold 897 1,318 (421) (32%)
Closing foreign exchange rate AUD/USD 0.9420 0.9275 0.0145 2%
Average foreign exchange rate AUD/USD 0.9187 1.0272 (0.1085) (11%)
Average foreign exchange rate PGK/AUD 2.19 2.17 0.02 1%
Average foreign exchange rate IDR/AUD 10,493 9,910 583 6%
16 Sustaining capital and major projects (non-sustaining) are non-IFRS financial information used by Newcrest to measure performance
and have not been subject to audit by the Company’s external auditor. Refer to section 3 for further detail. 17 ROCE is ‘Return On Capital Employed’ and is non-IFRS financial information used by Newcrest to measure performance and has not
been subject to audit by the Company’s external auditor. Refer to section 7 for further detail.

OPERATING AND FINANCIAL REVIEW
Newcrest Mining Limited – Annual Financial Report – Year Ended 30 June 2014 C 6
2 Discussions and Analysis of Operations and the Income Statement
Profit overview 2.1
For the twelve months ended 30 June 2014, the Company incurred a Statutory loss of A$2,221 million, compared with the prior year Statutory loss of A$5,783 million.
Underlying profit for the twelve months ended 30 June 2014 of A$432 million was 3% lower than the prior year Underlying profit of A$446 million. The current year profit outcome reflects adverse factors including a 9% decline in average realised gold price and higher interest costs (due to higher average debt levels and lower capitalised interest). These unfavourable impacts were largely offset by increased gold production and sales volumes.
The difference of A$2,653 million between Statutory profit and Underlying profit in the current year is attributable to significant items relating to:
asset impairments of A$2,353 million; an additional income tax expense for the period of A$120 million as a result of the voluntary
amendment of R&D claims in prior periods; write down of property, plant and equipment at Lihir and Cadia Valley of A$122 million; restructuring costs of A$34 million; and write down of inventory at Lihir of A$24 million.
Further information on asset impairments, asset write-downs and restructure costs can be found in section 2.7.
Underlying profit 2.2
The differences between Underlying profit of A$432 million in the current year and Underlying profit of A$446 million in the prior year are quantified in the table below.
For the twelve months ended 30 June
A$ million 2014 2013 Change Change %
Revenues: 4,040 3,775 265 7%
Gold 3,359 3,149 210 7%
Copper 629 573 56 10%
Silver 52 53 (1) (2%)
Cost of sales: 18 (3,059) (2,764) (295) (11%)
Operating Costs (2,395) (2,058) (337) (16%)
Depreciation (664) (706) 42 6%
Other costs:
Corporate administration (134) (132) (2) (2%)
Exploration (36) (64) 28 44%
Other income/expense (12) (82) 70 85%
Net finance costs (174) (109) (65) (60%)
Share of profit of associate 22 12 10 (83%)
Tax and non‐controlling interest:
Income tax expense (192) (158) (34) (22%)
Non‐controlling interest (23) (32) 9 28%
Underlying profit 432
446 (14) (3%)
18 Cost of sales excludes pre-tax inventory write-downs of A$35 million in the 2014 financial year and A$177 million in the prior year.

OPERATING AND FINANCIAL REVIEW
Newcrest Mining Limited – Annual Financial Report – Year Ended 30 June 2014 C 7
Production and revenue 2.3
For the twelve months ended 30 June
Measure 2014 2013 Change Change %
Production volumes 19
Gold ounces 2,396,023 2,109,784 286,239 14%
Copper tonnes 86,118 80,366 5,752 7%
Silver ounces 2,324,210 1,931,816 392,394 20%
Sales volumes 19
Gold ounces 2,405,163 2,054,923 350,240 17%
Copper tonnes 84,220 78,887 5,333 7%
Silver ounces 2,297,324 1,943,032 354,292 18%
Realised prices
Gold A$/ounce 1,408 1,550 (142) (9%)
Copper A$/pound 3.46 3.38 0.08 2%
Silver A$/ounce 22.45 27.13 (4.68) (17%)
Realised prices
Gold US$/ounce 1,292 1,585 (293) (18%)
Copper US$/pound 3.17 3.44 (0.27) (8%)
Silver US$/ounce 20.59 27.89 (7.30) (26%)
Closing foreign exchange rate AUD/USD 0.9420 0.9275 0.0145 2%
Average foreign exchange rate AUD/USD 0.9187 1.0272 (0.1085) (11%)
Revenue
Gold A$ million 3,359 3,149 210 7%
Copper A$ million 629 573 56 10%
Silver A$ million 52 53 (1) (2%)
Total sales revenue A$ million 4,040 3,775 265 7%
2.3.1 Production
Gold production for the twelve months ended 30 June 2014 of 2,396,023 ounces was 286,239 ounces or 14% higher than the prior year (2,109,784 ounces).
Production in the current year was higher than the prior year at all operations as a result of a full year of commercial production from Cadia East Panel Cave 1, increased throughput capacity at Lihir, increased volume and grade from Ridgeway, and higher grade from Gosowong underground ore sources. Processing of lower grade, lower margin, stockpiled ore from Cadia Hill ceased in the current year, as did the open pit operation at Gosowong.
Copper production of 86,118 tonnes in the current year was 5,752 tonnes or 7% higher than the prior year (80,366 tonnes). This was primarily the result of an increase in the volume and grade of ore from Cadia East and Ridgeway compared to the prior year.
Further information on production at all operations can be found in section 5.
19 Production and sales for the twelve months ended 30 June 2014 includes 18,675 pre-commissioning and development gold ounces
and 1,770 tonnes of copper for the Cadia East project. Production and sales for the twelve months ended 30 June 2013 includes 22,695 pre-commissioning and development gold ounces and 1,879 tonnes of copper for the Cadia East project. Expenditure associated with this production and revenue from the sales are capitalised and not included in the operating profit calculations.

OPERATING AND FINANCIAL REVIEW
Newcrest Mining Limited – Annual Financial Report – Year Ended 30 June 2014 C 8
2.3.2 Revenue
Total sales revenue for the twelve months ended 30 June 2014 of A$4,040 million was A$265 million or 7% higher than the prior year (A$3,775 million).
A$ million
Total sales revenue for the twelve months ended 30 June 2013 3,775
Changes in revenues:
Gold 549
Copper 41
Silver 10
Volume 600
Gold (339)
Copper 15
Silver (11)
Price (335)
Total sales revenue for the twelve months ended 30 June 2014 4,040
Gold revenue for the current year of A$3,359 million was 7% higher than the prior year (A$3,149 million), primarily the result of a 17% increase in gold sales volumes to 2,405,163 ounces, partially offset by a reduction in realised gold prices.
The average realised gold price for the current year was A$1,408 per ounce, 9% lower than the prior year (A$1,550 per ounce). In US dollar terms, the average realised gold price of US$1,292 per ounce in the current year was 18% lower than the prior year (US$1,585 per ounce). The relative performance of the gold price in Australian dollar terms reflects an 11% decline in the average AUD/USD exchange rate during the current year to $0.9187 ($1.0272 in the prior year).
Copper revenue of A$629 million was 10% higher than the prior year (A$573 million), reflecting a 2% increase in the average realised Australian dollar copper price to A$3.46 per pound and a 7% increase in copper sales volumes to 84,220 tonnes.
Silver revenue of A$52 million was 2% lower than the prior year (A$53 million), with higher sales volumes offset by lower average realised silver prices.
Newcrest’s sales revenue continues to be predominantly attributable to gold, with gold revenue representing 83% of total sales revenue for the current year (83% in the prior year).

OPERATING AND FINANCIAL REVIEW
Newcrest Mining Limited – Annual Financial Report – Year Ended 30 June 2014 C 9
For the twelve months ended 30 June
2014 2013
Production and Sales Production Sales Production Sales
Gold production and sales (ounces) 20
‐ Cadia Hill (stockpile) 21,141 17,129 119,372 140,944
‐ Ridgeway 345,364 337,984 262,228 244,225
‐ Cadia East 226,326 218,492 65,279 65,279
Cadia Valley 592,831 573,605 446,879 450,448
Telfer 536,342 539,672 525,500 508,976
Lihir 721,264 747,265 649,340 621,885
Gosowong 344,747 336,059 312,711 303,122
Hidden Valley 105,845 104,772 85,004 84,272
Bonikro 94,994 103,790 90,350 86,220
Total gold production and sales (ounces) 20 2,396,023 2,405,163 2,109,784 2,054,923
Copper production and sales (tonnes)
‐ Cadia Hill (stockpile) 3,022 2,521 13,095 15,620
‐ Ridgeway 41,918 41,038 35,995 33,117
‐ Cadia East 15,672 15,404 4,823 4,823
Cadia Valley 60,612 58,963 53,913 53,560
Telfer 25,506 25,257 26,453 25,327
Total copper production and sales (tonnes) 86,118 84,220 80,366 78,887
Silver production and sales (ounces)
‐ Cadia Hill (stockpile) 13,111 10,917 187,452 187,452
‐ Ridgeway 325,901 315,346 224,028 224,028
‐ Cadia East 147,777 140,734 ‐ ‐
Cadia Valley 486,789 466,997 411,480 411,480
Telfer 327,740 327,740 283,026 283,026
Lihir 26,305 26,305 19,770 19,770
Gosowong 489,724 484,550 342,835 342,835
Hidden Valley 974,846 973,687 856,328 870,046
Bonikro 18,806 18,044 18,377 15,875
Total silver production and sales (ounces) 2,324,210 2,297,324 1,931,816 1,943,032
20 Production and sales for the twelve months ended 30 June 2014 includes 18,675 pre-commissioning and development gold ounces
and 1,770 tonnes of copper for the Cadia East project. Production and sales for the twelve months ended 30 June 2013 includes 22,695 pre-commissioning and development gold ounces and 1,879 tonnes of copper for the Cadia East project. Expenditure associated with this production and revenue from the sales are capitalised and not included in the operating profit calculations.
OPERATING AND FINANCIAL REVIEW
Newcrest Mining Limited – Annual Financial Report – Year Ended 30 June 2014 C 10
Cost of sales 2.4
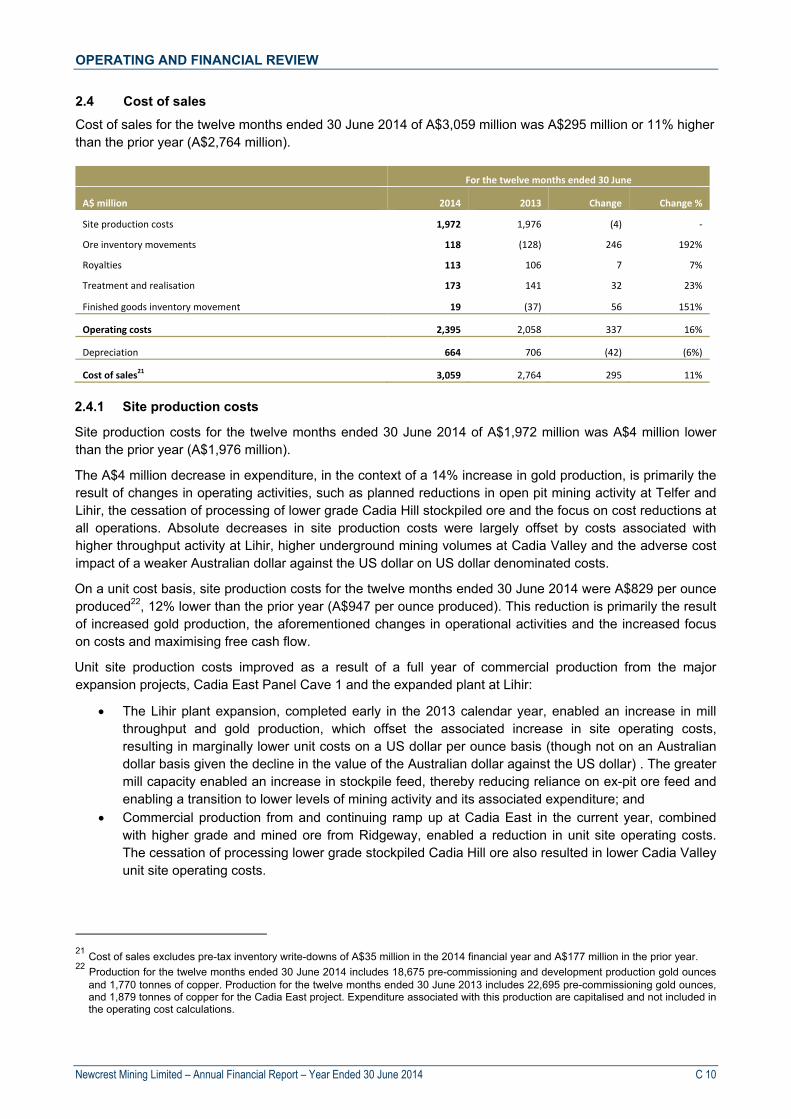
Cost of sales for the twelve months ended 30 June 2014 of A$3,059 million was A$295 million or 11% higher than the prior year (A$2,764 million).
For the twelve months ended 30 June
A$ million 2014 2013 Change Change %
Site production costs 1,972 1,976 (4) ‐
Ore inventory movements 118 (128) 246 192%
Royalties 113 106 7 7%
Treatment and realisation 173 141 32 23%
Finished goods inventory movement 19 (37) 56 151%
Operating costs 2,395 2,058 337 16%
Depreciation 664 706 (42) (6%)
Cost of sales21 3,059 2,764 295 11%
2.4.1 Site production costs
Site production costs for the twelve months ended 30 June 2014 of A$1,972 million was A$4 million lower than the prior year (A$1,976 million).
The A$4 million decrease in expenditure, in the context of a 14% increase in gold production, is primarily the result of changes in operating activities, such as planned reductions in open pit mining activity at Telfer and Lihir, the cessation of processing of lower grade Cadia Hill stockpiled ore and the focus on cost reductions at all operations. Absolute decreases in site production costs were largely offset by costs associated with higher throughput activity at Lihir, higher underground mining volumes at Cadia Valley and the adverse cost impact of a weaker Australian dollar against the US dollar on US dollar denominated costs.
On a unit cost basis, site production costs for the twelve months ended 30 June 2014 were A$829 per ounce produced22, 12% lower than the prior year (A$947 per ounce produced). This reduction is primarily the result of increased gold production, the aforementioned changes in operational activities and the increased focus on costs and maximising free cash flow.
Unit site production costs improved as a result of a full year of commercial production from the major expansion projects, Cadia East Panel Cave 1 and the expanded plant at Lihir:
The Lihir plant expansion, completed early in the 2013 calendar year, enabled an increase in mill throughput and gold production, which offset the associated increase in site operating costs, resulting in marginally lower unit costs on a US dollar per ounce basis (though not on an Australian dollar basis given the decline in the value of the Australian dollar against the US dollar) . The greater mill capacity enabled an increase in stockpile feed, thereby reducing reliance on ex-pit ore feed and enabling a transition to lower levels of mining activity and its associated expenditure; and
Commercial production from and continuing ramp up at Cadia East in the current year, combined with higher grade and mined ore from Ridgeway, enabled a reduction in unit site operating costs. The cessation of processing lower grade stockpiled Cadia Hill ore also resulted in lower Cadia Valley unit site operating costs.
21 Cost of sales excludes pre-tax inventory write-downs of A$35 million in the 2014 financial year and A$177 million in the prior year. 22 Production for the twelve months ended 30 June 2014 includes 18,675 pre-commissioning and development production gold ounces
and 1,770 tonnes of copper. Production for the twelve months ended 30 June 2013 includes 22,695 pre-commissioning gold ounces, and 1,879 tonnes of copper for the Cadia East project. Expenditure associated with this production are capitalised and not included in the operating cost calculations.

OPERATING AND FINANCIAL REVIEW
Newcrest Mining Limited – Annual Financial Report – Year Ended 30 June 2014 C 11
As noted above, the Australian dollar weakened relative to the US dollar in the current year to an average of $0.9187 compared with the prior year average of $1.0272. This depreciation had a negative impact of approximately A$30 million on translation of US dollar denominated site production costs.
Newcrest has focused on cost reduction at all operations. These cost reductions include transitioning to new contracts which have seen reductions in unit rates across both consumables and labour services, reductions in workforce numbers and reduced activity levels, and improved consumption rates for power, reagents and consumables.
Further information on Operations can be found in section 5.
2.4.2 Ore inventory
Total ore inventory movements for the twelve months ended 30 June 2014 was an A$118 million net expense, compared with a net credit to costs in the prior year (of A$128 million), reflecting a net consumption of ore stockpiles in the current period principally as a result of changes to mining and processing activities at Telfer, Lihir and Gosowong. In the current year there was a 24% reduction in ore mined and a 4% decrease in ore processed compared with the prior year.
The net consumption of ore inventory and resulting net expense of A$118 million in the current year was largely attributable to:
Lihir A$67 million – commissioning of the plant expansion and expanded flotation circuit has enabled a significant increase in stockpile ore processing capability, with the volume of ore treated being 45% higher in the current year (10.1 million tonnes compared with 6.9 million tonnes in the prior year). Combined with a 69% reduction in the level of ore mining activity in the current year, there was a higher drawdown from stockpiles in the current year of 9.8 million tonnes (compared with a net addition of 6.0 million tonnes in the prior year);
Telfer A$38 million – reflects the depletion of gold contained on dump leach pads during the current year; and
Gosowong A$13 million – completion of mining activity in the open pit in July 2013 resulted in a higher level of drawdown of stockpiled ore in the current year.
2.4.3 Royalty and treatment and realisation costs
Royalties expense was A$7 million or 7% higher in the current year, consistent with the higher sales revenue.
Treatment and realisation costs for the twelve months ended 30 June 2014 of A$173 million were A$32 million or 23% higher than the prior year (A$141 million), reflecting increased sales volumes and higher treatment and refining charges in the copper concentrate markets in the current year.
2.4.4 Depreciation
Depreciation expense included in cost of sales for the twelve months ended 30 June 2014 of A$664 million was A$42 million or 6% lower than the prior year (A$706 million).
The decrease in depreciation expense primarily reflects the impact of the impairment to the carrying value of Telfer assets in the year ended 30 June 2013, which significantly reduced Telfer’s depreciable asset base resulting in lower depreciation at Telfer in the current year (A$75 million compared with A$250 million in the prior year). This decrease in depreciation expense at Telfer was partially offset by a:
A$72 million increase at Lihir, primarily the result of completing the plant expansion in January 2013 resulting in a higher depreciable asset base combined with the increased mill throughput in the current year and the weakening of the Australian dollar against the US dollar;
A$19 million increase at Bonikro reflecting the amortisation of production stripping costs associated with a greater proportion of production sourced from Stage 4 of the open pit;

OPERATING AND FINANCIAL REVIEW
Newcrest Mining Limited – Annual Financial Report – Year Ended 30 June 2014 C 12
A$17 million increase at Cadia East as a result of a full year of production (following the commencement of commercial production, which is primarily depreciated on a units of use basis, on 1 January 2013); and
A$16 million increase at Ridgeway as a result of higher levels of production sourced from the Ridgeway underground mine.
Other costs 2.5
2.5.1 Corporate administration costs
Corporate administration costs for the twelve months ended 30 June 2014 of A$134 million were A$2 million or around 2% higher than the prior year (A$132 million). Corporate cash costs of A$96 million in the current year represents a reduction of A$6 million or 6% compared with the prior year. Newcrest achieved a reduction in recurring corporate costs through the closure of the Brisbane office (announced in June 2013), rationalisation of corporate office and support functions and associated reductions in headcount, and targeted cost reduction activities throughout the year. However, in the current year, these savings were largely offset by a A$7 million increase in corporate legal costs and an increase in employee incentive payments compared to the prior year where minimal short term incentives were paid to Executives. Corporate depreciation in the current year was A$7 million higher primarily as a result of completing the enterprise systems implementation.
2.5.2 Exploration expense
Exploration expense for the twelve months ended 30 June 2014 of A$36 million was A$28 million or 44% lower than the prior year (A$64 million).
Further information on Exploration can be found in section 3.
2.5.3 Other income/expenses
For the twelve months ended 30 June
A$ million 2014 2013
Net fair value gain/(loss) on gold and copper derivatives 10 (45)
Net foreign exchange gain/(loss) (11) 9
Legacy community contractual settlements and negotiation costs (10) (37)
Other (1) (9)
Other income/(expense) (12) (82)
Other income/(expense) for the twelve months ended 30 June 2014 was an expense of A$12 million, which was A$70 million lower than the prior year (A$82 million).
The fair value gain on gold and copper derivatives primarily relates to the movement in spot prices impacting the quotational period adjustments on sales. Newcrest seeks to lock in the gold and copper price for the quotational period for concentrate shipments at the time of sale using forward sales contracts to minimise this impact. The quotational period and fair value adjustments were favourable A$10 million for the current year.
Expenditure of A$10 million in the current year primarily relates to progression of negotiations with landowners of the commercial and community development agreements at Lihir.
OPERATING AND FINANCIAL REVIEW
Newcrest Mining Limited – Annual Financial Report – Year Ended 30 June 2014 C 13
2.5.4 Finance costs
Net finance costs of A$174 million for the twelve months ended 30 June 2014 were A$65 million higher than the prior year (A$109 million).
Gross finance costs for the current year of A$182 million were A$37 million higher than the prior year, primarily reflecting a higher level of average debt in the year and the impact of a lower AUD/USD exchange rate on US dollar denominated debt and interest expense.
Capitalised interest for the current year of A$7 million, associated with Cadia East Panel Cave 2, was A$28 million lower than the prior year, when interest costs of A$35 million on capital expenditure were capitalised prior to commencement of commercial production from Cadia East and completion of the Lihir plant expansion early in the 2013 calendar year.
Income tax expense and non-controlling interests 2.6
Income tax expense on Underlying profit for the 2014 financial year was A$192 million, resulting in an effective tax rate in-line with the Australian Company tax rate of 30%. In the prior year, income tax expense was A$158 million with an effective tax rate of 25%, with the difference primarily relating to tax concessions associated with exploration deductions in Papua New Guinea in the prior year.
Income tax benefit on Statutory profit in the current year was A$510 million, which included a A$120 million expense relating to Newcrest’s voluntary amendment of its Australian research and development claims with respect to the 2009 to 2011 financial years and a tax benefit of A$702 million relating to significant items. Income tax benefit on Statutory profit in the prior year was A$419 million, which included a tax benefit of $577 million primarily relating to asset impairments.
Non-controlling interests in Underlying profit of A$23 million, being the profit after tax attributable to the minority shareholders of Newcrest’s non-wholly owned subsidiaries, decreased from the prior year (A$32 million), reflecting lower profits from both Gosowong and Bonikro in the current year.
Non-controlling interests on Statutory profit was A$6 million, with the difference of A$17 million relating to the impairment of assets in West Africa.
OPERATING AND FINANCIAL REVIEW
Newcrest Mining Limited – Annual Financial Report – Year Ended 30 June 2014 C 14
Asset impairments, asset write downs and restructure costs 2.7
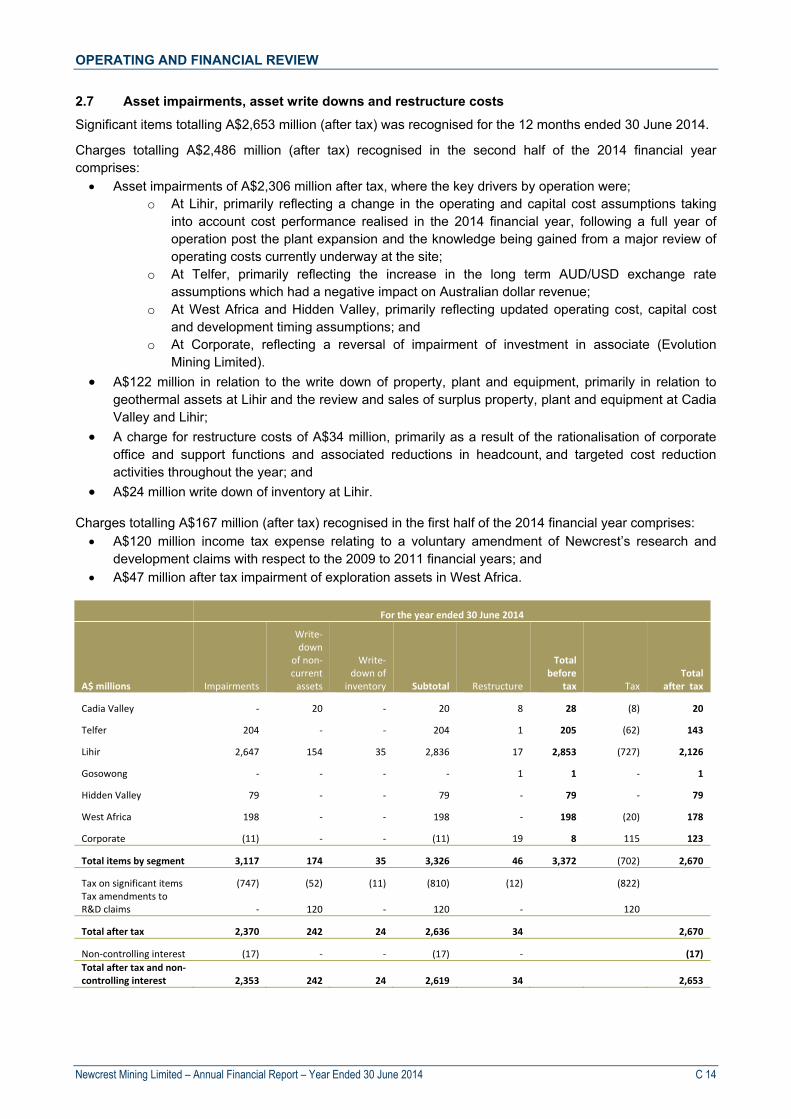
Significant items totalling A$2,653 million (after tax) was recognised for the 12 months ended 30 June 2014.
Charges totalling A$2,486 million (after tax) recognised in the second half of the 2014 financial year comprises: Asset impairments of A$2,306 million after tax, where the key drivers by operation were;
o At Lihir, primarily reflecting a change in the operating and capital cost assumptions taking into account cost performance realised in the 2014 financial year, following a full year of operation post the plant expansion and the knowledge being gained from a major review of operating costs currently underway at the site;
o At Telfer, primarily reflecting the increase in the long term AUD/USD exchange rate assumptions which had a negative impact on Australian dollar revenue;
o At West Africa and Hidden Valley, primarily reflecting updated operating cost, capital cost and development timing assumptions; and
o At Corporate, reflecting a reversal of impairment of investment in associate (Evolution Mining Limited).
A$122 million in relation to the write down of property, plant and equipment, primarily in relation to geothermal assets at Lihir and the review and sales of surplus property, plant and equipment at Cadia Valley and Lihir;
A charge for restructure costs of A$34 million, primarily as a result of the rationalisation of corporate office and support functions and associated reductions in headcount, and targeted cost reduction activities throughout the year; and
A$24 million write down of inventory at Lihir.
Charges totalling A$167 million (after tax) recognised in the first half of the 2014 financial year comprises: A$120 million income tax expense relating to a voluntary amendment of Newcrest’s research and
development claims with respect to the 2009 to 2011 financial years; and A$47 million after tax impairment of exploration assets in West Africa.
For the year ended 30 June 2014
A$ millions Impairments
Write‐down
of non‐current assets
Write‐down of
inventory Subtotal Restructure
Total before
tax Tax Total
after tax
Cadia Valley ‐ 20 ‐ 20 8 28 (8) 20
Telfer 204 ‐ ‐ 204 1 205 (62) 143
Lihir 2,647 154 35 2,836 17 2,853 (727) 2,126
Gosowong ‐ ‐ ‐ ‐ 1 1 ‐ 1
Hidden Valley 79 ‐ ‐ 79 ‐ 79 ‐ 79
West Africa 198 ‐ ‐ 198 ‐ 198 (20) 178
Corporate (11) ‐ ‐ (11) 19 8 115 123
Total items by segment 3,117 174 35 3,326 46 3,372 (702) 2,670
Tax on significant items (747) (52) (11) (810) (12) (822) Tax amendments to R&D claims ‐ 120 ‐ 120 ‐ 120
Total after tax 2,370 242 24 2,636 34 2,670
Non‐controlling interest (17) ‐ ‐ (17) ‐ (17)
Total after tax and non‐controlling interest 2,353 242 24 2,619 34 2,653

OPERATING AND FINANCIAL REVIEW
Newcrest Mining Limited – Annual Financial Report – Year Ended 30 June 2014 C 15
The following table provides a summary of significant items totalling A$6,229 million (after tax) for the prior year (12 months ended 30 June 2013).
For the year ended 30 June 2013
A$ millions Impairments
Write‐down
of non‐current assets
Write‐down of
inventory Subtotal Restructure
Total before
tax Tax Total
after tax
Telfer 1,674 19 106 1,799 17 1,816 (545) 1,271
Lihir 3,492 146 50 3,688 5 3,693 (60) 3,633
Hidden Valley 406 ‐ ‐ 406 ‐ 406 54 460
West Africa 575 1 21 597 1 598 (62) 536
Corporate 273 ‐ ‐ 273 49 322 36 358
Total items by segment 6,420 166 177 6,763 72 6,835 (577) 6,258
Tax on significant items (564) (50) (47) (661) (21) (682)
De‐recognition of deferred tax asset ‐ 105 ‐ 105 ‐ 105
Total after tax 5,856 221 130 6,207 51 6,258
Non‐controlling interest (27) ‐ (2) (29) ‐ (29)
Total after tax and non‐controlling interest 5,829 221 128 6,178 51 6,229

OPERATING AND FINANCIAL REVIEW
Newcrest Mining Limited – Annual Financial Report – Year Ended 30 June 2014 C 16
3 Review of Capital and Exploration
Investing activities 3.1
Investing activities for the twelve months ended 30 June 2014 represented a cash outflow of A$904 million, being A$1,660 million or 65% lower than the prior year (A$2,564 million). This reduction reflected changes in all categories of capital expenditure.
For the twelve months ended 30 June
A$ millions 2014 2013 Change Change %
Capital expenditure
‐ Production stripping 191 440 (249) (57%)
‐ Sustaining 298 572 (274) (48%)
‐ Major project (non‐sustaining) 354 1,374 (1,020) (74%)
Total capital expenditure 843 2,386 (1,543) (65%)
Exploration 62 152 (90) (59%)
Proceeds from sale of plant and equipment (8) ‐ (8)
Proceeds from sale of investments ‐ (9) 9 100%
Interest capitalised 7 35 (28) (80%)
Total cash outflow from investing activities 904 2,564 (1,660) (65%)
3.1.1 Capital expenditure
Capital expenditure for the twelve months ended 30 June 2014 was A$843 million, A$1,543 million or 65% lower than the prior year (A$2,386 million).
The reduction in capital expenditure primarily reflects commencement of commercial production at Cadia East and completion of the Lihir plant expansion which were still being progressed in the prior year, the completion of major production stripping activity at Telfer and Bonikro, and lower sustaining capital expenditure in the current year.
3.1.2 Production stripping
For the twelve months ended 30 June
A$ million 2014 2013 Change Change %
Telfer 24 196 (172) (88%)
Cadia Valley ‐ ‐ ‐ ‐
Lihir 145 134 11 8%
Gosowong ‐ 16 (16) (100%)
Bonikro 9 62 (53) (85%)
Hidden Valley 13 32 (19) (59%)
Total production stripping 191 440 (249) (57%)
Production stripping for the twelve months ended 30 June 2014 was A$191 million, A$249 million lower than the prior year (A$440 million).
The reduction was primarily due to the completion of major stripping activities at Telfer (Main Dome Stage 4 and Stage 6) and Bonikro (Stage 4) which were largely completed in the prior year, partly offset by increased activity at Lihir with stripping of Minifie Stage 9 taking place in the current year.
OPERATING AND FINANCIAL REVIEW
Newcrest Mining Limited – Annual Financial Report – Year Ended 30 June 2014 C 17
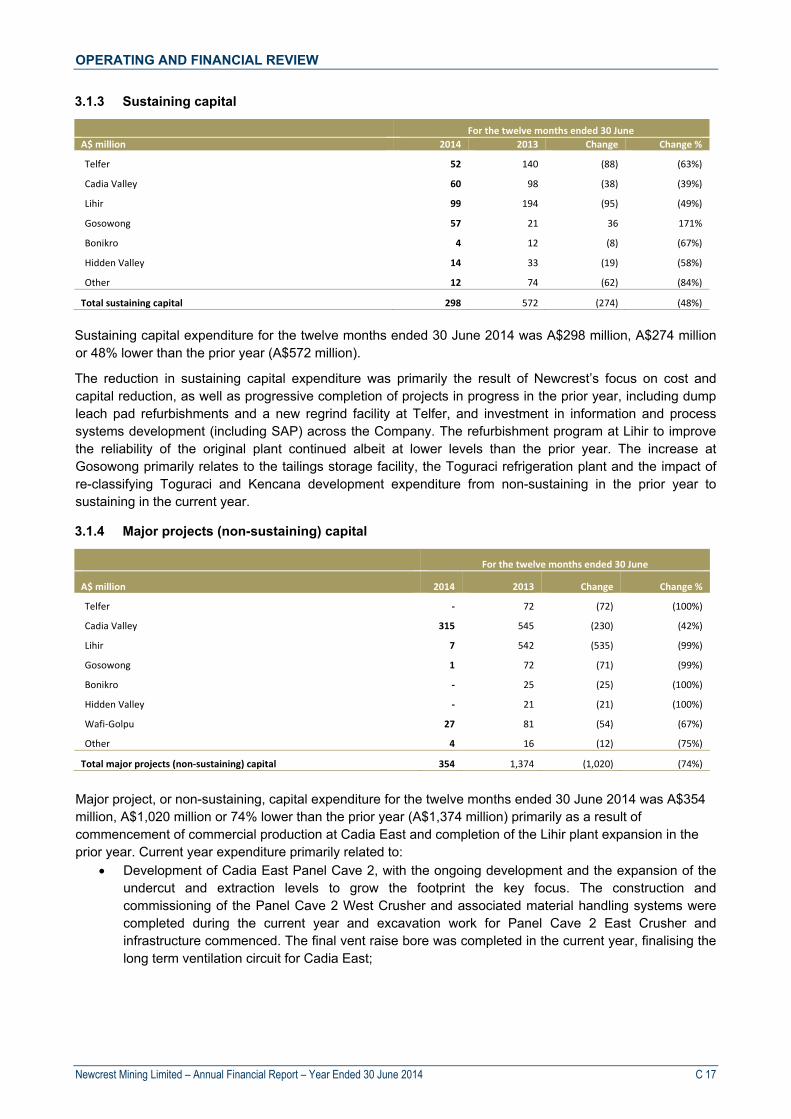
3.1.3 Sustaining capital
For the twelve months ended 30 June
A$ million 2014 2013 Change Change %
Telfer 52 140 (88) (63%)
Cadia Valley 60 98 (38) (39%)
Lihir 99 194 (95) (49%)
Gosowong 57 21 36 171%
Bonikro 4 12 (8) (67%)
Hidden Valley 14 33 (19) (58%)
Other 12 74 (62) (84%)
Total sustaining capital 298 572 (274) (48%)
Sustaining capital expenditure for the twelve months ended 30 June 2014 was A$298 million, A$274 million or 48% lower than the prior year (A$572 million).
The reduction in sustaining capital expenditure was primarily the result of Newcrest’s focus on cost and capital reduction, as well as progressive completion of projects in progress in the prior year, including dump leach pad refurbishments and a new regrind facility at Telfer, and investment in information and process systems development (including SAP) across the Company. The refurbishment program at Lihir to improve the reliability of the original plant continued albeit at lower levels than the prior year. The increase at Gosowong primarily relates to the tailings storage facility, the Toguraci refrigeration plant and the impact of re-classifying Toguraci and Kencana development expenditure from non-sustaining in the prior year to sustaining in the current year.
3.1.4 Major projects (non-sustaining) capital
For the twelve months ended 30 June
A$ million 2014 2013 Change Change %
Telfer ‐ 72 (72) (100%)
Cadia Valley 315 545 (230) (42%)
Lihir 7 542 (535) (99%)
Gosowong 1 72 (71) (99%)
Bonikro ‐ 25 (25) (100%)
Hidden Valley ‐ 21 (21) (100%)
Wafi‐Golpu 27 81 (54) (67%)
Other 4 16 (12) (75%)
Total major projects (non‐sustaining) capital 354 1,374 (1,020) (74%)
Major project, or non-sustaining, capital expenditure for the twelve months ended 30 June 2014 was A$354 million, A$1,020 million or 74% lower than the prior year (A$1,374 million) primarily as a result of commencement of commercial production at Cadia East and completion of the Lihir plant expansion in the prior year. Current year expenditure primarily related to:
Development of Cadia East Panel Cave 2, with the ongoing development and the expansion of the undercut and extraction levels to grow the footprint the key focus. The construction and commissioning of the Panel Cave 2 West Crusher and associated material handling systems were completed during the current year and excavation work for Panel Cave 2 East Crusher and infrastructure commenced. The final vent raise bore was completed in the current year, finalising the long term ventilation circuit for Cadia East;
OPERATING AND FINANCIAL REVIEW
Newcrest Mining Limited – Annual Financial Report – Year Ended 30 June 2014 C 18
Optimising the pre-feasibility study for the Wafi-Golpu project, including consideration of an upper mine development with lower establishment capital prior to development of a lower, block cave mine; and
Commissioning activities for the flotation circuit expansion project at Lihir early in the current year.
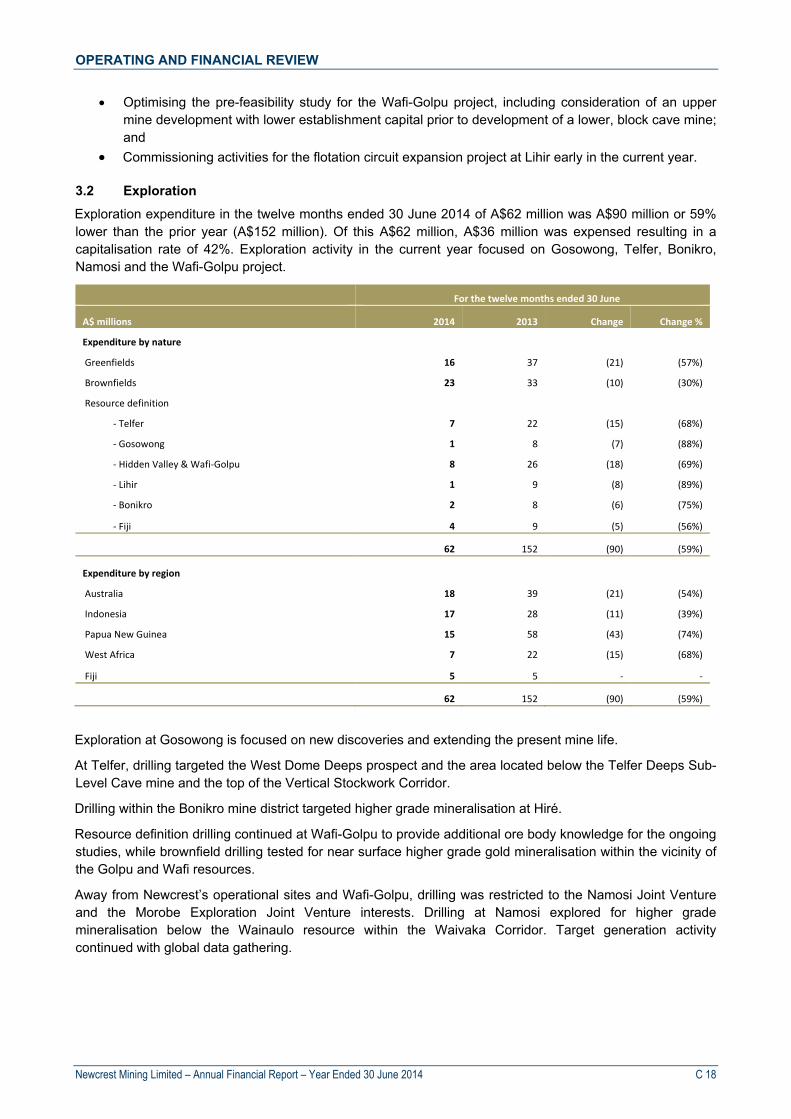
Exploration 3.2
Exploration expenditure in the twelve months ended 30 June 2014 of A$62 million was A$90 million or 59% lower than the prior year (A$152 million). Of this A$62 million, A$36 million was expensed resulting in a capitalisation rate of 42%. Exploration activity in the current year focused on Gosowong, Telfer, Bonikro, Namosi and the Wafi-Golpu project.
For the twelve months ended 30 June
A$ millions 2014 2013 Change Change %
Expenditure by nature
Greenfields 16 37 (21) (57%)
Brownfields 23 33 (10) (30%)
Resource definition
‐ Telfer 7 22 (15) (68%)
‐ Gosowong 1 8 (7) (88%)
‐ Hidden Valley & Wafi‐Golpu 8 26 (18) (69%)
‐ Lihir 1 9 (8) (89%)
‐ Bonikro 2 8 (6) (75%)
‐ Fiji 4 9 (5) (56%)
62 152 (90) (59%)
Expenditure by region
Australia 18 39 (21) (54%)
Indonesia 17 28 (11) (39%)
Papua New Guinea 15 58 (43) (74%)
West Africa 7 22 (15) (68%)
Fiji 5 5 ‐ ‐
62 152 (90) (59%)
Exploration at Gosowong is focused on new discoveries and extending the present mine life.
At Telfer, drilling targeted the West Dome Deeps prospect and the area located below the Telfer Deeps Sub-Level Cave mine and the top of the Vertical Stockwork Corridor.
Drilling within the Bonikro mine district targeted higher grade mineralisation at Hiré.
Resource definition drilling continued at Wafi-Golpu to provide additional ore body knowledge for the ongoing studies, while brownfield drilling tested for near surface higher grade gold mineralisation within the vicinity of the Golpu and Wafi resources.
Away from Newcrest’s operational sites and Wafi-Golpu, drilling was restricted to the Namosi Joint Venture and the Morobe Exploration Joint Venture interests. Drilling at Namosi explored for higher grade mineralisation below the Wainaulo resource within the Waivaka Corridor. Target generation activity continued with global data gathering.
OPERATING AND FINANCIAL REVIEW
Newcrest Mining Limited – Annual Financial Report – Year Ended 30 June 2014 C 19
Other investing activities 3.3
Other investing activities, which include proceeds from sale of investments and interest capitalised, for the twelve months ended 30 June 2014 was a net inflow of A$1 million, A$27 million lower than the prior year (A$26 million outflow). This is primarily the result of higher capitalised interest in the prior year before the commencement of commercial production at Cadia East and completion of the Lihir plant expansion.
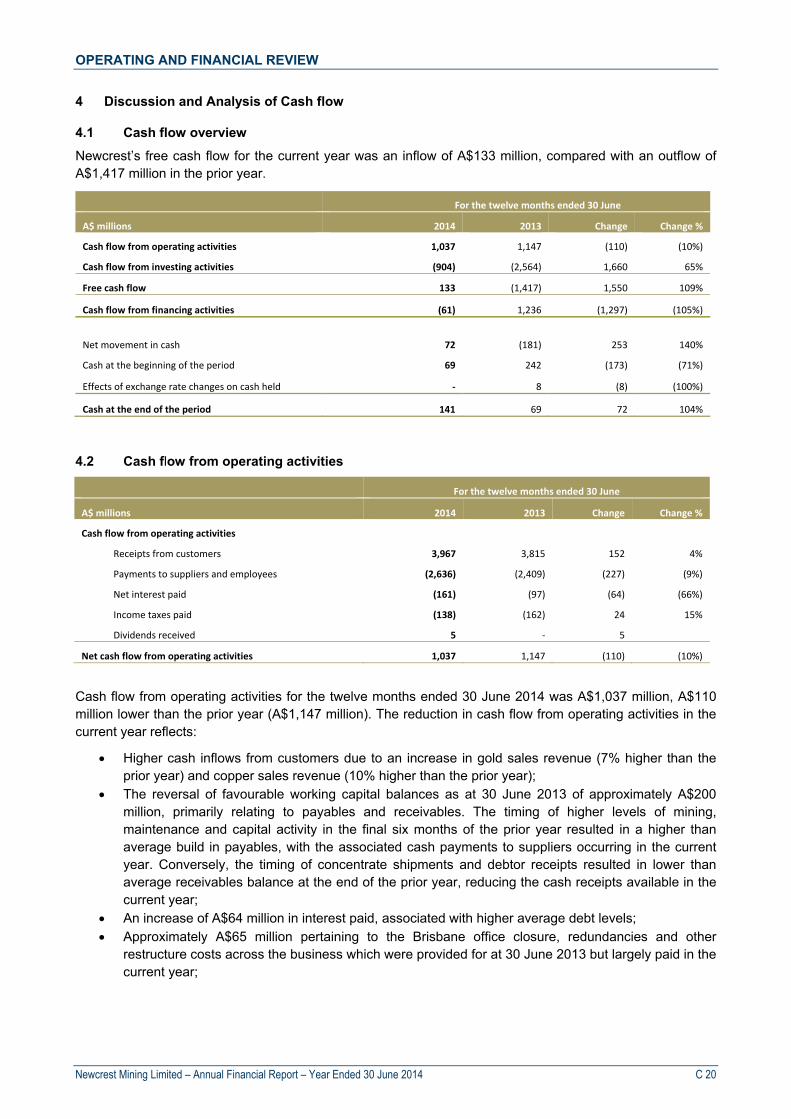
OPERATING AND FINANCIAL REVIEW
Newcrest Mining Limited – Annual Financial Report – Year Ended 30 June 2014 C 20
4 Discussion and Analysis of Cash flow
Cash flow overview 4.1
Newcrest’s free cash flow for the current year was an inflow of A$133 million, compared with an outflow of A$1,417 million in the prior year.
For the twelve months ended 30 June
A$ millions 2014 2013 Change Change %
Cash flow from operating activities 1,037 1,147 (110) (10%)
Cash flow from investing activities (904) (2,564) 1,660 65%
Free cash flow 133 (1,417) 1,550 109%
Cash flow from financing activities (61) 1,236 (1,297) (105%)
Net movement in cash 72 (181) 253 140%
Cash at the beginning of the period 69 242 (173) (71%)
Effects of exchange rate changes on cash held ‐ 8 (8) (100%)
Cash at the end of the period 141 69 72 104%
Cash flow from operating activities 4.2
For the twelve months ended 30 June
A$ millions 2014 2013 Change Change %
Cash flow from operating activities
Receipts from customers 3,967 3,815 152 4%
Payments to suppliers and employees (2,636) (2,409) (227) (9%)
Net interest paid (161) (97) (64) (66%)
Income taxes paid (138) (162) 24 15%
Dividends received 5 ‐ 5
Net cash flow from operating activities 1,037 1,147 (110) (10%)
Cash flow from operating activities for the twelve months ended 30 June 2014 was A$1,037 million, A$110 million lower than the prior year (A$1,147 million). The reduction in cash flow from operating activities in the current year reflects:
Higher cash inflows from customers due to an increase in gold sales revenue (7% higher than the prior year) and copper sales revenue (10% higher than the prior year);
The reversal of favourable working capital balances as at 30 June 2013 of approximately A$200 million, primarily relating to payables and receivables. The timing of higher levels of mining, maintenance and capital activity in the final six months of the prior year resulted in a higher than average build in payables, with the associated cash payments to suppliers occurring in the current year. Conversely, the timing of concentrate shipments and debtor receipts resulted in lower than average receivables balance at the end of the prior year, reducing the cash receipts available in the current year;
An increase of A$64 million in interest paid, associated with higher average debt levels; Approximately A$65 million pertaining to the Brisbane office closure, redundancies and other
restructure costs across the business which were provided for at 30 June 2013 but largely paid in the current year;

OPERATING AND FINANCIAL REVIEW
Newcrest Mining Limited – Annual Financial Report – Year Ended 30 June 2014 C 21
A reduction in income taxes paid of A$24 million in the current year compared with the prior year, reflecting lower levels of taxable income on underlying earnings in the current year, largely offset by a tax payment of approximately A$70 million as a result of the Company’s voluntary amendment in the current year of its Australian research and development claims with respect to the 2009 to 2011 financial years; and
A$5 million dividends received from Evolution Mining Limited
Cash flow from investing activities 4.3
Cash flow from investing activities for the twelve months ended 30 June 2014 was an outflow of A$904 million, A$1,660 million lower than the prior year cash outflow (A$2,564 million). The reduction is a result of lower levels of expenditure in all investing categories - major project (non-sustaining), sustaining, production stripping and exploration expenditure - in the current year compared with the prior year.
Refer to section 3 for an explanation of capital and exploration expenditures.
Cash flow from financing activities 4.4
Cash flow from financing activities for the twelve months ended 30 June 2014 was an outflow of A$61 million, compared with a cash inflow in the prior year of A$1,236 million.
For the twelve months ended 30 June
A$ million 2014 2013 Change Change %
Cash flow from financing activities
Proceeds from borrowing: 2,038 3,002 (964) (32%)
‐ US dollar bilateral loan facilities 2,038 2,054 (16) (1%)
‐ US dollar senior unsecured notes ‐ 948 (948) (100%)
Repayment of borrowings: (2,076) (1,623) (453) (28%)
Net payment of finance lease principal (1) (3) 2 67%
Payment for treasury shares (6) (1) (5) (500%) Partial sale of subsidiary to non‐controlling interest, net of withholding tax ‐ 117 (117) (100%)
Dividend Paid – to members of the parent entity ‐ (230) 230 100%
Dividend Paid – to non‐controlling interests (16) (26) 10 38%
Net cash from financing activities (61) 1,236 (1,297) (105%)
Key financing activities during the current year were: A net repayment of A$38 million on US dollar bilateral bank loan facilities. Utilised facilities at 30
June 2014 were US$1,630 million (A$1,730 million) compared with US$1,675 million (A$1,806 million) at 30 June 2013;
A$6 million in shares purchased by the Newcrest Employee Share Trust on behalf of the Company to satisfy future share rights and awards as they vest;
No dividends were paid in the current year, consistent with the Company’s dividend policy - with dividend levels set with regard to profitability, balance sheet strength, and reinvestment options in the business; and
A$16 million represents dividends paid to PT Antam (which holds a 25% non-controlling interest in PT Nusa Halmahera Minerals, the entity that owns the Gosowong asset).

OPERATING AND FINANCIAL REVIEW
Newcrest Mining Limited – Annual Financial Report – Year Ended 30 June 2014 C 22
5 Review of Operations
Cadia Valley 5.1
For the twelve months ended 30 June
Measure 2014 2013 Change Change %
Operating
Total material mined tonnes 000’s 16,893 11,344 5,549 49%
Total material treated tonnes 000’s 20,024 25,478 (5,454) (21%)
Gold head grade grams/tonne 1.12 0.71 0.41 58%
Gold recovery % 81.9 76.3 5.6 7%
Gold produced ounces 592,831 446,879 145,952 33%
Copper produced tonnes 60,612 53,913 6,699 12%
Silver produced ounces 486,789 411,480 75,309 18%
Gold sales ounces 573,605 450,448 123,157 27%
Copper sales tonnes 58,963 53,560 5,403 10%
Silver sales ounces 466,997 411,480 55,517 13%
Financial
Revenue A$ million 1,233 1,058 175 17%
Depreciation A$ million 174 134 40 30%
Cost of Sales A$ million 742 700 42 6%
Operating EBIT A$ million 491 358 133 37%
All‐In Sustaining Cost A$ million 181 264 (83) (31%)
All‐In Sustaining Cost A$/ounce sold 326 618 (292) (47%)
Cadia Valley gold production and sales23 for the twelve months ended 30 June 2014 was 592,831 ounces
and 573,605 ounces respectively, which was 33% and 27% higher than the prior year.
Increased material mined was primarily the result of the continued ramp up in ore mined from Cadia East Panel Cave 1 following commencement of commercial production on 1 January 2013, together with increased ore production and feed from Ridgeway. Processing of lower grade, lower margin stockpiled ore ceased in the current year, resulting in an overall reduction in total material treated. This change in feed mix resulted in higher average feed grades for both gold and copper which resulted in higher overall recoveries for both gold and copper and the increase in gold and copper production in the current year.
Revenue for the twelve months ended June 30 2014 of A$1,233 million was A$175 million or 17% higher than the prior year (A$1,058 million).
Revenue from gold sales was 18% higher than the prior year, driven by a 27% increase in sales volumes partially offset by a 9% reduction in the realised gold price.
Revenue from copper sales was 16% higher than the prior year due to 10% higher sales volumes and a 2% higher realised copper price.
23
Production and sales for the twelve months ended 30 June 2014 includes 18,675 pre-commissioning and development gold ounces and 1,770 tonnes of copper for the Cadia East project. Production and sales for the twelve months ended 30 June 2013 includes 22,695 pre-commissioning gold ounces and 1,879 tonnes of copper for the Cadia East project. Expenditure associated with this production and revenue from the sales are capitalised and not included in the operating profit calculations.

OPERATING AND FINANCIAL REVIEW
Newcrest Mining Limited – Annual Financial Report – Year Ended 30 June 2014 C 23
Cost of Sales for the twelve months ended June 30 2014 of A$742 million was A$42 million or 6% higher than the prior year (A$700 million). This increase was driven by higher sales volumes being 27% higher in the current year partially offset by a lower unit cost of sales. The unit cost reduction exceeded the decrease in the realised gold price per ounce to deliver a higher EBIT margin. The lower unit costs was a result of higher gold production in the current year from increased grade and recoveries associated with the increase ore sourced from Cadia East and Ridgeway and the cessation of processing Cadia Hill stockpiles, and improvement and optimisation projects across the operation.
Depreciation expense for the twelve months ended 30 June 2014 of A$174 million was A$40 million or 30% higher than the prior year (A$134 million), primarily the result of the higher production from Ridgeway and the commencement of commercial production from Cadia East Panel Cave 1 on 1 January 2013.
All-In Sustaining Cost24 per ounce sold for the twelve months ended June 30 2014 of A$326 per ounce was A$292 per ounce or 47% lower than the prior year (A$618 per ounce). The reduction in unit cost was primarily the result of the cessation of processing of low grade stockpiled ore, higher grades and lower cost of ore from both Ridgeway and Cadia East Panel Cave 1, and lower sustaining capital in the current year, partially offset by a reduction in copper credits on a per ounce basis.
Telfer 5.2
For the twelve months ended 30 June
Measure 2014 2013 Change Change %
Operating
Total material mined tonnes 000’s 37,723 91,288 (53,565) (59%)
Total material treated tonnes 000’s 21,294 21,543 (249) (1%)
Gold head grade grams/tonne 0.90 1.00 (0.10) (10%)
Gold recovery % 81.2 71.7 9.5 13%
Gold produced ounces 536,342 525,500 10,842 2%
Copper produced tonnes 25,506 26,453 (947) (4%)
Silver produced ounces 327,740 283,026 44,714 16%
Gold sales ounces 539,672 508,976 30,696 6%
Copper sales tonnes 25,257 25,327 (70) ‐
Silver sales ounces 327,740 283,026 44,714 16%
Financial
Revenue A$ million 950 983 (33) (3%)
Depreciation A$ million 75 250 (175) (70%)
Cost of Sales A$ million 722 946 (224) (24%)
Operating EBIT A$ million 228 37 191 516%
All‐In Sustaining Cost A$ million 542 867 (325) (37%)
All‐In Sustaining Cost A$/ounce sold 1,005 1,704 (699) (41%)
Telfer gold production and sales for the twelve months ended 30 June 2014 was 536,342 ounces and 539,672 ounces respectively, 2% and 6% higher than the prior year.
24 All-In Sustaining Cost metrics as per World Gold Council Guidance Note on Non-GAAP Metrics, released 27 June 2013.

OPERATING AND FINANCIAL REVIEW
Newcrest Mining Limited – Annual Financial Report – Year Ended 30 June 2014 C 24
Increased gold production was primarily the result of higher recoveries due to lower levels of high sulphur ore sourced from West Dome and continuous improvement initiatives delivered in the current year, partly offset by lower feed grades. Lower feed grade was primarily the result of an increase in stockpile feed compared with the prior year due to the planned reduction in open pit operations, and a disruption to the underground hoisting system in the first half of the 2014 financial year.
Revenue for the twelve months ended 30 June 2014 of A$950 million was A$33 million or 3% lower than the prior year (A$983 million). Revenue from gold sales was A$33 million lower than the prior year, with a reduction in the realised gold price largely being offset by the increase in gold sales volumes. Revenue from copper sales was A$2 million higher than the prior year and primarily the result of the higher realised copper price partially offset by lower copper sales volumes.
Cost of sales for the twelve months ended 30 June 2014 of A$722 million was A$224 million or 24% lower than the prior year (A$946 million). The reduction is primarily the result of cost reductions implemented in the current year and a lower depreciation charge.
Depreciation expense for the twelve months ended 30 June 2014 of A$75 million was A$175 million or 70% lower than the prior year (A$250 million), primarily as a result of the impairment of Telfer assets as at 30 June 2013, offset by the commencement in the current year of depreciation of the production stripping asset (Stage 4).
All-In Sustaining Cost25 per ounce sold for the twelve months ended 30 June 2014 of A$1,005 per ounce was A$699 per ounce or 41% lower than the prior year (A$1,704 per ounce). The reduction is primarily the result of lower sustaining capital expenditure and lower unit site operating costs. The reduction of sustaining capital spend reflects the finalisation of Main Dome Stage 4 waste stripping and the focus on free cash flow generation, with non-essential capital spend deferred where appropriate. Lower unit site operating costs are primarily the result of the completion of mining in West Dome Stage 1 in the first quarter of the 2014 financial year, productivity improvements and cost reductions across the site.
25 All-In Sustaining Cost metrics as per World Gold Council Guidance Note on Non-GAAP Metrics, released 27 June 2013.
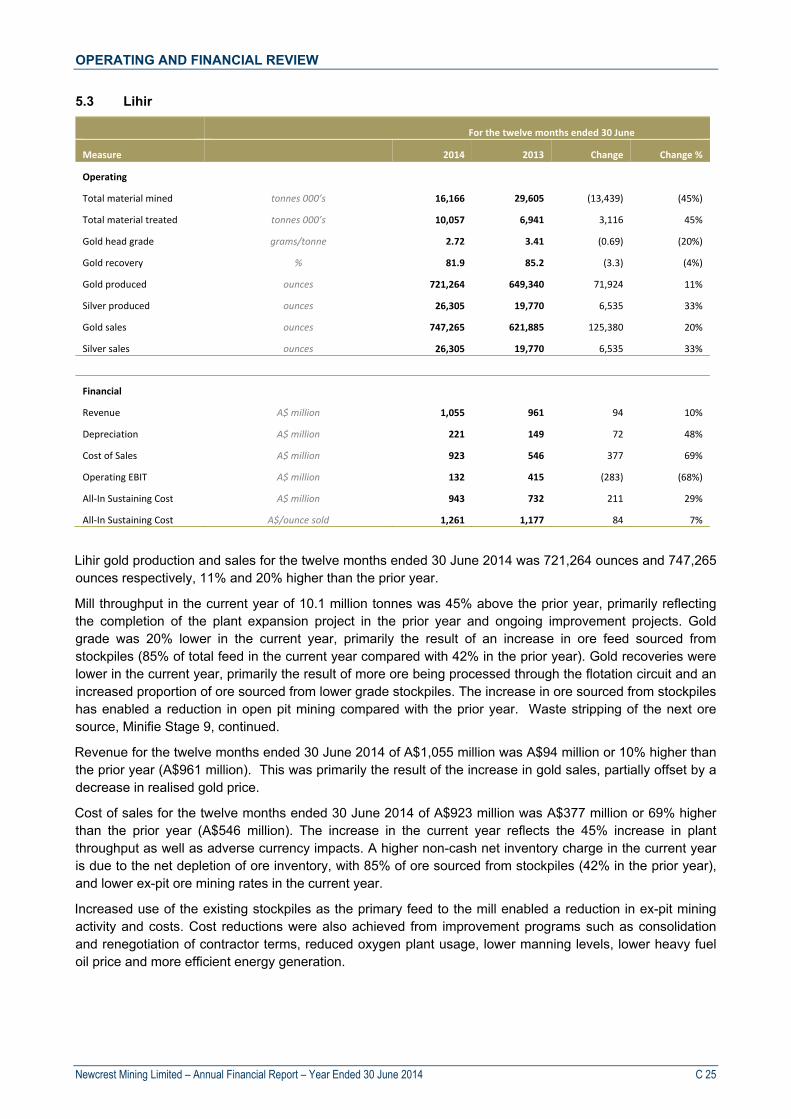
OPERATING AND FINANCIAL REVIEW
Newcrest Mining Limited – Annual Financial Report – Year Ended 30 June 2014 C 25
Lihir 5.3
For the twelve months ended 30 June
Measure 2014 2013 Change Change %
Operating
Total material mined tonnes 000’s 16,166 29,605 (13,439) (45%)
Total material treated tonnes 000’s 10,057 6,941 3,116 45%
Gold head grade grams/tonne 2.72 3.41 (0.69) (20%)
Gold recovery % 81.9 85.2 (3.3) (4%)
Gold produced ounces 721,264 649,340 71,924 11%
Silver produced ounces 26,305 19,770 6,535 33%
Gold sales ounces 747,265 621,885 125,380 20%
Silver sales ounces 26,305 19,770 6,535 33%
Financial
Revenue A$ million 1,055 961 94 10%
Depreciation A$ million 221 149 72 48%
Cost of Sales A$ million 923 546 377 69%
Operating EBIT A$ million 132 415 (283) (68%)
All‐In Sustaining Cost A$ million 943 732 211 29%
All‐In Sustaining Cost A$/ounce sold 1,261 1,177 84 7%
Lihir gold production and sales for the twelve months ended 30 June 2014 was 721,264 ounces and 747,265 ounces respectively, 11% and 20% higher than the prior year.
Mill throughput in the current year of 10.1 million tonnes was 45% above the prior year, primarily reflecting the completion of the plant expansion project in the prior year and ongoing improvement projects. Gold grade was 20% lower in the current year, primarily the result of an increase in ore feed sourced from stockpiles (85% of total feed in the current year compared with 42% in the prior year). Gold recoveries were lower in the current year, primarily the result of more ore being processed through the flotation circuit and an increased proportion of ore sourced from lower grade stockpiles. The increase in ore sourced from stockpiles has enabled a reduction in open pit mining compared with the prior year. Waste stripping of the next ore source, Minifie Stage 9, continued.
Revenue for the twelve months ended 30 June 2014 of A$1,055 million was A$94 million or 10% higher than the prior year (A$961 million). This was primarily the result of the increase in gold sales, partially offset by a decrease in realised gold price.
Cost of sales for the twelve months ended 30 June 2014 of A$923 million was A$377 million or 69% higher than the prior year (A$546 million). The increase in the current year reflects the 45% increase in plant throughput as well as adverse currency impacts. A higher non-cash net inventory charge in the current year is due to the net depletion of ore inventory, with 85% of ore sourced from stockpiles (42% in the prior year), and lower ex-pit ore mining rates in the current year.
Increased use of the existing stockpiles as the primary feed to the mill enabled a reduction in ex-pit mining activity and costs. Cost reductions were also achieved from improvement programs such as consolidation and renegotiation of contractor terms, reduced oxygen plant usage, lower manning levels, lower heavy fuel oil price and more efficient energy generation.
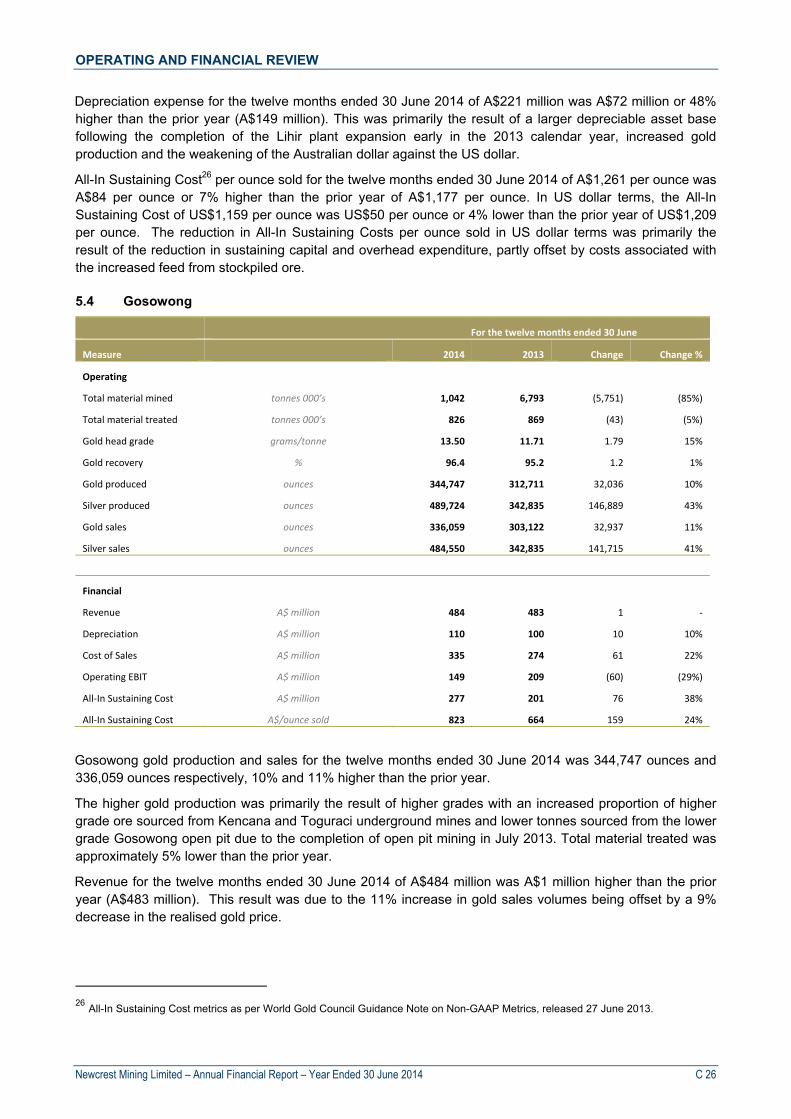
OPERATING AND FINANCIAL REVIEW
Newcrest Mining Limited – Annual Financial Report – Year Ended 30 June 2014 C 26
Depreciation expense for the twelve months ended 30 June 2014 of A$221 million was A$72 million or 48% higher than the prior year (A$149 million). This was primarily the result of a larger depreciable asset base following the completion of the Lihir plant expansion early in the 2013 calendar year, increased gold production and the weakening of the Australian dollar against the US dollar.
All-In Sustaining Cost26 per ounce sold for the twelve months ended 30 June 2014 of A$1,261 per ounce was A$84 per ounce or 7% higher than the prior year of A$1,177 per ounce. In US dollar terms, the All-In Sustaining Cost of US$1,159 per ounce was US$50 per ounce or 4% lower than the prior year of US$1,209 per ounce. The reduction in All-In Sustaining Costs per ounce sold in US dollar terms was primarily the result of the reduction in sustaining capital and overhead expenditure, partly offset by costs associated with the increased feed from stockpiled ore.
Gosowong 5.4
For the twelve months ended 30 June
Measure 2014 2013 Change Change %
Operating
Total material mined tonnes 000’s 1,042 6,793 (5,751) (85%)
Total material treated tonnes 000’s 826 869 (43) (5%)
Gold head grade grams/tonne 13.50 11.71 1.79 15%
Gold recovery % 96.4 95.2 1.2 1%
Gold produced ounces 344,747 312,711 32,036 10%
Silver produced ounces 489,724 342,835 146,889 43%
Gold sales ounces 336,059 303,122 32,937 11%
Silver sales ounces 484,550 342,835 141,715 41%
Financial
Revenue A$ million 484 483 1 ‐
Depreciation A$ million 110 100 10 10%
Cost of Sales A$ million 335 274 61 22%
Operating EBIT A$ million 149 209 (60) (29%)
All‐In Sustaining Cost A$ million 277 201 76 38%
All‐In Sustaining Cost A$/ounce sold 823 664 159 24%
Gosowong gold production and sales for the twelve months ended 30 June 2014 was 344,747 ounces and 336,059 ounces respectively, 10% and 11% higher than the prior year.
The higher gold production was primarily the result of higher grades with an increased proportion of higher grade ore sourced from Kencana and Toguraci underground mines and lower tonnes sourced from the lower grade Gosowong open pit due to the completion of open pit mining in July 2013. Total material treated was approximately 5% lower than the prior year.
Revenue for the twelve months ended 30 June 2014 of A$484 million was A$1 million higher than the prior year (A$483 million). This result was due to the 11% increase in gold sales volumes being offset by a 9% decrease in the realised gold price.
26 All-In Sustaining Cost metrics as per World Gold Council Guidance Note on Non-GAAP Metrics, released 27 June 2013.
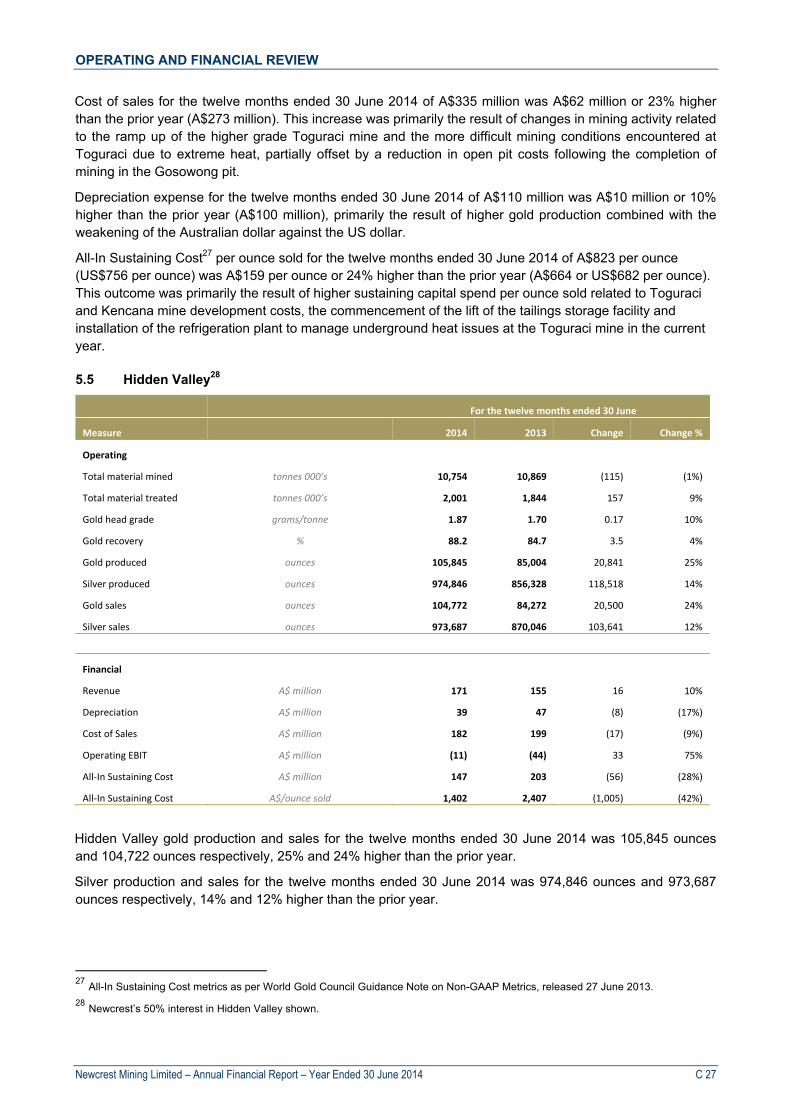
OPERATING AND FINANCIAL REVIEW
Newcrest Mining Limited – Annual Financial Report – Year Ended 30 June 2014 C 27
Cost of sales for the twelve months ended 30 June 2014 of A$335 million was A$62 million or 23% higher than the prior year (A$273 million). This increase was primarily the result of changes in mining activity related to the ramp up of the higher grade Toguraci mine and the more difficult mining conditions encountered at Toguraci due to extreme heat, partially offset by a reduction in open pit costs following the completion of mining in the Gosowong pit.
Depreciation expense for the twelve months ended 30 June 2014 of A$110 million was A$10 million or 10% higher than the prior year (A$100 million), primarily the result of higher gold production combined with the weakening of the Australian dollar against the US dollar.
All-In Sustaining Cost27 per ounce sold for the twelve months ended 30 June 2014 of A$823 per ounce (US$756 per ounce) was A$159 per ounce or 24% higher than the prior year (A$664 or US$682 per ounce). This outcome was primarily the result of higher sustaining capital spend per ounce sold related to Toguraci and Kencana mine development costs, the commencement of the lift of the tailings storage facility and installation of the refrigeration plant to manage underground heat issues at the Toguraci mine in the current year.
Hidden Valley28 5.5
For the twelve months ended 30 June
Measure 2014 2013 Change Change %
Operating
Total material mined tonnes 000’s 10,754 10,869 (115) (1%)
Total material treated tonnes 000’s 2,001 1,844 157 9%
Gold head grade grams/tonne 1.87 1.70 0.17 10%
Gold recovery % 88.2 84.7 3.5 4%
Gold produced ounces 105,845 85,004 20,841 25%
Silver produced ounces 974,846 856,328 118,518 14%
Gold sales ounces 104,772 84,272 20,500 24%
Silver sales ounces 973,687 870,046 103,641 12%
Financial
Revenue A$ million 171 155 16 10%
Depreciation A$ million 39 47 (8) (17%)
Cost of Sales A$ million 182 199 (17) (9%)
Operating EBIT A$ million (11) (44) 33 75%
All‐In Sustaining Cost A$ million 147 203 (56) (28%)
All‐In Sustaining Cost A$/ounce sold 1,402 2,407 (1,005) (42%)
Hidden Valley gold production and sales for the twelve months ended 30 June 2014 was 105,845 ounces and 104,722 ounces respectively, 25% and 24% higher than the prior year.
Silver production and sales for the twelve months ended 30 June 2014 was 974,846 ounces and 973,687 ounces respectively, 14% and 12% higher than the prior year.
27 All-In Sustaining Cost metrics as per World Gold Council Guidance Note on Non-GAAP Metrics, released 27 June 2013. 28 Newcrest’s 50% interest in Hidden Valley shown.
OPERATING AND FINANCIAL REVIEW
Newcrest Mining Limited – Annual Financial Report – Year Ended 30 June 2014 C 28
Increased gold production was primarily the result of higher throughput and gold grade. The increase in mill throughput primarily reflects improved reliability during the current year. Increased gold grade was primarily the result of access to higher grade ore from Hidden Valley Stage 3.
Increased silver production was primarily the result of increased silver recovery, partially offset by reduced silver grade. Higher silver recoveries primarily reflect the benefit from commissioning of the oxygen plant in the current year. Lower silver grade reflects milling a higher proportion of milled tonnes from Hamata open pit in the current year, which contains minimal silver reserves.
Revenue for the twelve months ended 30 June 2014 of A$171 million was A$16 million or 10% higher than the prior year (A$155 million). The increase in sales volumes for both gold and silver were partially offset by lower realised prices in the current year.
Cost of sales for the twelve months ended 30 June 2014 of A$182 million was A$18 million or 9% lower than the prior year (A$200 million). The current year benefited from a full year of operating the ore crusher at the head of the overland conveyor (“OLC”), resulting in increased availability and improved performance of the OLC system and a reduction in the proportion of tonnes being hauled to the mill by truck. The operation has also benefited from a broad set of cost and operational improvement initiatives, including rationalisation of contractor services and strategic sourcing projects driving reductions in material costs.
Depreciation expense for the twelve months ended 30 June 2014 of A$39 million was A$8 million or 17% lower than the prior year (A$47 million), which reflects the reduced asset base as a result of the impairment to the carrying value of assets at Hidden Valley as at 30 June 2013.
All-In Sustaining Cost29 per ounce sold for the twelve months ended 30 June 2014 of A$1,402 per ounce (US$1,288 per ounce) was $1,005 per ounce or 42% lower than the prior year (A$2,407 or US$2,473 per ounce), reflecting increased gold sales, reduced site operating costs and lower sustaining capital expenditure.
29 All-In Sustaining Cost metrics as per World Gold Council Guidance Note on Non-GAAP Metrics, released 27 June 2013.
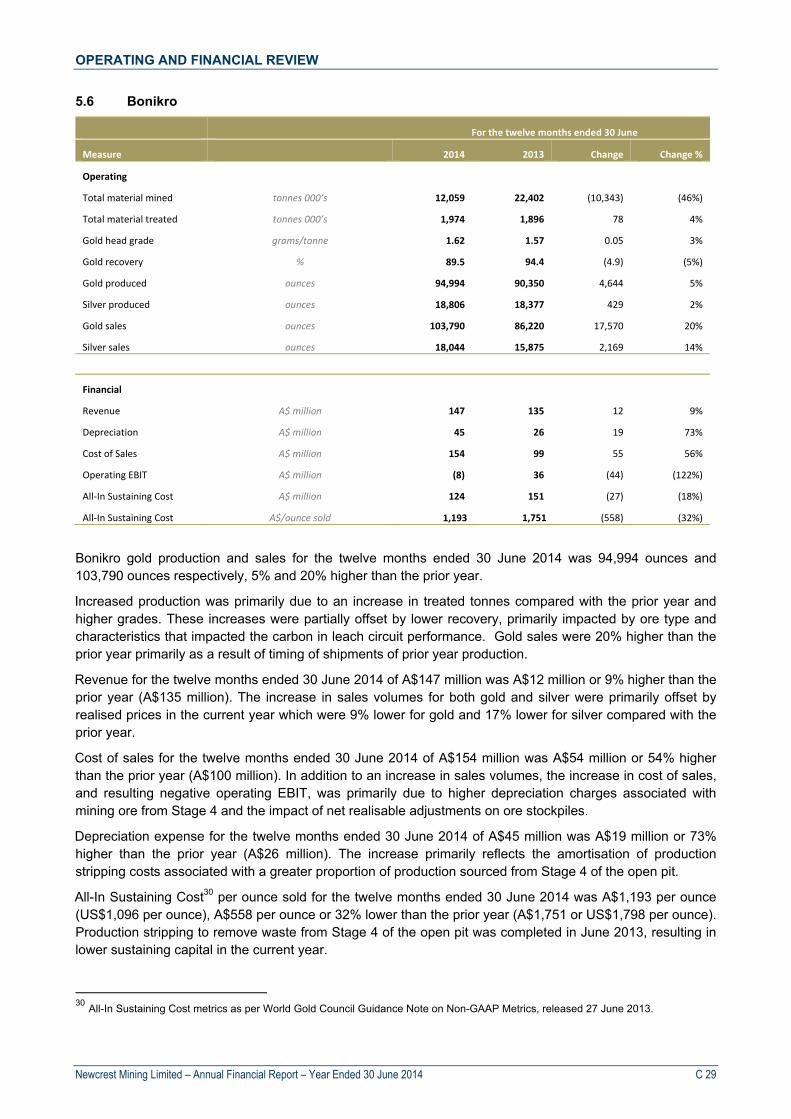
OPERATING AND FINANCIAL REVIEW
Newcrest Mining Limited – Annual Financial Report – Year Ended 30 June 2014 C 29
Bonikro 5.6
For the twelve months ended 30 June
Measure 2014 2013 Change Change %
Operating
Total material mined tonnes 000’s 12,059 22,402 (10,343) (46%)
Total material treated tonnes 000’s 1,974 1,896 78 4%
Gold head grade grams/tonne 1.62 1.57 0.05 3%
Gold recovery % 89.5 94.4 (4.9) (5%)
Gold produced ounces 94,994 90,350 4,644 5%
Silver produced ounces 18,806 18,377 429 2%
Gold sales ounces 103,790 86,220 17,570 20%
Silver sales ounces 18,044 15,875 2,169 14%
Financial
Revenue A$ million 147 135 12 9%
Depreciation A$ million 45 26 19 73%
Cost of Sales A$ million 154 99 55 56%
Operating EBIT A$ million (8) 36 (44) (122%)
All‐In Sustaining Cost A$ million 124 151 (27) (18%)
All‐In Sustaining Cost A$/ounce sold 1,193 1,751 (558) (32%)
Bonikro gold production and sales for the twelve months ended 30 June 2014 was 94,994 ounces and 103,790 ounces respectively, 5% and 20% higher than the prior year.
Increased production was primarily due to an increase in treated tonnes compared with the prior year and higher grades. These increases were partially offset by lower recovery, primarily impacted by ore type and characteristics that impacted the carbon in leach circuit performance. Gold sales were 20% higher than the prior year primarily as a result of timing of shipments of prior year production.
Revenue for the twelve months ended 30 June 2014 of A$147 million was A$12 million or 9% higher than the prior year (A$135 million). The increase in sales volumes for both gold and silver were primarily offset by realised prices in the current year which were 9% lower for gold and 17% lower for silver compared with the prior year.
Cost of sales for the twelve months ended 30 June 2014 of A$154 million was A$54 million or 54% higher than the prior year (A$100 million). In addition to an increase in sales volumes, the increase in cost of sales, and resulting negative operating EBIT, was primarily due to higher depreciation charges associated with mining ore from Stage 4 and the impact of net realisable adjustments on ore stockpiles.
Depreciation expense for the twelve months ended 30 June 2014 of A$45 million was A$19 million or 73% higher than the prior year (A$26 million). The increase primarily reflects the amortisation of production stripping costs associated with a greater proportion of production sourced from Stage 4 of the open pit.
All-In Sustaining Cost30 per ounce sold for the twelve months ended 30 June 2014 was A$1,193 per ounce (US$1,096 per ounce), A$558 per ounce or 32% lower than the prior year (A$1,751 or US$1,798 per ounce). Production stripping to remove waste from Stage 4 of the open pit was completed in June 2013, resulting in lower sustaining capital in the current year.
30 All-In Sustaining Cost metrics as per World Gold Council Guidance Note on Non-GAAP Metrics, released 27 June 2013.
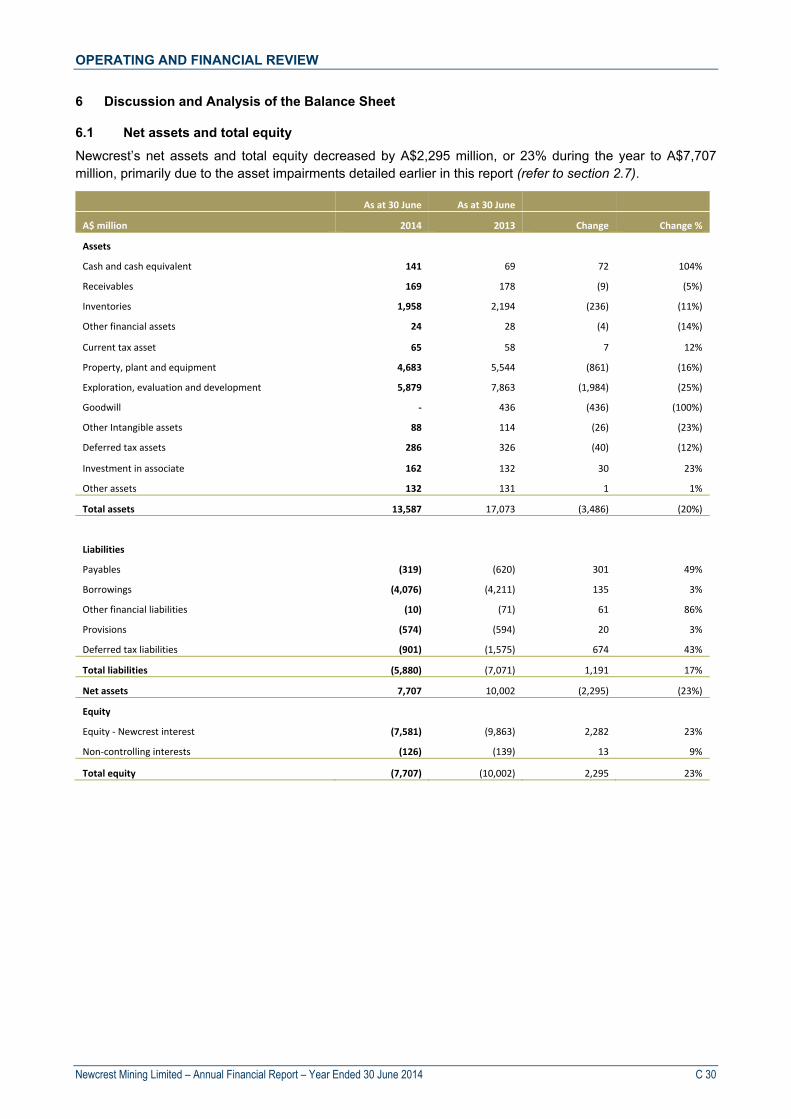
OPERATING AND FINANCIAL REVIEW
Newcrest Mining Limited – Annual Financial Report – Year Ended 30 June 2014 C 30
6 Discussion and Analysis of the Balance Sheet
Net assets and total equity 6.1
Newcrest’s net assets and total equity decreased by A$2,295 million, or 23% during the year to A$7,707 million, primarily due to the asset impairments detailed earlier in this report (refer to section 2.7).
As at 30 June As at 30 June
A$ million 2014 2013 Change Change %
Assets
Cash and cash equivalent 141 69 72 104%
Receivables 169 178 (9) (5%)
Inventories 1,958 2,194 (236) (11%)
Other financial assets 24 28 (4) (14%)
Current tax asset 65 58 7 12%
Property, plant and equipment 4,683 5,544 (861) (16%)
Exploration, evaluation and development 5,879 7,863 (1,984) (25%)
Goodwill ‐ 436 (436) (100%)
Other Intangible assets 88 114 (26) (23%)
Deferred tax assets 286 326 (40) (12%)
Investment in associate 162 132 30 23%
Other assets 132 131 1 1%
Total assets 13,587 17,073 (3,486) (20%)
Liabilities
Payables (319) (620) 301 49%
Borrowings (4,076) (4,211) 135 3%
Other financial liabilities (10) (71) 61 86%
Provisions (574) (594) 20 3%
Deferred tax liabilities (901) (1,575) 674 43%
Total liabilities (5,880) (7,071) 1,191 17%
Net assets 7,707 10,002 (2,295) (23%)
Equity
Equity ‐ Newcrest interest (7,581) (9,863) 2,282 23%
Non‐controlling interests (126) (139) 13 9%
Total equity (7,707) (10,002) 2,295 23%
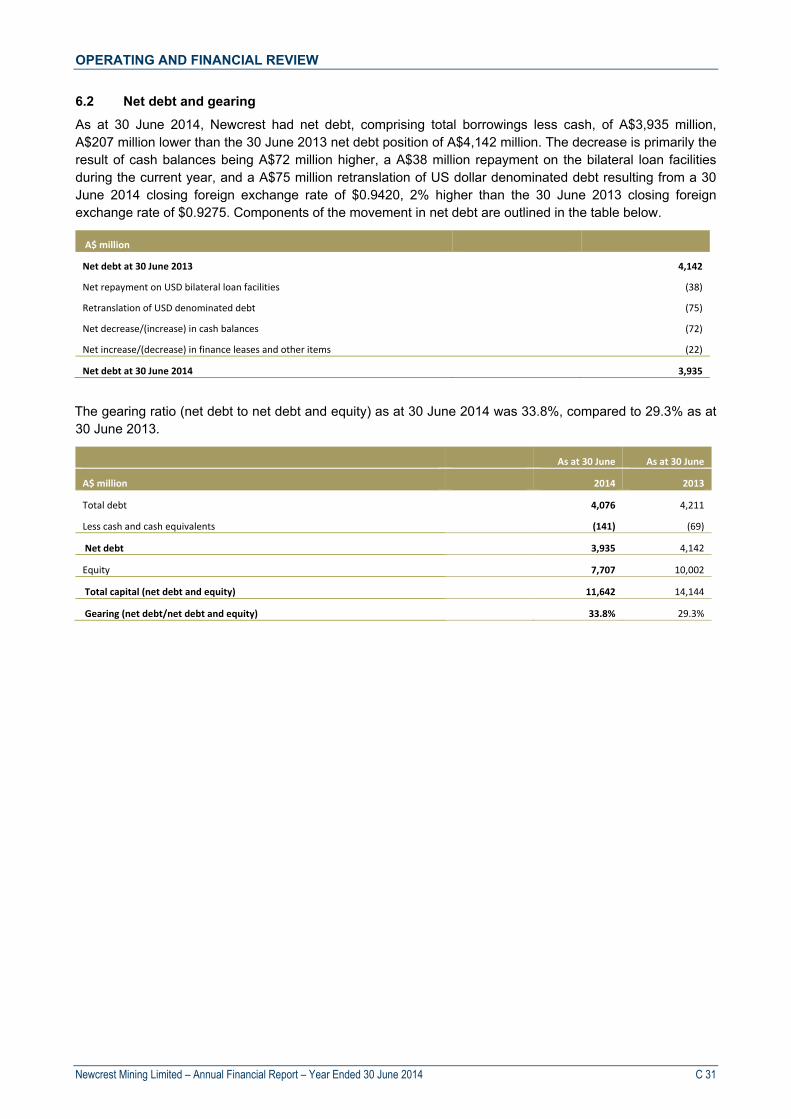
OPERATING AND FINANCIAL REVIEW
Newcrest Mining Limited – Annual Financial Report – Year Ended 30 June 2014 C 31
Net debt and gearing 6.2
As at 30 June 2014, Newcrest had net debt, comprising total borrowings less cash, of A$3,935 million, A$207 million lower than the 30 June 2013 net debt position of A$4,142 million. The decrease is primarily the result of cash balances being A$72 million higher, a A$38 million repayment on the bilateral loan facilities during the current year, and a A$75 million retranslation of US dollar denominated debt resulting from a 30 June 2014 closing foreign exchange rate of $0.9420, 2% higher than the 30 June 2013 closing foreign exchange rate of $0.9275. Components of the movement in net debt are outlined in the table below.
A$ million
Net debt at 30 June 2013 4,142
Net repayment on USD bilateral loan facilities (38)
Retranslation of USD denominated debt (75)
Net decrease/(increase) in cash balances (72)
Net increase/(decrease) in finance leases and other items (22)
Net debt at 30 June 2014 3,935
The gearing ratio (net debt to net debt and equity) as at 30 June 2014 was 33.8%, compared to 29.3% as at 30 June 2013.
As at 30 June As at 30 June
A$ million 2014 2013
Total debt 4,076 4,211
Less cash and cash equivalents (141) (69)
Net debt 3,935 4,142
Equity 7,707 10,002
Total capital (net debt and equity) 11,642 14,144
Gearing (net debt/net debt and equity) 33.8% 29.3%
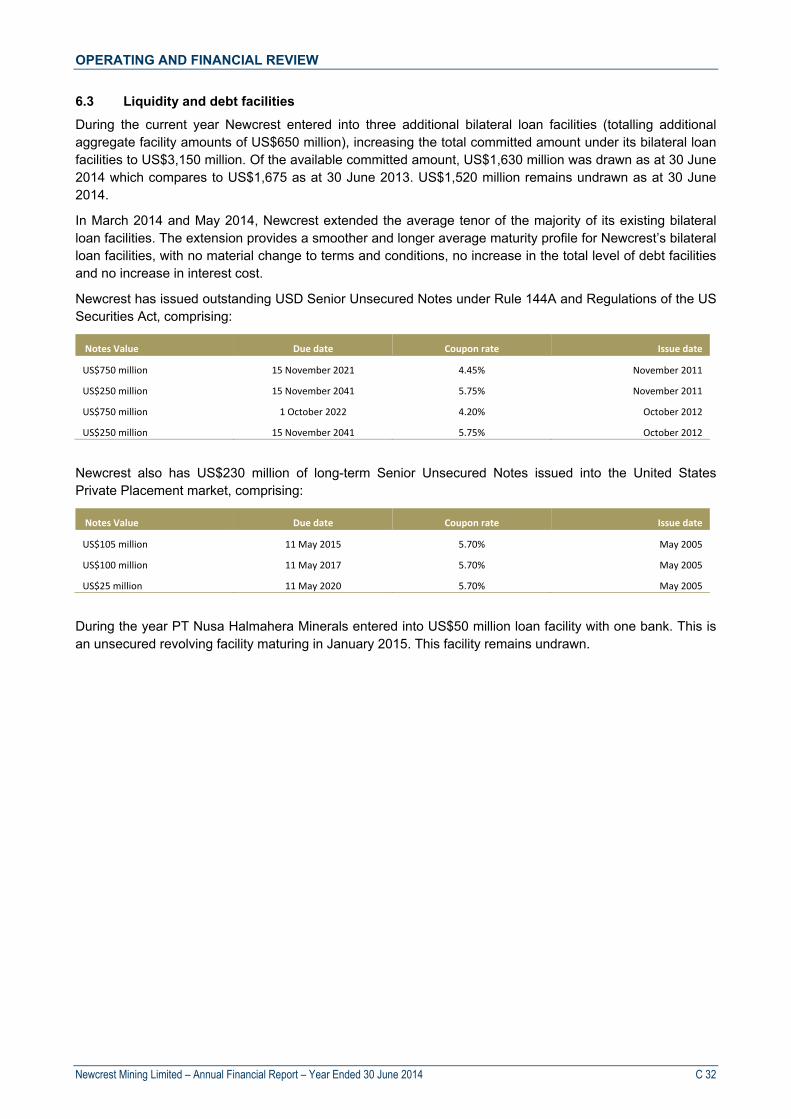
OPERATING AND FINANCIAL REVIEW
Newcrest Mining Limited – Annual Financial Report – Year Ended 30 June 2014 C 32
Liquidity and debt facilities 6.3
During the current year Newcrest entered into three additional bilateral loan facilities (totalling additional aggregate facility amounts of US$650 million), increasing the total committed amount under its bilateral loan facilities to US$3,150 million. Of the available committed amount, US$1,630 million was drawn as at 30 June 2014 which compares to US$1,675 as at 30 June 2013. US$1,520 million remains undrawn as at 30 June 2014.
In March 2014 and May 2014, Newcrest extended the average tenor of the majority of its existing bilateral loan facilities. The extension provides a smoother and longer average maturity profile for Newcrest’s bilateral loan facilities, with no material change to terms and conditions, no increase in the total level of debt facilities and no increase in interest cost.
Newcrest has issued outstanding USD Senior Unsecured Notes under Rule 144A and Regulations of the US Securities Act, comprising:
Notes Value Due date Coupon rate Issue date
US$750 million 15 November 2021 4.45% November 2011
US$250 million 15 November 2041 5.75% November 2011
US$750 million 1 October 2022 4.20% October 2012
US$250 million 15 November 2041 5.75% October 2012
Newcrest also has US$230 million of long-term Senior Unsecured Notes issued into the United States Private Placement market, comprising:
Notes Value Due date Coupon rate Issue date
US$105 million 11 May 2015 5.70% May 2005
US$100 million 11 May 2017 5.70% May 2005
US$25 million 11 May 2020 5.70% May 2005
During the year PT Nusa Halmahera Minerals entered into US$50 million loan facility with one bank. This is an unsecured revolving facility maturing in January 2015. This facility remains undrawn.

OPERATING AND FINANCIAL REVIEW
Newcrest Mining Limited – Annual Financial Report – Year Ended 30 June 2014 C 33
7 Non-IFRS Financial Information
Underlying profit, EBIT, EBITDA, Free Cash Flow, All-In Sustaining Cost and Return on Capital Employed are non-IFRS financial measures which Newcrest employs in managing the business. They have been included in the Operating and Financial Review to provide additional insight and understanding of business performance for users of this financial information. When reviewing business performance this non-IFRS information should be used in addition to, and not as a replacement of, measures prepared in accordance with IFRS.
These measures do not have any standard definition under IFRS and may be calculated differently by other companies. The tables below reconcile these non-IFRS measures to the most appropriate IFRS measure.
The reconciliation of free cash flow to the cash flow statement can be found in section 4.1.
Reconciliation of Statutory profit to Underlying profit 7.1
Underlying profit is reported by Newcrest to provide greater understanding of the underlying business performance of its operations. Underlying profit excludes significant items of income or expense which are, either individually or in aggregate, material to Newcrest or to the relevant business segment and are either outside the ordinary course of business or are part of the ordinary activities of the business but unusual due to their size and nature. Examples include gains/losses and other costs incurred for acquisitions and disposals of mining interests and asset impairment and write-down charges. Underlying profit and Statutory profit both represent amounts attributable to Newcrest shareholders.
The following table provides a reconciliation of Statutory profit to Underlying profit:
For the twelve months ended 30 June 2014
A$ million Before Tax Tax Non‐controlling
interest After tax
Profit after tax attributable to Newcrest shareholders "Statutory profit/(loss)"
(2,725) 510 (6) (2,221)
Research and development tax claim amendment ‐ 120 ‐ 120
Impairment loss 3,128 (747) (17) 2,364
Asset write downs 174 (52) ‐ 122
Inventory write downs 35 (11) ‐ 24
Investment in Evolution – investment impairment reversal (11) ‐ ‐ (11)
Restructure costs 46 (12) ‐ 34
Total of significant items 3,372 (702) (17) 2,653
Underlying profit 647 (192) (23) 432
For the twelve months ended 30 June 2013
A$ million Before Tax Tax Non‐controlling
interest After tax
Profit after tax attributable to Newcrest shareholders "Statutory profit/(loss)"
(6,199) 419 (3) (5,783)
Impairment loss 6,147 (564) (27) 5,556
Asset write downs 166 (50) ‐ 116
Inventory write downs 177 (47) (2) 128
De‐recognition of deferred tax assets ‐ 105 ‐ 105
Investment in Evolution – share of associates impairment 122 ‐ ‐ 122
Investment in Evolution – investment impairment 151 ‐ ‐ 151
Restructure costs 72 (21) ‐ 51
Total of significant items 6,835 (577) (29) 6,229
Underlying profit 636 (158) (32) 446
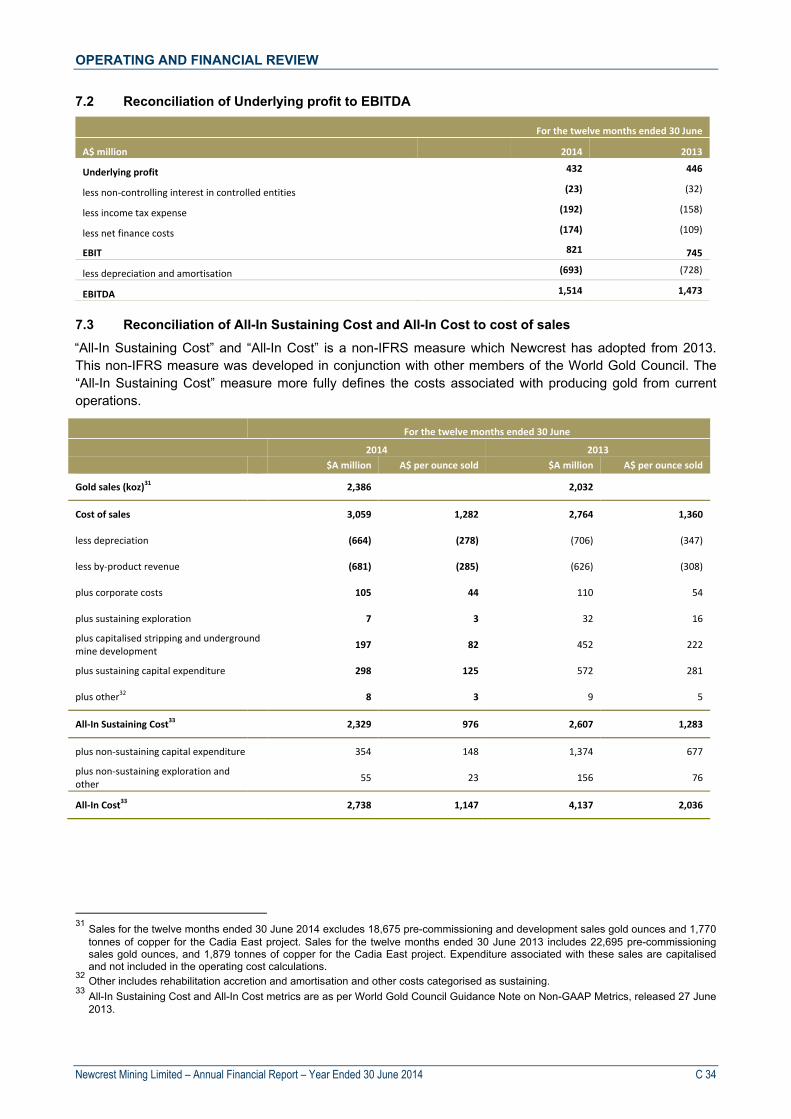
OPERATING AND FINANCIAL REVIEW
Newcrest Mining Limited – Annual Financial Report – Year Ended 30 June 2014 C 34
Reconciliation of Underlying profit to EBITDA 7.2
For the twelve months ended 30 June
A$ million 2014 2013
Underlying profit 432 446
less non‐controlling interest in controlled entities (23) (32)
less income tax expense (192) (158)
less net finance costs (174) (109)
EBIT 821 745
less depreciation and amortisation (693) (728)
EBITDA 1,514 1,473
Reconciliation of All-In Sustaining Cost and All-In Cost to cost of sales 7.3
“All-In Sustaining Cost” and “All-In Cost” is a non-IFRS measure which Newcrest has adopted from 2013. This non-IFRS measure was developed in conjunction with other members of the World Gold Council. The “All-In Sustaining Cost” measure more fully defines the costs associated with producing gold from current operations.
For the twelve months ended 30 June
2014 2013
$A million A$ per ounce sold $A million A$ per ounce sold
Gold sales (koz)31
2,386
2,032
Cost of sales
3,059 1,282 2,764 1,360
less depreciation
(664) (278) (706) (347)
less by‐product revenue
(681) (285) (626) (308)
plus corporate costs
105 44 110 54
plus sustaining exploration
7 3 32 16
plus capitalised stripping and underground mine development
197 82 452 222
plus sustaining capital expenditure
298 125 572 281
plus other32
8 3 9 5
All‐In Sustaining Cost33
2,329 976 2,607 1,283
plus non‐sustaining capital expenditure 354 148 1,374 677
plus non‐sustaining exploration and other
55 23 156 76
All‐In Cost33 2,738 1,147 4,137 2,036
31 Sales for the twelve months ended 30 June 2014 excludes 18,675 pre-commissioning and development sales gold ounces and 1,770
tonnes of copper for the Cadia East project. Sales for the twelve months ended 30 June 2013 includes 22,695 pre-commissioning sales gold ounces, and 1,879 tonnes of copper for the Cadia East project. Expenditure associated with these sales are capitalised and not included in the operating cost calculations.
32 Other includes rehabilitation accretion and amortisation and other costs categorised as sustaining. 33 All-In Sustaining Cost and All-In Cost metrics are as per World Gold Council Guidance Note on Non-GAAP Metrics, released 27 June
2013.

OPERATING AND FINANCIAL REVIEW
Newcrest Mining Limited – Annual Financial Report – Year Ended 30 June 2014 C 35
Reconciliation of Return on Capital Employed (ROCE) 7.4
ROCE is “Return on Capital Employed” and is reported by Newcrest to provide greater understanding of the underlying business performance of its operations. ROCE is calculated as EBIT expressed as a percentage of average total capital employed (net debt and equity).
As at 30 June As at 30 June
A$ million 2014 2013
EBIT 821 745
Total capital (net debt and equity) – as at 30 June 2012
17,183
Total capital (net debt and equity) – as at 30 June 2013 14,144 14,144
Total capital (net debt and equity) – as at 30 June 2014 11,642
Average total capital employed 12,893 15,664
Return on Capital Employed (EBIT/average total capital employed) 6.4% 4.8%

OPERATING AND FINANCIAL REVIEW
Newcrest Mining Limited – Annual Financial Report – Year Ended 30 June 2014 C 36
8 Risks
Newcrest’s business, operating and financial results and performance are subject to various risks and uncertainties, many of which are beyond the Company’s reasonable control. Set out below are matters which the Company has assessed as having the potential to have a material adverse effect on the business, operating and/or financial results and performance of the Company. These matters may arise individually, simultaneously or in combination.
The matters identified below are not necessarily listed in order of importance and are not intended as an exhaustive list of all of the risks and uncertainties associated with Newcrest’s business. Additional risks and uncertainties not presently known to management, or that management currently believes to be immaterial or manageable, may adversely affect Newcrest’s business.
Market price of gold and other commodities
Commodity prices are volatile and may be subject to short term changes, which may be severe, and to price adjustments of a longer term nature. For example, following a prolonged period of annual increases in the gold price, culminating in a high of approximately US$1,900 per ounce34 in September 2012, the gold price experienced its largest price change in more than twenty years in April 2013 and finished FY2013 at approximately US$1,250 per ounce34. Newcrest’s average realised gold price during FY2014 was US$1,292 per ounce.
Commodity prices are affected by numerous factors beyond Newcrest’s control, including macroeconomic conditions (such as financial and banking stability, global and regional political and economic events, inflation, changes in interest rates and the relative strength of the US dollar), speculative positions taken by investors or traders, actual or expected gold sales by central banks, changes in supply or demand for gold, gold hedging and de-hedging by producers, and production and cost levels in major gold producing regions.
Examples of the potential impact of commodity prices include (but are not limited to):
Revenue from Newcrest’s operations is linked to the realised prices for commodity products. For example, in the 2015 financial year a US$10 per ounce change in the average gold price realised by Newcrest is estimated to have an impact of approximately A$25 million on Newcrest’s total revenue from operations.35
Copper and silver revenue provides by-product credits against Newcrest’s operating costs for gold production. As a result, the commodity price realised by Newcrest for copper and silver (and any other by-product) will impact upon the costs per ounce of gold production. For example, in the 2015 financial year a US$0.05 per pound change in the average copper price realised by Newcrest is estimated to have an impact of approximately A$9 million on Newcrest’s total revenue from operations.36
Material changes in commodity prices may change the economic viability of mining operations, particularly higher cost mining operations, which may result in decisions to alter production plans or the suspension or closure of mining operations.
Reductions in the revenue realised by Newcrest from mining operations may result in Newcrest curtailing or suspending its exploration activities, with the result that depleted reserves may not be replaced, and the market value of Newcrest's gold or copper inventory may be reduced.
34 Source: World Gold Council (http://www.gold.org/investment/interactive-gold-price-chart) 35 Calculation based on the mid-point of Newcrest’s FY2015 gold production guidance (2.2 to 2.4 million ounces) and assuming a fixed
US$:A$ exchange rate of 0.93. 36 Calculation based on the mid-point of Newcrest’s FY2015 copper production guidance (75 to 85 thousand tonnes) and assuming a
fixed US$:A$ exchange rate of 0.93.

OPERATING AND FINANCIAL REVIEW
Newcrest Mining Limited – Annual Financial Report – Year Ended 30 June 2014 C 37
In addition, historical and current commodity price performance may impact upon Newcrest’s assumptions regarding future commodity prices which, in turn, may impact upon Newcrest’s current and future operating, business and financial performance and results. Examples of the potential impact of changes to assumptions regarding future commodity prices, alone or in combination with other factors such as foreign exchange rates, include (but are not limited to):
changes to assumptions regarding future commodity prices may result in changes to proposed project developments or the deferral or abandonment of current or future project development;
a decline in the assumptions regarding future commodity prices (alone, or in combination with other material assumptions) may result in a reduction of Newcrest’s estimates of Mineral Resources and Ore Reserves; and
changes in assumptions regarding future commodity prices may impact upon the assessment of the carrying values of Newcrest’s assets for accounting purposes.
Foreign exchange rates
The majority of Newcrest’s revenue is realised in, or linked to, the US dollar on the basis that commodities are sold globally based on US dollar prices. By contrast, the majority of Newcrest's operating costs are denominated in the relevant local currency. As a result, relative strengthening of local currency (particularly the Australian dollar) against the US dollar will impact upon Newcrest’s operating, business and financial performance and results. For example, in FY2015 a A$0.01 change in the AUD/USD exchange rate is estimated to have an impact of approximately A$22 million on Newcrest’s EBIT in the 2015 financial year37.
Similarly to assumptions regarding future commodity prices, assumptions regarding future foreign exchange rates, alone or in combination with other factors, may impact upon continuing operations, project development decisions, Mineral Resource and Ore Reserves estimates and the assessment of the carrying value of Newcrest’s assets.
Increased costs and production inputs
Operating costs are frequently subject to variations from one year to the next due to a number of factors, including changing ore grade and metallurgy, revisions to mine plans in response to the physical shape and location of an ore body and/or changes to meet external economic conditions, and the level of sustaining capital required to maintain operations.
Operating costs and capital expenditure are, to a significant extent, driven by the cost of commodity inputs consumed in mining (including fuel, chemical reagents, explosives, tyres, electricity and steel), labour costs and realised by-products such as copper and silver, each of which may be subject to volatile price movements. Increases in costs may have a material adverse effect upon the profitability of existing mining operations, Newcrest’s ability to lower its cost profile and meet projected operating cost targets at its mines and returns anticipated from new mining projects, could make certain mines or projects uneconomic, and could impact the assessment of the carrying value of Newcrest’s assets.
Operating risks and hazards
Newcrest’s mining operations are subject to operating risks and hazards including (without limitation) unanticipated ground conditions, industrial incidents, infrastructure and equipment under-performance or failure, shortage of principal supplies, transportation and aviation issues in relation to the company’s workforce (including FIFO transportation arrangements) and equipment, environmental incidents, safety-related incidents, interruptions and delays due to community issues, and natural events such as seismic activity and severe weather conditions (including floods and drought).
37 Calculation based on the mid-point of Newcrest’s FY2015 guidance for production, operating costs, capital and exploration costs, and
assuming average realised prices of US$1,250 per ounce of gold, US$3.00 per pound of copper and US$20.0 per ounce of silver, and a starting US$:A$ exchange rate of 0.93.
OPERATING AND FINANCIAL REVIEW
Newcrest Mining Limited – Annual Financial Report – Year Ended 30 June 2014 C 38
A key operational risk for Newcrest is the availability of power and water to support mining and mineral processing activities, particularly at Newcrest’s remotely located assets. Even a temporary interruption of power or water supply could adversely affect an operation.
Newcrest’s operations in Indonesia and Papua New Guinea are in areas known to be seismically active and are subject to the risks of earthquakes and related risks of tidal surge and tsunami, which are difficult to predict. Some of Newcrest’s operations may also experience other specific operating challenges, such as the underground risks at Gosowong relating to temperature and ground conditions.
Newcrest faces particular geotechnical, geothermal and hydrological challenges, in particular due to the trend toward mining deeper more mature pits, more complex deposits and the use of bulk underground mining techniques. This leads to higher pit walls, more complex underground environments and increased exposure to geotechnical instability and hydrological impacts.
There are a number of risks and uncertainties associated with the block caving and panel caving mining methods being applied or proposed to be applied by Newcrest at its Cadia Valley operations. Risks include a deposit that may not cave as anticipated, the formation of air pockets during cave propagation, the wide spans needed give rise to a risk of unplanned ground movement due to changes in stresses in the surrounding rock and the risk of unplanned release of material and/or water through drawbells and ventilation shafts.
In addition, the success of Newcrest at some of its operations, including the Lihir operation, depends, in part, upon the implementation of Newcrest’s engineering solutions to particular hydrological and geothermal conditions. At Lihir, for example, significant removal of both groundwater and sea water inflow and geothermal control is required before and during mining. A failure to resolve any unexpected problems relating to these conditions at a commercially reasonable cost could adversely affect the economics, safety or feasibility of Newcrest’s operations.
Future operating and capital cost requirements
Newcrest’s operating, business and financial performance and results will be impacted by the extent to which Newcrest's operating cash flows are able to fund its operating and capital expenditure requirements. To the extent that Newcrest's operating cash flows are insufficient to meet its current and future operating and capital expenditure requirements, Newcrest may need to draw on available debt facilities or seek additional funding through asset divestitures, further equity or debt issue, or additional bank debt (or some combination of these), or Newcrest may need to defer operating or capital expenditure.
Newcrest's ability to service current funding arrangements and to raise and service any additional funding or to meet conditions applicable to current or future funding arrangements, will be a function of a number of factors, including (without limitation) macroeconomic conditions, future gold and copper prices, Newcrest's credit rating, operational cash flow and production performance. If Newcrest is unable to obtain additional funding on acceptable terms in these circumstances, Newcrest’s business, operating and financial performance and results may be impacted.
Exploration, project evaluation and project development
Newcrest’s current and future business, operating and financial performance and results are impacted by the discovery of new mineral prospects and actual performance of developing and operating mines, which may differ significantly from estimates determined at the time the relevant project was approved for development. Newcrest’s current or future development activities may not result in expansion or replacement of current production, or one or more new productions sites or facilities may be less profitable than anticipated or may not be profitable at all.

OPERATING AND FINANCIAL REVIEW
Newcrest Mining Limited – Annual Financial Report – Year Ended 30 June 2014 C 39
Newcrest's ability to sustain or increase its current level of production in the future is in part dependent on the success of its exploration activities in replacing gold and copper reserves depleted by production, the development of new projects and the expansion of existing operations. In the last decade the time from discovery to production has increased significantly as a result of a variety of factors, including increases in capital requirements, environmental considerations and the complexity and depth of ore bodies.
In the absence of exploration success, or additions to Newcrest’s mineral inventory to support future operations through development activities, expansions or acquisitions, Newcrest will be unable to replace ore reserves depleted by operations.
Exploration activities are speculative in nature and often require substantial expenditure on exploration drilling and sampling as a basis on which to establish the presence, extent and estimated grade (metal content) of mineralised material.
Once mineralisation is discovered it may take several years to determine whether adequate Ore Reserves exist to support a development decision and to obtain necessary ore body knowledge to assess the technical and economic viability of mining projects. During that time the economic viability of the project may change due to fluctuations in factors that affect both revenue and costs, including commodity prices, currency exchange rates, the required return on capital and future cost of development and mining operations.
Maintaining title
Newcrest's production, development and exploration activities are subject to obtaining and maintaining the necessary titles, authorisations, permits and licences, and associated land access arrangements with the local community, which authorise those activities under the relevant law (Authorisations). There can be no guarantee that Newcrest will be able to successfully obtain and maintain relevant Authorisations, or obtain and maintain relevant Authorisations on terms acceptable to Newcrest, to support its activities, or that renewal of existing Authorisations will be granted in a timely manner or on terms acceptable to Newcrest.
Authorisations held by or granted to Newcrest may also be subject to challenge by third parties which, if successful, could impact on Newcrest’s exploration, development and/or mining activities. For example, in New South Wales, a privately-owned exploration company called Gold & Copper Resources Pty Ltd has initiated a series of legal proceedings seeking to challenge the validity of Authorisations granted to Newcrest (or its subsidiaries) in relation to mining and exploration activities at the Cadia Valley operations. None of the proceedings to-date has resulted in Newcrest losing any of its Authorisations.
Law and regulation
Newcrest's current and future mining, development and exploration activities are subject to various laws, policies and regulations governing the development and mining of mineral deposits, taxation and royalties, import and export duties and restrictions, exchange controls, foreign investment approvals, employee and community relations, and environmental and other matters. A failure to comply with legal requirements may result in enforcement action being taken against Newcrest with potentially material consequences, including financial penalties, suspension of operations and forfeiture.
In a number of jurisdictions where Newcrest has existing interests, the legal framework is increasingly complex, subject to change and becoming more onerous. In particular, Newcrest is subject to extensive laws and regulation in relation to the environment and workplace health and safety.
Mining operations and development activities have inherent risks and liabilities associated with potential harm to the environment and the management of waste products. A key consideration in Newcrest's operations is the management of waste. Newcrest is required to close its operations and rehabilitate the lands that it disturbs during the exploration and operating phases in accordance with applicable environmental laws and regulations. Estimates of closure and rehabilitation liabilities are based principally on current legal and regulatory requirements and actual costs may vary materially. In addition, adverse or deteriorating external economic conditions may bring forward mine closure and associated closure and rehabilitation costs.

OPERATING AND FINANCIAL REVIEW
Newcrest Mining Limited – Annual Financial Report – Year Ended 30 June 2014 C 40
Newcrest's production, development and exploration activities are also subject to extensive generic and mining-specific health and safety laws and regulations. Changes to these laws may result in material additional expenditure or interruption to Newcrest's activities in order to comply with changing requirements.
Political, economic, social and security risks
Newcrest’s production, development and exploration activities are subject to the political, economic, social and other risks and uncertainties in the jurisdictions in which those activities are undertaken. Such risks are unpredictable and have become more prevalent in recent years. In particular, in recent years there has been an increasing social and political focus on:
the revenue derived by governments and other stakeholders from mining activities, which has
resulted in announced reviews of the fiscal regimes38 applicable to mining in a number of the
jurisdictions in which Newcrest has interests (including Australia, Papua New Guinea, Côte d’Ivoire and Indonesia); and
resource nationalism, with the announcement of proposed reforms regarding government or landowner participation in mining activities, greater limits on foreign ownership of mining or exploration interests and/or forced divestiture (with or without adequate compensation), and broad reform agenda in relation to mining legislation, environmental stewardship and local business opportunities and employment.
Recent examples of reviews announced in jurisdictions in which Newcrest has mining and/or exploration interests include (without limitation):
In Indonesia (where Newcrest’s 75% owned Gosowong operations are located), in the context of the review of the Gosowong Contract of Work, the Government may seek to reduce the size of the tenement holding, impose requirements for additional local equity participation, and make changes to the fiscal regime that applies to the project.
In Papua New Guinea, the Government is undertaking a broad review of mining laws, with potential reforms extending the level of local equity participation in projects, more stringent requirements for local participation in mining-related businesses, local mineral smelting and processing, and broader changes to the regulatory regime for mining and related activities.
In Australia, the Government of Western Australia is reviewing the state’s royalty rates, having previously indicated that an increase in the royalty rate for gold could be considered.
In Côte d’Ivoire, the Government undertook a review of its mining code, resulting in a new mining code and associated changes that amended the royalty rate for gold from 3% royalty rate to a rate of 3% to 6% linked to the gold price.
There can be no certainty as to what changes, if any, will be made to relevant laws in the jurisdictions where the company has current interests, or other jurisdictions where the company may have interest in the future, or the impact that relevant changes may have on Newcrest’s ability to own and operate its mining and related interests and to otherwise conduct its business in those jurisdictions.
Community relations
A failure to manage relationships with the communities in which Newcrest operates may lead to local dissatisfaction, which, in turn, may lead to interruptions to Newcrest's production, development and exploration activities. Particular challenges in community relations are increasing expectations regarding the level of benefits that communities receive and the level of transparency regarding the application of compensation and other benefits to affected landowners.
38 Fiscal reviews announced variously include review of royalty rates, taxation rates, mining and related levies and imposts, local
business partnerships, local mineral processing requirements and equity participation.

OPERATING AND FINANCIAL REVIEW
Newcrest Mining Limited – Annual Financial Report – Year Ended 30 June 2014 C 41
In addition, there is an increasing level of community concern relating to the perceived effect of mining activities on the environment and on the communities located near such activities. Adverse publicity generated by non-government-organisations or others relating to extractive industries generally, or Newcrest specifically, could have an adverse impact on Newcrest's reputation or financial condition and may impact on Newcrest's relationships with the communities in which it operates. No assurance can be given that incidents will not arise that generate community concerns associated with Newcrest's operations and potentially cause disruptions until resolved.
Typically, where Newcrest has exploration activities, development projects or operations, it enters into agreements with local landowners. These agreements include compensation and other benefits and may be subject to periodic review. The negotiation and/or review of community agreements, including compensation and other benefits, involves complicated and sensitive issues, associated expectations and often competing interests, which Newcrest seeks to manage respectfully. The nature and subject matter of these negotiations may result in community unrest which, in some instances, results in interruptions to Newcrest’s activities.
For example, the community agreements in place with customary landowners in relation to Newcrest's Lihir operation in Papua New Guinea are the subject of an ongoing review process. The duration of the review process is a result of the important issues covered by the agreements and the competing interests of different landowner groups. During the ongoing review process, and in the context of the previous review (FY2003-FY2007), the Lihir operations have experienced disruptions as a result of community unrest regarding the progress of the review negotiations and intra-community issues. There is no guarantee that this won’t happen again in the future.
Resources and reserves
Mineral Resources and Ore Reserves estimates are necessarily imprecise and involve subjective judgements regarding a number of factors including (not limited to) grade distribution or mineralisation, the ability to economically extract and process mineralisation, and future commodity prices, exchange rates and operating costs. Such estimates relate to matters outside Newcrest’s reasonable control and involve statistical analysis which may subsequently prove to be unreliable or flawed.
Newcrest’s annual Mineral Resources and Ore Reserves statement is based upon a number of factors, including (without limitation) actual exploration drilling and production results, economic assumptions (such as future commodity prices and exchange rates) and operating and other costs. These factors may result in reductions in Newcrest's Mineral Resources and Ore Reserves estimates, which could adversely affect the life-of-mine plans and may impact upon the value attributable to Newcrest’s mineral inventory and/or the carrying value of one or more of Newcrest’s assets.
Reliance on contractors
Some aspects of Newcrest's production, development and exploration activities are conducted by contractors. As a result, Newcrest's business, operating and financial performance and results are impacted upon by the availability and performance of contractors and the associated risks.
Marketing
Newcrest produces mineral concentrates which are exported by ocean vessels to smelters, located predominantly in Asia, with associated risks including (without limitation) fluctuating smelter charges, marine transportation charges and inland freight charges. Transportation of the concentrate is also subject to numerous risks including (without limitation) delays in delivery of shipments, terrorism, loss of or reduced access to export ports, weather conditions and environmental liabilities in the event of an accident or spill. Sales of concentrate may also be adversely impacted by disruption at the operations of one or more of the receiving smelters and consequent declarations of force majeure at such smelters. Additionally, the quality of mineral concentrates, including the presence of impurities and deleterious, is subject to restrictions on import which vary in foreign jurisdictions and may impact upon the saleability or price realised for the mineral concentrate.
OPERATING AND FINANCIAL REVIEW
Newcrest Mining Limited – Annual Financial Report – Year Ended 30 June 2014 C 42
Human resources and industrial relations
Newcrest competes with mining and other companies to attract and retain key employees and third party contractors with appropriate technical skills and managerial experience necessary to continue to operate its business. There can be no assurance that Newcrest will be able to attract and retain skilled and experienced personnel and, should Newcrest lose any of its key personnel or fail to attract personnel, its business may be harmed and its results of operations and financial condition could be adversely affected.
Newcrest may be impacted by industrial relations issues in connection with its employees and the employees of Newcrest's contractors and suppliers. Any such activity could cause production delays, increased labour costs and adversely impact Newcrest's ability to meet its production forecasts.
In a number of jurisdictions where Newcrest has mining and related interests, there are also local requirements or expectations regarding the extent to which local and national persons are directly engaged in the mining and related activities which may result in disruptions to Newcrest’s activities where relevant requirements and/or expectations are not met. There can be no assurance that disruptions will not occur in the future which may have an adverse effect on Newcrest’s business. Similarly, there can be no assurance that Newcrest will be able to attract and retain suitably qualified and experienced local or national personnel, or that unskilled persons trained by Newcrest will be retained, in the future.
Competition for projects to replace Ore Reserves
Significant gold deposits are becoming more difficult to find (fewer discoveries), are deeper and often in remote and more challenging jurisdictions. The declining rate of discovery of new gold deposits has, in recent years, increased the challenge of replacing the mining depletion of existing resources and reserves throughout the global gold sector. Newcrest faces intense competition for acquisition of attractive exploration and mining properties to replace reserves depleted by mining. As a result of this competition, exploration and acquisitions may not result in Newcrest being able to maintain or increase its Ore Reserves which could negatively impact its future business, operating and financial performance and results.
Newcrest evaluates potential acquisition and development opportunities for mineral deposits, exploration or development properties and operating mines, either as stand-alone assets or as parts of companies. Newcrest's decision to acquire or develop these properties is based on a variety of factors, including historical operating results, estimates and assumptions regarding the extent and quality of mineralisation, resources and reserves, assessment of the potential for further discoveries or growth in resources and reserves, cash and other operating costs, development and capital costs, future commodity prices, projected economic returns and evaluations of existing or potential liabilities associated with the relevant assets and how these factors may change in future. Other than historical operating results (if applicable), these factors are uncertain and could have an impact on revenue, cash and other operating results, as well as the process used to estimate Mineral Resources and Ore Reserves.
Joint arrangements and non-controlling interests
Newcrest has material joint venture interests and subsidiaries with non-controlling interests, including its interests in the Morobe Mining Joint Ventures in Papua New Guinea39, the Gosowong mine in Indonesia, the Bonikro mine in Côte d'Ivoire and the Namosi project in Fiji. Various circumstances or events may have a material adverse impact on Newcrest’s interests held in these entities, including (but not limited to) disagreement with joint venture partners and non-controlling interests on how to develop and operate the mines or projects efficiently, inability of joint venture partners to meet their financial and other joint venture commitments and particular risks associated with entities where a sovereign State holds an interest, including the extent to which the State intends to engage in project decision making and the ability of the State to fund its share of project costs.
39 The Morobe Mining Joint Ventures comprise the Hidden Valley mine unincorporated joint venture, which holds the Hidden Valley
operation, the Wafi-Golpu unincorporated joint venture, which holds the Wafi-Golpu exploration project, and the Morobe exploration unincorporated joint venture, which holds a portfolio of exploration tenements in the Morobe Province in Papua New Guinea.

OPERATING AND FINANCIAL REVIEW
Newcrest Mining Limited – Annual Financial Report – Year Ended 30 June 2014 C 43
New acquisitions
Newcrest's ability to make successful acquisitions and any difficulties or time delays in achieving successful integration of any such acquisitions could have a material adverse effect on its business, operating results and financial condition. Business combinations and acquisitions entail a number of risks including the effective integration of acquisitions to realise synergies, significant one-time write-offs or restructuring charges, and unanticipated costs and liabilities, including unforeseen plant and equipment reliability issues. Newcrest may also be liable for the acts or omissions of predecessors or otherwise exposed to liabilities that were unforeseen or greater than anticipated.
Macro-economic conditions
Newcrest's operating performance and financial performance is influenced by a variety of macro-economic and business conditions including the level of inflation, interest rates, exchange rates and government fiscal, monetary and regulatory policies. Prolonged deterioration in general economic conditions, change or deterioration in the rate of economic growth including changes to interest rates or decrease in consumer and business demand, could be expected to ultimately have an impact on Newcrest's business, results of operations or financial condition and performance.
Uninsured risks
In addition to maintaining insurances required by law, Newcrest maintains an insurance program for property damage and business interruption designed to protect it against events which could have a significant adverse effect on its operations and profitability. Newcrest's insurances do not cover all potential risks associated with its business. Newcrest may elect not to insure, or to self-insure against certain risks, where the premiums associated with insuring against those risks are considered to be excessive or for various other reasons, including an assessment that the risks are remote. Further, Newcrest's insurance policies carry deductibles and limits which apply in the event of a claim which may lead to Newcrest not recovering the full monetary impact of an insured event, and are subject to policy terms and conditions (including exclusions) which may impact on the extent to which a relevant policy responds to the circumstances of a claim. The occurrence of events for which Newcrest is not insured, or in respect of which relevant insurances do not respond fully, may adversely affect Newcrest's cash flows and overall profitability.
Refinancing risk
In addition to cash flows from operating activities, Newcrest has a range of debt facilities with external financiers – including unsecured bilateral loan facilities, corporate unsecured senior notes (or ‘bonds’) and private placement unsecured notes. Newcrest has sought to structure these debt facilities to have varying maturities so that its refinancing obligations are staged. Although Newcrest currently generates sufficient funds to service its debt requirements, no assurance can be given that Newcrest will be able to meet its financial covenants when required or be able to refinance the debt prior to its expiry on acceptable terms to Newcrest. If Newcrest is unable to meet its financial covenants when required or refinance its external debt on acceptable terms to the Company, its financial condition and ability to continue operating may be adversely affected.
Litigation
Litigation has the potential to materially impact upon Newcrest’s business, operating and financial performance and results. Regardless of the ultimate outcome of litigation (which may be subject to appeal), and whether involving regulatory action or civil claims, litigation may have a material impact on the Company as a result of the costs associated with litigation (some of which may not be recoverable) and the management time associated with defending litigation.
The notes to Newcrest’s Financial Statements provide details regarding certain current and potential litigation involving the Company.
OPERATING AND FINANCIAL REVIEW
Newcrest Mining Limited – Annual Financial Report – Year Ended 30 June 2014 C 44
Forward looking statements
Newcrest provides guidance on aspects of its business including production, cost and capital expenditure which relate to matters in the future (forward looking statements). Forward looking statements inherently involve known and unknown risks, uncertainties and other factors that may cause the Company’s actual results, performance and achievements to differ materially from those indicated in the forward looking statements.
Forward looking statements are based on the Company and its management’s assessment of the financial, market, regulatory and other relevant environments that will exist and affect the Company’s business and operations in the future. There can be no assurance that the assumptions on which forward looking statements are based will prove to be correct, or that the Company’s business or operations will not be affected in any material manner by these or other factors not foreseen or foreseeable by the Company or management or beyond the Company’s control.
Although the Company attempts and has attempted to identify factors that would cause actual actions, events or results to differ materially from those disclosed in forward looking statements, there may be other factors that could cause actual results, performance, achievements or events not to be as anticipated, estimated or intended, and many events are beyond the reasonable control of the Company.
Letter from the Chairman and the Chairman of the Human Resources and Remuneration Committee
Newcrest Mining Limited – Annual Financial Report – Year Ended 30 June 2014 D 1
Dear Shareholder,
On behalf of the Board, we are pleased to introduce Newcrest’s Remuneration Report for the year ended 30 June 2014.
30 June 2014 Performance and Remuneration Outcomes
After a period of major investment and a sustained fall in the gold price, challenging cost and production targets were set for financial year 2014. During the year, safety performance improved, gold production of 2.4 million ounces exceeded guidance and was 14 percent higher than the prior period, and group All-In Sustaining Cost was reduced by 24 percent. The objective to be free cash flow positive was also met reflecting the focus on cash generation.
With respect to the Company’s Short Term Incentive (“STI”) scheme, performance against group measures (represented by safety, costs and earnings) exceeded the targets set at the beginning of the STI performance period. In assessing STI outcomes the Board had regard to the fatality at Telfer during the year, the outcome of the Australian Securities and Investment Commission (“ASIC”) investigation of the Company in relation to contravention of the continuous disclosure rules under the Corporations Act announced on 2 July 2014, and the loss after tax of A$2,221 million (which includes A$2,353 in post-tax asset impairment charges). The Board has accordingly exercised its discretion to make adjustments which it considers appropriate to the STI outcomes.
This is the second consecutive year that the Board has exercised its discretion in relation to STI awards with the agreement of the relevant Executives. In financial year 2013 it exercised its discretion and reduced STI vesting outcomes to between zero and eight percent for all Executives, reflecting the Company’s performance in a challenging operating environment. In financial year ended 30 June 2013 the CEO’s STI was zero. In each year, the Board has given careful and detailed consideration to the exercise of its discretion, and to the final adjustment to outcomes, bearing in mind the above circumstances. Details of STI performance outcomes against group and personal measures for the year ended 30 June 2014 and the outcomes for each Executive Director and Executive Manager are set out in section 6.1.
The 2010 Long Term Incentive (“LTI”) plan vested in November 2013. Based on performance against the applicable measures, the calculated vesting outcome would have been 53.6 percent for LTI participants (compared with vesting of 78.0 percent for the prior year). However, the Board took into account the Company’s financial performance and broader circumstances in the 2013 financial year and agreed, in consultation with the Executives, that the vesting outcome would be reduced by 50 percent, reducing the actual percentage of LTI awarded to Executives down to 26.8 percent. Based on the share price at the time of vesting, this represented 7.6 percent of the value of the rights when issued. The 2011 LTI will vest in September 2014. Although the vesting outcome is not yet known, it is anticipated based on performance against applicable measures that the calculated vesting will be low, noting on present indications that the Return on Capital Employed (ROCE) measure will deliver a zero outcome and reserves growth measures are likely to deliver a low outcome.
Executives received no increase in fixed annual remuneration in the 2014 financial year.
Newcrest Remuneration Review
Over the past twelve months the Board, with the assistance of the Human Resources & Remuneration Committee, and KPMG as its independent remuneration adviser, have undertaken a comprehensive review of Newcrest’s executive remuneration policy and framework, in consultation with major shareholders and stakeholders. We have reviewed the relationship between reward and corporate and personal performance, the design of the LTI and STI schemes, relevant performance measures and levels of fixed and “at risk” pay. In broad terms, the Board has confirmed the Company’s existing remuneration framework and policy, including the design of the LTI and STI schemes, but has made changes to these which, in its view, will
Letter from the Chairman and the Chairman of the Human Resources and Remuneration Committee
Newcrest Mining Limited – Annual Financial Report – Year Ended 30 June 2014 D 2
deliver closer alignment of performance and reward and will strengthen the Company’s focus on its strategic priorities.
Key outcomes of the review which will be implemented in the 2015 financial year are set out in section 3.4 and 3.5 and include the following:
- Adjusting existing LTI measures to ensure that alignment with key strategic growth objectives and long term shareholder value creation is maintained and strengthened, including through replacement of reserves and resource depletion supplemented by additional detailed and specific corporate strategic performance goals pertaining to organisational health, diversity and growth;
- Adding a one year “holding lock” on selling or dealing in LTI shares post vesting, in addition to the current three year vesting period;
- Adjusting aspects of the STI performance measures to strengthen the current focus including optimising existing operations, maintaining growth options and maximising free cash flow;
- Introducing a clawback policy for both the LTI and STI schemes, entitling the Company to recoup or reduce awards of equity or cash; and
- Formalising an overriding Board discretion to adjust STI and LTI reward results to avoid anomalous outcomes.
CEO succession – Sandeep Biswas
Sandeep Biswas succeeded Greg Robinson as Newcrest’s new CEO on 4 July 2014. Details of his remuneration were announced to the market on 23 April 2014 and are detailed in section 5.3.1. Sandeep’s remuneration package was negotiated in the context of a highly competitive recruitment process and sits between the median remuneration and 75th percentile against CEO remuneration paid for Newcrest’s chosen comparator group of companies – being the ASX 11 – 40 (including Industrials Energy and Materials) companies, and Global Gold companies.
CEO transition – Greg Robinson
Greg Robinson was succeeded by Sandeep Biswas as Newcrest’s CEO on 4 July 2014. Details of his remuneration arrangements upon leaving Newcrest were announced to the market on 23 April 2014 and are detailed in section 5.4.1. He received a payment in lieu of the unworked portion of his notice period and his statutory entitlements (unused annual and long service leave) in accordance with the terms of his Executive Service Agreement. He did not receive any other termination payment. Under the relevant LTI Plan Rules, he retains unvested LTI performance rights, pro-rated to his cessation date. Any vesting will be subject to satisfaction of applicable LTI performance measures. He will receive an STI payment of $1.026 million for the year ended 30 June 2014 in the normal STI cycle, based on performance against applicable measures.
Other Executive Leadership Team Changes
In addition to the CEO transition, a number of Executives left the Company during the year. These included Lawrie Conway, Executive General Manager Commercial and West Africa; Stephen Creese, Executive General Manager Corporate Affairs; Brett Fletcher, Executive General Manager Lihir Operations; Scott Langford, General Counsel and Company Secretary; and Peter Smith, Executive General Manager Australian and Indonesian Operations. Debra Stirling, Executive General Manager People and Communications, also left the Company on 4 July 2014. Details of their entitlements on leaving Newcrest are set out in section 5.2 of this report.
Two new appointments were made to the Executive Leadership Team during the year. David Woodall joined the Company as Executive General Manager International Operations on 20 February 2014 and Francesca Lee was appointed as General Counsel and Company Secretary on 31 March 2014. Details in relation to these appointments are set out in section 5.3.2 of this report. Post 30 June 2014, Jane Thomas was appointed as Executive General Manager Human Resources and Communications.

Letter from the Chairman and the Chairman of the Human Resources and Remuneration Committee
Newcrest Mining Limited – Annual Financial Report – Year Ended 30 June 2014 D 3
As a result of these changes, the Company’s Executive Leadership Team is smaller, reflecting Newcrest’s current priorities and its focus on operating discipline and cash generation.
In conclusion, Newcrest remains committed to ensuring that, consistent with the Board’s strategy and policy, Newcrest’s executive remuneration framework and outcomes continue to attract and retain high calibre executives and employees, reward them with appropriate levels of remuneration, and drive strong individual and group performance in the interests of both the Company and its shareholders.
Peter Hay Richard Lee Chairman Chairman, HR and Remuneration Committee
18 August 2014

REMUNERATION REPORT
Newcrest Mining Limited – Annual Financial Report – Year Ended 30 June 2014 D 4
1. REMUNERATION REPORT
This Remuneration Report forms part of the Directors’ Report. It outlines the overall remuneration strategy and framework and the arrangements adopted by the Board for the year ended 30 June 2014. This report has been prepared in accordance with section 300A of the Corporations Act 2001 and its regulations.
This Remuneration Report details the remuneration of the Company’s Key Management Personnel, being the Company’s Non-Executive Directors whose names appear in section 10.3, and the Executives whose names appear in section 5.2. Key Management Personnel are those persons having authority and responsibility for planning, directing and controlling the activities of the Company, directly and indirectly. In this Report, the term “Executive” refers to the Managing Director, Finance Director and Chief Operating Officer and the other Key Management Personnel who are not Directors.
This report has been audited under section 308(3C) of the Corporations Act 2001.
This report is signed in accordance with a resolution of the Directors.
1.1. Contents
1. Remuneration Report ............................................................................................................................ D4
2. Remuneration Governance ................................................................................................................... D5
3. Executive Remuneration Strategy And Framework .............................................................................. D7
4. Remuneration Components ................................................................................................................ D10
5. Executive Service Agreements ........................................................................................................... D18
6. Remuneration Outcomes .................................................................................................................... D24
7. Statutory Remuneration Disclosures ................................................................................................... D28
8. Remuneration Outlook ........................................................................................................................ D32
9. Other Executive Disclosures ............................................................................................................... D37
10. Non-Executive Director Remuneration ................................................................................................ D42
11. Remuneration Consultants .................................................................................................................. D44
REMUNERATION REPORT
Newcrest Mining Limited – Annual Financial Report – Year Ended 30 June 2014 D 5
2. REMUNERATION GOVERNANCE
2.1. Remuneration Committee
The role of the Human Resources and Remuneration Committee is to review, advise and formulate recommendations to the Board in relation to matters within its Charter, to refer these to the Board for determination, and to oversee implementation and administration of major components of the Company’s Board-approved remuneration strategy.
Further details about the Human Resources and Remuneration Committee, its membership, functions and operation, are set out in the Corporate Governance section of the Annual Report. The Human Resources and Remuneration Committee Charter is available on the Company’s website:
http://www.newcrest.com.au/about-us/corporate-governance
2.2. Remuneration Consultants
The Company engages the services of independent and specialist remuneration consultants from time to time to provide recommendations on Executive remuneration. Remuneration consultants are engaged by the Non-Executive Directors and provide remuneration advice in accordance with the requirements of section 300A of the Corporations Act 2001. Remuneration recommendations are made free from any undue influence and a formal declaration to this effect is obtained from each relevant remuneration consultant. Details of remuneration consultants appointed and fees paid to them during the year ended 30 June 2014 are set out in section 11.
2.3. Securities Dealing Policy
The Company’s Executives participate in the equity-based Long Term Incentive Plan (“LTI”) which forms part of their “at risk” remuneration. Rights granted under the LTI (which is described in detail in section 4.3) do not vest until after a three year performance period.
The Company has a Securities Dealing Policy which prohibits the use by Executives and employees of derivatives such as caps, collars, warrants or similar products in relation to Newcrest securities, including shares acquired under the Company’s equity incentive schemes, whether or not they are vested. The policy also prohibits entry into transactions in associated products that operate to limit the economic risk of their security or interest holdings in the Company. The Directors and the Company Secretary are not permitted to enter into margin loans in relation to Newcrest securities at any time and other designated employees must seek approval from the Company Secretary if they intend to enter into such transactions. The Securities Dealing Policy forms part of each employee’s terms of employment.
The Securities Dealing Policy is available on the Company’s website:
www.newcrest.com.au/about-us/corporate-governance
REMUNERATION REPORT
Newcrest Mining Limited – Annual Financial Report – Year Ended 30 June 2014 D 6
2.4. Clawback Policy
The Company provides Executives with two elements of remuneration which are performance based: a Short Term Incentive (“STI”) and the LTI. Both of these are determined in part by the Company’s financial performance.
The Board has adopted a clawback policy, to be included in the 2015 financial year STI and LTI Plan Rules. This will entitle the Board to recoup or reduce awards of cash and equity should these subsequently be found to have been excessive or inappropriate due to circumstances including a participant’s fraud or misconduct, a material misstatement or other event or error in the financial statements of Newcrest or the Newcrest Group, or other circumstances which the Board determines in good faith have resulted in an inappropriate benefit.
For the year ended 30 June 2014, STI and LTI Plan Rules included provisions pursuant to which, at the Board’s discretion, participants may forfeit entitlements to receive cash or unvested equity remuneration including due to fraudulent conduct. During the year ended 30 June 2014 no performance-based remuneration was recouped pursuant to these provisions.
2.5. Board Discretion
An overriding Board discretion will be introduced into the 2015 financial year STI and LTI Plan Rules. This will enable an adjustment to anomalous STI and LTI outcomes to properly reflect performance and to ensure alignment of awards of at-risk remuneration with group strategy and long term shareholder value creation.
REMUNERATION REPORT
Newcrest Mining Limited – Annual Financial Report – Year Ended 30 June 2014 D 7
3. EXECUTIVE REMUNERATION STRATEGY AND FRAMEWORK
3.1. Remuneration Strategy
The Board’s remuneration policy is to provide market-competitive levels of remuneration for Executives, having regard to both the size and complexity of the Company, and the level of work and the impact that those Executives can have on Company performance. Newcrest’s policy is to offer a competitive total remuneration package for Executives, benchmarked against comparable companies in Australia and global mining companies.
The key elements of the remuneration strategy are:
- Appropriate levels of at-risk performance pay to encourage, recognise and reward high performance; - Company performance measures which align performance incentives with the long-term interests of
shareholders; - Attraction and retention of talented, high performing executives; and - A remuneration structure that provides the appropriate balance in risk and reward sharing between
each participant and the Company.
The Board, in consultation with the Human Resources and Remuneration Committee, reviewed the Company’s remuneration strategy during the year ended 30 June 2014, as part of the Board’s broader remuneration review. The Board confirmed that the Company’s remuneration strategy remained appropriate. The Board also believes that performance incentives remain aligned with the long-term interests of shareholders.
Further details of the outcomes of the Board’s remuneration review, to be implemented during the 2015 financial year, are set out in section 8 of this report.
3.2. Remuneration Framework and Mix
Executive remuneration comprises both fixed and variable components. Fixed remuneration is set with reference to fixed remuneration paid by a comparator group of companies for comparable roles, being the ASX 11 – 40, Global Gold and ASX Industrials, Energy and Materials 11-40. The policy also seeks to align the interests of Executives and shareholders by ensuring an appropriate level of at-risk performance pay across the Company, linking incentives and performance measures to both Company and individual performance. Performance linked compensation includes both short and long-term incentives, and is designed to reward Executives for increasing shareholder value by meeting or exceeding their Company and, where applicable, individual objectives.
3.3. Relationship Between Policy and Corporate Performance
The Board takes the view that employee incentive schemes are important elements of remuneration that provide tangible incentives to Executives to improve the Company’s performance in both the short term and the longer term.
To ensure the remuneration policy fully supports the Company’s commitment to high performance and to continue to attract high calibre talent, remuneration levels must be competitive, but oriented towards variable, performance-based incentives. These involve meeting robust performance hurdles to increase shareholder value and deliver variable rewards depending on the achievement of those hurdles.
REMUNERATION REPORT
Newcrest Mining Limited – Annual Financial Report – Year Ended 30 June 2014 D 8
3.4. Executive Remuneration Review
The Board reviewed the Company’s executive remuneration strategy, policy and practices during the year ended 30 June 2014. This review encompassed the structure of the STI and LTI schemes, STI and LTI performance hurdles, quantum and mix of remuneration, and the Company’s remuneration governance framework, against its strategic corporate priorities. In undertaking the review, the Board consulted extensively with key shareholders and stakeholders and appointed KPMG as its independent remuneration advisor. The key outcomes of the review are being implemented with effect from commencement of the 2015 financial year as set out below.
Strategy and Policy
The Company’s remuneration strategy and policy, as stated above, were confirmed by the Board, noting particular focus on performance measures aligned with long-term value drivers in the gold sector.
Remuneration Benchmarking
The Board determined that the comparative benchmarks most relevant to Newcrest for remuneration purposes were those for comparable roles in the ASX 11- 40 (including ASX Energy, Industrials and Materials companies) and Global Gold companies.
Remuneration Targets
Executive remuneration packages will target fixed pay at the 50th percentile and total remuneration packages (fixed plus “at risk”) at the 75th percentile for equivalent / comparable roles, tailored to reflect the relative experience and particular skills of the individuals in those roles.
STI Plan
The Board reviewed the Company’s STI plan and concluded that it remains appropriate and effective in driving individual Executive and Company performance, consistent with the Company’s remuneration strategy and policy.
The Board determined that it would retain three of the four current “group” performance measures - Safety, Earnings and Costs. In relation to the Safety measure, a stronger focus on timely close-out of actions arising from Significant Potential Incidents (“SPIs”), being incidents that had the potential for fatality or serious injury, will be maintained with a view to driving future reduction and prevention of these incidents.
In relation to the fourth “group” measure, the Board determined that this should continue to be selected at the beginning of each STI year, but with an emphasis on outcomes which drive key aspects of corporate strategy. For the 2015 financial year, the measure will be generation of free cash flow.
With respect to the four STI “personal” measures, the Board again determined that these should be retained, but set each year with a focus on individual contributions to achievement of strategic corporate cost and efficiency outcomes with the former “discretionary” personal measure to be set on the same principles.
The Board has increased the weighting of Company measures to 60 percent (previously 44 percent), see section 4.2.1, on the basis of the ability of Executives to influence Company outcomes through their personal actions.
REMUNERATION REPORT
Newcrest Mining Limited – Annual Financial Report – Year Ended 30 June 2014 D 9
LTI Plan
In relation to the current LTI performance measures - Comparative Costs, Return on Capital Employed (ROCE), and Reserves Growth - the Board confirmed that it would retain three equally weighted measures.
The Board considers that the Comparative Costs measure continues to be relevant and effective in driving performance.
The ROCE measure remains relevant and will continue as an LTI measure, subject to adjustment of its vesting scale to ensure that it remains achievable and effective as an incentive in the present operating environment.
With respect to Reserves Growth, the Board, noting the Company’s substantial long-life reserves base, takes the view that further reserves growth of itself is less of a priority in the immediate future, and has chosen reserves and resources depletion replacement as an alternative measure, to be supplemented by achievement of additional clearly defined strategic corporate priorities.
Further details of changes to the LTI and STI schemes are set out in the tables at section 8 of this report.
3.5. STI and LTI governance
“Holding lock” on Vested LTI Shares
The LTI vesting period remains three years, but for participating Executives, an additional one year “lock” on sale or dealing in vested LTI shares will be introduced in the 2015 financial.
Clawback for STI and LTI
As detailed in section 2.4, the Board determined that a clawback policy will be introduced into both the STI and LTI schemes.
Overriding Board Discretion
As detailed in section 2.5, the Board determined that an overriding Board discretion will be introduced in the 2015 financial year STI and LTI Plan Rules, which will enable adjustment of STI and LTI results to avoid anomalous outcomes.
REMUNERATION REPORT
Newcrest Mining Limited – Annual Financial Report – Year Ended 30 June 2014 D 10
4. REMUNERATION COMPONENTS
The Company’s executive reward structure consists of the following three elements:
- Fixed remuneration; - At-risk cash remuneration; and - At-risk equity-based remuneration.
4.1. Fixed Annual Remuneration
The Board annually reviews and determines fixed remuneration for the Managing Director. The Managing Director does the same with respect to his direct reports, the Executive Management Group, subject to the Board’s oversight. Fixed annual remuneration, inclusive of the required superannuation contribution amount, is reviewed annually following the end of the financial year. Any adjustment is effective October of that year. There was no adjustment in October 2013.
Fixed remuneration for Executives as at 30 June 2014 is set out in section 5.2.
4.2. Variable Cash Remuneration - STI Plan
The STI Plan is designed to align reward to the Company’s strategy and performance. The Plan includes both Company and personal measures.
The quantum of the entitlement is based on a percentage of each Executive’s fixed remuneration. For the year ended 30 June 2014, the STI at target performance for Executives was set at 60 percent of fixed annual remuneration (80 percent for the Chief Operating Officer) with a maximum possible award of up to 120 percent of fixed annual remuneration (160 percent for the Chief Operating Officer).
4.2.1. STI Performance Measures
Under the 30 June 2014 financial year STI, approximately 44 percent of the STI outcome depended on Company performance and approximately 56 percent on individual personal performance. In the 2015 financial year this allocation will shift to a 60 percent weighting on Company performance and a 40 percent weighting on personal measures.
Company Performance Measures
These relate to:
- Safety; - Earnings; - Costs; and - One further Company performance measure determined annually.
Each measure has equal weighting in the overall Company Performance outcome.
The ‘Safety’ measure is based 50 percent on Total Recordable Injury Frequency Rate (TRIFR) and 50 percent on actioning of the safety risk list. The measures quantify how much of the primary and secondary safety risk lists must be actioned to achieve the measures. The safety measure is seen as critical to the successful operation of the Company’s business.
‘Earnings’ relates to targets for net profit after tax and minority interests before significant items. The earnings target is a direct financial measurement of the Company’s performance. The results are adjusted for the effect of commodity prices, foreign exchange rates and other items determined by the Board.
‘Costs’ relates to All-in-Sustaining Costs (“AISC”). AISC is a metric calculated with reference to the World Gold Council Guidance Note on Non-GAAP Metrics, released 27 June 2013. The AISC cost measurement more fully defines the costs associated with producing gold from operations.
REMUNERATION REPORT
Newcrest Mining Limited – Annual Financial Report – Year Ended 30 June 2014 D 11
The other Company performance measure is a discretionary assessment by the Board of the overall performance of the Company in areas of key strategic performance. In the year ended 30 June 2014, the Board in assessing discretionary performance took into account the fact that the Company had met or exceeded the majority of its production, costs and financial targets.
Personal Performance Measures
Personal performance is measured against a set of Key Performance Indicators established by the Board for the Managing Director and by the Managing Director in consultation with the Board for the other Executives. The Key Performance Indicators aim to encourage exceptional performance in the areas that will help drive the Company’s longer-term strategy. The discretionary component is based on achievement of personal goals and overall work performance.
The personal performance measures for the Executives for the year ended 30 June 2014 included role specific elements relating to matters such as delivery of key corporate objectives, delivery of capital projects, development of processes and building capacity, productivity, cost measures and positioning future growth opportunities.
Each performance measure (other than the discretionary measure) has an upper limit that caps the outcome of the performance measure and a minimum threshold below which the measured performance outcome is zero.
For the year ended 30 June 2014, personal performance measures for Greg Robinson, the former Managing Director, were set by the Board to align with the Company’s strategic goals:
- Operations – achievement of production and costs outcomes against budget and guidance; - Portfolio and balance sheet integrity; - Group performance against budget and the contribution of the Executive team to achieving this based
on defined deliverables around projects, operational performance and other key areas of responsibility in each case; and
- Corporate strategy, including operating discipline, costs reduction and cash generation.
Deliverables against which the performance of other Executives were measured included, as relevant, production delivery and performance for each operation, cost and capital outcomes for operations and projects, province planning, and broader corporate strategic planning and outcomes.
Details of the STI outcomes for the Managing Director and CEO and for each other Executive are set out in section 6.1 of this report.
REMUNERATION REPORT
Newcrest Mining Limited – Annual Financial Report – Year Ended 30 June 2014 D 12
4.2.2. Summary of the key features of the STI Plan
What is the Short Term Incentive Plan? An incentive plan, under which Executives are, subject to satisfaction of specified performance measures, granted a cash amount based on a percentage range of each Executive’s fixed remuneration. Performance is assessed against a combination of Company and individual measures.
What is the period over which the performance is assessed?
The assessment period is the financial year preceding the payment date of the STI (i.e. 1 July to 30 June).
When is the STI grant paid to Executives? The STI amount will be paid to each Executive who satisfies applicable performance measures in October 2014, following assessment of performance during the year ended 30 June 2014 performance period against the pre-determined measures.
Why does the Board consider the STI an appropriate incentive?
An STI is a globally recognised form of reward for management, aimed at ensuring focus and alignment with Company goals and strategy. Based on both Company and individual measures, and in conjunction with other factors, the Board believes that it helps encourage and reward high performance.
What are the performance conditions under the STI?
The performance conditions under the 2014 financial year STI comprise Company performance measures and personal performance measures.
Company performance measures relate to:
safety; earnings; costs; and one further discretionary Company performance
measure assessed by the Board.
Personal performance measures are specific to each Executive’s role.
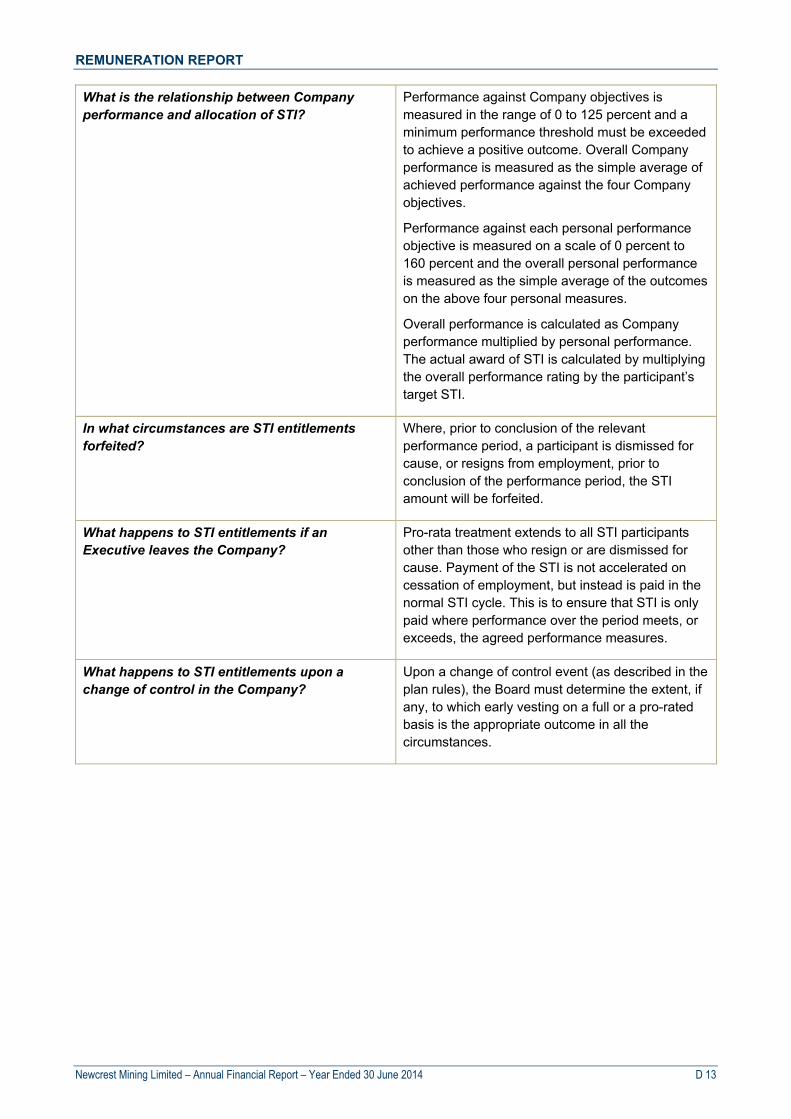
REMUNERATION REPORT
Newcrest Mining Limited – Annual Financial Report – Year Ended 30 June 2014 D 13
What is the relationship between Company performance and allocation of STI?
Performance against Company objectives is measured in the range of 0 to 125 percent and a minimum performance threshold must be exceeded to achieve a positive outcome. Overall Company performance is measured as the simple average of achieved performance against the four Company objectives.
Performance against each personal performance objective is measured on a scale of 0 percent to 160 percent and the overall personal performance is measured as the simple average of the outcomes on the above four personal measures.
Overall performance is calculated as Company performance multiplied by personal performance. The actual award of STI is calculated by multiplying the overall performance rating by the participant’s target STI.
In what circumstances are STI entitlements forfeited?
Where, prior to conclusion of the relevant performance period, a participant is dismissed for cause, or resigns from employment, prior to conclusion of the performance period, the STI amount will be forfeited.
What happens to STI entitlements if an Executive leaves the Company?
Pro-rata treatment extends to all STI participants other than those who resign or are dismissed for cause. Payment of the STI is not accelerated on cessation of employment, but instead is paid in the normal STI cycle. This is to ensure that STI is only paid where performance over the period meets, or exceeds, the agreed performance measures.
What happens to STI entitlements upon a change of control in the Company?
Upon a change of control event (as described in the plan rules), the Board must determine the extent, if any, to which early vesting on a full or a pro-rated basis is the appropriate outcome in all the circumstances.

REMUNERATION REPORT
Newcrest Mining Limited – Annual Financial Report – Year Ended 30 June 2014 D 14
4.3. Variable Equity-Based Remuneration - LTI Plan
4.3.1. LTI Grant
The LTI grant comprises an allocation of performance rights based on a percentage of each Executive’s fixed annual remuneration. For the Executive Directors the award is based on performance rights with a face value equal to 100 percent of fixed annual remuneration and for the other Executives, performance rights with a face value equal to 60 percent. This grant constitutes the maximum award of performance shares at the conclusion of the performance period.
An LTI grant was made in September 2013 with a performance period ending on 30 June 2016. This grant will vest, subject to satisfaction of applicable performance conditions, on 23 September 2016.
4.3.2. LTI Performance Measures – year ended 30 June 2014
The Company performance measures, assessed over a three-year performance period, are three equally weighted performance measures:
- Comparative Cost Position; - Reserves Growth; and - Return on Capital Employed (“ROCE”).
Each LTI measure was chosen by the Board as it is a key driver of Company performance. Reserves Growth and Comparative Cost Position are drivers of shareholder value in a gold mining company, and ROCE is a direct measure of capital efficiency. Performance against each measure accounts for one third of Performance Rights, which may vest in any grant of LTI entitlements. All outcomes of the three LTI performance measures are independently reviewed and verified.
Comparative Cost Position
Description
The Company’s measure for the Comparative Cost Position Performance Condition is the “All-in Sustaining Costs” (“AISC”) measure, as determined and reported in accordance with the World Gold Council Guidance Note on Non-GAAP Metrics: All-in Sustaining Costs and All-in Costs adopted by the Company in relation to costs reporting.
The AISC is an extension of the existing “Cash Cost” metric and incorporates costs related to sustaining production. GFMS data is used for performance measurement over the LTI’s three-year vesting period. The comparison is made by ranking the Company’s performance against all other producers included in the GFMS Precious Metals Cost Service in accordance with their AISC.
Performance Metric
At or above the 50th percentile leads to a zero award of these Performance Rights;
Less than the 50th percentile but at or above the 25th percentile leads to a 50 percent award of these Performance Rights;
Below the 25th percentile but at or above the 10th percentile leads to an 80 percent award of these Performance Rights;
Below the 10th percentile leads to a 100 percent award of these Performance Rights.
Straight line vesting occurs between each of these thresholds.
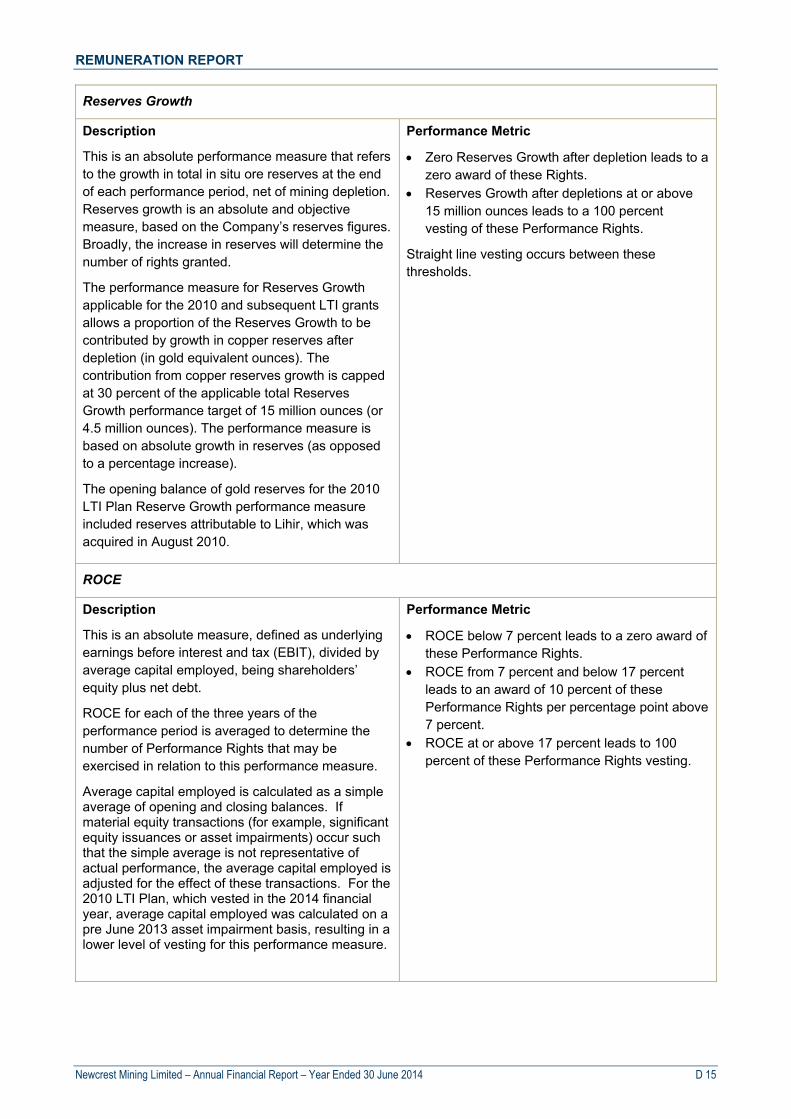
REMUNERATION REPORT
Newcrest Mining Limited – Annual Financial Report – Year Ended 30 June 2014 D 15
Reserves Growth
Description
This is an absolute performance measure that refers to the growth in total in situ ore reserves at the end of each performance period, net of mining depletion. Reserves growth is an absolute and objective measure, based on the Company’s reserves figures. Broadly, the increase in reserves will determine the number of rights granted.
The performance measure for Reserves Growth applicable for the 2010 and subsequent LTI grants allows a proportion of the Reserves Growth to be contributed by growth in copper reserves after depletion (in gold equivalent ounces). The contribution from copper reserves growth is capped at 30 percent of the applicable total Reserves Growth performance target of 15 million ounces (or 4.5 million ounces). The performance measure is based on absolute growth in reserves (as opposed to a percentage increase).
The opening balance of gold reserves for the 2010 LTI Plan Reserve Growth performance measure included reserves attributable to Lihir, which was acquired in August 2010.
Performance Metric
Zero Reserves Growth after depletion leads to a zero award of these Rights.
Reserves Growth after depletions at or above 15 million ounces leads to a 100 percent vesting of these Performance Rights.
Straight line vesting occurs between these thresholds.
ROCE
Description
This is an absolute measure, defined as underlying earnings before interest and tax (EBIT), divided by average capital employed, being shareholders’ equity plus net debt.
ROCE for each of the three years of the performance period is averaged to determine the number of Performance Rights that may be exercised in relation to this performance measure.
Average capital employed is calculated as a simple average of opening and closing balances. If material equity transactions (for example, significant equity issuances or asset impairments) occur such that the simple average is not representative of actual performance, the average capital employed is adjusted for the effect of these transactions. For the 2010 LTI Plan, which vested in the 2014 financial year, average capital employed was calculated on a pre June 2013 asset impairment basis, resulting in a lower level of vesting for this performance measure.
Performance Metric
ROCE below 7 percent leads to a zero award of these Performance Rights.
ROCE from 7 percent and below 17 percent leads to an award of 10 percent of these Performance Rights per percentage point above 7 percent.
ROCE at or above 17 percent leads to 100 percent of these Performance Rights vesting.
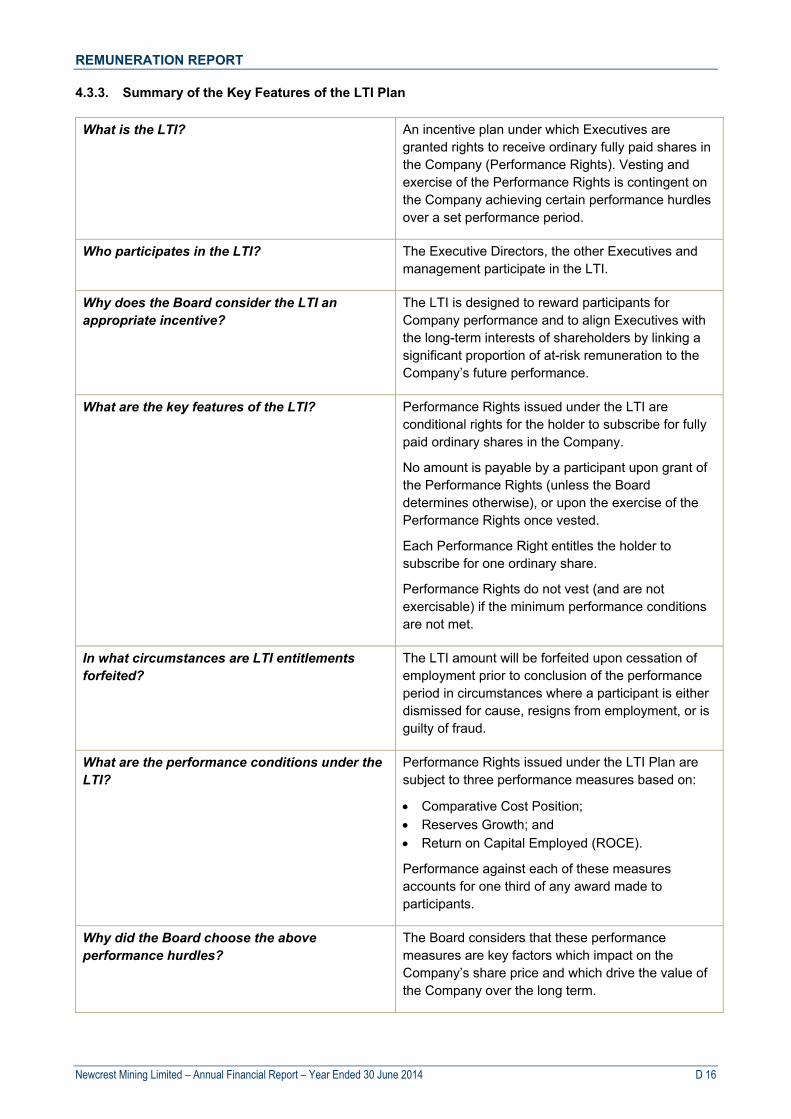
REMUNERATION REPORT
Newcrest Mining Limited – Annual Financial Report – Year Ended 30 June 2014 D 16
4.3.3. Summary of the Key Features of the LTI Plan
What is the LTI? An incentive plan under which Executives are granted rights to receive ordinary fully paid shares in the Company (Performance Rights). Vesting and exercise of the Performance Rights is contingent on the Company achieving certain performance hurdles over a set performance period.
Who participates in the LTI? The Executive Directors, the other Executives and management participate in the LTI.
Why does the Board consider the LTI an appropriate incentive?
The LTI is designed to reward participants for Company performance and to align Executives with the long-term interests of shareholders by linking a significant proportion of at-risk remuneration to the Company’s future performance.
What are the key features of the LTI? Performance Rights issued under the LTI are conditional rights for the holder to subscribe for fully paid ordinary shares in the Company.
No amount is payable by a participant upon grant of the Performance Rights (unless the Board determines otherwise), or upon the exercise of the Performance Rights once vested.
Each Performance Right entitles the holder to subscribe for one ordinary share.
Performance Rights do not vest (and are not exercisable) if the minimum performance conditions are not met.
In what circumstances are LTI entitlements forfeited?
The LTI amount will be forfeited upon cessation of employment prior to conclusion of the performance period in circumstances where a participant is either dismissed for cause, resigns from employment, or is guilty of fraud.
What are the performance conditions under the LTI?
Performance Rights issued under the LTI Plan are subject to three performance measures based on:
Comparative Cost Position; Reserves Growth; and Return on Capital Employed (ROCE).
Performance against each of these measures accounts for one third of any award made to participants.
Why did the Board choose the above performance hurdles?
The Board considers that these performance measures are key factors which impact on the Company’s share price and which drive the value of the Company over the long term.
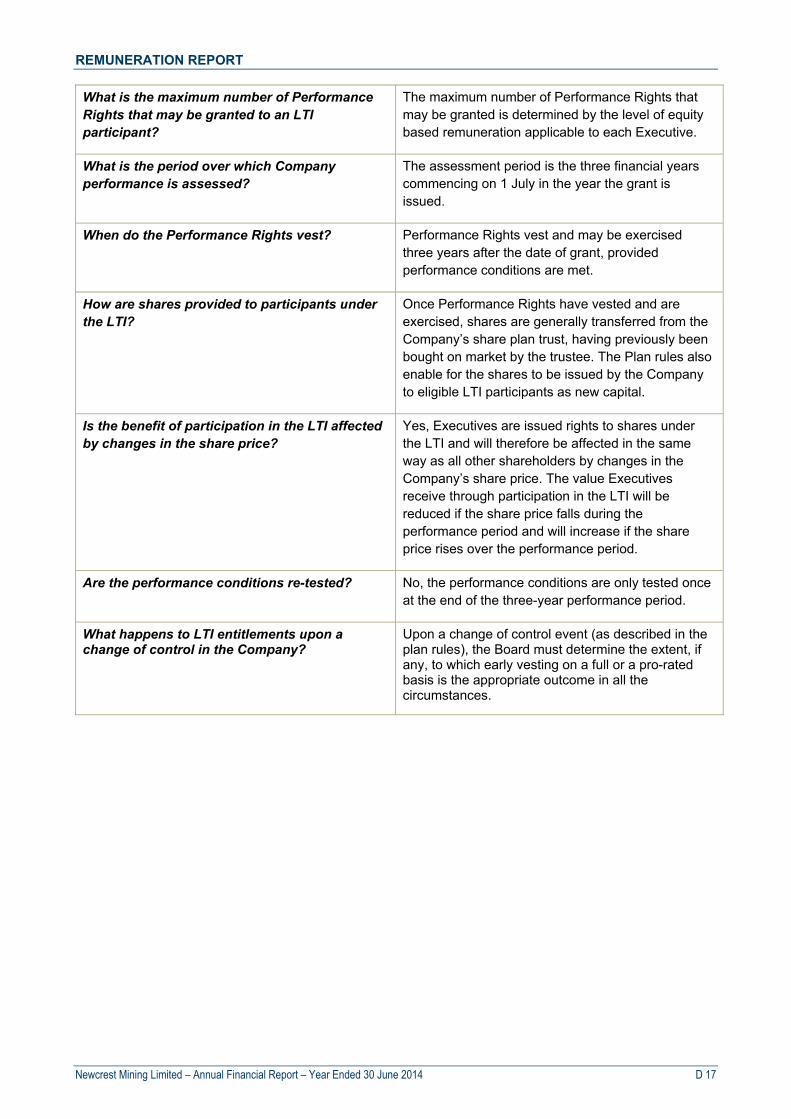
REMUNERATION REPORT
Newcrest Mining Limited – Annual Financial Report – Year Ended 30 June 2014 D 17
What is the maximum number of Performance Rights that may be granted to an LTI participant?
The maximum number of Performance Rights that may be granted is determined by the level of equity based remuneration applicable to each Executive.
What is the period over which Company performance is assessed?
The assessment period is the three financial years commencing on 1 July in the year the grant is issued.
When do the Performance Rights vest? Performance Rights vest and may be exercised three years after the date of grant, provided performance conditions are met.
How are shares provided to participants under the LTI?
Once Performance Rights have vested and are exercised, shares are generally transferred from the Company’s share plan trust, having previously been bought on market by the trustee. The Plan rules also enable for the shares to be issued by the Company to eligible LTI participants as new capital.
Is the benefit of participation in the LTI affected by changes in the share price?
Yes, Executives are issued rights to shares under the LTI and will therefore be affected in the same way as all other shareholders by changes in the Company’s share price. The value Executives receive through participation in the LTI will be reduced if the share price falls during the performance period and will increase if the share price rises over the performance period.
Are the performance conditions re-tested? No, the performance conditions are only tested once at the end of the three-year performance period.
What happens to LTI entitlements upon a change of control in the Company?
Upon a change of control event (as described in the plan rules), the Board must determine the extent, if any, to which early vesting on a full or a pro-rated basis is the appropriate outcome in all the circumstances.
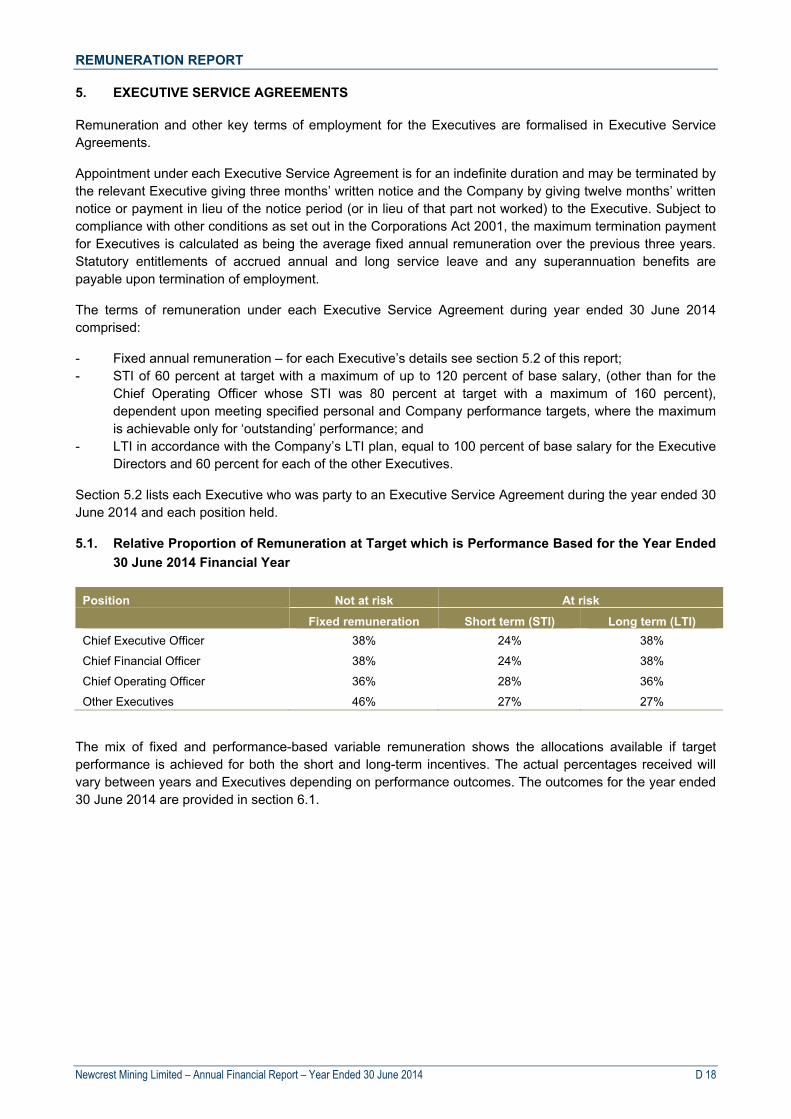
REMUNERATION REPORT
Newcrest Mining Limited – Annual Financial Report – Year Ended 30 June 2014 D 18
5. EXECUTIVE SERVICE AGREEMENTS
Remuneration and other key terms of employment for the Executives are formalised in Executive Service Agreements.
Appointment under each Executive Service Agreement is for an indefinite duration and may be terminated by the relevant Executive giving three months’ written notice and the Company by giving twelve months’ written notice or payment in lieu of the notice period (or in lieu of that part not worked) to the Executive. Subject to compliance with other conditions as set out in the Corporations Act 2001, the maximum termination payment for Executives is calculated as being the average fixed annual remuneration over the previous three years. Statutory entitlements of accrued annual and long service leave and any superannuation benefits are payable upon termination of employment.
The terms of remuneration under each Executive Service Agreement during year ended 30 June 2014 comprised:
- Fixed annual remuneration – for each Executive’s details see section 5.2 of this report; - STI of 60 percent at target with a maximum of up to 120 percent of base salary, (other than for the
Chief Operating Officer whose STI was 80 percent at target with a maximum of 160 percent), dependent upon meeting specified personal and Company performance targets, where the maximum is achievable only for ‘outstanding’ performance; and
- LTI in accordance with the Company’s LTI plan, equal to 100 percent of base salary for the Executive Directors and 60 percent for each of the other Executives.
Section 5.2 lists each Executive who was party to an Executive Service Agreement during the year ended 30 June 2014 and each position held.
5.1. Relative Proportion of Remuneration at Target which is Performance Based for the Year Ended
30 June 2014 Financial Year
Position Not at risk At risk
Fixed remuneration Short term (STI) Long term (LTI)
Chief Executive Officer 38% 24% 38%
Chief Financial Officer 38% 24% 38%
Chief Operating Officer 36% 28% 36%
Other Executives 46% 27% 27%
The mix of fixed and performance-based variable remuneration shows the allocations available if target performance is achieved for both the short and long-term incentives. The actual percentages received will vary between years and Executives depending on performance outcomes. The outcomes for the year ended 30 June 2014 are provided in section 6.1.
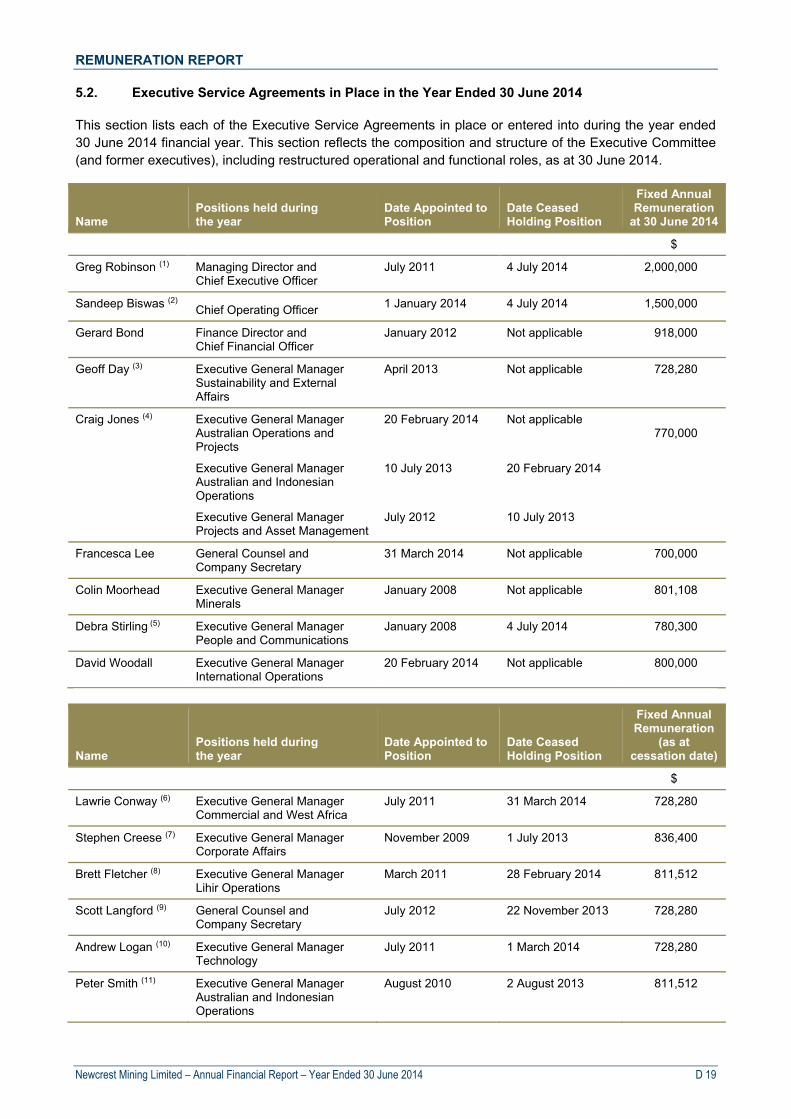
REMUNERATION REPORT
Newcrest Mining Limited – Annual Financial Report – Year Ended 30 June 2014 D 19
5.2. Executive Service Agreements in Place in the Year Ended 30 June 2014
This section lists each of the Executive Service Agreements in place or entered into during the year ended 30 June 2014 financial year. This section reflects the composition and structure of the Executive Committee (and former executives), including restructured operational and functional roles, as at 30 June 2014.
Name Positions held during the year
Date Appointed to Position
Date Ceased Holding Position
Fixed AnnualRemuneration
at 30 June 2014
$
Greg Robinson (1) Managing Director and Chief Executive Officer
July 2011 4 July 2014 2,000,000
Sandeep Biswas (2) Chief Operating Officer 1 January 2014 4 July 2014 1,500,000
Gerard Bond Finance Director and Chief Financial Officer
January 2012 Not applicable 918,000
Geoff Day (3) Executive General Manager Sustainability and External Affairs
April 2013 Not applicable 728,280
Craig Jones (4) Executive General Manager Australian Operations and Projects
20 February 2014 Not applicable 770,000
Executive General Manager Australian and Indonesian Operations
10 July 2013 20 February 2014
Executive General Manager Projects and Asset Management
July 2012 10 July 2013
Francesca Lee General Counsel and Company Secretary
31 March 2014 Not applicable 700,000
Colin Moorhead Executive General Manager Minerals
January 2008 Not applicable 801,108
Debra Stirling (5) Executive General Manager People and Communications
January 2008 4 July 2014 780,300
David Woodall Executive General Manager International Operations
20 February 2014 Not applicable 800,000
Name Positions held during the year
Date Appointed to Position
Date Ceased Holding Position
Fixed Annual Remuneration
(as at cessation date)
$
Lawrie Conway (6) Executive General Manager Commercial and West Africa
July 2011 31 March 2014 728,280
Stephen Creese (7) Executive General Manager Corporate Affairs
November 2009 1 July 2013 836,400
Brett Fletcher (8) Executive General Manager Lihir Operations
March 2011 28 February 2014 811,512
Scott Langford (9) General Counsel and Company Secretary
July 2012 22 November 2013 728,280
Andrew Logan (10) Executive General Manager Technology
July 2011 1 March 2014 728,280
Peter Smith (11) Executive General Manager Australian and Indonesian Operations
August 2010 2 August 2013 811,512
REMUNERATION REPORT
Newcrest Mining Limited – Annual Financial Report – Year Ended 30 June 2014 D 20
(1) On 4 July 2014 Greg Robinson was succeeded by Sandeep Biswas as Newcrest’s Managing Director and Chief Executive Officer. He received a payment in lieu of the unworked portion of his notice period and his statutory entitlements in accordance with the terms of his Executive Service Agreement. He did not receive a termination payment. Under the relevant LTI Plan Rules, he retained unvested LTI performance rights, pro-rated to his cessation date. Any vesting will be subject to satisfaction of applicable LTI performance measures. He will receive an STI payment for the year ended 30 June 2014 financial year in the normal STI cycle, based on performance against applicable measures.
(2) On 4 July 2014 Sandeep Biswas was appointed Managing Director and Chief Executive Officer. Details of his remuneration package and new Executive Services Agreement from that date were announced to the market on 23 April 2014 and are set out in section 5.3.1.
(3) On 10 July 2014 the Company announced the resignation of Geoff Day to the market. He will leave the Company during the September 2014 quarter, on a date to be advised. He will be paid his statutory entitlements and will forfeit his unvested LTI performance rights. He will receive an STI payment for the year ended 30 June 2014 financial year in the normal STI cycle, based on performance against applicable measures.
(4) In addition to his role as Executive General Manager Australian and Indonesian Operations, Craig Jones was also Acting Chief Operating Officer for the period 11 November 2013 to 31 December 2013.
(5) On 4 July 2014 Debra Stirling left the Company. She received payment in lieu of her notice period in accordance with the terms of her Executive Service Agreement and her statutory entitlements. Under the relevant LTI Plan Rules, she retained unvested LTI performance rights, pro-rated to her cessation date. Any vesting will be subject to satisfaction of applicable LTI performance measures. She will receive an STI payment for the year ended 30 June 2014 financial year in the normal STI cycle, based on performance against applicable measures.
(6) On 31 March 2014 Lawrie Conway left the Company as a result of redundancy. He received payment in lieu of his notice period in accordance with the terms of his Executive Service Agreement and his statutory entitlements. Under the relevant LTI Plan Rules, he retained unvested LTI performance rights, pro-rated to his cessation date. Any vesting will be subject to satisfaction of applicable LTI performance measures. He will receive an STI payment for the year ended 30 June 2014 financial year in the normal STI cycle, based on performance against applicable measures, pro-rated to his cessation date.
(7) On 1 July 2013 Stephen Creese retired from the Company. Under the relevant LTI Plan Rules, he retained unvested LTI performance rights, pro-rated to his cessation date. Any vesting will be subject to satisfaction of applicable LTI performance measures. He was not eligible to participate in the year ended 30 June 2014 STI, nor in the year ended 30 June 2014 LTI grant. Following his retirement, he was engaged as a consultant by the Company, in the ordinary course of its business and on arms-length terms.
(8) On 28 February 2014 Brett Fletcher left the Company as a result of redundancy. He received payment in lieu of his notice period in accordance with the terms of his Executive Service Agreement and his statutory entitlements. Under the relevant LTI Plan Rules, he retained unvested LTI performance rights, pro-rated to his cessation date. Any vesting will be subject to satisfaction of applicable LTI performance measures. He will receive an STI payment for the year ended 30 June 2014 financial year in the normal STI cycle, based on performance against applicable measures, pro-rated to his cessation date. Following his cessation, Brett was engaged as a consultant by the Company, in the ordinary course of its business and on arms-length terms.
REMUNERATION REPORT
Newcrest Mining Limited – Annual Financial Report – Year Ended 30 June 2014 D 21
(9) As announced to the market on 18 November 2013, on 22 November 2013 Scott Langford left the Company by agreement with the Company. Under the relevant LTI Plan Rules, he retained unvested LTI performance rights, pro-rated to his cessation date. Any vesting will be subject to satisfaction of applicable LTI performance measures. He will receive an STI payment for the year ended 30 June 2014 financial year in the normal STI cycle, based on performance against applicable measures, pro-rated to his cessation date. He was not eligible to participate in the 2013 LTI grant. He also received an ex gratia payment from the Company.
(10) On 28 February 2014 Andrew Logan ceased as a member of the Executive Committee but remains employed by Newcrest. His remuneration as disclosed in tables 7.1 and 7.4 relates to the period during which he was an Executive Committee member.
(11) On 2 August 2013 Peter Smith left the Company as a result of redundancy. He received payment in lieu of his notice period in accordance with the terms of his Executive Service Agreement and his statutory entitlements. Under the relevant LTI Plan Rules, he retained unvested LTI performance rights, pro-rated to his cessation date. Any vesting will be subject to satisfaction of applicable LTI performance measures. He was not eligible to participate in the year ended 30 June 2014 STI, nor in the year ended 30 June 2014 LTI grant.
REMUNERATION REPORT
Newcrest Mining Limited – Annual Financial Report – Year Ended 30 June 2014 D 22
5.3. Executive Director and Executive Service Agreements Entered into in the Year Ended 30 June
2014
5.3.1. Sandeep Biswas
Sandeep Biswas commenced employment with the Company as Chief Operating Officer and was appointed as an Executive Director, on 1 January 2014. He succeeded Greg Robinson as Managing Director and Chief Executive Officer on 4 July 2014.
Chief Operating Officer Executive Service Agreement (1 January 2014 – 3 July 2014)
The terms of Sandeep Biswas’ Executive Service Agreement are as described earlier in section 5.of The Agreement sets out his duties and responsibilities.
The terms of remuneration payable to Sandeep Biswas as Chief Operating Officer included:
- Base salary of $1,500,000; - STI of 80 percent of base salary at target and up to 160 percent of base salary dependent on meeting
specified personal and Group performance targets, where 160 percent is achievable only for “outstanding” performance;
- LTI in accordance with the Company’s LTI plan, based on performance rights with a face value equal to 100 percent of base salary;
- Two equity grants of $500,000 (at market value) in Newcrest ordinary shares offered as “sign-on” incentives in a highly competitive engagement process. These grants are to be made in October 2014 and October 2015 and will be settled in either equity or cash, at the Company’s discretion. Both grants are subject to Sandeep Biswas’ ongoing satisfactory performance and continuing employment at the relevant grant dates; and
- Compensation for statutory entitlements of accrued annual and long service leave and any superannuation benefits, are payable upon termination of employment.
Managing Director and Chief Executive Officer Executive Service Agreement (4 July 2014 onwards)
The Agreement sets out Sandeep’s duties and responsibilities.
The terms of remuneration payable to Sandeep Biswas as Managing Director and Chief Executive Officer include:
- Base salary of $2,300,000; - STI of 100 percent of base salary at target and up to 200 percent of base salary dependent on
meeting specified personal and Group performance targets, where 200 percent is achievable only for “outstanding” performance;
- LTI in accordance with the Company’s LTI plan, based on performance rights with a face value equal to 150 percent of base salary;
- The two equity grants of $500,000 (at market value) in Newcrest ordinary shares offered as “sign-on” incentives in a highly competitive recruitment process which are carried over and retained from the Chief Operating Officer Executive Service Agreement; and
- Compensation for statutory entitlements of accrued annual and long service leave and any superannuation benefits, are payable upon termination of employment.
5.3.2. Other Appointments
The appointments of David Woodall and Francesca Lee were made in accordance with the Executive Service Agreement terms described earlier in section 5. They each participated in the STI plan pro-rated for the period worked during the year ended 30 June 2014. They did not receive a grant under the LTI plan for the year ended 30 June 2014, and will be eligible to participate in the 2015 financial year LTI plan.

REMUNERATION REPORT
Newcrest Mining Limited – Annual Financial Report – Year Ended 30 June 2014 D 23
5.4. Existing Executive Director Service Agreements
5.4.1. Greg Robinson
Greg Robinson commenced employment with the Company as Executive General Manager Finance and Chief Financial Officer on 3 November 2006 and was appointed to the Board as Director Finance on 23 November 2006. Effective 1 July 2011, Greg Robinson was appointed Managing Director and Chief Executive Officer.
The terms of remuneration payable to Greg Robinson as Managing Director included:
- Base salary of $2,000,000; - STI of 60 percent of base salary at target and up to 120 percent of base salary dependent on meeting
specified personal and Group performance targets, where 120 percent is achievable only for “outstanding” performance;
- LTI in accordance with the Company’s LTI plan, equal to 100 percent of base salary; - Compensation for statutory entitlements of accrued annual and long service leave and any
superannuation benefits, are payable upon termination of employment.
On 4 July 2014 Greg Robinson left the Company and retired from the Board. He received a payment in lieu of the unworked portion of his notice period and his statutory entitlements in accordance with the terms of his Executive Service Agreement. He did not receive any other termination payment.
There are no ongoing payments or arrangements entered into with Greg Robinson.
5.4.2. Gerard Bond
Gerard Bond commenced employment with the Company as Finance Director and Chief Financial Officer on 1 January 2012 and was appointed to the Board on 8 February 2012.
The terms of remuneration payable to Gerard Bond as Finance Director included:
- Base salary of $918,000; - STI of 60 percent of base salary at target and up to 120 percent of base salary dependent on meeting
specified personal and Group performance targets, where 120 percent is achievable only for “outstanding” performance;
- LTI in accordance with the Company’s LTI plan, based on performance rights with a face value equal to 100 percent of base salary;
- Two equity grants of $750,000 (at market value) in Newcrest ordinary shares, to be provided as compensation for equity foregone upon Gerard Bond resigning from his previous employment to take up his role with Newcrest. The first of these grants was made in October 2012, and were satisfied in equity. The second grant was made in October 2013 and was satisfied in cash to the value of those shares. Both grants were subject to Gerard Bond’s ongoing satisfactory performance and continuing employment at the relevant grant dates;
- Compensation for statutory entitlements of accrued annual and long service leave and any superannuation benefits, payable upon termination of employment.
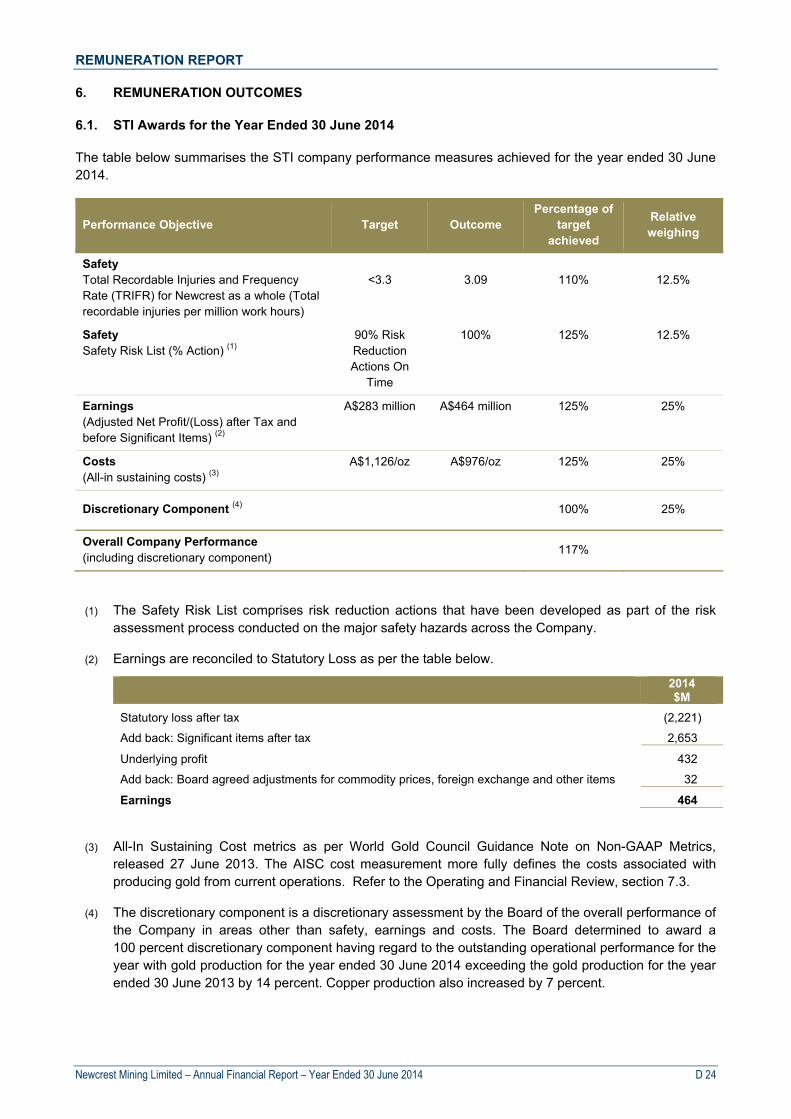
REMUNERATION REPORT
Newcrest Mining Limited – Annual Financial Report – Year Ended 30 June 2014 D 24
6. REMUNERATION OUTCOMES
6.1. STI Awards for the Year Ended 30 June 2014
The table below summarises the STI company performance measures achieved for the year ended 30 June 2014.
Performance Objective Target Outcome Percentage of
target achieved
Relative weighing
Safety Total Recordable Injuries and Frequency Rate (TRIFR) for Newcrest as a whole (Total recordable injuries per million work hours)
<3.3
3.09
110%
12.5%
Safety Safety Risk List (% Action) (1)
90% Risk Reduction Actions On
Time
100% 125% 12.5%
Earnings (Adjusted Net Profit/(Loss) after Tax and before Significant Items) (2)
A$283 million A$464 million 125% 25%
Costs (All-in sustaining costs) (3)
A$1,126/oz A$976/oz 125% 25%
Discretionary Component (4) 100% 25%
Overall Company Performance (including discretionary component)
117%
(1) The Safety Risk List comprises risk reduction actions that have been developed as part of the risk assessment process conducted on the major safety hazards across the Company.
(2) Earnings are reconciled to Statutory Loss as per the table below.
2014$M
Statutory loss after tax (2,221)
Add back: Significant items after tax 2,653
Underlying profit 432
Add back: Board agreed adjustments for commodity prices, foreign exchange and other items 32
Earnings 464
(3) All-In Sustaining Cost metrics as per World Gold Council Guidance Note on Non-GAAP Metrics, released 27 June 2013. The AISC cost measurement more fully defines the costs associated with producing gold from current operations. Refer to the Operating and Financial Review, section 7.3.
(4) The discretionary component is a discretionary assessment by the Board of the overall performance of the Company in areas other than safety, earnings and costs. The Board determined to award a 100 percent discretionary component having regard to the outstanding operational performance for the year with gold production for the year ended 30 June 2014 exceeding the gold production for the year ended 30 June 2013 by 14 percent. Copper production also increased by 7 percent.
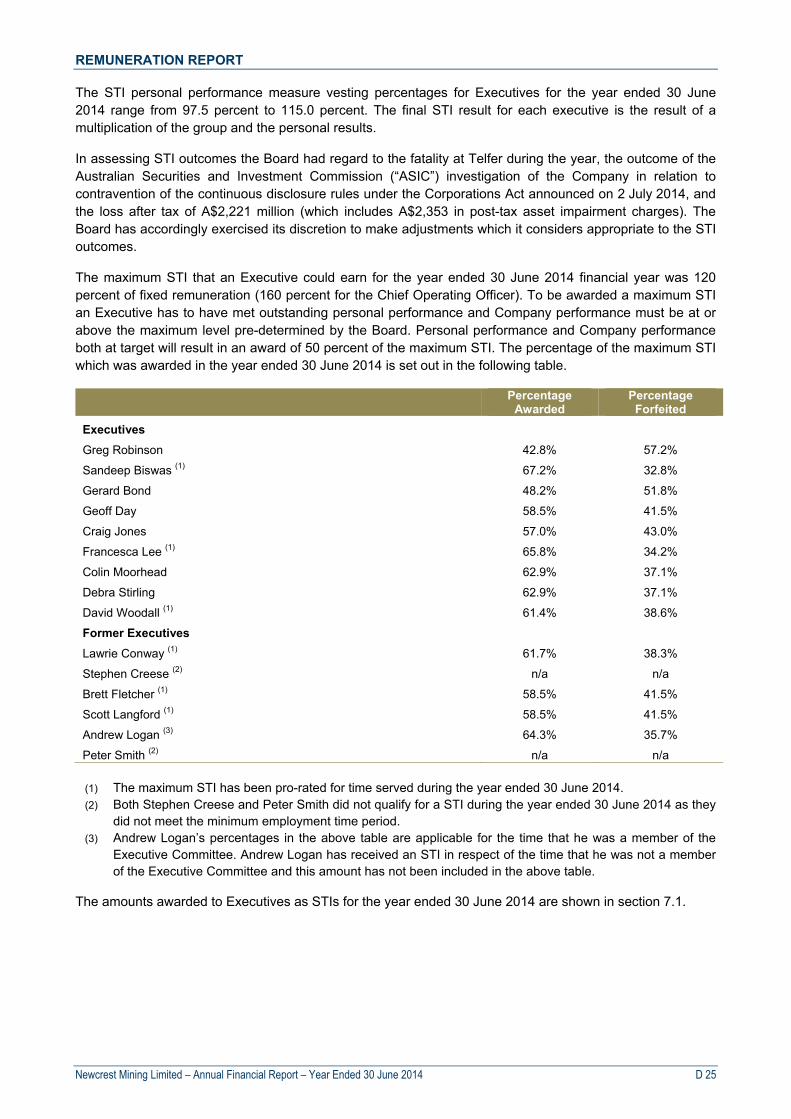
REMUNERATION REPORT
Newcrest Mining Limited – Annual Financial Report – Year Ended 30 June 2014 D 25
The STI personal performance measure vesting percentages for Executives for the year ended 30 June 2014 range from 97.5 percent to 115.0 percent. The final STI result for each executive is the result of a multiplication of the group and the personal results.
In assessing STI outcomes the Board had regard to the fatality at Telfer during the year, the outcome of the Australian Securities and Investment Commission (“ASIC”) investigation of the Company in relation to contravention of the continuous disclosure rules under the Corporations Act announced on 2 July 2014, and the loss after tax of A$2,221 million (which includes A$2,353 in post-tax asset impairment charges). The Board has accordingly exercised its discretion to make adjustments which it considers appropriate to the STI outcomes.
The maximum STI that an Executive could earn for the year ended 30 June 2014 financial year was 120 percent of fixed remuneration (160 percent for the Chief Operating Officer). To be awarded a maximum STI an Executive has to have met outstanding personal performance and Company performance must be at or above the maximum level pre-determined by the Board. Personal performance and Company performance both at target will result in an award of 50 percent of the maximum STI. The percentage of the maximum STI which was awarded in the year ended 30 June 2014 is set out in the following table.
Percentage
Awarded Percentage Forfeited
Executives
Greg Robinson 42.8% 57.2%
Sandeep Biswas (1) 67.2% 32.8%
Gerard Bond 48.2% 51.8%
Geoff Day 58.5% 41.5%
Craig Jones 57.0% 43.0%
Francesca Lee (1) 65.8% 34.2%
Colin Moorhead 62.9% 37.1%
Debra Stirling 62.9% 37.1%
David Woodall (1) 61.4% 38.6%
Former Executives
Lawrie Conway (1) 61.7% 38.3%
Stephen Creese (2) n/a n/a
Brett Fletcher (1) 58.5% 41.5%
Scott Langford (1) 58.5% 41.5%
Andrew Logan (3) 64.3% 35.7%
Peter Smith (2) n/a n/a
(1) The maximum STI has been pro-rated for time served during the year ended 30 June 2014. (2) Both Stephen Creese and Peter Smith did not qualify for a STI during the year ended 30 June 2014 as they
did not meet the minimum employment time period. (3) Andrew Logan’s percentages in the above table are applicable for the time that he was a member of the
Executive Committee. Andrew Logan has received an STI in respect of the time that he was not a member of the Executive Committee and this amount has not been included in the above table.
The amounts awarded to Executives as STIs for the year ended 30 June 2014 are shown in section 7.1.

REMUNERATION REPORT
Newcrest Mining Limited – Annual Financial Report – Year Ended 30 June 2014 D 26
6.2. LTI Outcomes
Following the completion of the performance period from 1 July 2010 to 30 June 2013, the 2010 LTI plan vested on 10 November 2013 at 53.6 percent of target, based on assessment of performance against the applicable measures. This reduction in vesting from the prior two years (78.0 percent in 2013 and 93.5 percent in 2012) largely reflects the lower financial and operating performances against target. The Board resolved to exercise its discretion and reduce this vesting for Executives by half (to 26.8 percent) to reflect corporate performance and shareholder experience over the third year of the performance period.
6.3. LTI Rights Vested from 2012 to 2014
Grant Date (1) Vesting Date (2) Performance Achieved Percentage
Vested (3) Cost Reserves ROCE
11 Nov 2008 11 Nov 2011 85.0% 100.0% 96.0% 93.5%
10 Nov 2009 10 Nov 2012 73.6% 100.0% 60.4% 78.0%
10 Nov 2010 10 Nov 2013 56.7% 91.0% 12.9% 26.8% (4)
(1) The strike price for all plans for all years is nil. (2) The expiry date on all rights vested is two years post vesting date. (3) The percentage vested is the same for all Executives. (4) Under the LTI Rules the 2010 LTI vested at 53.6 percent of target. The Board exercised its discretion to
reduce this vesting by half. 6.4. Relationship Between Remuneration Outcomes and Newcrest’s Financial Performance
Newcrest’s operating and financial performance for the year ended 30 June 2014 reflects the Company’s stated focus during the current year on improving productivity, reducing costs and capital expenditure and maximising free cash flow while maintaining growth options.
Increased gold and copper production and free cash flow generation follow major investments made at Cadia Valley and Lihir, improved operating performance across all operations and a reduction in expenditure through a consistent focus on operational improvement and discipline.
Newcrest’s 2014 financial year gold production of 2.4 million ounces exceeded the guidance of 2.0 to 2.3 million ounces. Full year copper production of 86 thousand tonnes also exceeded the guidance of 75 to 85 thousand tonnes. Total capital expenditure of A$843 million, All-In Sustaining Cost of A$2.33 billion and exploration expenditure of A$62 million were also below their guidance of A$895 to A$1,025 million, A$2.45 to A$2.73 billion and A$80 to A$90 million, respectively.
Section 6.5 shows the financial and operating performance of the Company for the current and prior 4 years.
For the year ended 30 June 2014 the Executive’s STI outcomes (based on safety, earnings, costs and a discretionary measure) reflect the positive operating results achieved in a lower gold price environment. This has resulted in an improved company performance outcome of 117 percent compared with 15.6 percent in in the 2013 financial year, and 71.5 percent in the 2012 financial year. Section 6.1 shows the performance of the Company against all individual measures. The outcome for each Executive Director and Executive Manager has been determined by the overall personal performance multiplied by the Company’s overall performance, which is provided in section 6.1.
The 2010 LTI vesting outcome in November 2013 was 26.8 percent when against the applicable performance measures, compared with vesting of 78.0 percent in the financial year ended 30 June 2013. This measured performance against the applicable performance measures from 1 July 2010 to 30 June 2013. For the 2010 vesting, the Board agreed, in consultation with the Executives, to apply a 50 percent reduction to the calculated vesting percentage. This reduced the actual vesting percentage to 26.8 percent.
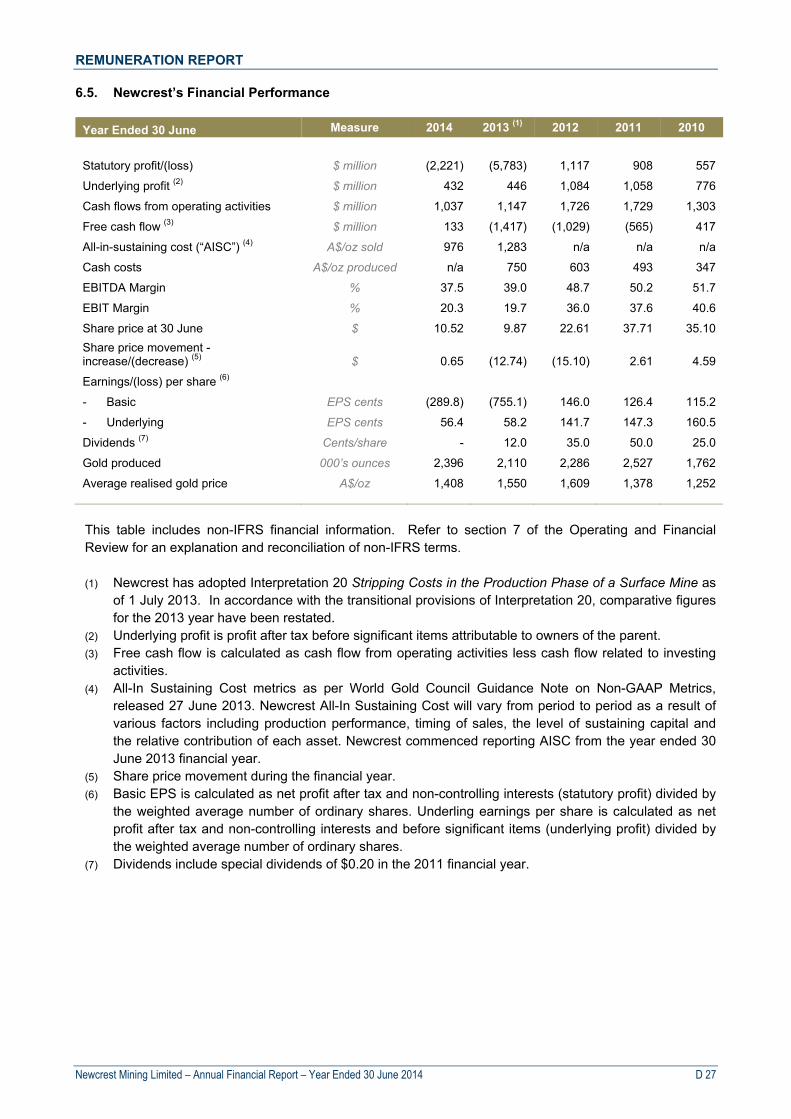
REMUNERATION REPORT
Newcrest Mining Limited – Annual Financial Report – Year Ended 30 June 2014 D 27
6.5. Newcrest’s Financial Performance
Year Ended 30 June Measure 2014 2013 (1) 2012 2011 2010
Statutory profit/(loss) $ million (2,221) (5,783) 1,117 908 557
Underlying profit (2) $ million 432 446 1,084 1,058 776
Cash flows from operating activities $ million 1,037 1,147 1,726 1,729 1,303
Free cash flow (3) $ million 133 (1,417) (1,029) (565) 417
All-in-sustaining cost (“AISC”) (4) A$/oz sold 976 1,283 n/a n/a n/a
Cash costs A$/oz produced n/a 750 603 493 347
EBITDA Margin % 37.5 39.0 48.7 50.2 51.7
EBIT Margin % 20.3 19.7 36.0 37.6 40.6
Share price at 30 June $ 10.52 9.87 22.61 37.71 35.10
Share price movement - increase/(decrease) (5) $ 0.65 (12.74) (15.10) 2.61 4.59
Earnings/(loss) per share (6)
- Basic EPS cents (289.8) (755.1) 146.0 126.4 115.2
- Underlying EPS cents 56.4 58.2 141.7 147.3 160.5
Dividends (7) Cents/share - 12.0 35.0 50.0 25.0
Gold produced 000’s ounces 2,396 2,110 2,286 2,527 1,762
Average realised gold price A$/oz 1,408 1,550 1,609 1,378 1,252 This table includes non-IFRS financial information. Refer to section 7 of the Operating and Financial Review for an explanation and reconciliation of non-IFRS terms. (1) Newcrest has adopted Interpretation 20 Stripping Costs in the Production Phase of a Surface Mine as
of 1 July 2013. In accordance with the transitional provisions of Interpretation 20, comparative figures for the 2013 year have been restated.
(2) Underlying profit is profit after tax before significant items attributable to owners of the parent. (3) Free cash flow is calculated as cash flow from operating activities less cash flow related to investing
activities. (4) All-In Sustaining Cost metrics as per World Gold Council Guidance Note on Non-GAAP Metrics,
released 27 June 2013. Newcrest All-In Sustaining Cost will vary from period to period as a result of various factors including production performance, timing of sales, the level of sustaining capital and the relative contribution of each asset. Newcrest commenced reporting AISC from the year ended 30 June 2013 financial year.
(5) Share price movement during the financial year. (6) Basic EPS is calculated as net profit after tax and non-controlling interests (statutory profit) divided by
the weighted average number of ordinary shares. Underling earnings per share is calculated as net profit after tax and non-controlling interests and before significant items (underlying profit) divided by the weighted average number of ordinary shares.
(7) Dividends include special dividends of $0.20 in the 2011 financial year.
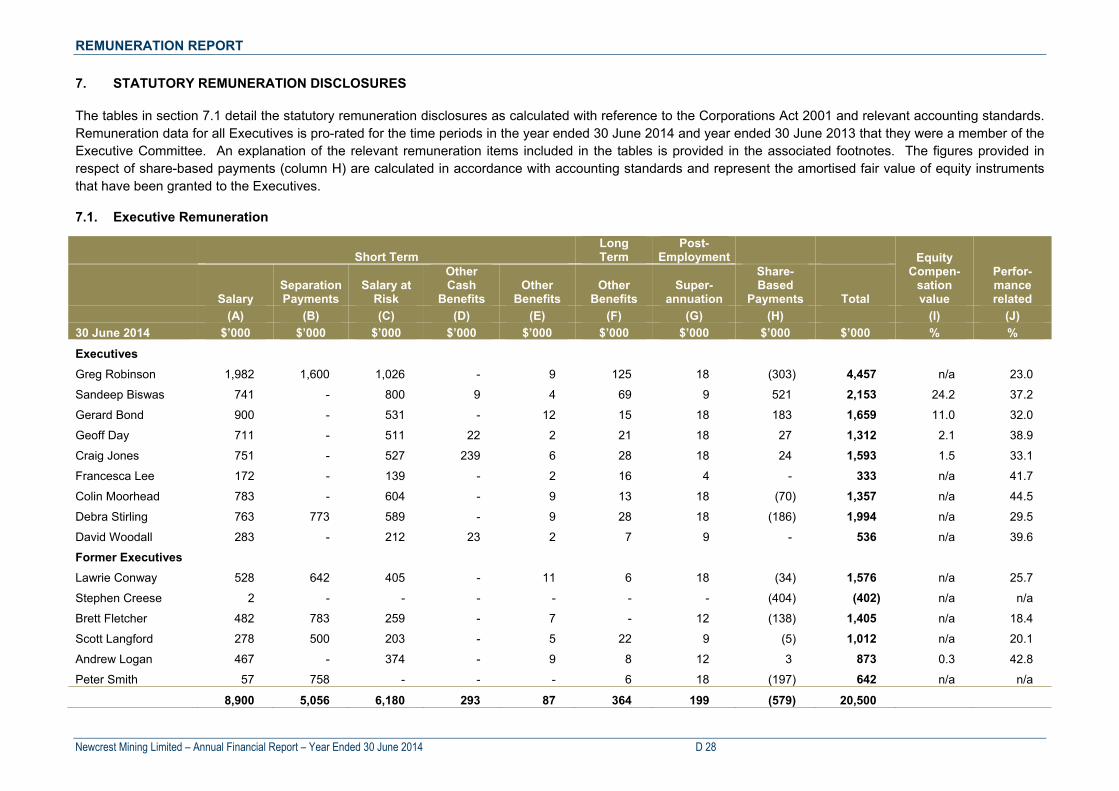
REMUNERATION REPORT
Newcrest Mining Limited – Annual Financial Report – Year Ended 30 June 2014 D 28
7. STATUTORY REMUNERATION DISCLOSURES
The tables in section 7.1 detail the statutory remuneration disclosures as calculated with reference to the Corporations Act 2001 and relevant accounting standards. Remuneration data for all Executives is pro-rated for the time periods in the year ended 30 June 2014 and year ended 30 June 2013 that they were a member of the Executive Committee. An explanation of the relevant remuneration items included in the tables is provided in the associated footnotes. The figures provided in respect of share-based payments (column H) are calculated in accordance with accounting standards and represent the amortised fair value of equity instruments that have been granted to the Executives.
7.1. Executive Remuneration
Short Term
Long Term
Post-Employment Equity
Compen-sation value
Perfor-mance related
Salary
Separation Payments
Salary at Risk
Other Cash
Benefits Other
Benefits Other
Benefits Super-
annuation
Share-Based
Payments Total (A) (B) (C) (D) (E) (F) (G) (H) (I) (J)
30 June 2014 $’000 $’000 $’000 $’000 $’000 $’000 $’000 $’000 $’000 % %
Executives
Greg Robinson 1,982 1,600 1,026 - 9 125 18 (303) 4,457 n/a 23.0
Sandeep Biswas 741 - 800 9 4 69 9 521 2,153 24.2 37.2
Gerard Bond 900 - 531 - 12 15 18 183 1,659 11.0 32.0
Geoff Day 711 - 511 22 2 21 18 27 1,312 2.1 38.9
Craig Jones 751 - 527 239 6 28 18 24 1,593 1.5 33.1
Francesca Lee 172 - 139 - 2 16 4 - 333 n/a 41.7
Colin Moorhead 783 - 604 - 9 13 18 (70) 1,357 n/a 44.5
Debra Stirling 763 773 589 - 9 28 18 (186) 1,994 n/a 29.5
David Woodall 283 - 212 23 2 7 9 - 536 n/a 39.6
Former Executives
Lawrie Conway 528 642 405 - 11 6 18 (34) 1,576 n/a 25.7
Stephen Creese 2 - - - - - - (404) (402) n/a n/a
Brett Fletcher 482 783 259 - 7 - 12 (138) 1,405 n/a 18.4
Scott Langford 278 500 203 - 5 22 9 (5) 1,012 n/a 20.1
Andrew Logan 467 - 374 - 9 8 12 3 873 0.3 42.8
Peter Smith 57 758 - - - 6 18 (197) 642 n/a n/a
8,900 5,056 6,180 293 87 364 199 (579) 20,500
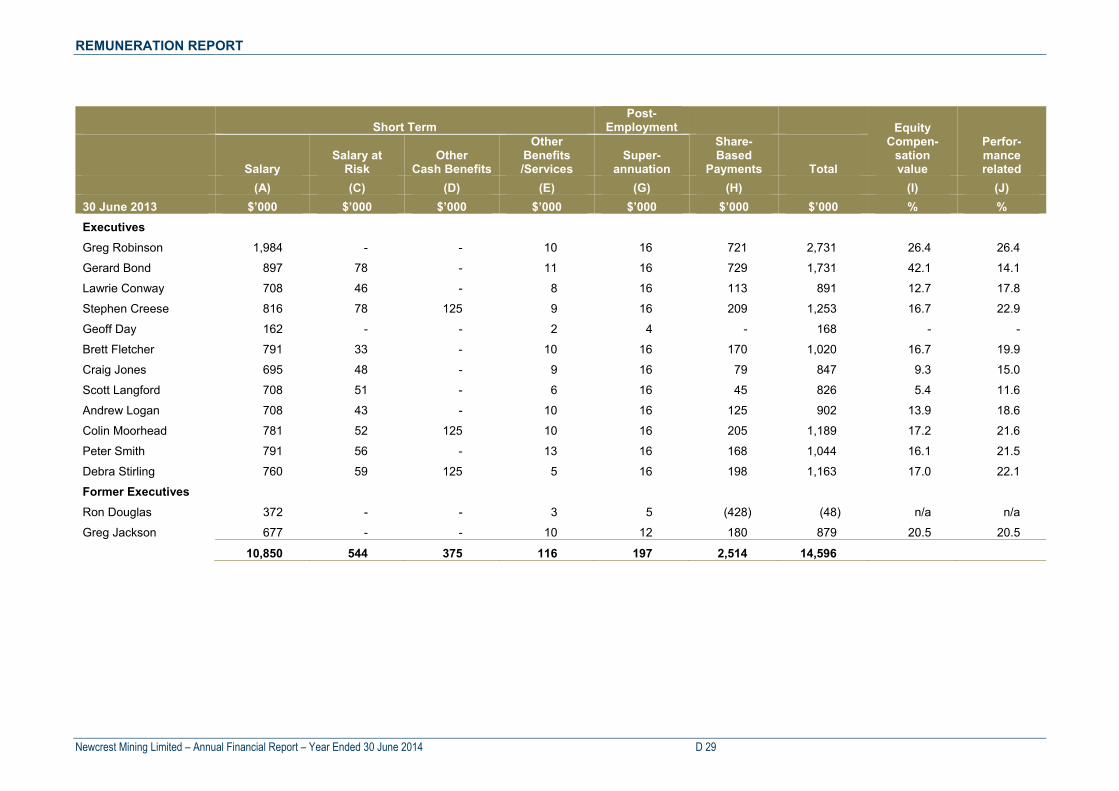
REMUNERATION REPORT
Newcrest Mining Limited – Annual Financial Report – Year Ended 30 June 2014 D 29
Short Term Post-
Employment Equity Compen-
sation value
Perfor-mance related Salary
Salary at Risk
Other Cash Benefits
Other Benefits /Services
Super-annuation
Share-Based
Payments Total
(A) (C) (D) (E) (G) (H) (I) (J)
30 June 2013 $’000 $’000 $’000 $’000 $’000 $’000 $’000 % %
Executives
Greg Robinson 1,984 - - 10 16 721 2,731 26.4 26.4
Gerard Bond 897 78 - 11 16 729 1,731 42.1 14.1
Lawrie Conway 708 46 - 8 16 113 891 12.7 17.8
Stephen Creese 816 78 125 9 16 209 1,253 16.7 22.9
Geoff Day 162 - - 2 4 - 168 - -
Brett Fletcher 791 33 - 10 16 170 1,020 16.7 19.9
Craig Jones 695 48 - 9 16 79 847 9.3 15.0
Scott Langford 708 51 - 6 16 45 826 5.4 11.6
Andrew Logan 708 43 - 10 16 125 902 13.9 18.6
Colin Moorhead 781 52 125 10 16 205 1,189 17.2 21.6
Peter Smith 791 56 - 13 16 168 1,044 16.1 21.5
Debra Stirling 760 59 125 5 16 198 1,163 17.0 22.1
Former Executives
Ron Douglas 372 - - 3 5 (428) (48) n/a n/a
Greg Jackson 677 - - 10 12 180 879 20.5 20.5
10,850 544 375 116 197 2,514 14,596

REMUNERATION REPORT
Newcrest Mining Limited – Annual Financial Report – Year Ended 30 June 2014 D 30
7.2. Notes to Executive Remuneration
(A) Salaries comprise cash salary and available salary package options grossed up by related fringe benefits tax, where applicable, net of superannuation commitments, paid during the financial year. For former executives, this balance is pro-rated for time served. For Andrew Logan, the amount represents the salary earned whilst he was a member of the Executive Committee up to 28 February 2014. Post 28 February 2014, he was no longer a member of the Executive Committee and was not considered Key Management Personnel.
(B) Separation payments include the amounts paid in accordance with the requirements in section 5 for Greg Robinson, Debra Stirling, Lawrie Conway, Brett Fletcher and Peter Smith. Scott Langford received an ex-gratia payment provided upon separation.
(C) Salary at risk refers to amounts earned under the STI plan. These amounts are payable in the following financial year. For Executives who departed Newcrest during the year, the STI treatment applies in accordance with the plan rules, and a pro-rata portion of the STI is payable based on the length of employment and performance of the Executive up to their separation date. For Andrew Logan, the STI represents the STI applicable whilst he was a member of the Executive Committee.
(D) Other cash benefits comprises: Year ended 30 June 2014: - For Craig Jones, this includes $239k in relocation costs incurred in his relocation from Brisbane to
Melbourne; - For all other Executives this relates to travel costs paid in lieu of relocation entitlements. Year ended 30 June 2013: - Amounts payable to Executive Managers as retention payments.
(E) Represents non-monetary benefits such as parking, insurance and applicable fringe benefits tax payable on benefits.
(F) Represents annual leave and long service leave entitlements, measured on an accrual basis, and reflects the movement in the entitlements over the 12 month period.
(G) Represents Company contributions to superannuation under the Superannuation Guarantee legislation (SGC).
(H) Share based payments represents:
- The fair value of rights, comprising rights over unissued shares, granted under the LTI plan has been valued using a Black-Scholes option pricing model. The factors and assumptions used in determining the fair value of rights on grant date are detailed in section 7.3.
- Equity grants for Sandeep Biswas and Gerard Bond as outlined in section 5.3.1 and 5.4.2 respectively. The equity grant which vested to Gerard Bond in October 2013 was settled in cash.
The calculation of Share Based Payments is based on the apportioned expense associated with rights granted, adjusted for the reassessment of estimated vesting outcomes of those rights.
(I) Represents the value of rights included in remuneration as a percentage of total remuneration.
(J) Represents performance-related remuneration as percentage of total remuneration.
7.3. Fair Value of LTI Rights
LTI Dec 2013
LTISep 2012
LTISep 2011
LTI Nov 2010
LTINov 2009
Fair value (1) $7.16 $27.85 $31.83 $41.66 $34.63
Exercise price – – – – –
Estimated volatility 40.0% 35% 30% 30% 40%
Risk-free interest rate 3.08% 2.81% 3.16% 5.09% 5.04%
Dividend yield 0.0% 1.50% 1.50% 0.50% 0.50%
Expected life of award/option 3 years 3 years 3 years 3 years 3 years (1) Fair Value has been calculated by an independent third party.

REMUNERATION REPORT
Newcrest Mining Limited – Annual Financial Report – Year Ended 30 June 2014 D 31
7.4. Non-Statutory Executive Remuneration
The table below details the actual remuneration received by each Executive in the year ended 30 June 2014. The figures provided in respect of share-based payments (column D) reflect the market value of the shares that have vested during the year. An explanation of the relevant remuneration items included in the tables is provided in the associated footnotes. Unless otherwise noted, the remuneration component is calculated on the same basis as section 7.1. This table is non-IFRS financial information and provides additional information to users to assess remuneration in the current year.
Salary Separation Payments
Salary at Risk
Other Cash
Benefits Super-
annuation Rights Vested Total
(A) (B) (C) (D) 30 June 2014 $’000 $’000 $’000 $’000 $’000 $’000 $’000
Executives
Greg Robinson 1,982 - - - 18 89 2,089
Sandeep Biswas 741 - - 9 9 - 759
Gerard Bond 900 - 78 - 18 750 1,746
Geoff Day 711 - - 22 18 - 751
Craig Jones 751 - 48 298 18 7 1,122
Francesca Lee 172 - - - 4 - 176
Colin Moorhead 783 - 52 125 18 29 1,007
Debra Stirling 763 - 59 125 18 28 993
David Woodall 283 - - 23 9 - 315
Former Executives
Lawrie Conway 528 642 46 240 13 7 1,476
Stephen Creese 2 - 78 143 18 - 241
Brett Fletcher 482 783 33 - 12 26 1,336
Scott Langford 278 500 51 33 9 - 871
Andrew Logan 467 - 43 - 12 10 532
Peter Smith 57 758 56 121 18 - 1,010 8,900 2,683 544 1,139 212 946 14,424 7.5. Notes to Executive Non Statutory Remuneration
(A) Separation payments include the amounts paid in accordance with the requirements in section 5 for Lawrie Conway, Brett Fletcher and Peter Smith. Scott Langford represents an ex-gratia payment upon separation. The payments for Greg Robinson and Debra Stirling have been excluded as they have not been paid during the year ended 30 June 2014.
(B) Salary at risk refers to amounts earned under the STI plan which were paid during the year ended 30 June 2014. This payment represents the STI awarded in respect of year ended 30 June 2013.
(C) Other cash benefits paid in 2014 comprises: - For Lawrie Conway, Stephen Creese, Scott Langford and Peter Smith this represents payment of
outstanding unused annual and long service leave at separation date. - For Sandeep Biswas, Geoff Day and David Woodall, this includes travel costs paid in lieu of
relocation entitlements. - For Craig Jones, this includes $239k in relocation costs paid, as well as cash payment of
outstanding unused annual leave, made in accordance with Newcrest policies. - For Colin Moorhead, Debra Stirling and Stephen Creese, this component also includes $125k in
retention amounts paid in 2014 relating to 2013. (D) The rights vested represent the 2010 LTI plan that vested during the year ended 30 June 2014,
measured at market value on vesting date. For Stephen Creese and Peter Smith, nil shares vested during the period that they were designated as Key Management Personnel. For Gerard Bond this represents the shares that vested in October 2013, and were settled in cash.
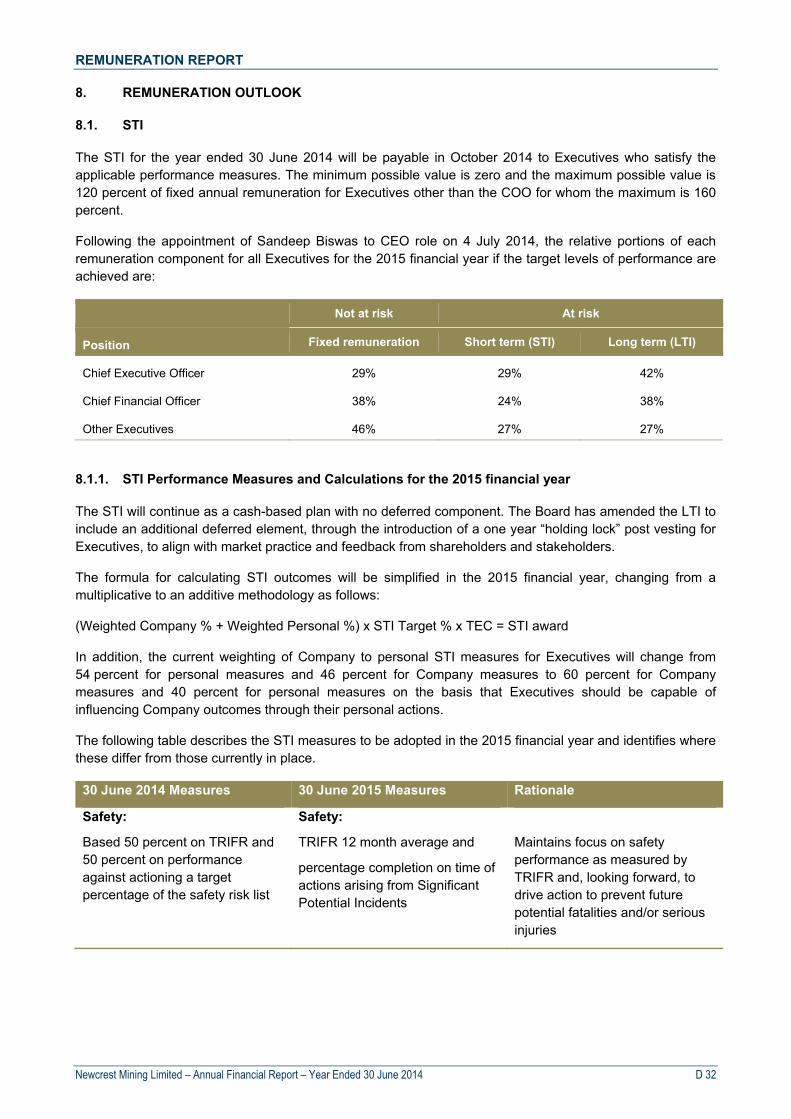
REMUNERATION REPORT
Newcrest Mining Limited – Annual Financial Report – Year Ended 30 June 2014 D 32
8. REMUNERATION OUTLOOK
8.1. STI
The STI for the year ended 30 June 2014 will be payable in October 2014 to Executives who satisfy the applicable performance measures. The minimum possible value is zero and the maximum possible value is 120 percent of fixed annual remuneration for Executives other than the COO for whom the maximum is 160 percent.
Following the appointment of Sandeep Biswas to CEO role on 4 July 2014, the relative portions of each remuneration component for all Executives for the 2015 financial year if the target levels of performance are achieved are:
Not at risk At risk
Position Fixed remuneration Short term (STI) Long term (LTI)
Chief Executive Officer 29% 29% 42%
Chief Financial Officer 38% 24% 38%
Other Executives 46% 27% 27%
8.1.1. STI Performance Measures and Calculations for the 2015 financial year
The STI will continue as a cash-based plan with no deferred component. The Board has amended the LTI to include an additional deferred element, through the introduction of a one year “holding lock” post vesting for Executives, to align with market practice and feedback from shareholders and stakeholders.
The formula for calculating STI outcomes will be simplified in the 2015 financial year, changing from a multiplicative to an additive methodology as follows:
(Weighted Company % + Weighted Personal %) x STI Target % x TEC = STI award
In addition, the current weighting of Company to personal STI measures for Executives will change from 54 percent for personal measures and 46 percent for Company measures to 60 percent for Company measures and 40 percent for personal measures on the basis that Executives should be capable of influencing Company outcomes through their personal actions.
The following table describes the STI measures to be adopted in the 2015 financial year and identifies where these differ from those currently in place.
30 June 2014 Measures 30 June 2015 Measures Rationale
Safety:
Based 50 percent on TRIFR and 50 percent on performance against actioning a target percentage of the safety risk list
Safety:
TRIFR 12 month average and
percentage completion on time of actions arising from Significant Potential Incidents
Maintains focus on safety performance as measured by TRIFR and, looking forward, to drive action to prevent future potential fatalities and/or serious injuries

REMUNERATION REPORT
Newcrest Mining Limited – Annual Financial Report – Year Ended 30 June 2014 D 33
30 June 2014 Measures 30 June 2015 Measures Rationale
Earnings:
Based on target performance against net profit after tax and minority interests before significant items. Results adjusted for the effect of commodity prices, foreign exchange rates, significant items and other items as determined by the Board
Earnings:
No change to current Earnings measure
Highly relevant short term measure, consistent with Newcrest strategy
Costs:
Absolute cost (AISC), A$ per oz.
Costs:
No change to current Costs measure
Highly relevant short term measure, consistent with Newcrest strategy
“Discretionary” measure:
One further Company performance measure determined annually at the commencement of the relevant STI performance year
“Discretionary” measure:
Replace the “discretionary” measure with a defined Company measure to be set at the commencement of each STI performance year based on clearly defined objectives contributing to earnings, corporate strategy and growth opportunities. For 2014-15, free cash flow will form the basis for this measure.
Increases clarity of this measure and focus on Newcrest strategic goals.
Personal Measures Four measures equally weighted:
Three in key areas of each executive’s broader responsibilities and a fourth discretionary but defined objective. Set each year by the Board in relation to the Managing Director and by the Managing Director in consultation with the Board for each Executive.
Personal Measures Four measures equally weighted:
Four measures equally weighted. Set each year by the Board in relation to the Managing Director and by the Managing Director in consultation with the Board for each Executive. Replace fourth “discretionary” objective with a measure based on strategic corporate cost and efficiency outcomes.
Greater clarity and strategic alignment
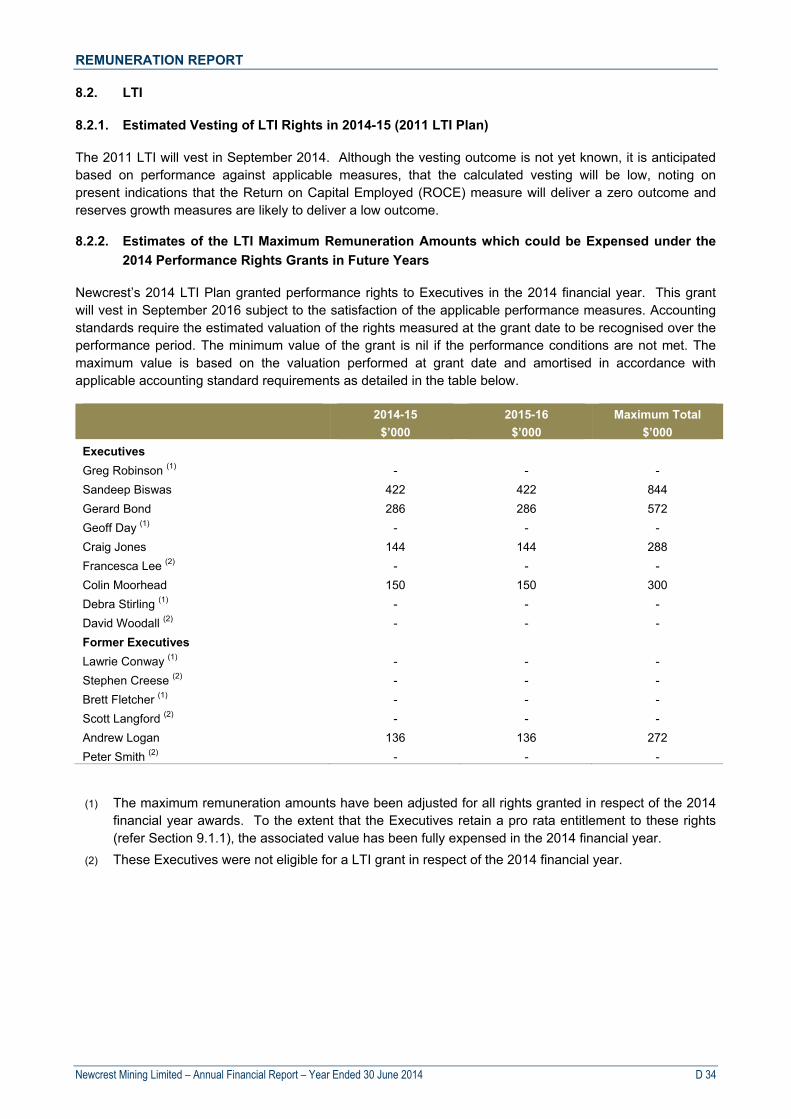
REMUNERATION REPORT
Newcrest Mining Limited – Annual Financial Report – Year Ended 30 June 2014 D 34
8.2. LTI
8.2.1. Estimated Vesting of LTI Rights in 2014-15 (2011 LTI Plan)
The 2011 LTI will vest in September 2014. Although the vesting outcome is not yet known, it is anticipated based on performance against applicable measures, that the calculated vesting will be low, noting on present indications that the Return on Capital Employed (ROCE) measure will deliver a zero outcome and reserves growth measures are likely to deliver a low outcome.
8.2.2. Estimates of the LTI Maximum Remuneration Amounts which could be Expensed under the
2014 Performance Rights Grants in Future Years
Newcrest’s 2014 LTI Plan granted performance rights to Executives in the 2014 financial year. This grant will vest in September 2016 subject to the satisfaction of the applicable performance measures. Accounting standards require the estimated valuation of the rights measured at the grant date to be recognised over the performance period. The minimum value of the grant is nil if the performance conditions are not met. The maximum value is based on the valuation performed at grant date and amortised in accordance with applicable accounting standard requirements as detailed in the table below.
2014-15
$’000
2015-16
$’000
Maximum Total
$’000
Executives
Greg Robinson (1) - - -
Sandeep Biswas 422 422 844
Gerard Bond 286 286 572
Geoff Day (1) - - -
Craig Jones 144 144 288
Francesca Lee (2) - - -
Colin Moorhead 150 150 300
Debra Stirling (1) - - -
David Woodall (2) - - -
Former Executives
Lawrie Conway (1) - - -
Stephen Creese (2) - - -
Brett Fletcher (1) - - -
Scott Langford (2) - - -
Andrew Logan 136 136 272
Peter Smith (2) - - -
(1) The maximum remuneration amounts have been adjusted for all rights granted in respect of the 2014 financial year awards. To the extent that the Executives retain a pro rata entitlement to these rights (refer Section 9.1.1), the associated value has been fully expensed in the 2014 financial year.
(2) These Executives were not eligible for a LTI grant in respect of the 2014 financial year.
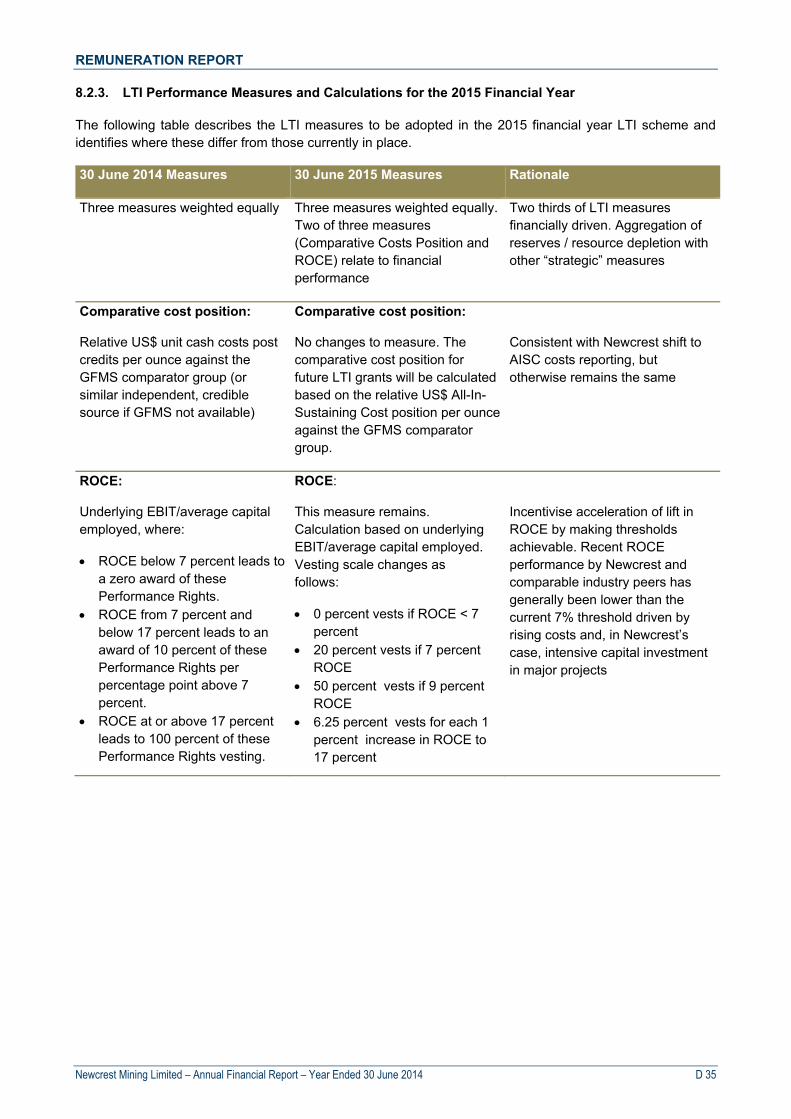
REMUNERATION REPORT
Newcrest Mining Limited – Annual Financial Report – Year Ended 30 June 2014 D 35
8.2.3. LTI Performance Measures and Calculations for the 2015 Financial Year
The following table describes the LTI measures to be adopted in the 2015 financial year LTI scheme and identifies where these differ from those currently in place.
30 June 2014 Measures 30 June 2015 Measures Rationale
Three measures weighted equally Three measures weighted equally. Two of three measures (Comparative Costs Position and ROCE) relate to financial performance
Two thirds of LTI measures financially driven. Aggregation of reserves / resource depletion with other “strategic” measures
Comparative cost position:
Relative US$ unit cash costs post credits per ounce against the GFMS comparator group (or similar independent, credible source if GFMS not available)
Comparative cost position:
No changes to measure. The comparative cost position for future LTI grants will be calculated based on the relative US$ All-In-Sustaining Cost position per ounce against the GFMS comparator group.
Consistent with Newcrest shift to AISC costs reporting, but otherwise remains the same
ROCE:
Underlying EBIT/average capital employed, where:
ROCE below 7 percent leads to a zero award of these Performance Rights.
ROCE from 7 percent and below 17 percent leads to an award of 10 percent of these Performance Rights per percentage point above 7 percent.
ROCE at or above 17 percent leads to 100 percent of these Performance Rights vesting.
ROCE:
This measure remains. Calculation based on underlying EBIT/average capital employed. Vesting scale changes as follows:
0 percent vests if ROCE < 7 percent
20 percent vests if 7 percent ROCE
50 percent vests if 9 percent ROCE
6.25 percent vests for each 1 percent increase in ROCE to 17 percent
Incentivise acceleration of lift in ROCE by making thresholds achievable. Recent ROCE performance by Newcrest and comparable industry peers has generally been lower than the current 7% threshold driven by rising costs and, in Newcrest’s case, intensive capital investment in major projects
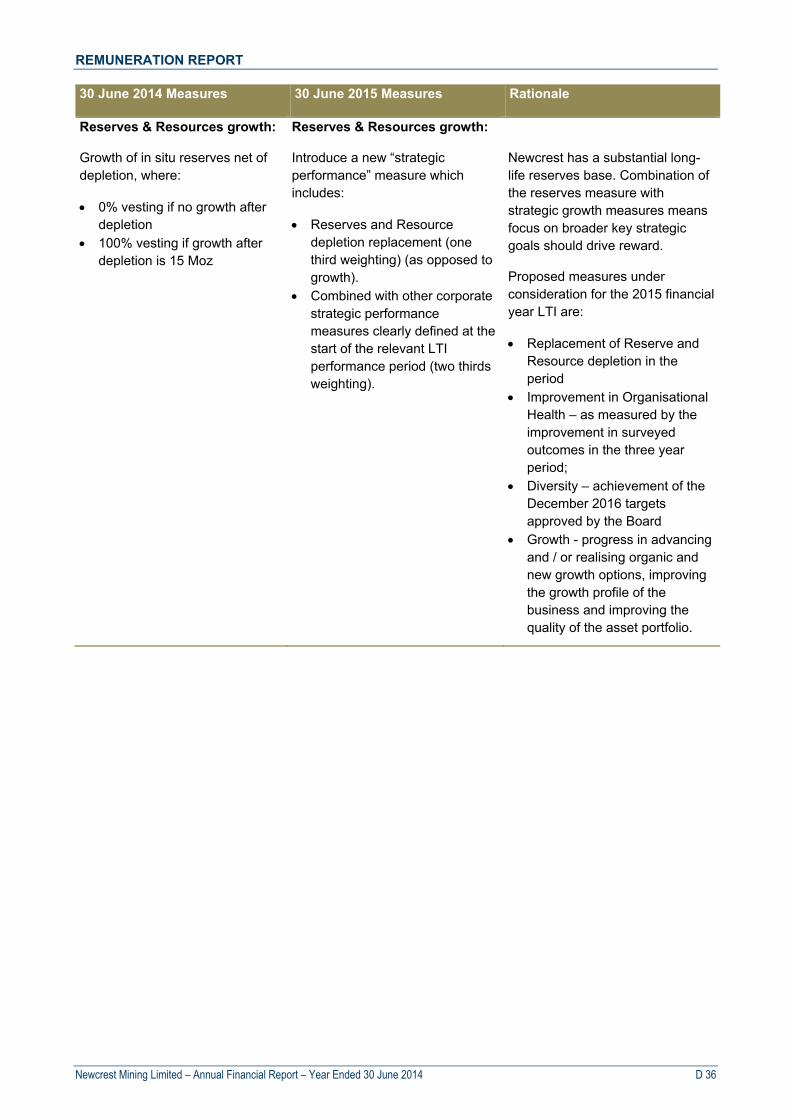
REMUNERATION REPORT
Newcrest Mining Limited – Annual Financial Report – Year Ended 30 June 2014 D 36
30 June 2014 Measures 30 June 2015 Measures Rationale
Reserves & Resources growth:
Growth of in situ reserves net of depletion, where:
0% vesting if no growth after depletion
100% vesting if growth after depletion is 15 Moz
Reserves & Resources growth:
Introduce a new “strategic performance” measure which includes:
Reserves and Resource depletion replacement (one third weighting) (as opposed to growth).
Combined with other corporate strategic performance measures clearly defined at the start of the relevant LTI performance period (two thirds weighting).
Newcrest has a substantial long-life reserves base. Combination of the reserves measure with strategic growth measures means focus on broader key strategic goals should drive reward.
Proposed measures under consideration for the 2015 financial year LTI are:
Replacement of Reserve and Resource depletion in the period
Improvement in Organisational Health – as measured by the improvement in surveyed outcomes in the three year period;
Diversity – achievement of the December 2016 targets approved by the Board
Growth - progress in advancing and / or realising organic and new growth options, improving the growth profile of the business and improving the quality of the asset portfolio.

REMUNERATION REPORT
Newcrest Mining Limited – Annual Financial Report – Year Ended 30 June 2014 D 37
9. OTHER EXECUTIVE DISCLOSURES
9.1. Rights Held by Executives
All conditional entitlements refer to Performance Rights over fully paid ordinary shares of the Company, which are exercisable on a one-for-one basis. No payment is required by a participant on the grant or exercise of any such conditional entitlement.
The movements in the reporting period in the number of Rights in the Company held by each Executive as part of their remuneration are in section 9.1.1.
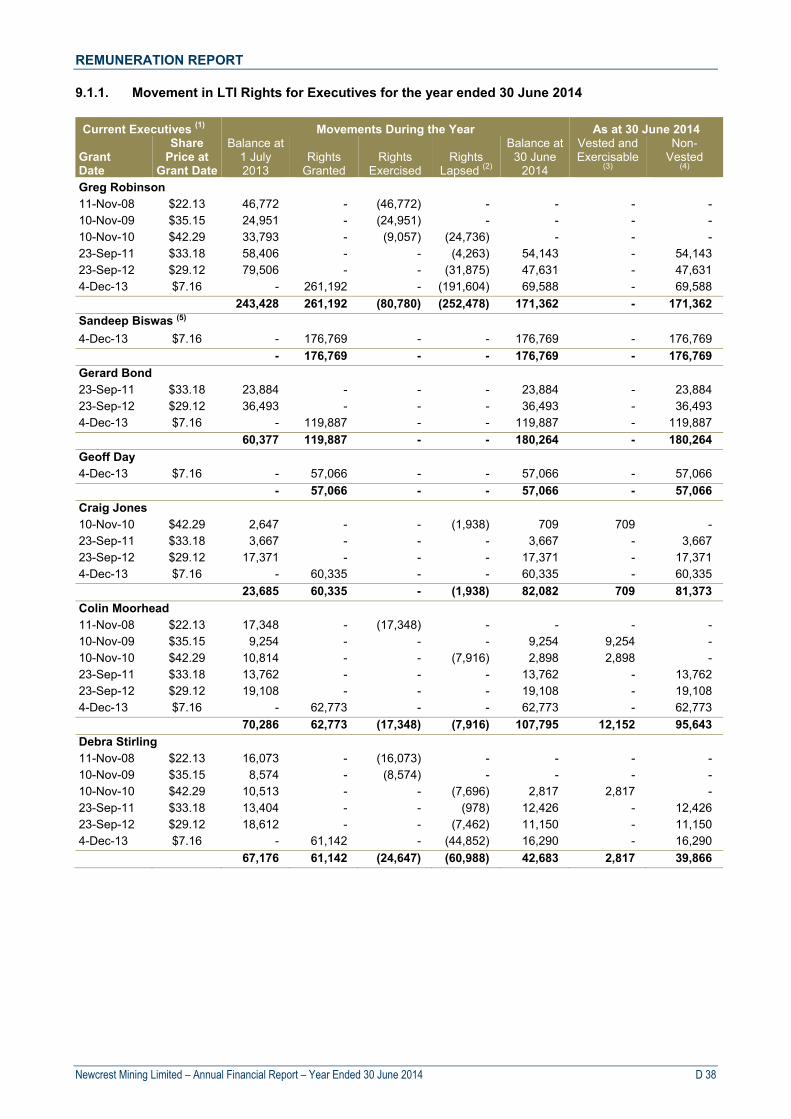
REMUNERATION REPORT
Newcrest Mining Limited – Annual Financial Report – Year Ended 30 June 2014 D 38
9.1.1. Movement in LTI Rights for Executives for the year ended 30 June 2014
Current Executives (1) Movements During the Year As at 30 June 2014
Grant Date
Share Price at
Grant Date
Balance at 1 July 2013
Rights Granted
Rights Exercised
Rights Lapsed (2)
Balance at 30 June
2014
Vested and Exercisable
(3)
Non- Vested
(4) Greg Robinson 11-Nov-08 $22.13 46,772 - (46,772) - - - - 10-Nov-09 $35.15 24,951 - (24,951) - - - - 10-Nov-10 $42.29 33,793 - (9,057) (24,736) - - - 23-Sep-11 $33.18 58,406 - - (4,263) 54,143 - 54,143 23-Sep-12 $29.12 79,506 - - (31,875) 47,631 - 47,631 4-Dec-13 $7.16 - 261,192 - (191,604) 69,588 - 69,588
243,428 261,192 (80,780) (252,478) 171,362 - 171,362
Sandeep Biswas (5)
4-Dec-13 $7.16 - 176,769 - - 176,769 - 176,769
- 176,769 - - 176,769 - 176,769
Gerard Bond 23-Sep-11 $33.18 23,884 - - - 23,884 - 23,884 23-Sep-12 $29.12 36,493 - - - 36,493 - 36,493 4-Dec-13 $7.16 - 119,887 - - 119,887 - 119,887
60,377 119,887 - - 180,264 - 180,264
Geoff Day 4-Dec-13 $7.16 - 57,066 - - 57,066 - 57,066
- 57,066 - - 57,066 - 57,066
Craig Jones 10-Nov-10 $42.29 2,647 - - (1,938) 709 709 - 23-Sep-11 $33.18 3,667 - - - 3,667 - 3,667 23-Sep-12 $29.12 17,371 - - - 17,371 - 17,371 4-Dec-13 $7.16 - 60,335 - - 60,335 - 60,335
23,685 60,335 - (1,938) 82,082 709 81,373
Colin Moorhead 11-Nov-08 $22.13 17,348 - (17,348) - - - - 10-Nov-09 $35.15 9,254 - - - 9,254 9,254 - 10-Nov-10 $42.29 10,814 - - (7,916) 2,898 2,898 - 23-Sep-11 $33.18 13,762 - - - 13,762 - 13,762 23-Sep-12 $29.12 19,108 - - - 19,108 - 19,108 4-Dec-13 $7.16 - 62,773 - - 62,773 - 62,773
70,286 62,773 (17,348) (7,916) 107,795 12,152 95,643
Debra Stirling 11-Nov-08 $22.13 16,073 - (16,073) - - - - 10-Nov-09 $35.15 8,574 - (8,574) - - - - 10-Nov-10 $42.29 10,513 - - (7,696) 2,817 2,817 - 23-Sep-11 $33.18 13,404 - - (978) 12,426 - 12,426 23-Sep-12 $29.12 18,612 - - (7,462) 11,150 - 11,150 4-Dec-13 $7.16 - 61,142 - (44,852) 16,290 - 16,290
67,176 61,142 (24,647) (60,988) 42,683 2,817 39,866

REMUNERATION REPORT
Newcrest Mining Limited – Annual Financial Report – Year Ended 30 June 2014 D 39
Former Executives Movements During the Year As at Cessation Date (6)
Grant Date
Share Price at
Grant Date
Balance at 1 July 2013
Rights Granted
Rights Exercised
Rights Lapsed (2)
Balance at Cessation
Date (6)
Vested and Exercisable
(3)
Non- Vested
(4) Lawrie Conway 10-Nov-10 $42.29 2,662 - (713) (1,949) - - - 23-Sep-11 $33.18 12,510 - - (1,988) 10,522 - 10,522 23-Sep-12 $29.12 17,371 - - (8,471) 8,900 - 8,900 4-Dec-13 $7.16 - 57,066 - (46,809) 10,257 - 10,257
32,543 57,066 (713) (59,217) 29,679 - 29,679
Stephen Creese 10-Nov-09 $35.15 9,254 - - - 9,254 9,254 - 10-Nov-10 $42.29 10,814 - - (1,284) 9,530 9,530 23-Sep-11 $33.18 14,368 - - (5,866) 8,502 - 8,502 23-Sep-12 $29.12 19,950 - - (14,703) 5,247 - 5,247
54,386 - - (21,853) 32,533 9,254 23,279
Brett Fletcher 10-Nov-10 $42.29 9,845 - - (7,207) 2,638 2,638 - 23-Sep-11 $33.18 13,940 - - (3,590) 10,350 - 10,350 23-Sep-12 $29.12 19,356 - - (11,348) 8,008 - 8,008 4-Dec-13 $7.16 - 63,588 - (58,424) 5,164 - 5,164
43,141 63,588 - (80,569) 26,160 2,638 23,522
Scott Langford 23-Sep-12 $29.12 17,371 - - (10,518) 6,853 - 6,853
17,371 - - (10,518) 6,853 - 6,853
Andrew Logan 11-Nov-08 $22.13 5,732 - (5,732) - - - - 10-Nov-09 $35.15 3,058 - - - 3,058 3,058 - 10-Nov-10 $42.29 3,642 - - (2,666) 976 976 - 23-Sep-11 $33.18 12,510 - - - 12,510 - 12,510 23-Sep-12 $29.12 17,371 - - - 17,371 - 17,371 4-Dec-13 $7.16 - 57,066 - - 57,066 - 57,066
42,313 57,066 (5,732) (2,666) 90,981 4,034 86,947
Peter Smith 10-Nov-10 $42.29 10,964 - - (982) 9,982 - 9,982 23-Sep-11 $33.18 13,940 - - (5,283) 8,657 - 8,657 23-Sep-12 $29.12 19,356 - - (13,699) 5,657 - 5,657
44,260 - - (19,964) 24,296 - 24,296
(1) Francesca Lee and David Woodall commenced with the company after the grant date and were not
entitled to participate in the 2014 financial year LTI plan.
(2) Includes lapses incurred as a result of the November 2010 plan vesting, along with all lapses in line with separation agreements entered into in the year ended 30 June 2014.
(3) During the year, the November 2010 LTI plan vested at 26.8 percent. Refer to section 6.3 for details.
(4) All equity-based remuneration is ‘at risk’ and will lapse or be forfeited, in the event that minimum prescribed performance conditions are not met by the Company or individual employees, as applicable.
(5) In addition Sandeep Biswas’ is entitled under his Executive Service Agreement to two tranches of ordinary shares in the Company, each of 54,990 shares (or cash equivalent) to be transferred in November 2014 and 2015 respectively, subject to Sandeep Biswas’ continuing employment and satisfactory performance.
(6) For all former executives, this represents their holdings at the cessation date.
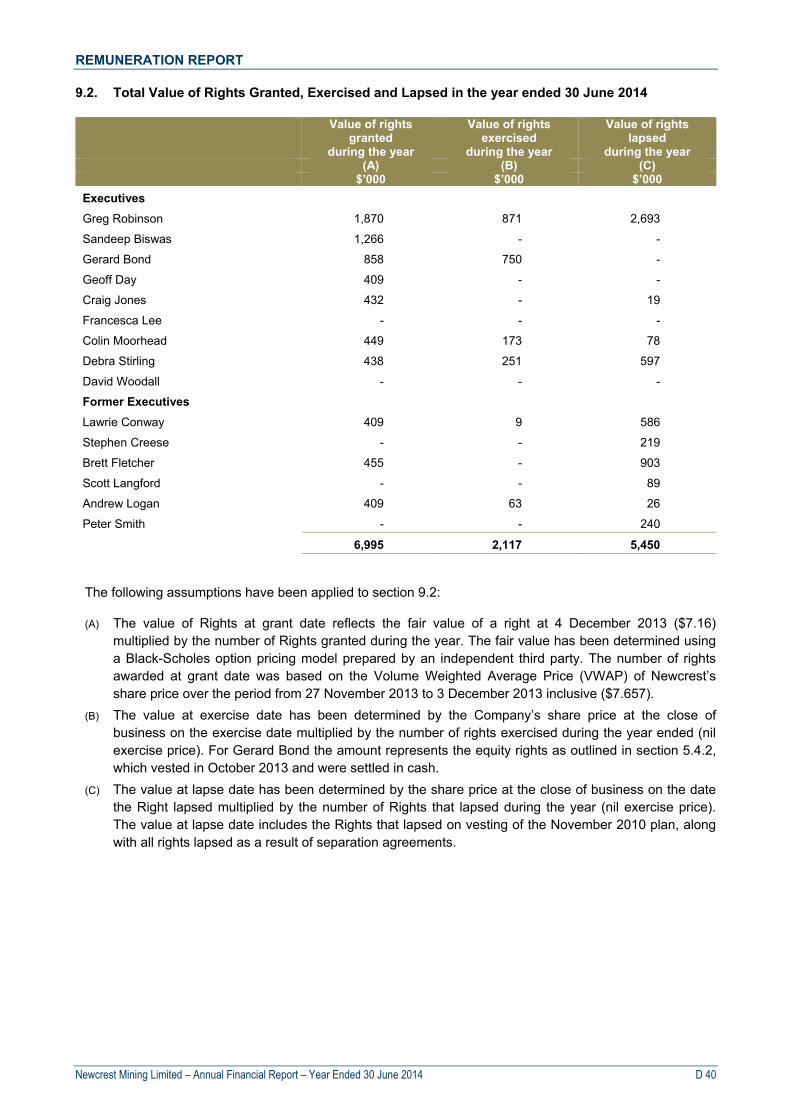
REMUNERATION REPORT
Newcrest Mining Limited – Annual Financial Report – Year Ended 30 June 2014 D 40
9.2. Total Value of Rights Granted, Exercised and Lapsed in the year ended 30 June 2014
Value of rights granted
during the year
Value of rights exercised
during the year
Value of rights lapsed
during the year (A) (B) (C) $’000 $’000 $’000
Executives
Greg Robinson 1,870 871 2,693
Sandeep Biswas 1,266 - -
Gerard Bond 858 750 -
Geoff Day 409 - -
Craig Jones 432 - 19
Francesca Lee - - -
Colin Moorhead 449 173 78
Debra Stirling 438 251 597
David Woodall - - -
Former Executives
Lawrie Conway 409 9 586
Stephen Creese - - 219
Brett Fletcher 455 - 903
Scott Langford - - 89
Andrew Logan 409 63 26
Peter Smith - - 240
6,995 2,117 5,450
The following assumptions have been applied to section 9.2:
(A) The value of Rights at grant date reflects the fair value of a right at 4 December 2013 ($7.16) multiplied by the number of Rights granted during the year. The fair value has been determined using a Black-Scholes option pricing model prepared by an independent third party. The number of rights awarded at grant date was based on the Volume Weighted Average Price (VWAP) of Newcrest’s share price over the period from 27 November 2013 to 3 December 2013 inclusive ($7.657).
(B) The value at exercise date has been determined by the Company’s share price at the close of business on the exercise date multiplied by the number of rights exercised during the year ended (nil exercise price). For Gerard Bond the amount represents the equity rights as outlined in section 5.4.2, which vested in October 2013 and were settled in cash.
(C) The value at lapse date has been determined by the share price at the close of business on the date the Right lapsed multiplied by the number of Rights that lapsed during the year (nil exercise price). The value at lapse date includes the Rights that lapsed on vesting of the November 2010 plan, along with all rights lapsed as a result of separation agreements.

REMUNERATION REPORT
Newcrest Mining Limited – Annual Financial Report – Year Ended 30 June 2014 D 41
9.3. Shareholdings of Executives and Non-Executive Directors
Balance at1 July 2013, or at date appointed
Sharesacquired on exercise of
rights
Net other
movements
Closing Balance at 30 June 2014, or at Separation
date
Executives
Greg Robinson 60,490 80,780 - 141,270
Sandeep Biswas - - 2,512 2,512
Gerard Bond 28,488 - - 28,488
Geoff Day - - - -
Craig Jones - - - -
Francesca Lee - - - -
Colin Moorhead 17,317 17,348 - 34,665
Debra Stirling 14,060 24,647 30,000 68,707
David Woodall - - - -
Former Executives
Lawrie Conway 30,937 713 - 31,650
Stephen Creese - - - -
Brett Fletcher - - - -
Scott Langford 4,828 - - 4,828
Andrew Logan (1) 6,614 5,732 (5,732) 6,614
Peter Smith 20,964 - - 20,964
Non-Executive Directors
Peter Hay - - 5,000 5,000
Don Mercer 25,000 - - 25,000
Philip Aiken AM 7,769 - - 7,769
Vince Gauci 18,400 - - 18,400
Winifred Kamit 326 - - 326
Richard Knight 40,000 - - 40,000
Rick Lee 28,447 - - 28,447
Tim Poole 4,235 - - 4,235
John Spark 18,105 - 14,000 32,105
325,980 129,220 45,780 500,980
(1) Represents Andrew Logan’s holding at 28 February 2014, when he ceased to be a member of the Executive Committee.
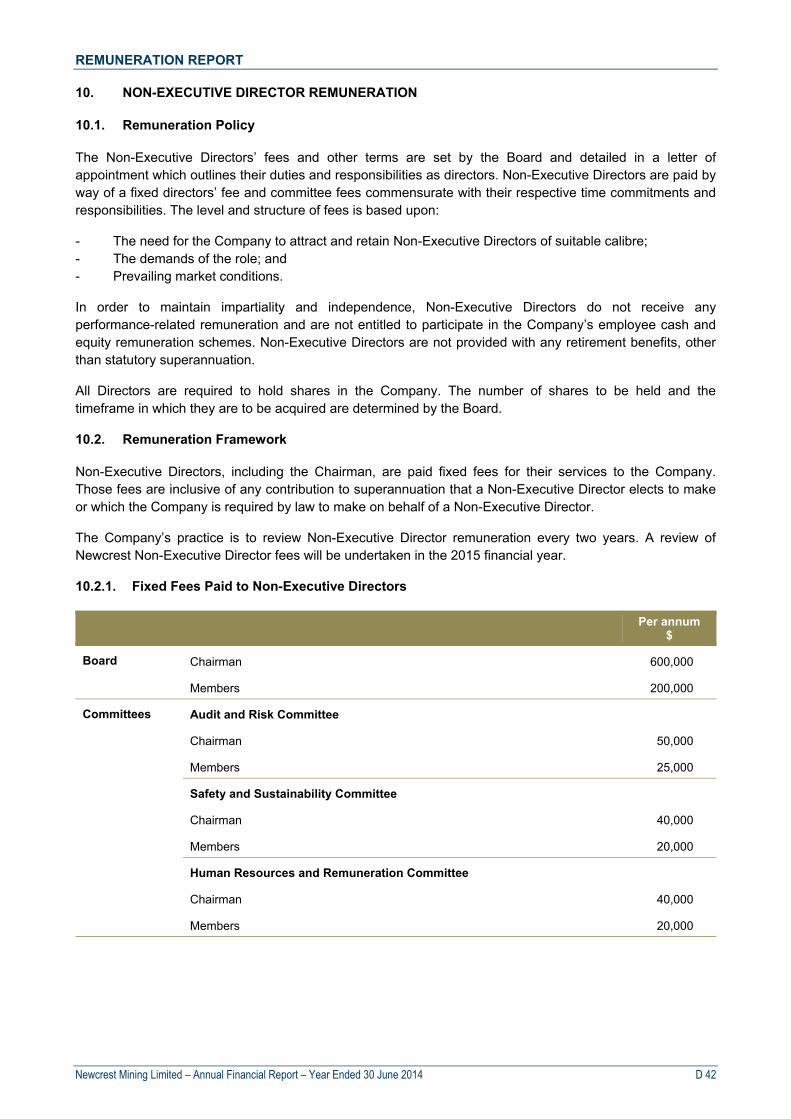
REMUNERATION REPORT
Newcrest Mining Limited – Annual Financial Report – Year Ended 30 June 2014 D 42
10. NON-EXECUTIVE DIRECTOR REMUNERATION
10.1. Remuneration Policy
The Non-Executive Directors’ fees and other terms are set by the Board and detailed in a letter of appointment which outlines their duties and responsibilities as directors. Non-Executive Directors are paid by way of a fixed directors’ fee and committee fees commensurate with their respective time commitments and responsibilities. The level and structure of fees is based upon:
- The need for the Company to attract and retain Non-Executive Directors of suitable calibre; - The demands of the role; and - Prevailing market conditions.
In order to maintain impartiality and independence, Non-Executive Directors do not receive any performance-related remuneration and are not entitled to participate in the Company’s employee cash and equity remuneration schemes. Non-Executive Directors are not provided with any retirement benefits, other than statutory superannuation.
All Directors are required to hold shares in the Company. The number of shares to be held and the timeframe in which they are to be acquired are determined by the Board.
10.2. Remuneration Framework
Non-Executive Directors, including the Chairman, are paid fixed fees for their services to the Company. Those fees are inclusive of any contribution to superannuation that a Non-Executive Director elects to make or which the Company is required by law to make on behalf of a Non-Executive Director.
The Company’s practice is to review Non-Executive Director remuneration every two years. A review of Newcrest Non-Executive Director fees will be undertaken in the 2015 financial year.
10.2.1. Fixed Fees Paid to Non-Executive Directors
Per annum
$
Board Chairman 600,000
Members 200,000
Committees Audit and Risk Committee
Chairman 50,000
Members 25,000
Safety and Sustainability Committee
Chairman 40,000
Members 20,000
Human Resources and Remuneration Committee
Chairman 40,000
Members 20,000
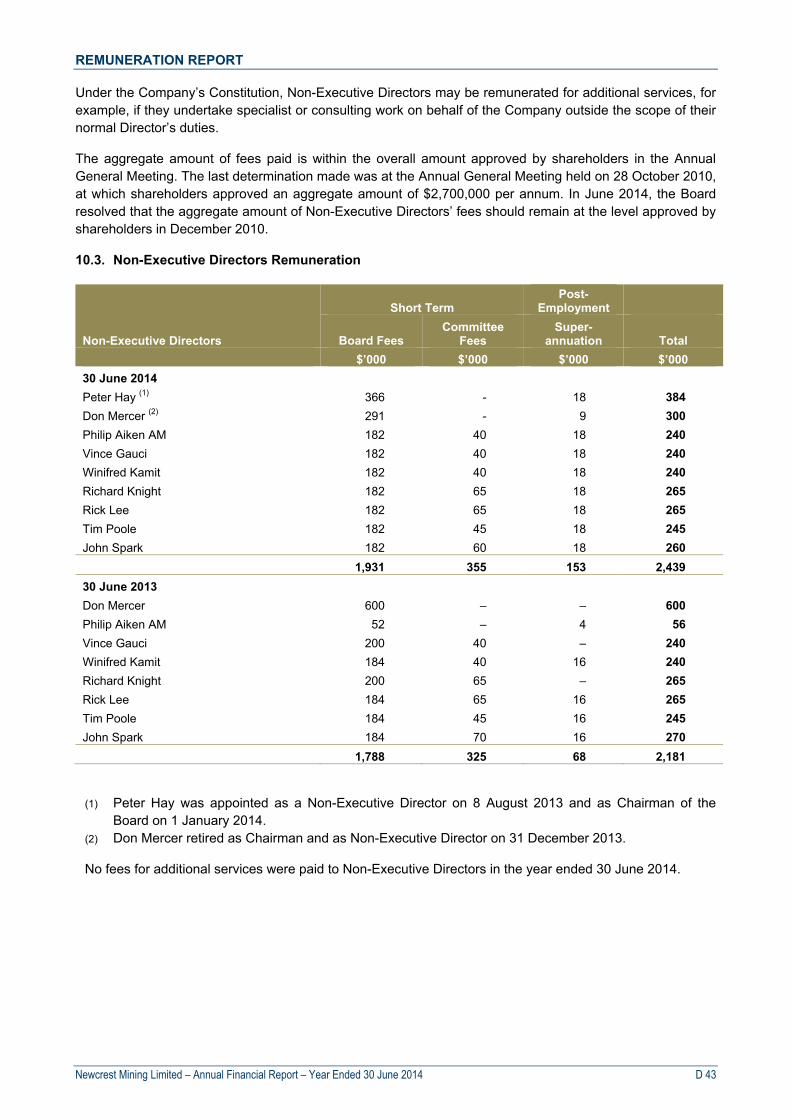
REMUNERATION REPORT
Newcrest Mining Limited – Annual Financial Report – Year Ended 30 June 2014 D 43
Under the Company’s Constitution, Non-Executive Directors may be remunerated for additional services, for example, if they undertake specialist or consulting work on behalf of the Company outside the scope of their normal Director’s duties.
The aggregate amount of fees paid is within the overall amount approved by shareholders in the Annual General Meeting. The last determination made was at the Annual General Meeting held on 28 October 2010, at which shareholders approved an aggregate amount of $2,700,000 per annum. In June 2014, the Board resolved that the aggregate amount of Non-Executive Directors’ fees should remain at the level approved by shareholders in December 2010.
10.3. Non-Executive Directors Remuneration
Non-Executive Directors
Short Term Post-
Employment
Board Fees Committee
Fees Super-
annuation
Total
$’000 $’000 $’000 $’000
30 June 2014
Peter Hay (1) 366 - 18 384
Don Mercer (2) 291 - 9 300
Philip Aiken AM 182 40 18 240
Vince Gauci 182 40 18 240
Winifred Kamit 182 40 18 240
Richard Knight 182 65 18 265
Rick Lee 182 65 18 265
Tim Poole 182 45 18 245
John Spark 182 60 18 260
1,931 355 153 2,439
30 June 2013
Don Mercer 600 – – 600
Philip Aiken AM 52 – 4 56
Vince Gauci 200 40 – 240
Winifred Kamit 184 40 16 240
Richard Knight 200 65 – 265
Rick Lee 184 65 16 265
Tim Poole 184 45 16 245
John Spark 184 70 16 270
1,788 325 68 2,181
(1) Peter Hay was appointed as a Non-Executive Director on 8 August 2013 and as Chairman of the Board on 1 January 2014.
(2) Don Mercer retired as Chairman and as Non-Executive Director on 31 December 2013.
No fees for additional services were paid to Non-Executive Directors in the year ended 30 June 2014.

REMUNERATION REPORT
Newcrest Mining Limited – Annual Financial Report – Year Ended 30 June 2014 D 44
11. REMUNERATION CONSULTANTS
The Company engages the services of independent and specialist remuneration consultants from time to time to provide recommendations on remuneration for Executives. Remuneration consultants are engaged by the Non-Executive Directors and report any remuneration recommendations directly to the Remuneration Committee.
The Remuneration Committee has engaged KPMG during the year ended 30 June 2014, to provide remuneration advice on the structure and terms of the 2015 financial year STI and LTI incentive plans. The fees paid to KPMG in respect of this work are detailed in section 11.1.
For each of the remuneration recommendations provided, the Board is satisfied that the recommendations were made free from any undue influence. In addition to the Board approved protocols that have been adhered to, in each case KPMG provided a formal declaration confirming that the recommendation was made free from “undue influence” by the members of the Key Management Personnel to whom the recommendation related.
The Board has also retained the appointment of PricewaterhouseCoopers (PwC) as additional remuneration consultants for the year ended 30 June 2014. Neither the Board nor the Human Resources and Remuneration Committee has sought or received remuneration recommendations from PwC during the year ended 30 June 2014. No fee has been paid to PwC.
11.1. Fees Received by KPMG as Remuneration Consultants
2014$’000
Amounts received by KPMG for:
Remuneration recommendations and advice 81
Taxation advice 282
Internal audit services 121
Other 37
Total 521

FINANCIAL STATEMENTS
Newcrest Mining Limited – Annual Financial Report – Year Ended 30 June 2014 E 1
Contents
Consolidated Income Statement E2
Consolidated Statement of Comprehensive Income E3
Consolidated Statement of Financial Position E4
Consolidated Statement of Cash Flows E5
Consolidated Statement of Changes in Equity E6
Notes to the Consolidated Financial Statements E8
Directors’ Declaration E90
Independent Auditor’s Report E91

CONSOLIDATED INCOME STATEMENT FOR THE YEAR ENDED 30 JUNE 2014
Newcrest Mining Limited – Annual Financial Report – Year Ended 30 June 2014 E 2
2014 2013* Note $M $M
Operating sales revenue 5(a) 4,040 3,775 Cost of sales 5(b) (3,094) (2,941) Gross profit 946 834 Exploration expenses 17 (36) (64) Corporate administration expenses 5(c) (134) (132) Other income/(expenses) 5(d) (12) (82) Share of profit/(loss) of associate 21 22 (110) Restructure costs 6(a) (46) (72) Write-down of non-current assets 6(b) (174) (166) Impairment losses 6(c) (3,128) (6,147) Impairment reversal/(charge) in associate 6(d) 11 (151) Loss before interest and income tax (2,551) (6,090) Finance income 1 1 Finance costs 5(e) (175) (110) Loss before income tax (2,725) (6,199) Income tax benefit 8(a) 510 419 Loss after income tax (2,215) (5,780) Loss after tax attributable to: Non-controlling interests 6 3 Owners of the parent (2,221) (5,783) (2,215) (5,780) Earnings per share (cents per share) Basic loss per share 10 (289.8) (755.1) Diluted loss per share 10 (289.8) (755.1)
The above Statement should be read in conjunction with the accompanying notes. * Comparative information has been restated to reflect the adoption of Interpretation 20 – Stripping Costs in the
Production Phase of a Surface Mine. Refer to Note 4 for details.

CONSOLIDATED STATEMENT OF COMPREHENSIVE INCOME FOR THE YEAR ENDED 30 JUNE 2014
Newcrest Mining Limited – Annual Financial Report – Year Ended 30 June 2014 E 3
2014 2013* Note $M $M
Loss after income tax (2,215) (5,780) Other comprehensive income/(loss) Items that may be reclassified subsequently to the Income Statement Cashflow hedges Cashflow hedges deferred in equity 5 (2) Income tax expense/(benefit) (1) - 4 (2) Investments Net loss on available-for-sale financial assets transferred to the
Income Statement 1 1 Share of other comprehensive income/(loss) of associate 2 (2) 3 (1) Foreign currency translation Foreign currency translation (loss)/gain (81) 894 (81) 894 Other comprehensive income/(loss) for the year, net of tax (74) 891 Total comprehensive loss for the year (2,289) (4,889) Total comprehensive loss attributable to: Non-controlling interests 3 18 Owners of the parent (2,292) (4,907) (2,289) (4,889) The above Statement should be read in conjunction with the accompanying notes. * Comparative information has been restated to reflect the adoption of Interpretation 20 – Stripping Costs in the
Production Phase of a Surface Mine. Refer to Note 4 for details.
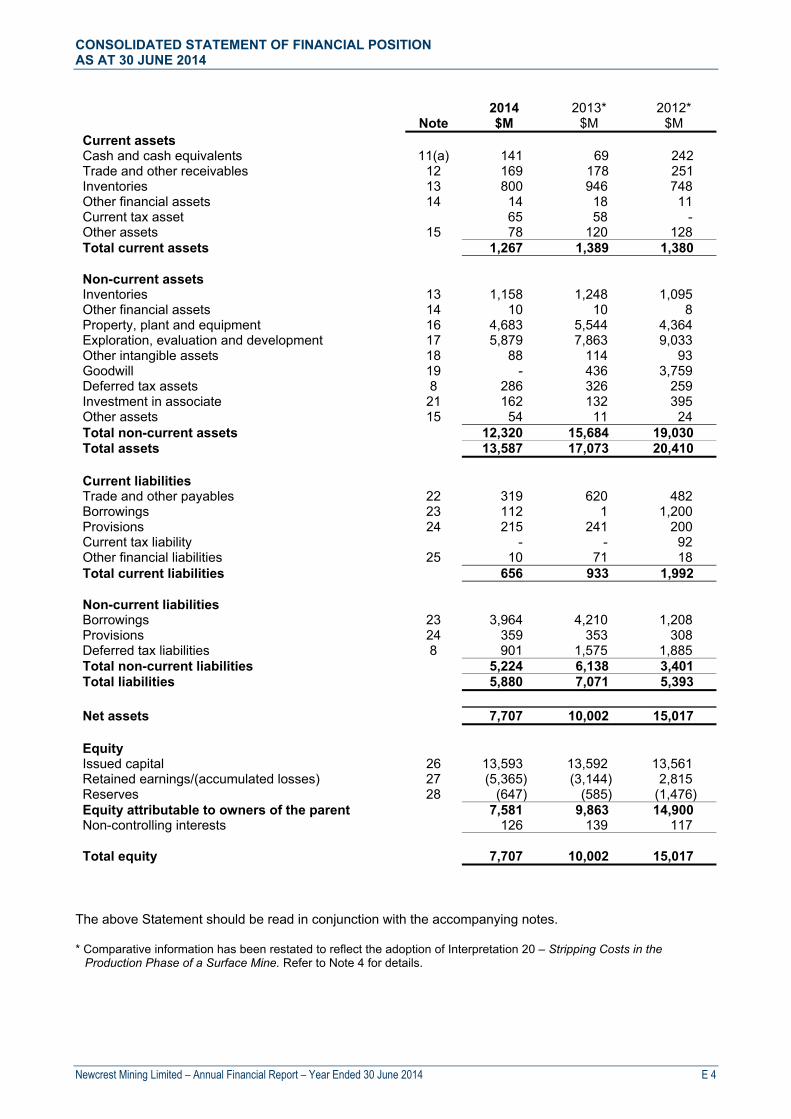
CONSOLIDATED STATEMENT OF FINANCIAL POSITION AS AT 30 JUNE 2014
Newcrest Mining Limited – Annual Financial Report – Year Ended 30 June 2014 E 4
2014 2013* 2012* Note $M $M $M Current assets Cash and cash equivalents 11(a) 141 69 242 Trade and other receivables 12 169 178 251 Inventories 13 800 946 748 Other financial assets 14 14 18 11 Current tax asset 65 58 - Other assets 15 78 120 128 Total current assets 1,267 1,389 1,380 Non-current assets Inventories 13 1,158 1,248 1,095 Other financial assets 14 10 10 8 Property, plant and equipment 16 4,683 5,544 4,364 Exploration, evaluation and development 17 5,879 7,863 9,033 Other intangible assets 18 88 114 93 Goodwill 19 - 436 3,759 Deferred tax assets 8 286 326 259 Investment in associate 21 162 132 395 Other assets 15 54 11 24 Total non-current assets 12,320 15,684 19,030 Total assets 13,587 17,073 20,410 Current liabilities Trade and other payables 22 319 620 482 Borrowings 23 112 1 1,200 Provisions 24 215 241 200 Current tax liability - - 92 Other financial liabilities 25 10 71 18 Total current liabilities 656 933 1,992 Non-current liabilities Borrowings 23 3,964 4,210 1,208 Provisions 24 359 353 308 Deferred tax liabilities 8 901 1,575 1,885 Total non-current liabilities 5,224 6,138 3,401 Total liabilities 5,880 7,071 5,393 Net assets 7,707 10,002 15,017 Equity Issued capital 26 13,593 13,592 13,561 Retained earnings/(accumulated losses) 27 (5,365) (3,144) 2,815 Reserves 28 (647) (585) (1,476) Equity attributable to owners of the parent 7,581 9,863 14,900 Non-controlling interests 126 139 117 Total equity 7,707 10,002 15,017
The above Statement should be read in conjunction with the accompanying notes. * Comparative information has been restated to reflect the adoption of Interpretation 20 – Stripping Costs in the
Production Phase of a Surface Mine. Refer to Note 4 for details.

CONSOLIDATED STATEMENT OF CASH FLOWS FOR THE YEAR ENDED 30 JUNE 2014
Newcrest Mining Limited – Annual Financial Report – Year Ended 30 June 2014 E 5
2014 2013* Note $M $M Cash flows from operating activities Receipts from customers 3,967 3,815 Payments to suppliers and employees (2,636) (2,409) Interest received 1 1 Interest paid (162) (98) Income taxes paid (138) (162) Dividends received 5 - Net cash provided by operating activities 11(b) 1,037 1,147
Cash flows from investing activities Payments for property, plant and equipment (205) (466) Mine under construction, development and feasibility expenditure (439) (1,440) Exploration and evaluation expenditure (62) (152) Production stripping expenditure (191) (440) Information systems development (8) (40) Interest capitalised to development projects (7) (35) Proceeds from sale of plant and equipment 8 - Proceeds from sale of investments - 9 Net cash used in investing activities (904) (2,564)
Cash flows from financing activities Proceeds from borrowings:
US dollar bilateral bank debt 2,038 2,054 US dollar corporate bonds - 948
Repayment of borrowings: US dollar bilateral bank debt (2,076) (1,623)
Net repayment of finance lease principal (1) (3) Payment for treasury shares (6) (1) Proceeds from partial sale of shares in subsidiary to non-controlling
interests, net of withholding tax
40 - 117 Dividends paid:
Members of the parent entity - (230) Non-controlling interests (16) (26)
Net cash provided by financing activities (61) 1,236 Net increase/(decrease) in cash and cash equivalents 72 (181) Cash and cash equivalents at the beginning of the year 69 242 Effects of exchange rate changes on cash held - 8 Cash and cash equivalents at the end of the year 11(a) 141 69
The above Statement should be read in conjunction with the accompanying notes. * Comparative information has been restated to reflect the adoption of Interpretation 20 – Stripping Costs in the Production Phase of a Surface Mine. Refer to Note 4 for details.
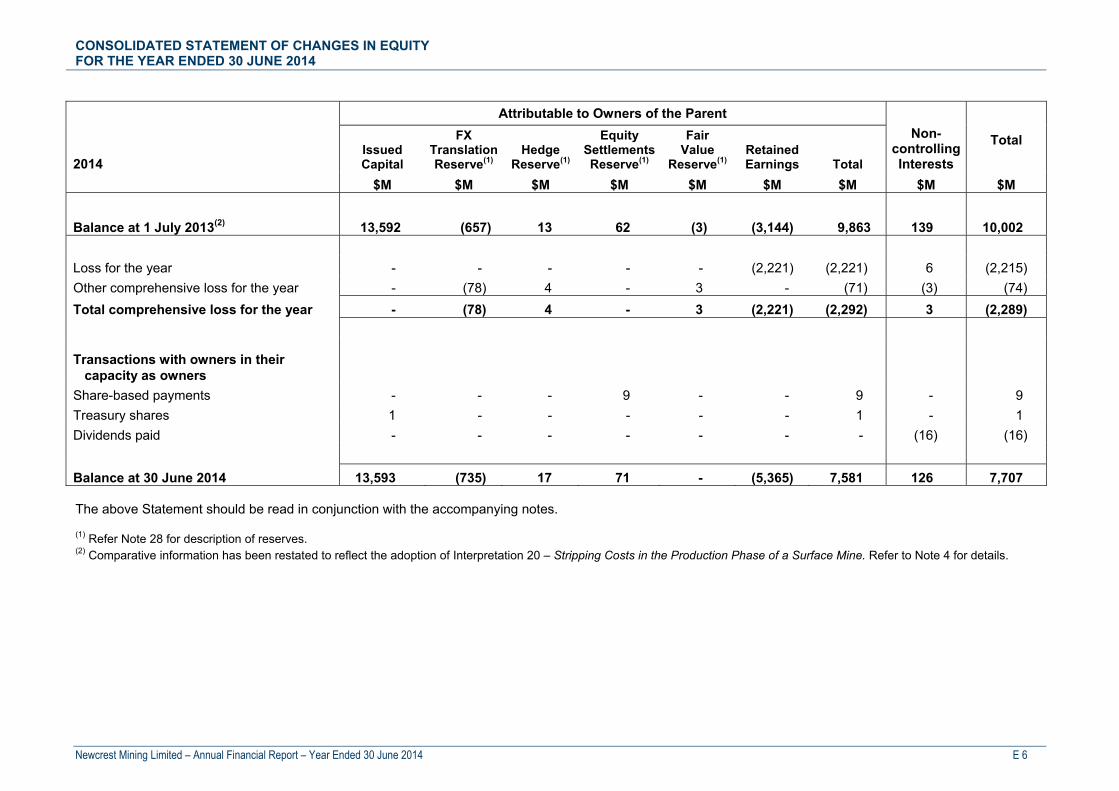
CONSOLIDATED STATEMENT OF CHANGES IN EQUITY FOR THE YEAR ENDED 30 JUNE 2014
Newcrest Mining Limited – Annual Financial Report – Year Ended 30 June 2014 E 6
Attributable to Owners of the Parent Non-
controlling Interests
Total 2014
Issued Capital
FX Translation Reserve(1)
Hedge Reserve(1)
Equity Settlements Reserve(1)
Fair Value
Reserve(1) Retained Earnings Total
$M $M $M $M $M $M $M $M $M
Balance at 1 July 2013(2) 13,592 (657) 13 62 (3) (3,144) 9,863 139 10,002
Loss for the year - - - - - (2,221) (2,221) 6 (2,215)
Other comprehensive loss for the year - (78) 4 - 3 - (71) (3) (74)
Total comprehensive loss for the year - (78) 4 - 3 (2,221) (2,292) 3 (2,289)
Transactions with owners in their capacity as owners
Share-based payments - - - 9 - - 9 - 9
Treasury shares 1 - - - - - 1 - 1
Dividends paid - - - - - - - (16) (16)
Balance at 30 June 2014 13,593 (735) 17 71 - (5,365) 7,581 126 7,707 The above Statement should be read in conjunction with the accompanying notes. (1) Refer Note 28 for description of reserves. (2) Comparative information has been restated to reflect the adoption of Interpretation 20 – Stripping Costs in the Production Phase of a Surface Mine. Refer to Note 4 for details.

CONSOLIDATED STATEMENT OF CHANGES IN EQUITY FOR THE YEAR ENDED 30 JUNE 2014
Newcrest Mining Limited – Annual Financial Report – Year Ended 30 June 2014 E 7
Attributable to Owners of the Parent
2013
Issued Capital
FX Translation Reserve(1)
Hedge
Reserve(1)
Equity Settlements Reserve(1)
Fair Value
Reserve(1)
Retained Earnings
Total
Non- Controlling
Interest
Total
$M $M $M $M $M $M $M $M $M
Balance at 1 July 2012 13,561 (1,543) 15 54 (2) 2,890 14,975 119 15,094
Assets written-off to retained earnings under transitional provisions of Interpretation 20 (after tax) - - - -
- (75) (75) (2) (77)
Restated opening balance 1 July 2012(2) 13,561 (1,543) 15 54 (2) 2,815 14,900 117 15,017
Profit/(loss) for the year(2) - - - - - (5,783) (5,783) 3 (5,780) Other comprehensive income for the year(2) - 879 (2) - (1) - 876 15 891
Total comprehensive income for the year - 879 (2) - (1) (5,783) (4,907) 18 (4,889)
Transactions with owners in their
capacity as owners Share-based payments - - - 8 - - 8 - 8 Shares issued - Dividend reinvestment plan 38 - - - - - 38 - 38 Treasury shares (7) - - - - - (7) - (7) Changes in equity interests held by the parent (Note 36) - 7 - - - 92 99 30 129 Dividends paid - - - - - (268) (268) (26) (294)
Balance at 30 June 2013 13,592 (657) 13 62 (3) (3,144) 9,863 139 10,002 The above Statement should be read in conjunction with the accompanying notes. (1) Refer Note 28 for description of reserves. (2) Comparative information has been restated to reflect the adoption of Interpretation 20 – Stripping Costs in the Production Phase of a Surface Mine. Refer to Note 4 for details.
NOTES TO THE CONSOLIDATED FINANCIAL STATEMENTS FOR THE YEAR ENDED 30 JUNE 2014
Newcrest Mining Limited – Annual Financial Report – Year Ended 30 June 2014 E 8
1. Corporate Information Newcrest Mining Limited is a company limited by shares, domiciled and incorporated in Australia whose shares are publicly traded on the Australian Securities Exchange (ASX) and the Port Moresby Stock Exchange (PoMSOX). The registered office of Newcrest Mining Limited is Level 9, 600 St Kilda Road, Melbourne, Victoria, 3004, Australia. The nature of operations and principal activities of Newcrest Mining Limited and its controlled entities are exploration, mine development, mine operations and the sale of gold and gold/copper concentrate. The financial report of Newcrest Mining Limited for the year ended 30 June 2014 was authorised for issue in accordance with a resolution of the Directors on 18 August 2014. 2. Summary of Significant Accounting Policies The significant accounting policies adopted in the preparation of this financial report are: (a) Basis of Preparation and Statement of Compliance The financial report is a general purpose financial report, prepared by a for-profit entity, in accordance with the requirements of the Corporations Act 2001, Australian Accounting Standards and other authoritative pronouncements of the Australian Accounting Standards Board (AASB). The financial report has been prepared on a historical cost basis, except for derivative financial instruments and available-for-sale assets which have been measured at fair value. The financial report also complies with International Financial Reporting Standards (IFRS) including interpretations as issued by the International Accounting Standards Board. The financial report has been presented in Australian dollars and all values are rounded to the nearest $1,000,000 unless otherwise stated. The accounting policies have been consistently applied by all entities included in the Group and are consistent with those applied in the prior year, except as disclosed in Note 2(dd) and Note 4. (b) Basis of Consolidation The consolidated financial statements include the financial statements of the parent entity, Newcrest Mining Limited, and its controlled entities (referred to as ‘the Consolidated Entity’ or ‘the Group’ in these financial statements). A list of significant controlled entities is presented in Note 35. Control is achieved when the Group is exposed, or has the rights, to variable returns from its involvement with the investee and has the ability to affect those returns through its power over the investee. Specifically, the Group controls an investee if and only if the Group has: Power over the investee; Exposure, or rights, to variable returns from its involvement with the investee; and The ability to use its power over the investee to affect its returns. When the Group has less than a majority of the voting or similar rights of an investee, the Group considers all relevant facts and circumstances in assessing whether it has power over the investee, including: The contractual arrangement with the other vote holders of the investee; Rights arising from other contractual arrangements; The Group’s voting rights and potential voting rights. The Group re-assesses whether or not it controls an investee if facts and circumstances indicate that there are changes to one or more of the three elements of control.

NOTES TO THE CONSOLIDATED FINANCIAL STATEMENTS FOR THE YEAR ENDED 30 JUNE 2014
Newcrest Mining Limited – Annual Financial Report – Year Ended 30 June 2014 E 9
2. Summary of Significant Accounting Policies (continued) (b) Basis of Consolidation (continued) Controlled entities are consolidated from the date on which control commences until the date that control ceases. All intercompany balances and transactions, including unrealised gains and losses arising from intra-group transactions, have been eliminated in preparing the consolidated financial statements. Non-controlling interest in the results and equity of the entities that are controlled by the Group is shown separately in the Income Statement, Statement of Comprehensive Income, Statement of Financial Position and Statement of Changes in Equity respectively. A change in the ownership interest of a subsidiary that does not result in a loss of control, is accounted for as an equity transaction. (c) Interest in Joint Operations A joint operation is a joint arrangement whereby the parties that have joint control of the arrangement have rights to the assets, and obligations for the liabilities, relating to the arrangement. Joint control is the contractually agreed sharing of control of an arrangement, which exists only when decisions about the relevant activities require unanimous consent of the parties sharing control. When a Group entity undertakes its activities under joint operations, the Group as a joint operator recognises in relation to its interest in a joint operation, its: assets, including its share of any assets held jointly; liabilities, including its share of any liabilities incurred jointly; revenue from the sale of its share of the output arising from the joint operation; share of the revenue from the sale of the output by the joint operation; and expenses, including its share of any expenses incurred jointly. The Group accounts for the assets, liabilities, revenues and expenses relating to its interest in a joint operation in accordance with the standards applicable to the particular assets, liabilities, revenues and expenses. When a group entity transacts with a joint operation in which a group entity is a joint operator (such as a sale or contribution of assets), the Group is considered to be conducting the transaction with the other parties to the joint operation, and gains and losses resulting from the transactions are recognised in the Group's consolidated financial statements only to the extent of other parties' interests in the joint operation. When a group entity transacts with a joint operation in which a group entity is a joint operator (such as a purchase of assets), the Group does not recognise its share of the gains and losses until it resells those assets to a third party. Details of the Group’s interests in joint operations are shown in Note 38.
NOTES TO THE CONSOLIDATED FINANCIAL STATEMENTS FOR THE YEAR ENDED 30 JUNE 2014
Newcrest Mining Limited – Annual Financial Report – Year Ended 30 June 2014 E 10
2. Summary of Significant Accounting Policies (continued) (d) Investment in Associates An associate is an entity that is neither a subsidiary nor joint arrangement, over which the Group has significant influence. Significant influence is the power to participate in the financial and operating policy decisions of the investee, but is not control or joint control over those policies. Significant influence is presumed to exist where the Group has a holding of 20 per cent of more of the voting power in the investee, unless it can be clearly demonstrated that this is not the case. Conversely a holding of less than 20 per cent is presumed not to give rise to significant influence, unless it can be clearly demonstrated that there is in fact significant influence. The Group’s investment in an associate is accounted for using the equity method. Under the equity method, the investment in the associate is carried on the Statement of Financial Position at cost plus post acquisition changes in the Group’s share of net assets of the associate. The Income Statement reflects the Group’s share of the results of operations of the associate. When there has been a change recognised directly in the equity of the associate, the Group recognises its share of any changes and discloses this, when applicable, in the Statement of Changes in Equity. Unrealised gains and losses resulting from transactions between the Group and the associate are eliminated to the extent of the interest in the associate. The Group’s share of profit of an associate is included in the Income Statement. This is the profit attributable to equity holders of the associate and, therefore, is profit after tax and non-controlling interests in the subsidiaries of the associate. After application of the equity method, the Group determines whether it is necessary to recognise an additional impairment loss on its investment in its associate. The Group determines at each reporting date whether there is any objective evidence that the investment in the associate is impaired, or if a previously recognised impairment should be reversed. If this is the case, the Group calculates the amount of impairment (or reversal) as the difference between the recoverable amount of the associate and its carrying value and recognises the amount in the Income Statement. Upon loss of significant influence over the associate, the Group measures and recognises any retaining investment at its fair value. Any difference between the carrying amount of the associate upon loss of significant influence and the fair value of the retained investment and proceeds from disposal is recognised in profit or loss.

NOTES TO THE CONSOLIDATED FINANCIAL STATEMENTS FOR THE YEAR ENDED 30 JUNE 2014
Newcrest Mining Limited – Annual Financial Report – Year Ended 30 June 2014 E 11
2. Summary of Significant Accounting Policies (continued) (e) Foreign Currency Functional and Presentation Currency Both the functional and presentation currency of Newcrest Mining Limited and its Australian controlled entities is Australian dollars ($). Each entity in the Group determines its own functional currency and items included in the financial statements of each entity are measured using that functional currency. The functional currency of the Group’s foreign operations is US dollars (US$). Transactions and Balances Transactions in foreign currencies are initially recorded in the functional currency at the exchange rates ruling at the date of the transaction. The subsequent payment or receipt of funds related to a transaction is translated at the rate applicable on the date of payment or receipt. Monetary assets and liabilities denominated in foreign currencies are retranslated at the rate of exchange ruling at the reporting date. Non-monetary items that are measured in terms of historical cost in a foreign currency are translated using the exchange rate as at the date of the initial transaction. All exchange differences in the consolidated financial report are taken to the Income Statement with the exception of differences on certain US dollar denominated borrowings where the foreign currency components are designated as either cash flow hedges of future US dollar denominated sales or hedges of a net investment in a foreign operation. These are taken directly to the hedge reserve in equity until the forecast sales used to repay the debt occur (for cash flow hedges) or the foreign operation is disposed (for net investment hedges), at which time they are recognised in the Income Statement. Translation of Foreign Operations The assets and liabilities of controlled entities incorporated overseas with functional currencies other than Australian dollars are translated into the presentation currency of Newcrest Mining Limited (Australian dollars) at the rates of exchange ruling at the reporting date and the income statements are translated at the weighted average exchange rates for the period. Exchange differences arising on translation are taken directly to the foreign currency translation reserve in equity. On consolidation, exchange differences arising from the translation of net investments in foreign operations and of the borrowings designated as hedges of the net investment are taken to the foreign currency translation reserve (refer Note 2(v)). If the foreign operation were sold, the proportionate share of exchange differences would be transferred out of equity and recognised in the Income Statement. (f) Cash and Cash Equivalents Cash and cash equivalents in the Statement of Financial Position comprise cash at bank and in hand and short-term deposits. For the purpose of the Statement of Cash Flows, cash and cash equivalents consist of cash and cash equivalents as defined above, net of outstanding bank overdrafts.

NOTES TO THE CONSOLIDATED FINANCIAL STATEMENTS FOR THE YEAR ENDED 30 JUNE 2014
Newcrest Mining Limited – Annual Financial Report – Year Ended 30 June 2014 E 12
2. Summary of Significant Accounting Policies (continued) (g) Trade and Other Receivables Trade receivables comprising Metal in Concentrate receivables and Bullion Awaiting Settlement are initially recorded at the fair value of contracted sale proceeds expected to be received only when there has been a passing of significant risks and rewards of ownership to the customer. Collectability of debtors is reviewed on an ongoing basis. Receivables which are known to be uncollectible are written off and an allowance for doubtful debts is raised where objective evidence exists that the debt will not be collected. Other receivables are initially measured at fair value then subsequently at amortised cost, less an allowance for impairment. (h) Inventories Gold in solution form, ore and work in progress is physically measured or estimated and valued at the lower of cost and net realisable value. Cost represents the weighted average cost and includes direct costs and an appropriate portion of fixed and variable production overhead expenditure, including depreciation and amortisation, incurred in converting materials into finished goods. Materials and supplies are valued at the lower of cost and net realisable value. Any allowance for obsolescence is determined by reference to specific stock items identified. A regular and ongoing review is undertaken to establish the extent of surplus items and an allowance is made for any potential loss on their disposal. Net realisable value is the estimated selling price in the ordinary course of business, less estimated costs of completion and estimated costs necessary to make the sale. Ore stockpiles which are not scheduled to be processed in the twelve months after the reporting date are classified as non-current inventory. The Group believes the processing of these stockpiles will have a future economic benefit to the Group and accordingly values these stockpiles at the lower of cost and net realisable value. (i) Production Stripping Expenditure As part of its mining operations, the Group incurs stripping (waste removal) costs both during the development phase and production phase of its operations. Stripping costs incurred during the production phase are generally considered to create two benefits, being either the production of inventory in the period or improved access to the ore to be mined in the future. Where the benefits are realised in the form of inventory produced in the period, the production stripping costs are accounted for as part of the cost of producing those inventories. Where production stripping costs are incurred and the benefit is improved access to the ore to be mined in the future, the costs are recognised as a non-current asset, referred to as a ‘production stripping asset’, if the following criteria are met; Future economic benefits (being improved access to the ore body) associated with the stripping activity
are probable; The component of the ore body for which access has been improved can be accurately identified; and The costs associated with the stripping activity associated with that component can be reliably
measured. The amount of stripping costs deferred is based on the ratio obtained by dividing the amount of waste tonnes mined by the quantity of gold ounces contained in the ore for each component of the mine. Stripping costs incurred in the period are deferred to the extent that the actual current period waste to contained gold ounce ratio exceeds the life of component expected waste to contained gold ounce ratio (‘life of component’) ratio.
NOTES TO THE CONSOLIDATED FINANCIAL STATEMENTS FOR THE YEAR ENDED 30 JUNE 2014
Newcrest Mining Limited – Annual Financial Report – Year Ended 30 June 2014 E 13
2. Summary of Significant Accounting Policies (continued) (i) Production Stripping Expenditure (continued) A component is defined as a specific volume of the ore body that is made more accessible by the stripping activity. An identified component of the ore body is typically a subset of the total ore body of the mine. It is considered that each mine may have several components, which are identified based on the mine plan. The mine plans and therefore the identification of specific components will vary between mines as a result of both the geological characteristics and location of the ore body. The financial considerations of the mining operations may also impact the identification and designation of a component. The identification of components is necessary for both the measurement of costs at the initial recognition of the production stripping asset, and the subsequent depreciation of the production stripping asset. The life of component ratio is a function of an individual mine’s design and therefore changes to that design will generally result in changes to the ratio. Changes in other technical or economic parameters that impact reserves will also have an impact on the life of component ratio even if they do not affect the mine’s design. Changes to the life of component ratio are accounted for prospectively from the date of change. The production stripping asset is initially measured at cost, which is the accumulation of costs directly incurred to perform the stripping activity that improves access to the identified component of ore, plus an allocation of directly attributable overhead costs. If incidental operations are occurring at the same time as the production stripping activity, but are not necessary for the production stripping activity to continue as planned, these costs are not included in the cost of the stripping activity asset. The production stripping asset is depreciated over the expected useful life of the identified component of the ore body that is made more accessible by the activity, on a units of production basis. Economically recoverable reserves are used to determine the expected useful life of the identified component of the ore body. The production stripping asset is then carried at cost less depreciation and any impairment losses. The production stripping asset is included in ‘Exploration, Evaluation and Development’. These costs form part of the total investment in the relevant cash generating unit to which they relate, which is reviewed for impairment in accordance with the Group’s impairment accounting policy (refer Note 2 (p)). (j) Property, Plant and Equipment Cost Property, plant and equipment is carried at cost less accumulated depreciation and any accumulated impairment losses. Financial costs incurred directly in relation to major capital works are capitalised up to the time of commissioning the asset. Freehold land is held for extractive industry operations and its value is wholly dependent upon those operations. These assets form part of the total investment in the relevant cash generating unit to which they relate, which is reviewed for impairment in accordance with the Group’s impairment accounting policy (refer Note 2 (p)). Depreciation and Amortisation Items of property, plant and equipment, including buildings but excluding freehold land, are depreciated over their estimated useful lives. The Group uses the unit-of-production basis when depreciating mine specific assets which results in a depreciation/amortisation charge proportional to the depletion of the anticipated remaining life of mine production. Each item’s economic life has due regard to both its physical life limitations and to present assessments of economically recoverable reserves of the mine property at which it is located. For the remainder of assets the straight line method is used, resulting in estimated useful lives between 3 – 20 years, the duration of which reflects the useful life depending on the nature of the asset. Estimates of remaining useful lives and depreciation methods are reviewed annually for all major items of plant and equipment.
NOTES TO THE CONSOLIDATED FINANCIAL STATEMENTS FOR THE YEAR ENDED 30 JUNE 2014
Newcrest Mining Limited – Annual Financial Report – Year Ended 30 June 2014 E 14
2. Summary of Significant Accounting Policies (continued) (j) Property, Plant and Equipment (continued) Major spares purchased specifically for particular plant are capitalised and depreciated on the same basis as the plant to which they relate. Assets are depreciated or amortised from the date they are installed and are ready for use, or in respect of internally constructed assets, from the time the asset is completed and deemed ready for use. The cost of improvements to leasehold properties is amortised over the unexpired period of the lease or the estimated useful life of the improvement, whichever is the shorter. Leases The determination of whether an arrangement is or contains a lease is based on the substance of the arrangement and requires an assessment of whether the fulfilment of the arrangement is dependent on the use of a specific asset or assets and the arrangement conveys a right to use the asset. Leases of plant and equipment under which the Group assumes substantially all the risks and benefits incidental to ownership are classified as finance leases. Other leases are classified as operating leases. Finance leases are capitalised, with a lease asset and a lease liability equal to the fair value of the leased asset or, if lower, at the present value of the minimum lease payments determined at the inception of the lease. Lease payments are apportioned between the finance charges and reduction of the lease liability. The finance charge component within the lease payments is expensed. Capitalised leased assets are depreciated over the shorter of the estimated useful life of the asset and the lease term if there is no reasonable certainty that the Group will obtain ownership by the end of the lease term. Payments made under operating leases are expensed on a straight-line basis over the lease term, except where an alternative basis is more representative of the pattern of benefits to be derived from the leased property. (k) Exploration, Evaluation and Feasibility Expenditure Exploration and Evaluation Exploration and evaluation expenditure related to areas of interest is capitalised and carried forward to the extent that:
Rights to tenure of the area of interest are current; and
(a) Costs are expected to be recouped through successful development and exploitation of the area of interest or alternatively by sale; or
(b) Where activities in the area of interest have not yet reached a stage which permits a reasonable assessment of the existence or otherwise of economically recoverable reserves, and active and significant operations in, or in relation to, the area of interest are continuing.
Such expenditure consists of an accumulation of acquisition costs and direct net exploration and evaluation costs incurred by or on behalf of the Group, together with an appropriate portion of directly related overhead expenditure. Deferred Feasibility Feasibility expenditure represents costs related to the preparation and completion of a feasibility study to enable a development decision to be made in relation to an area of interest and capitalised as incurred. At the commencement of production, all past exploration, evaluation and feasibility expenditure in respect of an area of interest that has been capitalised is transferred to mine development where it is amortised over the life of the area of interest to which it relates on a unit-of-production basis. When an area of interest is abandoned or the Directors decide it is not commercial, any accumulated costs in respect of that area are written off in the year the decision is made. Each area of interest is reviewed at the end of each reporting period and accumulated costs written off to the extent they are not expected to be recoverable in the future.
NOTES TO THE CONSOLIDATED FINANCIAL STATEMENTS FOR THE YEAR ENDED 30 JUNE 2014
Newcrest Mining Limited – Annual Financial Report – Year Ended 30 June 2014 E 15
2. Summary of Significant Accounting Policies (continued) (l) Mine Construction and Development Mines Under Construction Expenditure incurred in constructing a mine by, or on behalf of, the Group is accumulated separately for each area of interest in which economically recoverable reserves have been identified. This expenditure includes net direct costs of construction, borrowing costs capitalised during construction and an appropriate allocation of attributable overheads. Once a development decision has been taken, all aggregated costs of construction are transferred to non-current assets as either mine development or buildings, plant and equipment as appropriate. Mine Development Mine development represents expenditure in respect of exploration, evaluation, feasibility and development incurred by or on behalf of the Group, including overburden removal and construction costs, previously accumulated and carried forward in relation to areas of interest in which mining has now commenced. Such expenditure comprises net direct costs and an appropriate allocation of directly related overhead expenditure. All expenditure incurred prior to commencement of production from each development property is carried forward to the extent to which recoupment out of future revenue from the sale of production, or from the sale of the property, is reasonably assured. When further development expenditure is incurred in respect of a mine property after commencement of production, such expenditure is carried forward as part of the cost of the mine property only when future economic benefits are reasonably assured, otherwise the expenditure is classified as part of the cost of production and expensed as incurred. Such capitalised development expenditure is added to the total carrying value of mine development being amortised. Depreciation and Amortisation Amortisation of costs is provided using the unit-of-production method. These assets form part of the total investment in the relevant cash generating unit to which they relate, which is reviewed for impairment in accordance with the Group’s impairment accounting policy (refer Note 2 (p)). (m) Mineral Rights Mineral rights comprise identifiable exploration and evaluation assets, mineral resources and ore reserves, which are acquired as part of a business combination or a joint venture acquisition and are recognised at fair value at date of acquisition. Mineral rights are attributable to specific areas of interest and are classified within Exploration, Evaluation and Development. Mineral rights attributable to each area of interest are amortised when commercial production commences on a unit-of-production basis over the estimated economic reserve of the mine to which the rights relate. These assets form part of the total investment in the relevant cash generating unit to which they relate, which is reviewed for impairment in accordance with the Group’s impairment accounting policy (refer Note 2 (p)).

NOTES TO THE CONSOLIDATED FINANCIAL STATEMENTS FOR THE YEAR ENDED 30 JUNE 2014
Newcrest Mining Limited – Annual Financial Report – Year Ended 30 June 2014 E 16
2. Summary of Significant Accounting Policies (continued) (n) Goodwill Goodwill acquired in a business combination is initially measured at cost of the business combination being the excess of the consideration transferred over the fair value of the Group's net identifiable assets acquired and liabilities assumed. If this consideration transferred is lower than the fair value of the net identifiable assets of the subsidiary acquired, the difference is recognised in profit or loss. After initial recognition, goodwill is measured at cost less any accumulated impairment losses. For the purpose of impairment testing, goodwill acquired in a business combination is, from the acquisition date, allocated to each of the Group's Cash-Generating Units (CGU), or groups of CGUs, that are expected to benefit from the synergies of the combination, irrespective of whether other assets or liabilities of the Group are assigned to those units or groups of units. Each unit or group of units to which the goodwill is allocated represents the lowest level within the entity at which the goodwill is monitored for internal management purposes, and is not larger than an operating segment determined in accordance with AASB 8. Impairment is determined by assessing the recoverable amount of the CGU (group of CGUs), to which the goodwill relates. The recoverable amount is the higher of the CGUs: Fair value less costs of disposal; and Value in use. In assessing value in use, the estimated future cash flows are discounted to their present
value using a pre-tax discount rate that reflects current market assessments of the time value of money and the risks specific to the CGU.
The Group performs impairment testing on goodwill half-yearly to determine whether there is an indication of impairment. When the recoverable amount of the CGU (group of CGUs) is less than the carrying amount, an impairment loss is recognised. When goodwill forms part of a CGU (group of CGUs) and an operation within that unit is disposed of, the goodwill associated with the operation disposed of is included in the carrying amount of the operation when determining the gain or loss on disposal of the operation. Goodwill disposed of in this manner is measured based on the relative values of the operation disposed of and the portion of the CGU retained. Impairment losses recognised for goodwill are not subsequently reversed. (o) Other Intangible Assets Costs incurred in developing information technology systems and acquiring software are capitalised as intangible assets. Costs capitalised include external costs of materials and services and the cost of employee benefits. Amortisation is calculated on a straight line basis over the useful life, ranging from three to seven years. (p) Impairment of Non-Financial Assets The carrying amounts of all non-financial assets (including goodwill) are reviewed half-yearly to determine whether there is an indication of impairment. Where an indicator of impairment exists, a formal estimate of the recoverable amount is made. Recoverable amount is the higher of fair value less costs of disposal and value in use. If the carrying amount of an asset exceeds its estimated recoverable amount, the asset is written down to its recoverable amount and an impairment loss is recognised in the Income Statement. Individual assets are grouped for impairment purposes at the lowest level for which there are separately identifiable cash inflows that are largely independent of the cash inflows from other assets or groups of assets (CGUs). Generally, this results in the Group evaluating its mine properties on a geographical basis. Non-current assets other than goodwill that have recognised impairment are tested for possible reversal of the impairment whenever events or changes in circumstances indicate that the impairment may have been reversed.

NOTES TO THE CONSOLIDATED FINANCIAL STATEMENTS FOR THE YEAR ENDED 30 JUNE 2014
Newcrest Mining Limited – Annual Financial Report – Year Ended 30 June 2014 E 17
2. Summary of Significant Accounting Policies (continued) (q) Non-Current Assets and Disposal Groups held for Sale Non-current assets and disposal groups are classified as held for sale and measured at the lower of their carrying amount and fair value less costs to sell if their carrying amount will be recovered principally through a sale transaction instead of use. They are not depreciated or amortised. For an asset or disposal group to be classified as held for sale, it must be available for immediate sale in its present condition and its sale must be highly probable. An impairment loss is recognised for any initial or subsequent write-down of the asset (or disposal group) to fair value less costs to sell. A gain is recognised for any subsequent increases in fair value less costs of disposal of an asset (or disposal group), but not in excess of any cumulative impairment loss previously recognised. A gain or loss not previously recognised by the date of the sale of the non-current asset (or disposal group) is recognised at the date of derecognition. (r) Trade and Other Payables Liabilities for trade and other payables are initially recorded at the fair value of the consideration to be paid in the future for goods and services received, whether or not billed to the Group, and then subsequently at amortised cost. (s) Borrowings and Borrowing Costs Borrowings are initially recognised at fair value and subsequently at amortised cost. Borrowing costs directly attributable to the acquisition, construction or production of qualifying assets, which are assets that necessarily take a substantial period of time to get ready for their intended use, are added to the cost of those assets, until such time as the assets are substantially ready for their intended use. The capitalisation rate used to determine the amount of borrowing costs to be capitalised is the weighted average interest rate applicable to the Group’s outstanding borrowings during the year used to develop the qualifying asset. All other borrowing costs are recognised as expenses in the period in which they are incurred. (t) Employee Benefits Short-Term Benefits Liabilities arising in respect of wages and salaries, salary at risk, annual leave and any other employee benefits expected to be settled within twelve months of the reporting date are measured at their nominal amounts based on remuneration rates which are expected to be paid when the liabilities are settled. These amounts are recognised in ‘Trade and Other Payables’ (for amounts other than annual leave and salary at risk) and ‘Current Provisions’ (for annual leave and salary at risk) in respect of employees’ services up to the reporting date. Costs incurred in relation to non-accumulating sick leave are recognised when leave is taken and are measured at the rates paid or payable.
Long-Term Benefits The liability for long service leave and other long term benefits is measured at the present value of the estimated future cash outflows to be made by the Group resulting from employees’ services provided up to the reporting date. Long-term benefits not expected to be settled within twelve months are discounted using the rates attaching to national government securities at the reporting date, which most closely match the terms of maturity of the related liability. In determining the liability for these long term employee benefits, consideration has been given to expected future increases in wage and salary rates, the Group’s experience with staff departures and periods of service. Related on-costs are also included in the liability. Defined Contribution Superannuation Plan Contributions to defined contribution superannuation plans are expensed when incurred.

NOTES TO THE CONSOLIDATED FINANCIAL STATEMENTS FOR THE YEAR ENDED 30 JUNE 2014
Newcrest Mining Limited – Annual Financial Report – Year Ended 30 June 2014 E 18
2. Summary of Significant Accounting Policies (continued) (u) Provisions Provisions are recognised when the Group has a present obligation (legal or constructive) as a result of a past event, it is probable that an outflow of resources embodying economic benefits will be required to settle the obligation and a reliable estimate can be made of the amount of the obligation. Provision for Rehabilitation The Group records the present value of the estimated cost of legal and constructive obligations (such as those under the Group’s Environmental Policy) to rehabilitate operating locations in the period in which the obligation is incurred. The nature of rehabilitation activities includes dismantling and removing structures, rehabilitating mines, dismantling operating facilities, closure of plant and waste sites and restoration, reclamation and revegetation of affected areas. Typically the obligation arises when the asset is installed or the ground/environment is disturbed at the production location. When the liability is initially recorded, the present value of the estimated cost is capitalised by increasing the carrying amount of the related mining assets. Over time, the discounted liability is increased for the change in the present value based on a discount rate that reflects current market assessments. Additional disturbances or changes in rehabilitation costs will be recognised as additions or changes to the corresponding asset and rehabilitation liability when incurred. The unwinding of the effect of discounting the provision is recorded as a finance cost in the Income Statement. The carrying amount capitalised as a part of mining assets is depreciated/amortised over the life of the related asset. Costs incurred that relate to an existing condition caused by past operations but do not have a future economic benefit are expensed as incurred. (v) Derivative Financial Instruments and Hedging The Group uses derivative financial instruments to manage its risk to commodity prices. The instruments used by the Group include forward sale contracts, diesel forward contracts and foreign currency forward contracts. Derivatives are initially recognised at fair value on the date a derivative contract is entered into and are subsequently remeasured to their fair value at each reporting date. The resulting gain or loss is recognised in the Income Statement immediately unless the derivative is designated and effective as a hedging instrument, in which event, the timing of recognition in the Income Statement depends on the nature of the hedge relationship. The fair value of forward sale contracts, diesel forward contracts and foreign currency forward contracts are calculated by reference to current forward commodity prices. At the inception of the transaction, the Group formally designates and documents the relationship between hedging instruments and hedged items, as well as its risk management objective and strategy for undertaking various hedge transactions. The Group also documents its assessment, both at hedge inception and on an ongoing basis, of whether the derivatives that are used in hedging transactions have been and will continue to be highly effective in offsetting changes in fair values or cash flows of hedged items. For the purposes of hedge accounting, hedges are classified as: Fair value hedges, when they hedge the exposure to changes in the fair value of a recognised asset or
liability; Cash flow hedges, when they hedge exposure to variability in cash flows that are either attributable to a
particular risk associated with a recognised asset or liability or a highly probable forecast transaction; or Hedges of a net investment in a foreign operation.

NOTES TO THE CONSOLIDATED FINANCIAL STATEMENTS FOR THE YEAR ENDED 30 JUNE 2014
Newcrest Mining Limited – Annual Financial Report – Year Ended 30 June 2014 E 19
2. Summary of Significant Accounting Policies (continued) (v) Derivative Financial Instruments and Hedging (continued) Cash Flow Hedges The effective portion of changes in the fair value of derivatives that are designated and qualify as cash flow hedges are recognised in other Comprehensive Income through the Hedge Reserve. The gain or loss relating to the ineffective portion is recognised immediately in the Income Statement. Amounts accumulated in equity are transferred to the Income Statement in the periods when the hedged item affects the Income Statement, for instance when the forecast sale that is hedged takes place. Hedge accounting is discontinued when the hedging instrument expires or is sold, terminated or exercised, or no longer qualifies for hedge accounting. At that point in time, any cumulative gain or loss on the hedging instrument recognised in equity remains deferred in equity until the original forecasted transaction occurs. When the forecasted transaction is no longer expected to occur, the cumulative gain or loss that was deferred in equity is recognised immediately in the Income Statement. If a hedging instrument being used to hedge a commitment for the purchase or sale of gold or copper is redesignated as a hedge of another specific commitment and the original transaction is still expected to occur, the gains and losses that arise on the hedging instrument prior to its redesignation are deferred and included in the measurement of the original purchase or sale when it takes place. If the hedging instrument is redesignated as a hedge of another commitment because the original purchase or sale transaction is no longer expected to occur, the gains and losses that arise on the hedge prior to its redesignation are recognised in the Income Statement at the date of the redesignation. (w) Earnings Per Share (EPS) Basic EPS is calculated as net profit attributable to members, adjusted to exclude costs of servicing equity (other than dividends) and preference share dividends, divided by the weighted average number of ordinary shares, adjusted for any bonus element. Diluted EPS is calculated as net profit attributable to members, adjusted for: costs of servicing equity (other than dividends) and preference share dividends; the after tax effect of dividends and interest associated with dilutive potential ordinary shares that have
been recognised as expenses; other non-discretionary changes in revenues or expenses during the period that would result from the
dilution of potential ordinary shares; divided by the weighted average number of ordinary shares and dilutive potential ordinary shares, adjusted for any bonus element. (x) Issued Capital Issued ordinary share capital is classified as equity and is recognised at the fair value of the consideration received by the Group. Any transaction costs arising on the issue of ordinary shares and the associated tax are recognised directly in equity as a reduction of the share proceeds received. Treasury Shares The Group's own equity instruments, which are reacquired on market for later use in employee share-based payment arrangements (treasury shares), are deducted from equity. No gain or loss is recognised in profit or loss on the purchase, sale, issue or cancellation of the Group's own equity instruments.

NOTES TO THE CONSOLIDATED FINANCIAL STATEMENTS FOR THE YEAR ENDED 30 JUNE 2014
Newcrest Mining Limited – Annual Financial Report – Year Ended 30 June 2014 E 20
2. Summary of Significant Accounting Policies (continued) (y) Revenue Recognition Revenue from the sale of goods is recognised when there has been a transfer of risks and rewards to the customer and no further processing is required by the Group, the quality and quantity of the goods has been determined with reasonable accuracy, the price is fixed or determinable, and collectability is probable. The point at which risk and title passes for the majority of the Group’s commodity sales is upon receipt of the bill of lading when the commodity is delivered for shipment. Revenue is measured at the fair value of the consideration received or receivable. Gold and Silver Bullion Sales Revenue from gold and silver bullion sales, is brought to account when the significant risks and rewards of ownership have transferred to the buyer and selling prices are known or can be reasonably estimated. Gold, Copper and Silver in Concentrate Sales The terms of metal in concentrate sales contracts with third parties contain provisional pricing arrangements whereby the selling price for metal in concentrate is based on prevailing spot prices on a specified future date after shipment to the customer (quotation period). Adjustments to the sales price occur based on movements in quoted market prices up to the date of final settlement The period between provisional invoicing and final settlement is typically between one and six months. The provisionally priced sales of metal in concentrate contain an embedded derivative that is required to be separated from the host contract for accounting purposes. Accordingly the embedded derivative, which does not qualify for hedge accounting, is recognised at fair value, with subsequent changes in fair value recognised in the Income Statement each period until final settlement, and presented as ‘Other Income/Expense’. Changes in fair value over the quotation period and up until final settlement are estimated by reference to forward market prices. Contract terms for the Group’s sale of gold, copper and silver in concentrate allow for an adjustment based on final assay results of the metal in concentrate by the customer to determine content. Recognition of sales revenue for these commodities is based on the most recently determined estimate of metal price in concentrate with a subsequent adjustment made upon final determination and presented as part of revenue. Interest Revenue Interest revenue is recognised as it accrues using the effective interest method. (z) Government Royalties Royalties under existing royalty regimes are payable on sales and are therefore recognised as the sale occurs.

NOTES TO THE CONSOLIDATED FINANCIAL STATEMENTS FOR THE YEAR ENDED 30 JUNE 2014
Newcrest Mining Limited – Annual Financial Report – Year Ended 30 June 2014 E 21
2. Summary of Significant Accounting Policies (continued) (aa) Income Taxes Current Income Tax Current tax assets and liabilities for the current and prior year are measured at the amount expected to be recovered from or paid to the taxation authorities based on the current year's taxable income. The tax rates and tax laws used to compute the amount are those that are enacted or substantively enacted by the reporting date. Deferred Income Tax Deferred income tax is provided on all temporary differences (except as noted below) at the reporting date between the tax bases of assets and liabilities and their carrying amounts for financial reporting purposes. Deferred tax assets and liabilities are not recognised if the temporary differences giving rise to them: Arise from the initial recognition of an asset or liability in a transaction that is not a business combination
and that, at the time of the transaction, affects neither the accounting profit nor taxable profit or loss. Are associated with investments in subsidiaries, associates or interests in joint ventures, and the timing
of the reversal of the temporary difference can be controlled and it is probable that the temporary difference will not reverse in the foreseeable future.
Deferred tax assets are recognised for deductible temporary differences, carry-forward of unused tax credits and unused tax losses to the extent that it is probable that taxable profit will be available against which the deductible temporary differences and the carry-forward of unused tax credits and unused tax losses can be utilised. The carrying amount of deferred tax assets is reviewed at each reporting date and reduced to the extent that it is no longer probable that sufficient taxable profit will be available to allow all or part of the deferred income tax asset to be utilised. Unrecognised deferred tax assets are reassessed at each reporting date and are recognised to the extent that it has become probable that future taxable profit will allow the deferred tax asset to be recovered. Deferred tax assets and liabilities are measured at the tax rates that are expected to apply to the year when the asset is realised or the liability is settled, based on tax rates (and tax laws) that have been enacted or substantively enacted at the reporting date. Current and deferred taxes attributable to amounts recognised directly in equity are also recognised directly in equity. (bb) Goods and Services Tax (GST) Revenues, expenses and assets are recognised net of the amount of GST except: where the GST incurred on a purchase of goods and services is not recoverable from the taxation
authority, in which case the GST is recognised as part of the cost of acquisition of the asset or as part of the expense item as applicable; and
receivables and payables are stated with the amount of GST included. The net amount of GST recoverable from, or payable to, the taxation authority is included as part of receivables or payables in the Statement of Financial Position. Cash flows are included in the Statement of Cash Flows on a gross basis and the GST component of cash flows arising from investing and financing activities, which is recoverable from, or payable to, the taxation authority is classified as part of operating cash flows. Commitments and contingencies are disclosed net of the amount of GST recoverable from, or payable to, the taxation authority.

NOTES TO THE CONSOLIDATED FINANCIAL STATEMENTS FOR THE YEAR ENDED 30 JUNE 2014
Newcrest Mining Limited – Annual Financial Report – Year Ended 30 June 2014 E 22
2. Summary of Significant Accounting Policies (continued) (cc) Business Combinations Business combinations are accounted for using the acquisition method. The consideration transferred in a business combination is measured at fair value, which is calculated as the sum of the acquisition date fair values of the: assets transferred by the Group; liabilities incurred by the acquirer to former owners of the acquiree; equity issued by the Group; and the amount of any non-controlling interest in the acquiree. For each business combination, the Group measures the non-controlling interest in the acquiree either at fair value or at the proportionate share of the acquiree's identifiable net assets. Acquisition-related costs are expensed as incurred. When the Group acquires a business, it assesses the financial assets and liabilities assumed for appropriate classification and designation in accordance with the contractual terms, economic conditions, the Group’s operating or accounting policies and other pertinent conditions as at the acquisition date. This includes the separation of embedded derivatives in host contracts by the acquiree. If the business combination is achieved in stages, the acquisition date fair value of the acquirer's previously held equity interest in the acquiree is remeasured at fair value as at the acquisition date through profit or loss. Any contingent consideration to be transferred by the Group will be recognised at fair value at the acquisition date. Subsequent changes to the fair value of the contingent consideration which is deemed to be an asset or liability will be recognised in accordance with AASB 139 either in profit or loss or in other comprehensive income. If the contingent consideration is classified as equity, it is not remeasured. (dd) New Accounting Standards and Interpretations Adoption of New Standards and Interpretations The Group has adopted the following new and revised accounting standards, amendments and interpretations as of 1 July 2013: AASB 10 - Consolidated Financial Statements AASB 11 - Joint Arrangements AASB 12 - Disclosure of Interests in Other Entities AASB 13 - Fair Value Measurement AASB 119 - Employee Benefits AASB 124 - Related Party Disclosures Interpretation 20 - Stripping Costs in the Production Phase of a Surface Mine. With the exception of Interpretation 20, the adoption of these new and revised standards did not have a material impact on the Group’s financial statements. The impact on the Group’s financial statements from the adoption of Interpretation 20 is described in Note 4.

NOTES TO THE CONSOLIDATED FINANCIAL STATEMENTS FOR THE YEAR ENDED 30 JUNE 2014
Newcrest Mining Limited – Annual Financial Report – Year Ended 30 June 2014 E 23
2. Summary of Significant Accounting Policies (continued) (dd) New Accounting Standards and Interpretations (continued) New Accounting Standards and Interpretations not yet adopted The following standards, amendments to standards and interpretations have been identified as those which may impact the Group in the period of initial application. They have been issued but are not yet effective and are available for early adoption at 30 June 2014, but have not been applied in preparing this financial report. Reference & Title
Details of New Standard / Amendment / Interpretation Impact on
Group
Application date for the
Group AASB 132 Financial Instruments: Presentation
This revised standard adds application guidance to address inconsistencies identified in applying some of the offsetting criteria, including clarifying the meaning of “currently has a legally enforceable right of set-off” and that some gross settlement systems may be considered equivalent to net settlement.
(i) 1 July 2014
AASB 136 Impairment of Assets
The changes to this standard are in the disclosure only. The amendments include the requirement to disclose additional information about the fair value measurement when the recoverable amount of impaired assets is based on fair value less costs of disposal.
(iii) 1 July 2014
Interpretation 21 Levies
This interpretation clarifies when to recognise a liability to pay a levy. A levy is an outflow of resources embodying economic benefits that is imposed by governments in entities in accordance with applicable legislation.
(i) 1 July 2014
IFRS 15 Revenue from contracts with customers
IFRS 15 establishes principles for reporting the nature, amount, timing and uncertainty of revenue and cash flows arising from an entity’s contracts with customers.
(ii) 1 July 2017
AASB 9 / IFRS 9 Financial Instruments
AASB 2010-7 and AASB 2012-6
Amendments to AAS’s arising from AASB 9
The revised IFRS 9 will eventually replace AASB 139 and all previous versions of IFRS 9. The revised standard includes changes to the: classification and measurement of financial assets and financial
liabilities expected credit loss impairment model hedge accounting. Financial assets are measured at amortised cost, fair value through profit or loss, or fair value through other comprehensive income, based on both the entity’s business model for managing the financial assets and the financial asset’s contractual cash flow characteristics. Apart from the ‘own credit risk’ requirements, classification and measurement of financial liabilities is unchanged from existing requirements.
(ii) 1 July 2018
(i) The adoption of this new standard, amendment or interpretation will not have a material impact on the Group’s
financial statements. (ii) The Group has not yet determined the extent of the impact, if any. (iii) This new standard will result in additional/revised disclosures in the financial statements. Apart from the above, other accounting standards, amendments and interpretations that will be applicable in future periods have been considered, however their impact is considered insignificant to the Group.

NOTES TO THE CONSOLIDATED FINANCIAL STATEMENTS FOR THE YEAR ENDED 30 JUNE 2014
Newcrest Mining Limited – Annual Financial Report – Year Ended 30 June 2014 E 24
3. Critical Accounting Judgements, Estimates and Assumptions Judgements, estimates and assumptions are continually evaluated and are based on historical experience and other factors, including expectations of future events that are believed to be reasonable under the circumstances. The Group makes assumptions concerning the future. All judgements, estimates and assumptions made are believed to be reasonable based on the most current set of circumstances available to management. The resulting accounting estimates will, by definition, seldom equal the related actual results. The judgements, estimates and assumptions that have a significant risk of causing a material adjustment to the carrying amounts of assets and liabilities within the next financial year are discussed below. (a) Mine Rehabilitation Provision
The Group assesses its mine rehabilitation provision annually in accordance with the accounting policy Note 2(u). Significant judgement is required in determining the provision for mine rehabilitation as there are many transactions and other factors that will affect the ultimate liability payable to rehabilitate the mine sites. Factors that will affect this liability include future disturbances caused by further development, changes in technology, changes in regulations, price increases, changes in timing of cash flows which are based on life of mine plans and changes in discount rates. When these factors change or become known in the future, such differences will impact the mine rehabilitation provision in the period in which they change or become known.
(b) Unit-of-Production Method of Depreciation/Amortisation The Group uses the unit-of-production basis when depreciating/amortising specific assets which results in a depreciation/amortisation charge proportional to the depletion of the anticipated remaining life of mine production. Each item’s economic life, which is assessed annually, has due regard to both its physical life limitations and to present assessments of economically recoverable reserves of the mine property at which it is located. These calculations require the use of estimates and assumptions.
(c) Impairment of Assets The Group assesses each Cash-Generating Unit (CGU), including CGUs with Goodwill as listed in Note 19, half-yearly to determine whether there is any indication of impairment or reversal. Where an indicator of impairment or reversal exists, a formal estimate of the recoverable amount is made, which is deemed as being the higher of the fair value less costs to dispose and value in use calculated in accordance with accounting policy Note 2(p). These assessments require the use of estimates and assumptions such as discount rates, exchange rates, commodity prices, gold multiple values, future operating development and sustaining capital requirements and operating performance (including the magnitude and timing of related cash flows). Refer Note 20.
(d) Production Stripping The Group defers mining costs incurred during the production stage of its operations which are calculated in accordance with accounting policy Note 2(i). Changes in an individual mine’s design will generally result in changes to the life of component waste to contained gold ounce (life of component) ratio. Changes in other technical or economic parameters that impact reserves will also have an impact on the life of component ratio even if they do not affect the mine’s design. Changes to deferred mining resulting from a change in life of component ratios are accounted for prospectively.
(e) Capitalisation of Exploration and Evaluation Costs The Group’s accounting policy for exploration and evaluation expenditure is set out in Note 2(k). The application of this policy requires management to make certain estimates and assumptions as to future events and circumstances, in particular, the assessment of whether economic quantities of reserves will be found. Any such estimates and assumptions may change as new information becomes available.
NOTES TO THE CONSOLIDATED FINANCIAL STATEMENTS FOR THE YEAR ENDED 30 JUNE 2014
Newcrest Mining Limited – Annual Financial Report – Year Ended 30 June 2014 E 25
3. Critical Accounting Judgements, Estimates and Assumptions (continued)
(f) Recovery of Deferred Tax Assets
Deferred tax assets, including those arising from un-utilised tax losses, require management to assess the likelihood that the Group will comply with the relevant tax legislation and will generate sufficient taxable earnings in future periods in order to recognise and utilise those deferred tax assets. Estimates of future taxable income are based on forecast cash flows from operations and existing tax laws in each jurisdiction. These assessments require the use of estimates and assumptions such as exchange rates, commodity prices and operating performance over the life of the assets. To the extent that cash flows and taxable income differ significantly from estimates, the ability of the Group to realise the net deferred tax assets reported at the reporting date could be impacted. Additionally, future changes in tax laws in the jurisdictions in which the Group operates could limit the ability of the Group to obtain tax deductions in future periods.
(g) Ore Reserve Estimates The Group estimates its ore reserves and mineral resources annually in December each year, and reports in the following February, based on information compiled by Competent Persons as defined in accordance with the Australasian code for reporting Exploration Results, Mineral Resources and Ore Resources (JORC code 2012). The estimated quantities of economically recoverable reserves are based upon interpretations of geological models and require assumptions to be made regarding factors such as estimates of short and long-term exchange rates, estimates of short and long-term commodity prices, future capital requirements and future operating performance. Changes in reported reserves estimates can impact the carrying value of property, plant and equipment, mine development, production stripping assets, provision for rehabilitation obligations, the recognition of deferred tax assets, as well as the amount of depreciation and amortisation charged to the Income Statement.
(h) Investment in Associates Included in the carrying value of the investment in Evolution Mining Limited (Evolution) is the Group’s share of profit of the associate for the year ended 30 June 2014. At the date of this report, Evolution has not released its full financial statements for the year ended 30 June 2014. The Group’s share of the profit of the associate has been estimated based on publically available information, including the associate’s half-year accounts for the period ended 31 December 2013, and quarterly production reports to 30 June 2014. This estimate may change when full financial statements become available and this may impact the carrying value of the investment. Judgment is required in assessing whether there is objective evidence that the investment in Evolution is impaired or that a prior period impairment should be reversed. Refer Note 21.
(i) Share-Based Payments
The Group measures the cost of equity settled transactions with employees by reference to the fair value of equity instruments at the date at which they are granted. The fair value is determined by an external valuer using an option pricing model, using the assumptions detailed in Note 29.
NOTES TO THE CONSOLIDATED FINANCIAL STATEMENTS FOR THE YEAR ENDED 30 JUNE 2014
Newcrest Mining Limited – Annual Financial Report – Year Ended 30 June 2014 E 26
4. Impact of Adopting Interpretation 20 The Group has adopted Interpretation 20 - Stripping Costs in the Production Phase of a Surface Mine as of 1 July 2013. In open pit mining operations, it is necessary to remove overburden and other waste materials in order to access ore from which minerals can be extracted economically. The process of removing overburden and waste materials is referred to as stripping. The Group capitalises pre-production stripping costs incurred during the development of a mine (or pit) as part of the investment in construction of the mine. These costs are subsequently amortised over the life of the mine (or pit) on a units of production basis. This accounting treatment is unchanged by the implementation of Interpretation 20 which specifies the accounting for production stripping only. The Group’s accounting policy for production stripping costs for the financial year ended 30 June 2013 and previous financial reporting periods, was to defer costs where this was the most appropriate basis for matching the costs against the related economic benefits and where the effect was material. The amount of stripping costs deferred was based on the ratio obtained by dividing the amount of waste tonnes mined by the quantity of gold ounces contained in the ore for the life of mine (or pit/stage). Production stripping costs incurred in the period were deferred to the extent that the current period actual waste to contained gold ounce ratio exceeded the average life of mine (or pit/stage) expected ratio. Such deferred costs were then charged to profit or loss to the extent that, in subsequent periods, the current period actual ratio fell below the average life of mine (or pit/stage) expected ratio until those deferred costs were fully depleted. No production stripping liabilities were recognised. The life of mine (or pit/stage) ratio was based on economically recoverable reserves of the mine. Interpretation 20 now provides specific guidance on how to account for production stripping costs. It requires such costs to be capitalised as an asset (referred to as the ‘production stripping asset’) when the recognition criteria set out in Interpretation 20 are met. Interpretation 20 differs from the life of mine average waste tonnes mined to contained gold ounce ratio approach in a number of ways – these include: The level at which production stripping costs are to be assessed, which includes the recognition of an
asset at a component level rather than a life of mine level; and The way in which the production stripping asset is to be depreciated.
Identification of Components
Interpretation 20 requires the identification of different components of the ore body. Interpretation 20 defines a component as a specific volume of the ore body that is made more accessible by the stripping activity. An identified component of the ore body is generally a subset of the total ore body of the mine. It is considered that each mine may have several components, which are to be identified based on the mine plan. The mine plans and therefore the identification of specific components will vary between mines as a result of both the geological characteristics and location of the ore body. The financial considerations of the mining operations may also impact the identification and designation of a component. The identification of components is necessary for both the measurement of costs at the initial recognition of the asset, and the subsequent depreciation of the asset.

NOTES TO THE CONSOLIDATED FINANCIAL STATEMENTS FOR THE YEAR ENDED 30 JUNE 2014
Newcrest Mining Limited – Annual Financial Report – Year Ended 30 June 2014 E 27
4. Impact of Adopting Interpretation 20 (continued) Depreciation Methodology
Interpretation 20 also changes the manner in which the production stripping asset is depreciated. Under the previous method, the production stripping asset was released to the profit or loss when the actual ratio fell below the average expected ratio. Under Interpretation 20, the production stripping asset is depreciated over the expected useful life of the identified component of the ore body that is made more accessible by the activity, on a units of production basis. Transition
Interpretation 20 is not applied retrospectively; instead it is applied prospectively from the beginning of the earliest comparative period presented. Therefore, the impact of adoption for the Group is calculated as of 1 July 2012, being the beginning of the earliest comparative period presented in these financial statements. On implementation of Interpretation 20, production stripping costs which had been capitalised up to 30 June 2012 using the Group’s previous policy, could only be carried forward if there remained an identifiable component of the ore body to which the opening carried forward balance could be associated. Given the way in which production stripping costs have been previously accumulated and capitalised, and the way in which the components of the mine have been identified under Interpretation 20, it was determined that $99 million (pre-tax and non-controlling interests) of the opening production stripping asset of $337 million was to be written off via opening retained earnings. This adjustment reduced opening retained earnings at 1 July 2012 by $75 million after tax and non-controlling interests. Prior to the adoption of Interpretation 20, the Group disclosed the production stripping assets as part of ‘Other Assets’. On adoption, these assets were reclassified as ‘Exploration, Evaluation and Development’. Accounting Policy
The Group’s accounting policy under Interpretation 20 has been revised and is included in note 2(i). Financial Impacts
In accordance with the transitional provisions of Interpretation 20, this new policy has been applied prospectively from the start of the comparative period, being 1 July 2012. The impact of these changes in accounting requirements on the: Income Statement for the year ended 30 June 2013; Statement of Financial Position as at 30 June 2013; Statement of Financial Position as at 1 July 2012; and Statement of Cash Flows for the year ended 30 June 2013; is set out as follows. The Group has determined that it is not practicable to quantify the impact for the year ended 30 June 2014 under the pre-Interpretation 20 approach.

NOTES TO THE CONSOLIDATED FINANCIAL STATEMENTS FOR THE YEAR ENDED 30 JUNE 2014
Newcrest Mining Limited – Annual Financial Report – Year Ended 30 June 2014 E 28
4. Impact of Adopting Interpretation 20 (continued) (a) Group Income Statement – 12 months ended 30 June 2013
As reported 12 months to
30-Jun-13
Interpretation 20
Restatement
As restated 12 months to
30-Jun-13 $M $M $M
Operating sales revenue 3,775 - 3,775 Cost of sales (2,930) (11) (2,941) Gross profit 845 (11) 834 Exploration expenses (64) - (64) Corporate administration expenses (132) - (132) Other income/(expenses) (82) - (82) Share of loss of associate (110) - (110) Restructure costs (72) - (72) Write-down of non-current assets (166) - (166) Impairment losses (6,147) - (6,147) Impairment of associate (151) - (151) Loss before interest and income tax (6,079) (11) (6,090) Finance income 1 - 1 Finance costs (110) - (110) Loss before income tax (6,188) (11) (6,199) Income tax benefit 412 7 419 Loss after income tax (5,776) (4) (5,780) Loss after tax attributable to: Non-controlling interests 2 1 3 Owners of the parent (5,778) (5) (5,783) (5,776) (4) (5,780) Earnings per share (cents per share) Basic (loss)/earnings per share (754.5) (0.6) (755.1) Diluted (loss)/earnings per share (754.5) (0.6) (755.1) The Interpretation 20 restatement impact to loss after income tax reflects the net impact of the change in production stripping costs capitalised for the year, and the depreciation charged in the year.

NOTES TO THE CONSOLIDATED FINANCIAL STATEMENTS FOR THE YEAR ENDED 30 JUNE 2014
Newcrest Mining Limited – Annual Financial Report – Year Ended 30 June 2014 E 29
4. Impact of Adopting Interpretation 20 (continued) (b) Group Statement of Financial Position – At 30 June 2013
As reported at 30-Jun-13
Interpretation 20
Restatement As restated at 30-Jun-13
$M $M $M Current assets Cash and cash equivalents 69 - 69 Trade and other receivables 178 - 178 Inventories 946 - 946 Other financial assets 18 - 18 Current tax asset 58 - 58 Other assets 156 (36) 120 Total current assets 1,425 (36) 1,389 Non-current assets Inventories 1,248 - 1,248 Other financial assets 10 - 10 Property, plant and equipment 5,544 - 5,544 Exploration, evaluation and development 7,566 297 7,863 Goodwill 436 - 436 Other intangible assets 114 - 114 Deferred tax assets 326 - 326 Investment in associate 132 - 132 Other assets 384 (373) 11 Total non-current assets 15,760 (76) 15,684 Total assets 17,185 (112) 17,073 Current liabilities Trade and other payables 620 - 620 Borrowings 1 - 1 Provisions 241 - 241 Other financial liabilities 71 - 71 Total current liabilities 933 - 933 Non-current liabilities Borrowings 4,210 - 4,210 Provisions 353 - 353 Deferred tax liabilities 1,604 (29) 1,575 Total non-current liabilities 6,167 (29) 6,138 Total liabilities 7,100 (29) 7,071 Net assets 10,085 (83) 10,002 Equity Issued capital 13,592 - 13,592 Retained earnings/(accumulated losses) (3,064) (80) (3,144) Reserves (583) (2) (585) Equity attributable to owners of the parent 9,945 (82) 9,863 Non-controlling interests 140 (1) 139 Total equity 10,085 (83) 10,002
NOTES TO THE CONSOLIDATED FINANCIAL STATEMENTS FOR THE YEAR ENDED 30 JUNE 2014
Newcrest Mining Limited – Annual Financial Report – Year Ended 30 June 2014 E 30
4. Impact of Adopting Interpretation 20 (continued) (c) Group Statement of Financial Position – At 1 July 2012
As reported at 1-Jul-12
Interpretation 20
Restatement As restated at 1-Jul-12
$M $M $M Current assets Cash and cash equivalents 242 - 242 Trade and other receivables 251 - 251 Inventories 748 - 748 Other financial assets 11 - 11 Other assets 212 (84) 128 Total current assets 1,464 (84) 1,380 Non-current assets Inventories 1,095 - 1,095 Other financial assets 8 - 8 Property, plant and equipment 4,364 - 4,364 Exploration, evaluation and development 8,795 238 9,033 Goodwill 3,759 - 3,759 Other intangible assets 93 - 93 Deferred tax assets 259 - 259 Investment in associate 395 - 395 Other assets 277 (253) 24 Total non-current assets 19,045 (15) 19,030Total assets 20,509 (99) 20,410 Current liabilities Trade and other payables 482 - 482 Borrowings 1,200 - 1,200 Provisions 200 - 200 Current tax liability 92 - 92 Other financial liabilities 18 - 18 Total current liabilities 1,992 - 1,992 Non-current liabilities Borrowings 1,208 - 1,208 Provisions 308 - 308 Deferred tax liabilities 1,907 (22) 1,885 Total non-current liabilities 3,423 (22) 3,401 Total liabilities 5,415 (22) 5,393 Net assets 15,094 (77) 15,017 Equity Issued capital 13,561 - 13,561 Retained earnings 2,890 (75) 2,815 Reserves (1,476) - (1,476) Equity attributable to owners of the parent 14,975 (75) 14,900 Non-controlling interests 119 (2) 117 Total equity 15,094 (77) 15,017

NOTES TO THE CONSOLIDATED FINANCIAL STATEMENTS FOR THE YEAR ENDED 30 JUNE 2014
Newcrest Mining Limited – Annual Financial Report – Year Ended 30 June 2014 E 31
4. Impact of Adopting Interpretation 20 (continued) (d) Group Statement of Cash flows – for the 12 months ended 30 June 2013
As reported 12 months to
30-Jun-13
Interpretation 20
Restatement
As restated 12 months to
30-Jun-13 $M $M $M Net cash provided by operating activities 707 440 1,147 Net cash used in investing activities (2,124) (440) (2,564) Net cash provided by financing activities 1,236 - 1,236 Net decrease in cash and cash equivalents (181) - (181)
Prior to the adoption of Interpretation 20, all cash outflows associated with production stripping were disclosed as operating activities. On adoption of Interpretation 20, the cash outflows that were initially recognised as part of the stripping activity assets were reclassified to investing activities while the cash flows that were initially recognised as part of the cost of inventory produced in that period remained classified as operating cash flows.
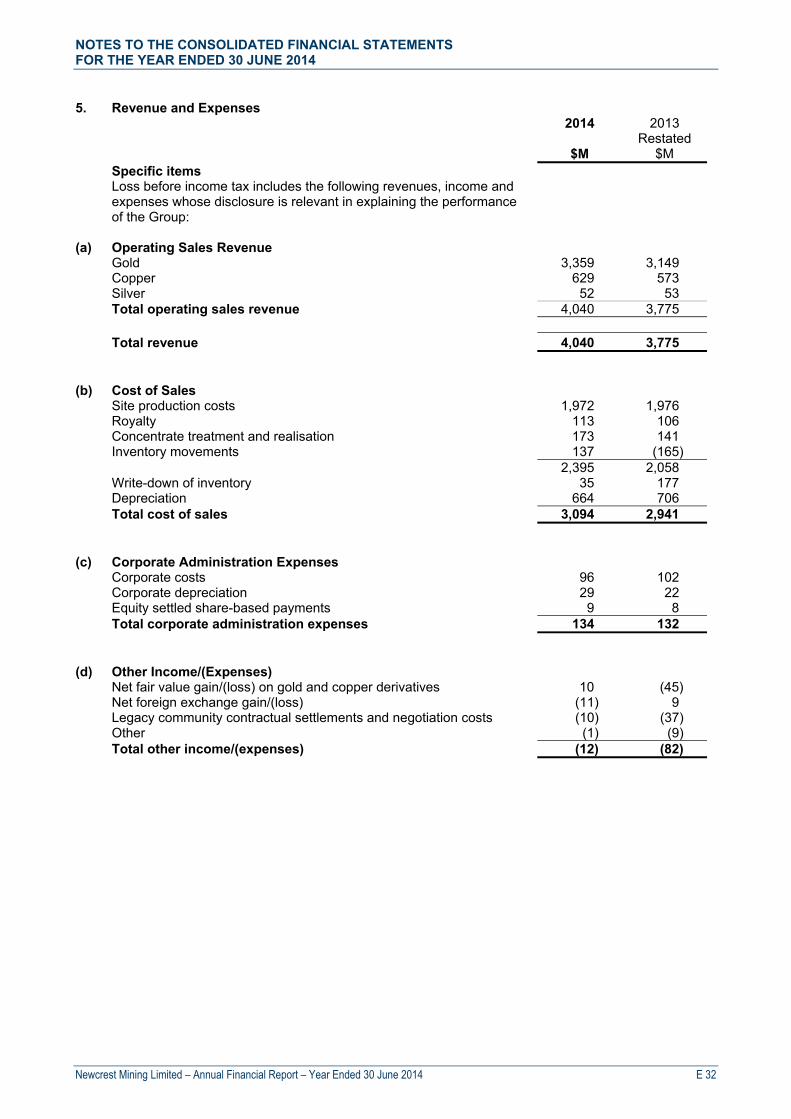
NOTES TO THE CONSOLIDATED FINANCIAL STATEMENTS FOR THE YEAR ENDED 30 JUNE 2014
Newcrest Mining Limited – Annual Financial Report – Year Ended 30 June 2014 E 32
5. Revenue and Expenses 2014 2013 Restated $M $M Specific items
Loss before income tax includes the following revenues, income and expenses whose disclosure is relevant in explaining the performance of the Group:
(a) Operating Sales Revenue Gold 3,359 3,149 Copper 629 573 Silver 52 53 Total operating sales revenue 4,040 3,775 Total revenue 4,040 3,775 (b) Cost of Sales Site production costs 1,972 1,976 Royalty 113 106 Concentrate treatment and realisation 173 141 Inventory movements 137 (165) 2,395 2,058 Write-down of inventory 35 177 Depreciation 664 706 Total cost of sales 3,094 2,941 (c) Corporate Administration Expenses Corporate costs 96 102 Corporate depreciation 29 22 Equity settled share-based payments 9 8 Total corporate administration expenses 134 132 (d) Other Income/(Expenses) Net fair value gain/(loss) on gold and copper derivatives 10 (45) Net foreign exchange gain/(loss) (11) 9 Legacy community contractual settlements and negotiation costs (10) (37) Other (1) (9) Total other income/(expenses) (12) (82)
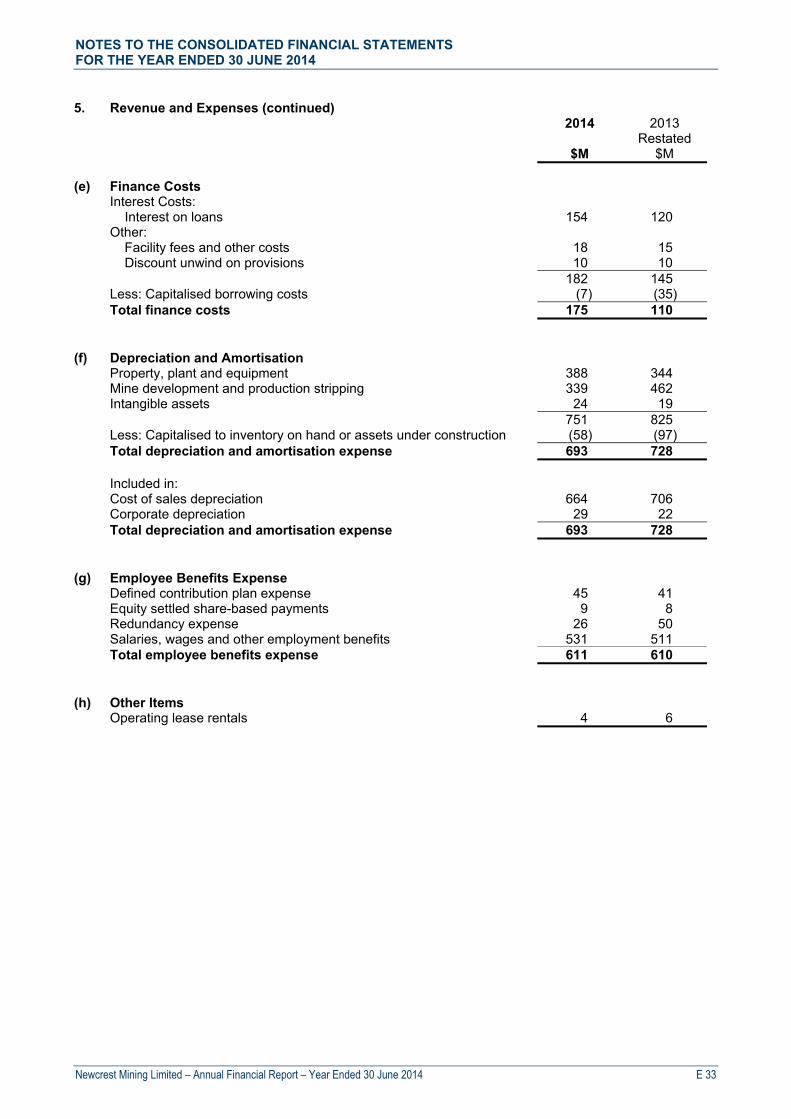
NOTES TO THE CONSOLIDATED FINANCIAL STATEMENTS FOR THE YEAR ENDED 30 JUNE 2014
Newcrest Mining Limited – Annual Financial Report – Year Ended 30 June 2014 E 33
5. Revenue and Expenses (continued) 2014 2013 Restated $M $M (e) Finance Costs Interest Costs: Interest on loans 154 120 Other: Facility fees and other costs 18 15 Discount unwind on provisions 10 10 182 145 Less: Capitalised borrowing costs (7) (35) Total finance costs 175 110 (f) Depreciation and Amortisation Property, plant and equipment 388 344 Mine development and production stripping 339 462 Intangible assets 24 19 751 825 Less: Capitalised to inventory on hand or assets under construction (58) (97) Total depreciation and amortisation expense 693 728 Included in: Cost of sales depreciation 664 706 Corporate depreciation 29 22 Total depreciation and amortisation expense 693 728 (g) Employee Benefits Expense Defined contribution plan expense 45 41 Equity settled share-based payments 9 8 Redundancy expense 26 50 Salaries, wages and other employment benefits 531 511 Total employee benefits expense 611 610 (h) Other Items Operating lease rentals 4 6
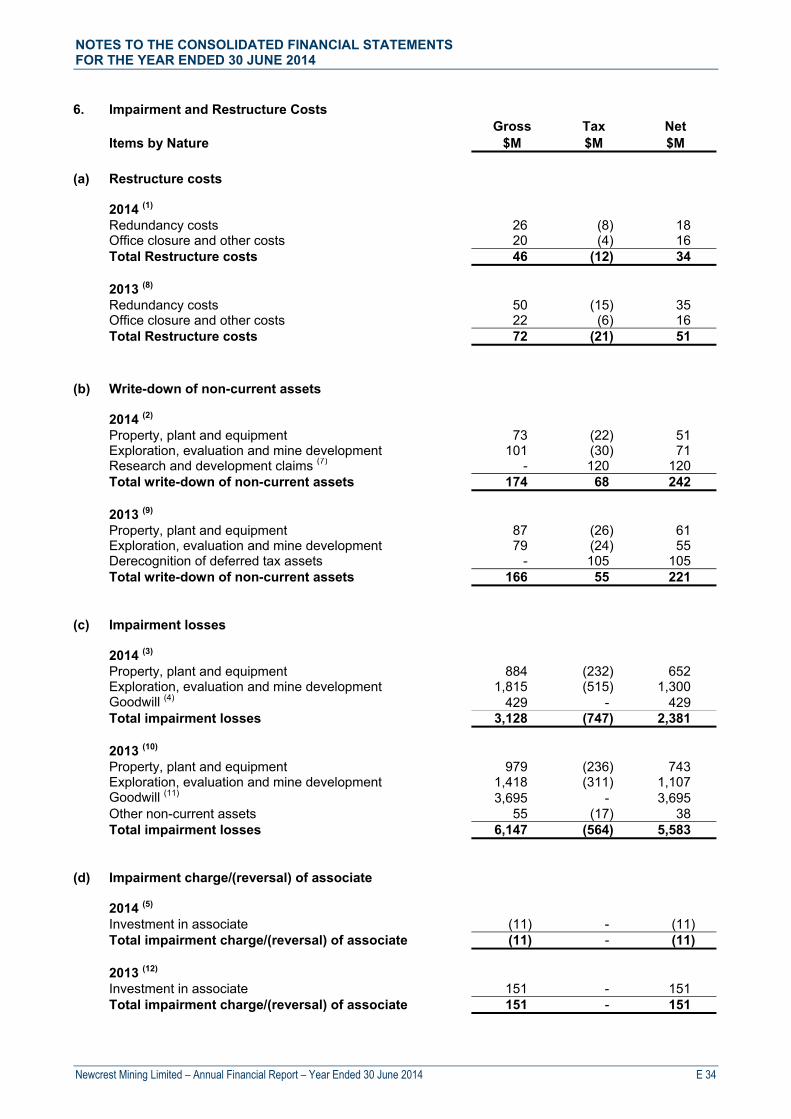
NOTES TO THE CONSOLIDATED FINANCIAL STATEMENTS FOR THE YEAR ENDED 30 JUNE 2014
Newcrest Mining Limited – Annual Financial Report – Year Ended 30 June 2014 E 34
6. Impairment and Restructure Costs Gross Tax Net Items by Nature $M $M $M (a) Restructure costs 2014 (1) Redundancy costs 26 (8) 18 Office closure and other costs 20 (4) 16 Total Restructure costs 46 (12) 34 2013 (8) Redundancy costs 50 (15) 35 Office closure and other costs 22 (6) 16 Total Restructure costs 72 (21) 51 (b) Write-down of non-current assets
2014 (2) Property, plant and equipment 73 (22) 51 Exploration, evaluation and mine development 101 (30) 71 Research and development claims (7) - 120 120 Total write-down of non-current assets 174 68 242 2013 (9) Property, plant and equipment 87 (26) 61
Exploration, evaluation and mine development 79 (24) 55 Derecognition of deferred tax assets - 105 105 Total write-down of non-current assets 166 55 221 (c) Impairment losses 2014 (3) Property, plant and equipment 884 (232) 652 Exploration, evaluation and mine development 1,815 (515) 1,300 Goodwill (4) 429 - 429 Total impairment losses 3,128 (747) 2,381 2013 (10) Property, plant and equipment 979 (236) 743 Exploration, evaluation and mine development 1,418 (311) 1,107 Goodwill (11) 3,695 - 3,695 Other non-current assets 55 (17) 38 Total impairment losses 6,147 (564) 5,583 (d) Impairment charge/(reversal) of associate 2014 (5) Investment in associate (11) - (11) Total impairment charge/(reversal) of associate (11) - (11) 2013 (12) Investment in associate 151 - 151 Total impairment charge/(reversal) of associate 151 - 151
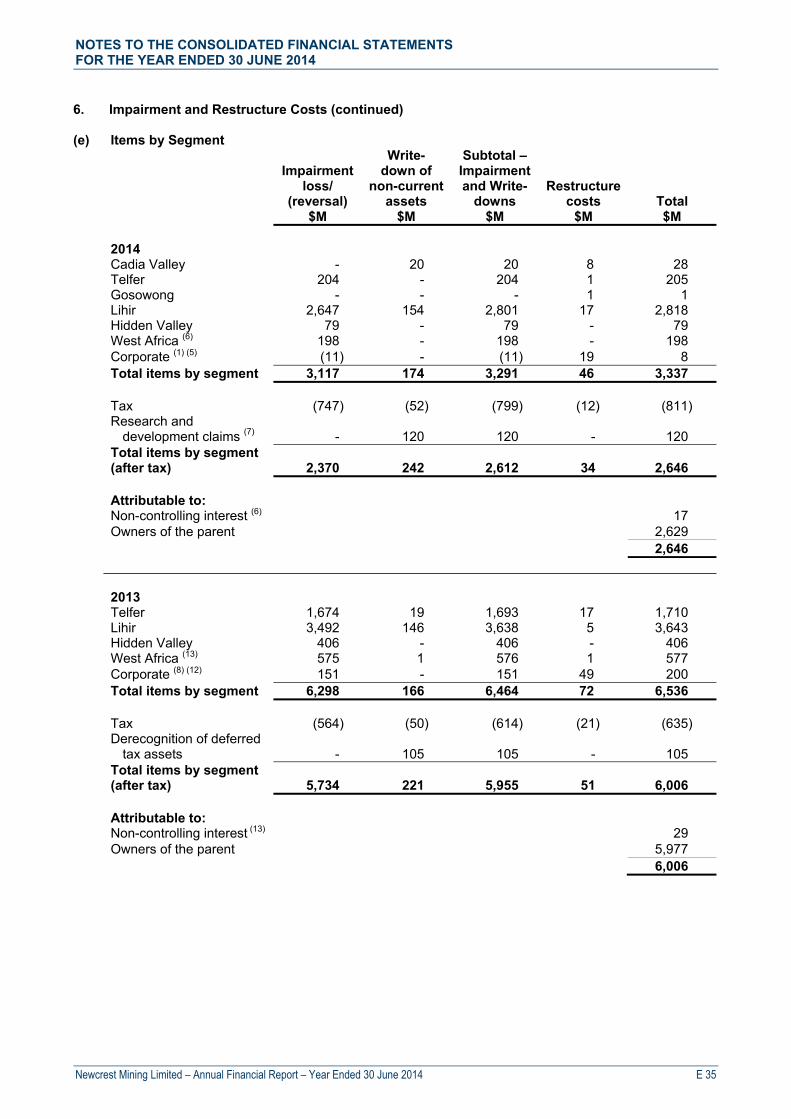
NOTES TO THE CONSOLIDATED FINANCIAL STATEMENTS FOR THE YEAR ENDED 30 JUNE 2014
Newcrest Mining Limited – Annual Financial Report – Year Ended 30 June 2014 E 35
6. Impairment and Restructure Costs (continued) (e) Items by Segment
Impairment loss/
(reversal)
Write- down of
non-current assets
Subtotal –Impairment and Write-
downs Restructure
costs Total $M $M $M $M $M 2014 Cadia Valley - 20 20 8 28 Telfer 204 - 204 1 205 Gosowong - - - 1 1 Lihir 2,647 154 2,801 17 2,818 Hidden Valley 79 - 79 - 79 West Africa (6) 198 - 198 - 198 Corporate (1) (5) (11) - (11) 19 8 Total items by segment 3,117 174 3,291 46 3,337 Tax (747) (52) (799) (12) (811) Research and
development claims (7) - 120 120 - 120 Total items by segment
(after tax) 2,370 242 2,612 34 2,646 Attributable to: Non-controlling interest (6) 17 Owners of the parent 2,629 2,646 2013 Telfer 1,674 19 1,693 17 1,710 Lihir 3,492 146 3,638 5 3,643 Hidden Valley 406 - 406 - 406 West Africa (13) 575 1 576 1 577 Corporate (8) (12) 151 - 151 49 200 Total items by segment 6,298 166 6,464 72 6,536 Tax (564) (50) (614) (21) (635) Derecognition of deferred
tax assets - 105 105 - 105 Total items by segment
(after tax) 5,734 221 5,955 51 6,006 Attributable to: Non-controlling interest (13) 29 Owners of the parent 5,977 6,006

NOTES TO THE CONSOLIDATED FINANCIAL STATEMENTS FOR THE YEAR ENDED 30 JUNE 2014
Newcrest Mining Limited – Annual Financial Report – Year Ended 30 June 2014 E 36
6. Impairment and Restructure Costs (continued) Year Ended 30 June 2014 (1) This represents the further rationalisation of corporate and support functions and additional costs
following the Brisbane office closure in June 2013 and other restructuring costs. (2) As a result of the continued review and refinement of the operational plans, the Group recognised a
write-down in assets that are surplus to the Group’s requirements. The write-down of these non-current assets is in addition to a write-down of inventory, $35 million pre-tax, $24 million post tax, which has been recognised in Cost of Sales as disclosed in Note 5(b).
(3) The Group has recognised impairments of goodwill and other assets as a result of its annual impairment
testing. These impairments have resulted from operating in a lower gold price environment and after taking into account recent operating cost performances. The Group has also recognised an impairment in respect to exploration assets in West Africa. Refer to Note 20 for further details.
(4) Goodwill impairment of $429 million in respect of Lihir. Refer to Note 20 for further details. (5) As a result of the Group’s impairment review as at 30 June 2014, $11 million of the previously
recognised impairment charge was reversed. (6) A total of $17 million is attributable to non-controlling interests. (7) As a result of a review of the Group’s material Australian research and development claims, the Group
voluntarily amended its research and development claims in respect to the 2009 to 2011 financial years. As a result of this voluntary amendment, there is an increase to income tax expense of $120 million in the year.
Year Ended 30 June 2013 (8) This represented the rationalisation of corporate and support functions and the closure of the Brisbane
office. (9) As a result of the completion of a review of its business plan and 2014 financial year budget, the Group
confirmed its focus to maximise free cash flow, including a reduction in open pit material movement, an increase in the utilisation of existing stockpiles and the removal of high cost gold ounces from the production profile. This approach contributed to write-downs across various asset categories. The write-down of these non-current assets is in addition to a write-down of inventory, $177 million pre-tax, $130 million post tax, which has been recognised in Cost of Sales as disclosed in Note 5(b).
(10) The Group recognised impairments of goodwill and other assets as a result of its annual impairment
testing. These impairments have been recognised as a result of lower gold prices, the compression of earnings multiples in the gold industry and other market factors. Refer to Note 20 for further details.
(11) Goodwill impairment of $3,695 million was recognised in respect of Lihir and West Africa. Refer to Note
20 for further details. (12) As a result of the Group’s impairment review as at 30 June 2013, the investment in Evolution Mining
Limited was impaired. This impairment was in addition to an impairment of $122 million included in the share of loss of associate. Refer to Note 21 for further details.
(13) A total of $29 million is attributable to non-controlling interests.

NOTES TO THE CONSOLIDATED FINANCIAL STATEMENTS FOR THE YEAR ENDED 30 JUNE 2014
Newcrest Mining Limited – Annual Financial Report – Year Ended 30 June 2014 E 37
7. Segment Information The Group’s operating segments are based on the internal management reports that are reviewed and used by the Group’s Executive Committee (the chief operating decision-makers) in assessing performance. The operating segments represent the Group’s operating mines and projects which are organised and managed according to their location. The Group’s reportable operating segments are:
Cadia Valley, Australia Telfer, Australia Gosowong, Indonesia Lihir, Papua New Guinea Hidden Valley JV (50% interest), Papua New Guinea West Africa (includes Bonikro operations and exploration and evaluation activities in Côte d’Ivoire) Exploration and Other
Exploration and Other mainly comprises projects in the exploration, evaluation and feasibility phase and includes, Wafi-Golpu and Morobe Exploration in PNG, Marsden and O’Callaghans in Australia and Namosi in Fiji. (a) Segment Results, Segment Assets and Segment Liabilities The measurement of segment results is in line with the basis of information presented to management for internal management reporting purposes. The performance of each segment is measured based on their Revenues, Costs, EBITDA and EBIT (Segment Result). Segment Revenues represent gold, copper and silver sales at unhedged prices. EBITDA is earnings before interest, tax, depreciation, amortisation and significant items. EBIT is earnings before interest, tax and significant items. The reconciliation of EBIT to loss before tax is shown in Note 7(b). Segment assets exclude tax losses and intercompany receivables. Segment liabilities exclude intercompany payables.
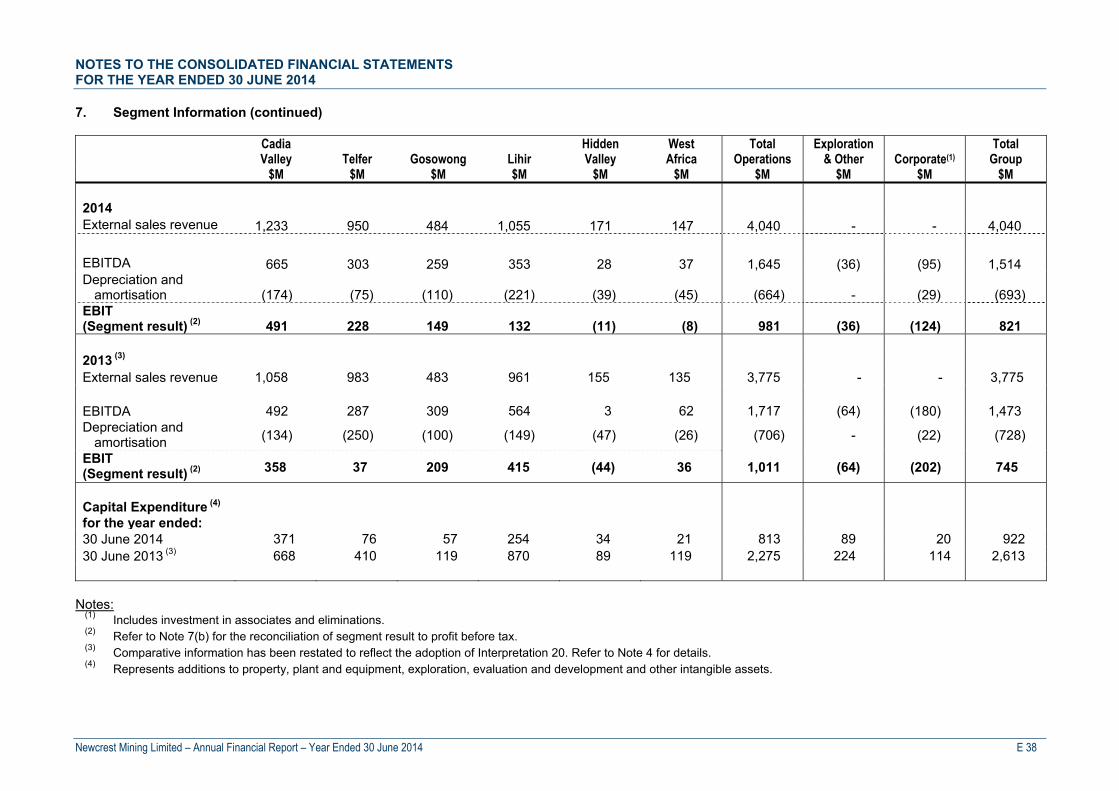
NOTES TO THE CONSOLIDATED FINANCIAL STATEMENTS FOR THE YEAR ENDED 30 JUNE 2014
Newcrest Mining Limited – Annual Financial Report – Year Ended 30 June 2014 E 38
7. Segment Information (continued)
Cadia Valley Telfer Gosowong Lihir
Hidden Valley
West Africa
Total Operations
Exploration & Other Corporate(1)
Total Group
$M $M $M $M $M $M $M $M $M $M 2014 External sales revenue 1,233 950 484 1,055 171 147 4,040 - - 4,040 EBITDA 665 303 259 353 28 37 1,645 (36) (95) 1,514 Depreciation and
amortisation (174) (75) (110) (221) (39) (45) (664) - (29) (693) EBIT (Segment result) (2) 491 228 149 132 (11) (8) 981 (36) (124) 821 2013 (3) External sales revenue 1,058 983 483 961 155 135 3,775 - - 3,775 EBITDA 492 287 309 564 3 62 1,717 (64) (180) 1,473 Depreciation and
amortisation (134) (250) (100) (149) (47) (26) (706) - (22) (728)
EBIT (Segment result) (2) 358 37 209 415 (44) 36 1,011 (64) (202) 745
Capital Expenditure (4) for the year ended:
30 June 2014 371 76 57 254 34 21 813 89 20 922 30 June 2013 (3) 668 410 119 870 89 119 2,275 224 114 2,613
Notes:
(1) Includes investment in associates and eliminations. (2) Refer to Note 7(b) for the reconciliation of segment result to profit before tax. (3) Comparative information has been restated to reflect the adoption of Interpretation 20. Refer to Note 4 for details. (4) Represents additions to property, plant and equipment, exploration, evaluation and development and other intangible assets.

NOTES TO THE CONSOLIDATED FINANCIAL STATEMENTS FOR THE YEAR ENDED 30 JUNE 2014
Newcrest Mining Limited – Annual Financial Report – Year Ended 30 June 2014 E 39
7. Segment Information (continued)
Cadia Valley Telfer Gosowong Lihir
Hidden Valley
West Africa
Total Operations
Exploration & Other Corporate(1)
Total Group
$M $M $M $M $M $M $M $M $M $M
2014 Segment assets (2) 4,484 743 594 6,319 325 298 12,763 526 298 13,587 Segment liabilities 687 200 135 928 65 36 2,051 11 3,818 5,880 Carrying value 3,797 543 459 5,391 260 262 10,712 515 (3,520) 7,707 2013 (3) Segment assets (2) 4,298 971 598 9,371 391 539 16,168 463 442 17,073 Segment liabilities 618 275 156 1,788 83 80 3,000 29 4,042 7,071 Carrying value 3,680 696 442 7,583 308 459 13,168 434 (3,600) 10,002
Notes:
(1) Includes investment in associates and eliminations. (2) Segment assets are net of write-downs and impairments. (3) Comparative information has been restated to reflect the adoption of Interpretation 20. Refer to Note 4 for details.
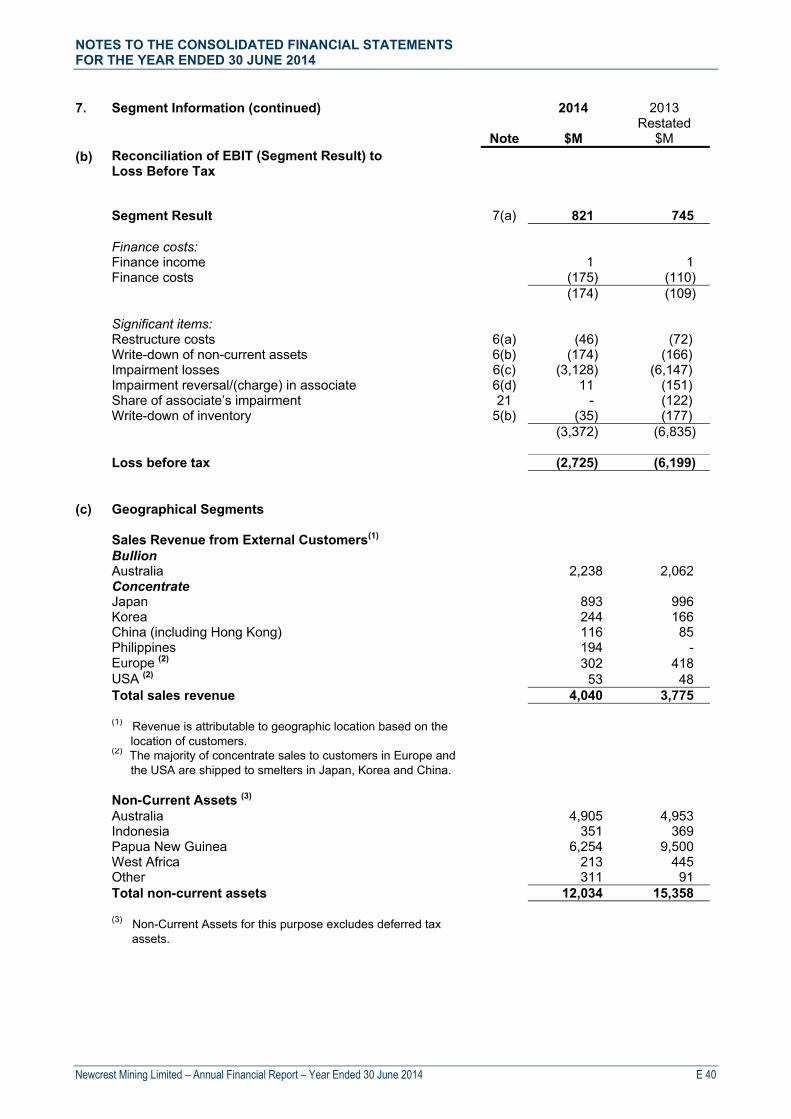
NOTES TO THE CONSOLIDATED FINANCIAL STATEMENTS FOR THE YEAR ENDED 30 JUNE 2014
Newcrest Mining Limited – Annual Financial Report – Year Ended 30 June 2014 E 40
7. Segment Information (continued) 2014 2013 Restated Note $M $M (b) Reconciliation of EBIT (Segment Result) to
Loss Before Tax
Segment Result 7(a) 821 745 Finance costs: Finance income 1 1 Finance costs (175) (110) (174) (109) Significant items: Restructure costs 6(a) (46) (72) Write-down of non-current assets 6(b) (174) (166) Impairment losses 6(c) (3,128) (6,147) Impairment reversal/(charge) in associate 6(d) 11 (151) Share of associate’s impairment 21 - (122) Write-down of inventory 5(b) (35) (177) (3,372) (6,835) Loss before tax (2,725) (6,199) (c) Geographical Segments Sales Revenue from External Customers(1) Bullion Australia 2,238 2,062 Concentrate Japan 893 996 Korea 244 166 China (including Hong Kong) 116 85 Philippines 194 - Europe (2) 302 418 USA (2) 53 48 Total sales revenue 4,040 3,775
(1) Revenue is attributable to geographic location based on the location of customers.
(2) The majority of concentrate sales to customers in Europe and the USA are shipped to smelters in Japan, Korea and China.
Non-Current Assets (3) Australia 4,905 4,953 Indonesia 351 369 Papua New Guinea 6,254 9,500 West Africa 213 445 Other 311 91 Total non-current assets 12,034 15,358
(3) Non-Current Assets for this purpose excludes deferred tax assets.

NOTES TO THE CONSOLIDATED FINANCIAL STATEMENTS FOR THE YEAR ENDED 30 JUNE 2014
Newcrest Mining Limited – Annual Financial Report – Year Ended 30 June 2014 E 41
7. Segment Information (continued) (d) Major Customer Information
Major customers to whom the Group provides goods that are more than 10% of external revenue are as follows: Revenue % of external revenue 2014
$M 2013 $M
2014 %
2013 %
Customer A (1) 2,044 1,956 51 52 Customer B 623 765 15 20
(1) Represents sales of bullion.
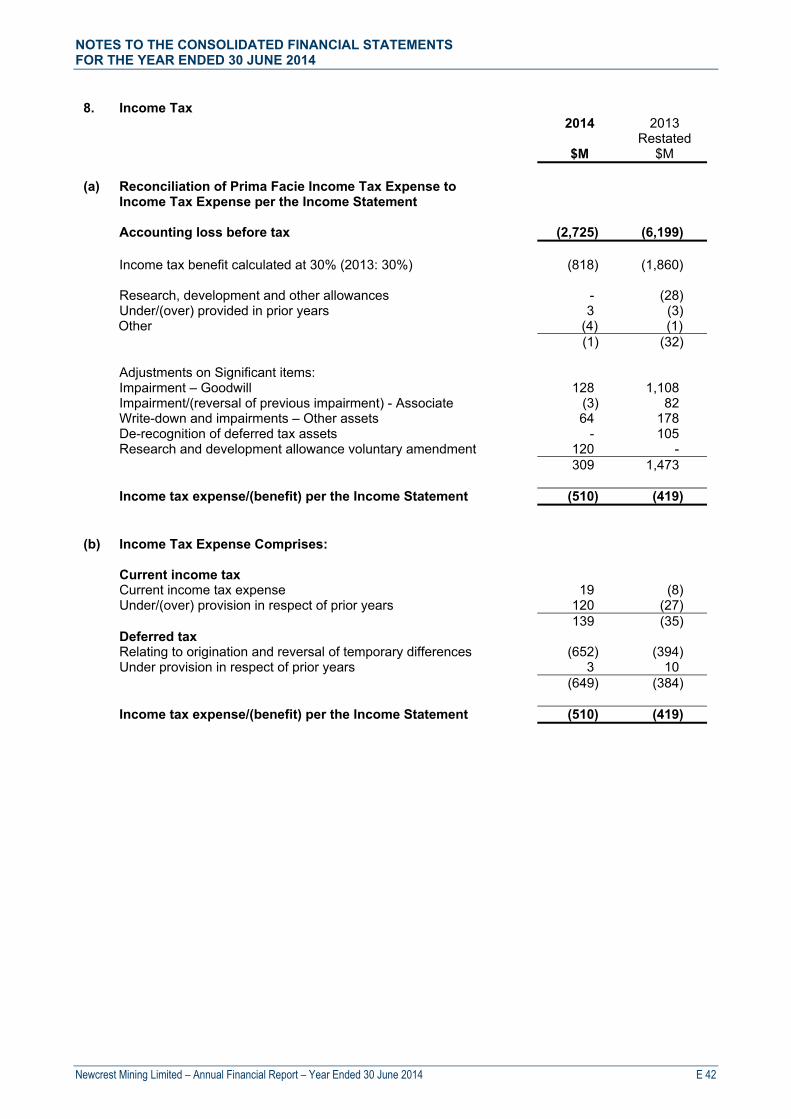
NOTES TO THE CONSOLIDATED FINANCIAL STATEMENTS FOR THE YEAR ENDED 30 JUNE 2014
Newcrest Mining Limited – Annual Financial Report – Year Ended 30 June 2014 E 42
8. Income Tax 2014 2013 Restated $M $M (a) Reconciliation of Prima Facie Income Tax Expense to
Income Tax Expense per the Income Statement Accounting loss before tax (2,725) (6,199) Income tax benefit calculated at 30% (2013: 30%) (818) (1,860) Research, development and other allowances - (28) Under/(over) provided in prior years 3 (3) Other (4) (1) (1) (32) Adjustments on Significant items: Impairment – Goodwill 128 1,108 Impairment/(reversal of previous impairment) - Associate (3) 82 Write-down and impairments – Other assets 64 178 De-recognition of deferred tax assets - 105 Research and development allowance voluntary amendment 120 - 309 1,473 Income tax expense/(benefit) per the Income Statement (510) (419) (b) Income Tax Expense Comprises: Current income tax
Current income tax expense 19 (8) Under/(over) provision in respect of prior years 120 (27)
139 (35) Deferred tax
Relating to origination and reversal of temporary differences (652) (394) Under provision in respect of prior years 3 10
(649) (384) Income tax expense/(benefit) per the Income Statement (510) (419)
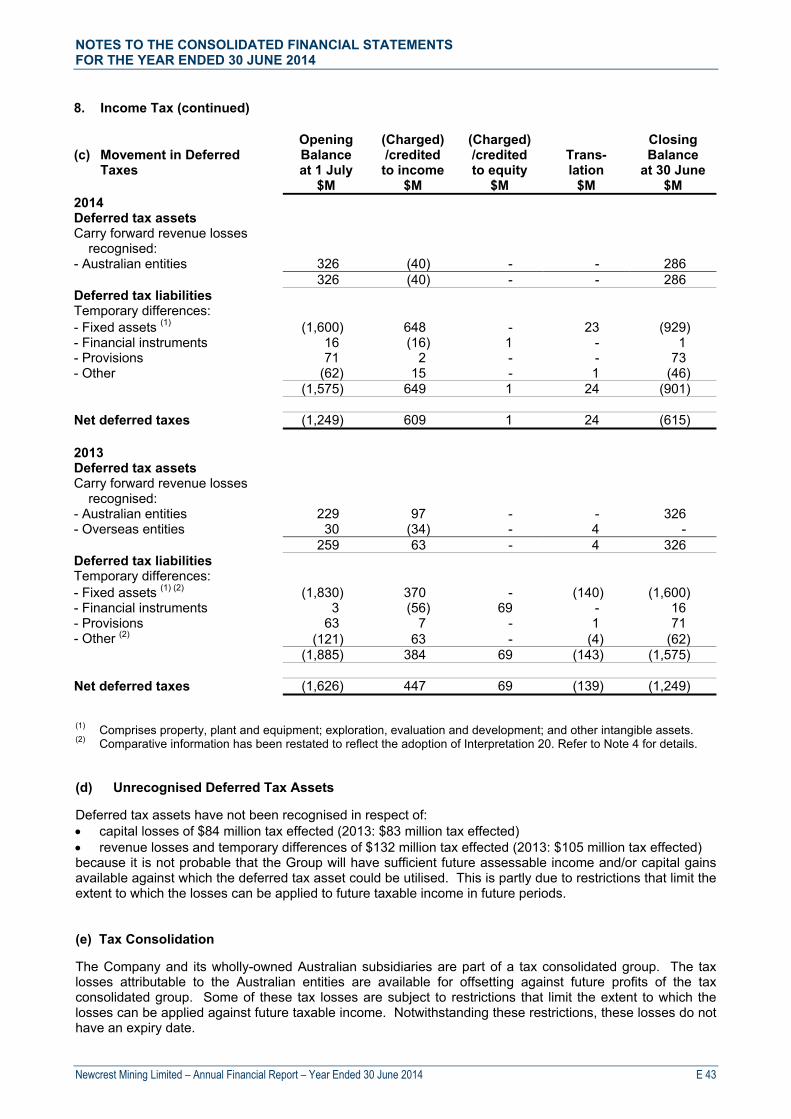
NOTES TO THE CONSOLIDATED FINANCIAL STATEMENTS FOR THE YEAR ENDED 30 JUNE 2014
Newcrest Mining Limited – Annual Financial Report – Year Ended 30 June 2014 E 43
8. Income Tax (continued)
(c) Movement in Deferred Taxes
Opening Balance at 1 July
(Charged) /credited to income
(Charged) /credited to equity
Trans-lation
Closing Balance
at 30 June $M $M $M $M $M 2014 Deferred tax assets Carry forward revenue losses
recognised: - Australian entities 326 (40) - - 286 326 (40) - - 286 Deferred tax liabilities Temporary differences: - Fixed assets (1) (1,600) 648 - 23 (929) - Financial instruments 16 (16) 1 - 1 - Provisions 71 2 - - 73 - Other (62) 15 - 1 (46) (1,575) 649 1 24 (901) Net deferred taxes (1,249) 609 1 24 (615) 2013 Deferred tax assets Carry forward revenue losses
recognised: - Australian entities 229 97 - - 326 - Overseas entities 30 (34) - 4 - 259 63 - 4 326 Deferred tax liabilities Temporary differences: - Fixed assets (1) (2) (1,830) 370 - (140) (1,600) - Financial instruments 3 (56) 69 - 16 - Provisions 63 7 - 1 71 - Other (2) (121) 63 - (4) (62) (1,885) 384 69 (143) (1,575)
Net deferred taxes (1,626) 447 69 (139) (1,249) (1) Comprises property, plant and equipment; exploration, evaluation and development; and other intangible assets. (2) Comparative information has been restated to reflect the adoption of Interpretation 20. Refer to Note 4 for details. (d) Unrecognised Deferred Tax Assets Deferred tax assets have not been recognised in respect of: capital losses of $84 million tax effected (2013: $83 million tax effected) revenue losses and temporary differences of $132 million tax effected (2013: $105 million tax effected) because it is not probable that the Group will have sufficient future assessable income and/or capital gains available against which the deferred tax asset could be utilised. This is partly due to restrictions that limit the extent to which the losses can be applied to future taxable income in future periods. (e) Tax Consolidation The Company and its wholly-owned Australian subsidiaries are part of a tax consolidated group. The tax losses attributable to the Australian entities are available for offsetting against future profits of the tax consolidated group. Some of these tax losses are subject to restrictions that limit the extent to which the losses can be applied against future taxable income. Notwithstanding these restrictions, these losses do not have an expiry date.
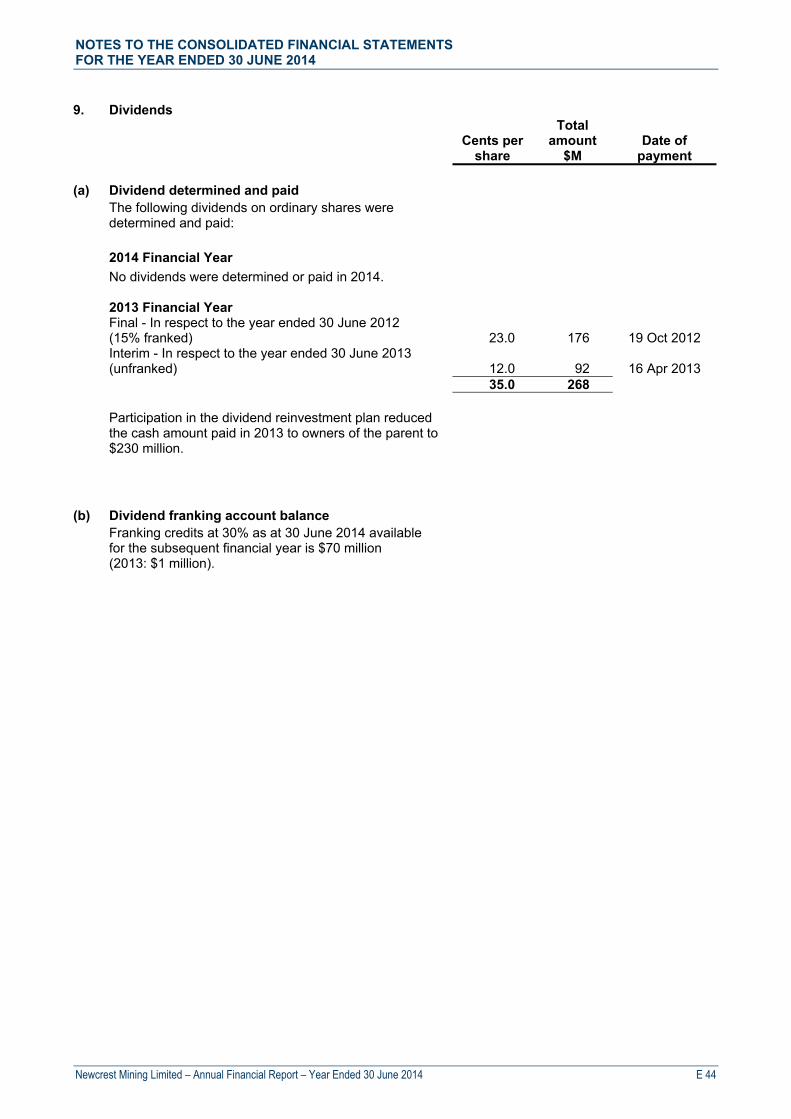
NOTES TO THE CONSOLIDATED FINANCIAL STATEMENTS FOR THE YEAR ENDED 30 JUNE 2014
Newcrest Mining Limited – Annual Financial Report – Year Ended 30 June 2014 E 44
9. Dividends
Cents per
share
Total amount
$M Date of
payment (a) Dividend determined and paid The following dividends on ordinary shares were
determined and paid:
2014 Financial Year No dividends were determined or paid in 2014. 2013 Financial Year Final - In respect to the year ended 30 June 2012
(15% franked) 23.0 176 19 Oct 2012 Interim - In respect to the year ended 30 June 2013
(unfranked) 12.0 92 16 Apr 2013 35.0 268 Participation in the dividend reinvestment plan reduced
the cash amount paid in 2013 to owners of the parent to $230 million.
(b) Dividend franking account balance Franking credits at 30% as at 30 June 2014 available
for the subsequent financial year is $70 million (2013: $1 million).
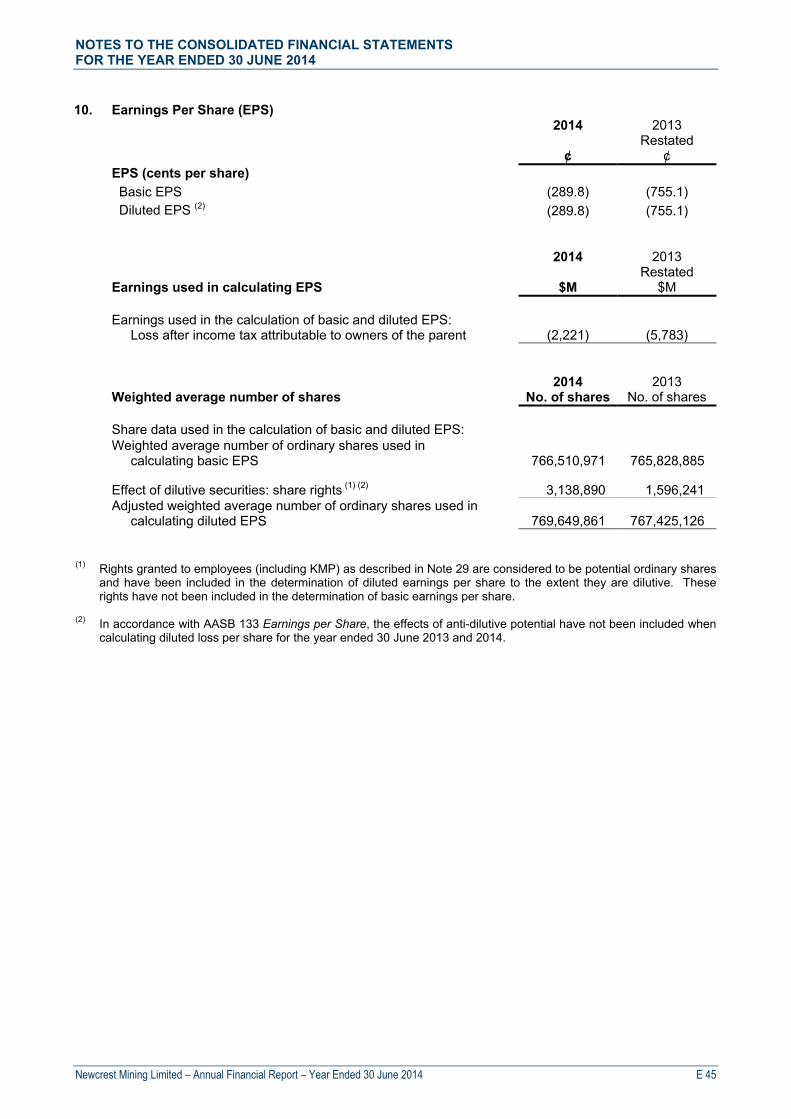
NOTES TO THE CONSOLIDATED FINANCIAL STATEMENTS FOR THE YEAR ENDED 30 JUNE 2014
Newcrest Mining Limited – Annual Financial Report – Year Ended 30 June 2014 E 45
10. Earnings Per Share (EPS) 2014 2013 Restated ¢ ¢ EPS (cents per share)
Basic EPS (289.8) (755.1)
Diluted EPS (2) (289.8) (755.1) 2014 2013 Restated Earnings used in calculating EPS $M $M Earnings used in the calculation of basic and diluted EPS:
Loss after income tax attributable to owners of the parent (2,221) (5,783) 2014 2013 Weighted average number of shares No. of shares No. of shares Share data used in the calculation of basic and diluted EPS: Weighted average number of ordinary shares used in
calculating basic EPS
766,510,971 765,828,885
Effect of dilutive securities: share rights (1) (2)
3,138,890 1,596,241 Adjusted weighted average number of ordinary shares used in
calculating diluted EPS
769,649,861 767,425,126 (1) Rights granted to employees (including KMP) as described in Note 29 are considered to be potential ordinary shares
and have been included in the determination of diluted earnings per share to the extent they are dilutive. These rights have not been included in the determination of basic earnings per share.
(2) In accordance with AASB 133 Earnings per Share, the effects of anti-dilutive potential have not been included when calculating diluted loss per share for the year ended 30 June 2013 and 2014.
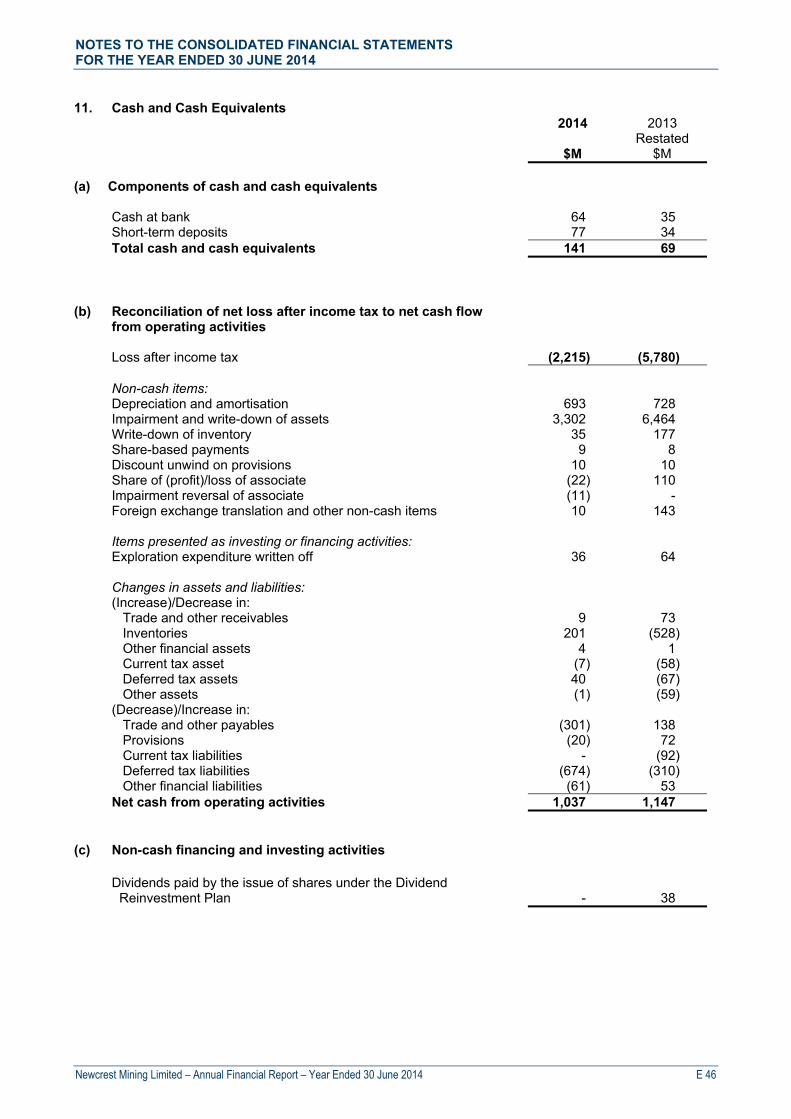
NOTES TO THE CONSOLIDATED FINANCIAL STATEMENTS FOR THE YEAR ENDED 30 JUNE 2014
Newcrest Mining Limited – Annual Financial Report – Year Ended 30 June 2014 E 46
11. Cash and Cash Equivalents 2014 2013 Restated $M $M (a) Components of cash and cash equivalents Cash at bank 64 35 Short-term deposits 77 34 Total cash and cash equivalents 141 69 (b)
Reconciliation of net loss after income tax to net cash flow from operating activities
Loss after income tax (2,215) (5,780) Non-cash items: Depreciation and amortisation 693 728 Impairment and write-down of assets 3,302 6,464 Write-down of inventory 35 177 Share-based payments 9 8 Discount unwind on provisions 10 10 Share of (profit)/loss of associate (22) 110 Impairment reversal of associate (11) - Foreign exchange translation and other non-cash items 10 143 Items presented as investing or financing activities: Exploration expenditure written off 36 64 Changes in assets and liabilities: (Increase)/Decrease in: Trade and other receivables 9 73 Inventories 201 (528) Other financial assets 4 1 Current tax asset (7) (58) Deferred tax assets 40 (67) Other assets (1) (59) (Decrease)/Increase in: Trade and other payables (301) 138 Provisions (20) 72 Current tax liabilities - (92) Deferred tax liabilities (674) (310) Other financial liabilities (61) 53 Net cash from operating activities 1,037 1,147 (c) Non-cash financing and investing activities
Dividends paid by the issue of shares under the Dividend
Reinvestment Plan - 38
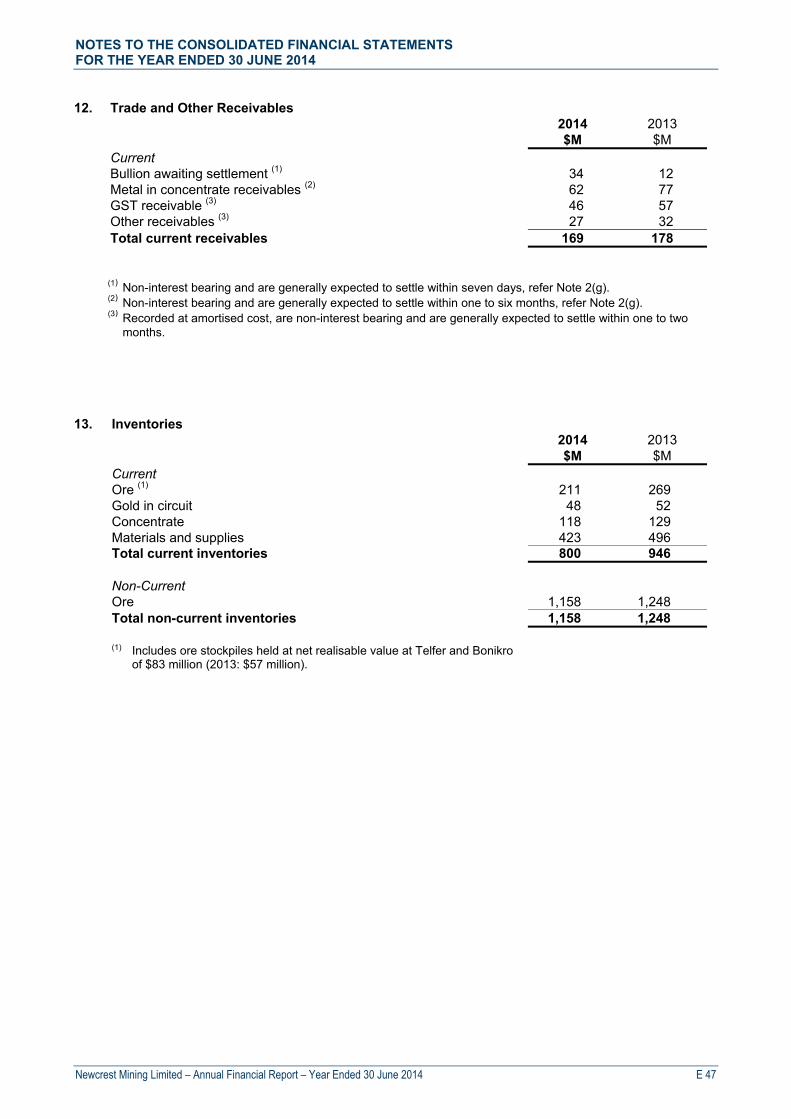
NOTES TO THE CONSOLIDATED FINANCIAL STATEMENTS FOR THE YEAR ENDED 30 JUNE 2014
Newcrest Mining Limited – Annual Financial Report – Year Ended 30 June 2014 E 47
12. Trade and Other Receivables 2014 2013 $M $M Current Bullion awaiting settlement (1) 34 12 Metal in concentrate receivables (2) 62 77 GST receivable (3) 46 57 Other receivables (3) 27 32 Total current receivables 169 178 (1) Non-interest bearing and are generally expected to settle within seven days, refer Note 2(g). (2) Non-interest bearing and are generally expected to settle within one to six months, refer Note 2(g). (3) Recorded at amortised cost, are non-interest bearing and are generally expected to settle within one to two
months.
13. Inventories 2014 2013 $M $M Current Ore (1) 211 269 Gold in circuit 48 52 Concentrate 118 129 Materials and supplies 423 496 Total current inventories 800 946 Non-Current Ore 1,158 1,248 Total non-current inventories 1,158 1,248
(1) Includes ore stockpiles held at net realisable value at Telfer and Bonikro
of $83 million (2013: $57 million).
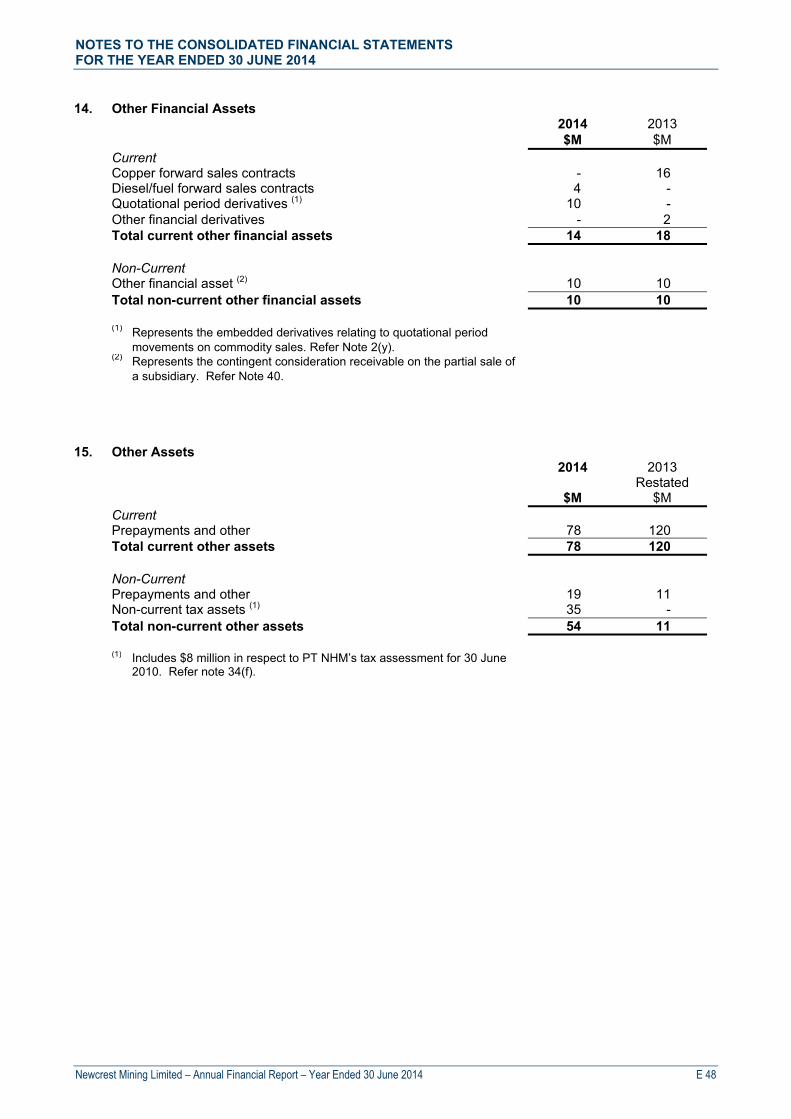
NOTES TO THE CONSOLIDATED FINANCIAL STATEMENTS FOR THE YEAR ENDED 30 JUNE 2014
Newcrest Mining Limited – Annual Financial Report – Year Ended 30 June 2014 E 48
14. Other Financial Assets 2014 2013 $M $M Current Copper forward sales contracts - 16 Diesel/fuel forward sales contracts 4 - Quotational period derivatives (1) 10 - Other financial derivatives - 2 Total current other financial assets 14 18 Non-Current Other financial asset (2) 10 10 Total non-current other financial assets 10 10
(1) Represents the embedded derivatives relating to quotational period movements on commodity sales. Refer Note 2(y).
(2) Represents the contingent consideration receivable on the partial sale of a subsidiary. Refer Note 40.
15. Other Assets 2014 2013 Restated $M $M Current Prepayments and other 78 120 Total current other assets 78 120 Non-Current Prepayments and other 19 11 Non-current tax assets (1) 35 - Total non-current other assets 54 11
(1) Includes $8 million in respect to PT NHM’s tax assessment for 30 June 2010. Refer note 34(f).

NOTES TO THE CONSOLIDATED FINANCIAL STATEMENTS FOR THE YEAR ENDED 30 JUNE 2014
Newcrest Mining Limited – Annual Financial Report – Year Ended 30 June 2014 E 49
16. Property, Plant & Equipment 2014 2013
$M $M
At 30 June
Cost 9,291 9,087
Accumulated depreciation and impairment (4,608) (3,543)
4,683 5,544
Year ended 30 June
Carrying amount at 1 July 5,544 4,364
Expenditure during the year 205 466
Depreciation for the year (388) (344)
Disposals and write-down of assets (83) (94)
Foreign currency translation (54) 384 Reclassifications/transfers (1) 343 1,747
Impairment losses for the year (Note 6) (884) (979)
Carrying amount at 30 June (2) 4,683 5,544
(1) Represents reclassification/transfer from Exploration, Evaluation and Development upon utilisation of the asset. (2) Included in property, plant and equipment are leased assets with a carrying amount of $nil (2013: $10 million).
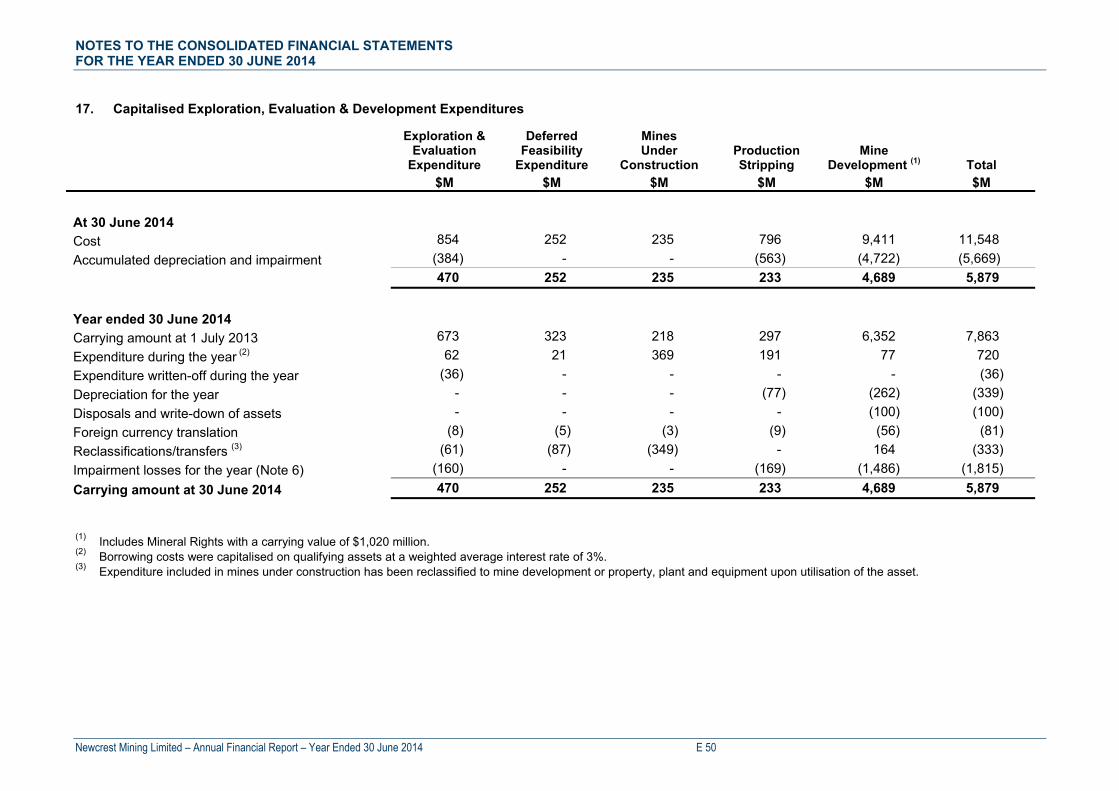
NOTES TO THE CONSOLIDATED FINANCIAL STATEMENTS FOR THE YEAR ENDED 30 JUNE 2014
Newcrest Mining Limited – Annual Financial Report – Year Ended 30 June 2014 E 50
17. Capitalised Exploration, Evaluation & Development Expenditures
Exploration & Evaluation
Expenditure
Deferred Feasibility
Expenditure
Mines Under
Construction Production Stripping
Mine Development (1) Total
$M $M $M $M $M $M
At 30 June 2014
Cost 854 252 235 796 9,411 11,548
Accumulated depreciation and impairment (384) - - (563) (4,722) (5,669)
470 252 235 233 4,689 5,879
Year ended 30 June 2014
Carrying amount at 1 July 2013 673 323 218 297 6,352 7,863
Expenditure during the year (2) 62 21 369 191 77 720
Expenditure written-off during the year (36) - - - - (36)
Depreciation for the year - - - (77) (262) (339)
Disposals and write-down of assets - - - - (100) (100)
Foreign currency translation (8) (5) (3) (9) (56) (81)
Reclassifications/transfers (3) (61) (87) (349) - 164 (333)
Impairment losses for the year (Note 6) (160) - - (169) (1,486) (1,815)
Carrying amount at 30 June 2014 470 252 235 233 4,689 5,879
(1) Includes Mineral Rights with a carrying value of $1,020 million. (2) Borrowing costs were capitalised on qualifying assets at a weighted average interest rate of 3%. (3) Expenditure included in mines under construction has been reclassified to mine development or property, plant and equipment upon utilisation of the asset.
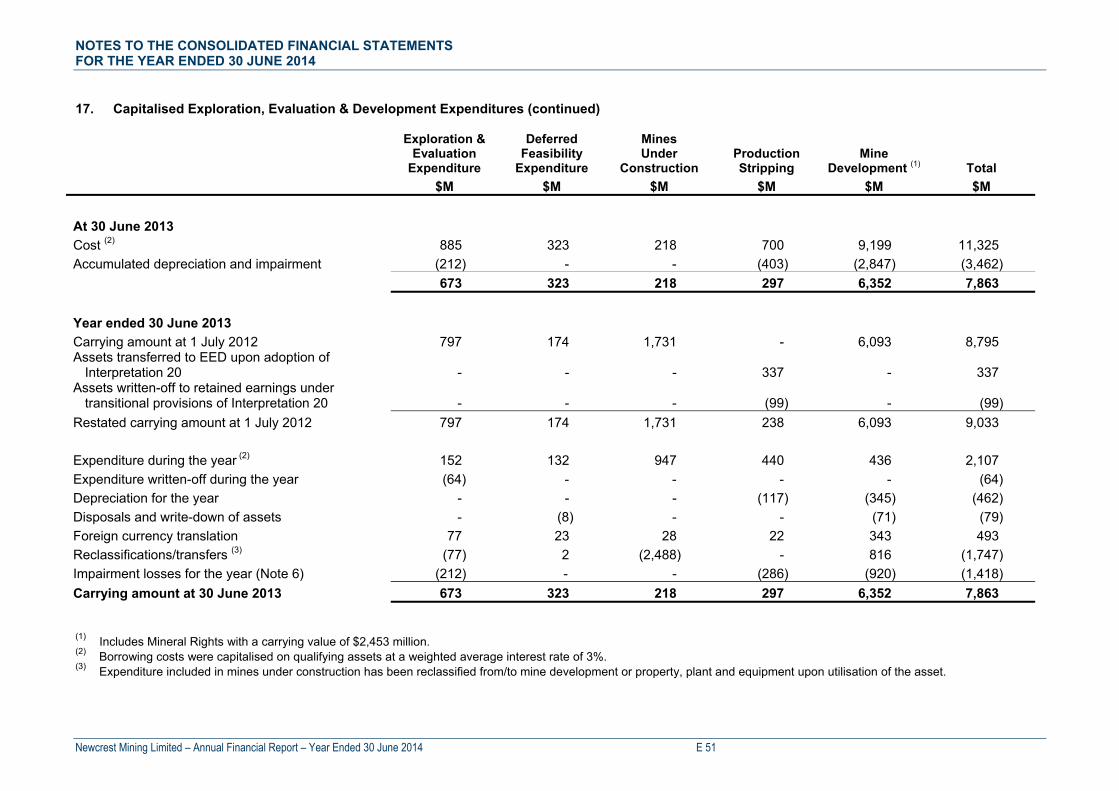
NOTES TO THE CONSOLIDATED FINANCIAL STATEMENTS FOR THE YEAR ENDED 30 JUNE 2014
Newcrest Mining Limited – Annual Financial Report – Year Ended 30 June 2014 E 51
17. Capitalised Exploration, Evaluation & Development Expenditures (continued)
Exploration & Evaluation
Expenditure
Deferred Feasibility
Expenditure
Mines Under
Construction Production Stripping
Mine Development (1) Total
$M $M $M $M $M $M
At 30 June 2013
Cost (2) 885 323 218 700 9,199 11,325
Accumulated depreciation and impairment (212) - - (403) (2,847) (3,462)
673 323 218 297 6,352 7,863
Year ended 30 June 2013
Carrying amount at 1 July 2012 797 174 1,731 - 6,093 8,795 Assets transferred to EED upon adoption of
Interpretation 20 - - - 337 - 337 Assets written-off to retained earnings under
transitional provisions of Interpretation 20 - - - (99) - (99)
Restated carrying amount at 1 July 2012 797 174 1,731 238 6,093 9,033
Expenditure during the year (2) 152 132 947 440 436 2,107
Expenditure written-off during the year (64) - - - - (64)
Depreciation for the year - - - (117) (345) (462)
Disposals and write-down of assets - (8) - - (71) (79)
Foreign currency translation 77 23 28 22 343 493
Reclassifications/transfers (3) (77) 2 (2,488) - 816 (1,747)
Impairment losses for the year (Note 6) (212) - - (286) (920) (1,418)
Carrying amount at 30 June 2013 673 323 218 297 6,352 7,863 (1) Includes Mineral Rights with a carrying value of $2,453 million. (2) Borrowing costs were capitalised on qualifying assets at a weighted average interest rate of 3%. (3) Expenditure included in mines under construction has been reclassified from/to mine development or property, plant and equipment upon utilisation of the asset.
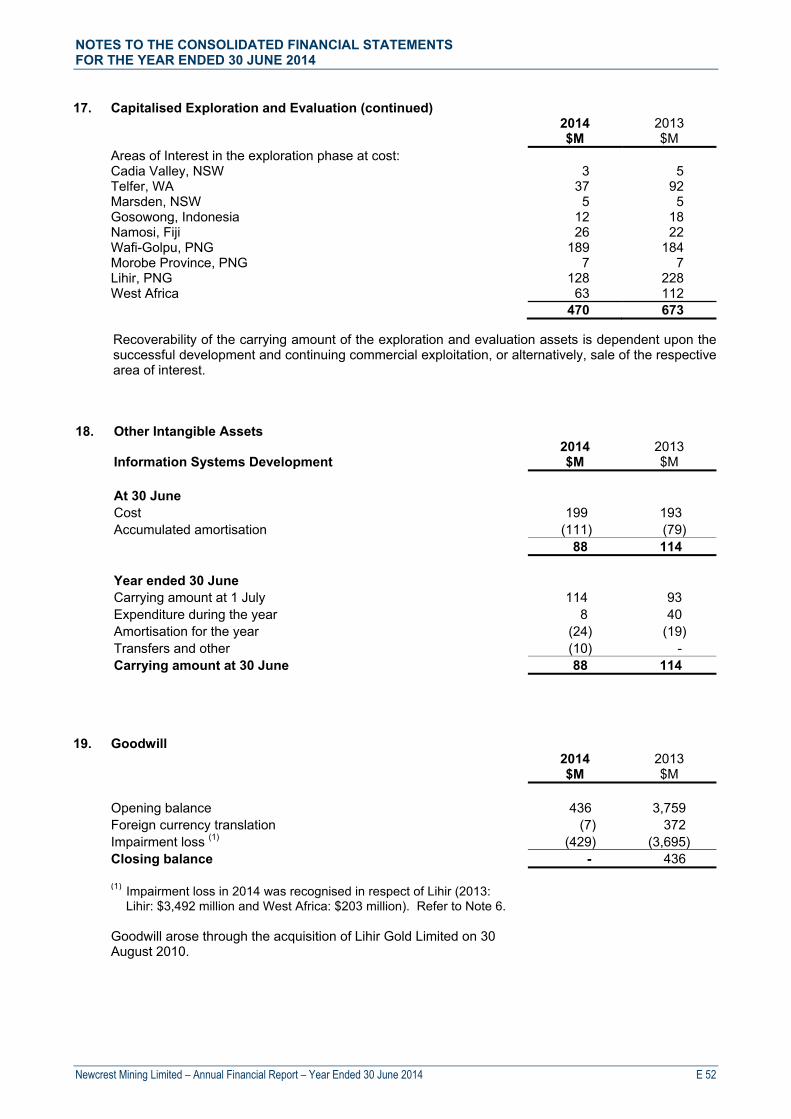
NOTES TO THE CONSOLIDATED FINANCIAL STATEMENTS FOR THE YEAR ENDED 30 JUNE 2014
Newcrest Mining Limited – Annual Financial Report – Year Ended 30 June 2014 E 52
17. Capitalised Exploration and Evaluation (continued) 2014 2013 $M $M Areas of Interest in the exploration phase at cost: Cadia Valley, NSW 3 5 Telfer, WA 37 92 Marsden, NSW 5 5 Gosowong, Indonesia 12 18 Namosi, Fiji 26 22 Wafi-Golpu, PNG 189 184 Morobe Province, PNG 7 7 Lihir, PNG 128 228 West Africa 63 112 470 673
Recoverability of the carrying amount of the exploration and evaluation assets is dependent upon the successful development and continuing commercial exploitation, or alternatively, sale of the respective area of interest.
18. Other Intangible Assets 2014 2013 Information Systems Development $M $M At 30 June Cost 199 193 Accumulated amortisation (111) (79) 88 114 Year ended 30 June Carrying amount at 1 July 114 93 Expenditure during the year 8 40 Amortisation for the year (24) (19) Transfers and other (10) - Carrying amount at 30 June 88 114 19. Goodwill 2014 2013 $M $M Opening balance 436 3,759 Foreign currency translation (7) 372 Impairment loss (1) (429) (3,695) Closing balance - 436
(1) Impairment loss in 2014 was recognised in respect of Lihir (2013: Lihir: $3,492 million and West Africa: $203 million). Refer to Note 6.
Goodwill arose through the acquisition of Lihir Gold Limited on 30 August 2010.
NOTES TO THE CONSOLIDATED FINANCIAL STATEMENTS FOR THE YEAR ENDED 30 JUNE 2014
Newcrest Mining Limited – Annual Financial Report – Year Ended 30 June 2014 E 53
20. Impairment of Goodwill and Non-Current Assets In accordance with the Group’s accounting policies and processes, the Group performs its impairment testing annually at 30 June. Goodwill and non-financial assets are reviewed at each reporting period to determine whether there is an indication of impairment. Where an indicator of impairment exists, a formal estimate of the recoverable amount is made. A number of factors represented indicators of impairment as at 30 June 2014, including a change to Newcrest’s long term exchange rate assumptions, updated life of mine (“LOM”) plans indicating increased estimated future costs at some sites and Newcrest’s market capitalisation relative to its book value. As a result, the Group assessed the recoverable amounts of each of its cash-generating units (“CGUs”), including goodwill where applicable. Unless otherwise identified, the following discussion of (a) Impairment testing and (b) Sensitivity analysis, is applicable to the assessment of the Fair Value of all of the Group’s CGUs, inclusive of the CGU in which Goodwill is recognised. a) Impairments testing i) Methodology Impairment is recognised when the carrying amount exceeds the recoverable amount. The recoverable amount of each CGU has been estimated using its fair value less costs of disposal (“Fair Value”) basis. The costs of disposal have been estimated by management based on prevailing market conditions. Fair Value is estimated based on discounted cash flows using market based commodity price and exchange assumptions, estimated quantities of recoverable minerals, production levels, operating costs and capital requirements, based on CGU LOM plans. When LOM plans do not fully utilise the existing mineral resource for a CGU, and options exist for the future extraction and processing of all or part of those resources, an estimate of the value of unmined resources, in addition to an estimate of value of exploration potential, is included in the estimation of Fair Value. The Fair Value estimates are considered to be level 3 fair value measurements (as defined by accounting standards, refer Note 32 (h)) as they are derived from valuation techniques that include inputs that are not based on observable market data. The Group considers the inputs and the valuation approach to be consistent with the approach taken by market participants. Estimates of quantities of recoverable minerals, production levels, operating costs and capital requirements are sourced from our planning process, including LOM plans, 5 year plans and one-year budgets. The 2015 budget and 5 year plan were developed in the context of the current gold price environment and outlook, and the Group’s continued focus on maximising free cash flow. In the current year and prior year, a gold multiple of 1.0 has been applied to all CGUs, resulting in no impact on the determination of Fair Value. In Fair Value assessments in years previous to this, the Group applied a gold multiple to the discounted cash flow valuation, as gold companies typically traded at a market capitalisation that was based on a multiple of their underlying discounted cash flow valuation. In determining the appropriate gold multiples for CGUs at that time, the Group took into consideration the gold price assumption, the mine life, reserve/resource addition potential, average annual production level and operating and capital cost profiles. Significant judgements and assumptions are required in making estimates of Fair Value. This is particularly so in the assessment of long life assets. It should be noted that the CGU valuations are subject to variability in key assumptions including, but not limited to, long-term gold prices, currency exchange rates, discount rates, CGU specific gold multiples, production profiles and operating and capital costs. An adverse change in one or more of the assumptions used to estimate Fair Value could result in a reduction in a CGU’s Fair Value.

NOTES TO THE CONSOLIDATED FINANCIAL STATEMENTS FOR THE YEAR ENDED 30 JUNE 2014
Newcrest Mining Limited – Annual Financial Report – Year Ended 30 June 2014 E 54
20. Impairment of Goodwill and Non-Current Assets (continued) ii) Key Assumptions The table below summarises the key assumptions used in the 2014 end of year carrying value assessments, and for comparison also provides the equivalent assumptions used in 2013:
2014 2013
Assumptions 2015 – 2020 Long term
(2021+) 2014 – 2019 Long term
(2020+)
Gold (US$ per ounce) $1,300 $1,300 $1,300 $1,300
Copper (US$ per pound) $3.00 $3.00 $3.00 $3.00
AUD:USD exchange rate $0.93 declining to $0.85
$0.85 $0.91 declining to $0.81
$0.80
Discount rate (%) USD Assets 5.25 to 5.75%
AUD Assets 5.5%
USD Assets 5.25 to 5.75%
AUD Assets 5.5%
Gold multiple (times) 1.0 1.0
Commodity prices and exchange rates
Commodity price and foreign exchange rates are estimated with reference to external market forecasts and reviewed at least annually. The rates applied have regard to observable market data including spot and forward values, to market analysis including equity analyst estimates. The continued strength of the Australian dollar relative to the US dollar has resulted in an increase in the longer term exchange rate assumption applied to the impairment reviews in 2014. The primary impact of this change was a reduction in the Fair Value of Telfer, as the stronger long term AUD:USD exchange rate resulted in lower A$ revenue. Discount rate
In determining the Fair Value of CGUs, the future cash flows were discounted using rates based on the Group’s estimated real after tax weighted average cost of capital, pursuant to the Capital Asset Pricing Model, for each functional currency used in the Group, with an additional premium applied having regard to the geographic location of the CGU. The discount rates applied to individual CGUs that recognised impairments were as follows:
CGU Functional Currency 2014 2013
Lihir USD 5.25% 5.25%
Hidden Valley USD 5.25% 5.25%
West Africa USD 5.75% 5.75%
Telfer AUD 5.50% 5.50%
Gold multiple
Historically, in valuing gold producers, the gold multiple has been widely used as a proxy for, inter alia, higher gold price, reserve and resource conversion and exploration success. In both the 2014 and 2013 impairment review, as a result of the continued absence of an observable premium, a gold multiple of 1.0 was applied to all CGUs in the estimation of Fair Value.

NOTES TO THE CONSOLIDATED FINANCIAL STATEMENTS FOR THE YEAR ENDED 30 JUNE 2014
Newcrest Mining Limited – Annual Financial Report – Year Ended 30 June 2014 E 55
20. Impairment of Goodwill and Non-Current Assets (continued) Production activity and operating and capital costs
Life of mine production activity and operating and capital cost assumptions are based on the Group’s latest budget, five year plan and/or longer term LOM plans. The projections include expected cost improvements reflecting the Group’s objectives to maximise free cash flow, optimise and reduce activity, apply technology, improve capital and labour productivity and remove high cost gold ounces from the production profile. The LOM plan used for Lihir in the estimation of Fair Value for the 2014 impairment review included increased operating cost assumptions which took into account cost performance realised during the 2014 financial year, following a full year of operation after the plant expansion, and with the knowledge being gained from a major review of operating costs currently underway. Production activity assumptions reflect expectations of ongoing improvement projects at Lihir with further increases in processing throughput assumed following the completion of the plant expansion project in the 2013 financial year. The LOM plans for West Africa and Hidden Valley used in the 2014 impairment review reflect updated operating cost, capital cost and development timing assumptions. Exploration values and Unmined resource
Exploration values have been estimated by the Group based on estimates of total mineral endowments by CGU. A per unit valuation of expected resource growth is applied on a CGU specific basis, determined by the expected realisable value of the estimated additional inventory. Unmined resources may not be included in a CGU’s particular life of mine plan for a number of reasons, including the need to constantly re-assess the economic returns on and timing of specific production options in the current economic environment. The Group has estimated unmined resources values on a dollar margin per gold equivalent ounce basis individually for each CGU, taking into account a range of factors including the physical specifications of the ore, probability of conversion, estimated capital and operating costs, and length of mine life. The value of exploration and unmined resources as a % of the assessed Fair Value in the current period and prior period for each CGU subject to impairment is as follows:
Lihir Telfer Hidden Valley West Africa
2014
Exploration 8% 13% 11% 22%
Unmined resource 1% 0% 0% 3%
2013
Exploration 6% 9% 8% 25%
Unmined resource 1% 18% 8% 6%
Unmined resources values in the 2014 impairment review reflect changes in assumed economic returns of these resources, including incorporating the impact of the change in long term AUD:USD exchange rate assumption.
NOTES TO THE CONSOLIDATED FINANCIAL STATEMENTS FOR THE YEAR ENDED 30 JUNE 2014
Newcrest Mining Limited – Annual Financial Report – Year Ended 30 June 2014 E 56
20. Impairment of Goodwill and Non-Current Assets (continued) iii) Impacts After reflecting the write down of certain assets arising from the Group’s revised operating plans, the Group has conducted carrying value analysis and recognised goodwill and non-current assets impairments of A$2,381 million after tax, as summarised in the table below:
CGU Impairment-
Goodwill Impairment- Other Assets Total
A$M A$M A$M Lihir 429 2,218 2,647 Telfer - 204 204 West Africa (1) - 198 198 Hidden Valley - 79 79 Total items by CGU 429 2,699 3,128 Tax (747) Total items by CGU (after tax) 2,381 Attributable to: Non-controlling interest 17 Owners of the parent 2,364 2,381
(1) Includes impairment of A$56 million pre-tax recognised at 31 December 2013 (A$47 million post-tax and non-
controlling interest). The key drivers of the impairments for the respective CGU’s are:
At Lihir, primarily reflecting a change in the operating and capital cost assumptions taking into account cost performance realised in the 2014 financial year, following a full year of operation post the plant expansion and the knowledge being gained from a major review of operating costs currently underway at the site;
At Telfer, primarily reflecting the increase in the long term AUD:USD exchange rate assumptions which had a negative impact on A$ revenue;
At West Africa and Hidden Valley, primarily reflecting updated operating cost, capital cost and development timing assumptions;
The Fair Value of the Group’s other CGUs – Cadia Valley and Gosowong – were assessed by the Group to significantly exceed their carrying values.

NOTES TO THE CONSOLIDATED FINANCIAL STATEMENTS FOR THE YEAR ENDED 30 JUNE 2014
Newcrest Mining Limited – Annual Financial Report – Year Ended 30 June 2014 E 57
20. Impairment of Goodwill and Non-Current Assets (continued) b) Sensitivity Analysis After effecting the impairments for the Lihir, Telfer, West Africa and Hidden Valley CGUs, the Fair Value of these assets is assessed as being equal to their carrying amount as at 30 June 2014. Any variation in the key assumptions used to determine Fair Value would result in a change of the estimated Fair Value. If the variation in assumption had a negative impact on Fair Value it could indicate a requirement for additional impairment to non-current assets. It is estimated that changes in the key assumptions would have the following approximate impact on the Fair Value of each CGU in its functional currency that has been subject to impairment in the 2014 statutory accounts:
$ million in functional currency Lihir Telfer Hidden Valley
West Africa
USD AUD USD USD
US$100 per ounce change in gold price 1,235 410 70 55
0.25% increase/decrease in discount rate 170 10 5 5
$0.05 increase/decrease in AUD:USD rate n/a 340 n/a n/a
5% increase/decrease in operating costs from that assumed
485 240 40 25
As identified above, the level of production activity is also a key assumption in the determination of Fair Value, most notably in relation to Lihir, for which further increases in processing throughput are assumed. Should increases in processing capacity not be achieved, changes in Fair Value estimates may arise. Due to the number of factors that could impact production activity, such as processing throughput, changing ore grade and/or metallurgy and revisions to mine plans in response to physical or economic conditions, no quantified sensitivity has been determined. It must be noted that each of the sensitivities above assumes that the specific assumption moves in isolation, whilst all other assumptions are held constant. In reality, a change in one of the aforementioned assumptions may accompany a change in another assumption which may have an offsetting impact (for example, a decline in the US$ gold price accompanied with a decline in the A$ compared to the US$). Action is also usually taken to respond to adverse changes in economic assumptions that may mitigate the impact of any such change. In addition to the impairment testing performed at 30 June 2014, the Group also undertook a sensitivity analysis on the Cadia Valley and Gosowong CGUs. Both of these CGUs have a Fair Value that significantly exceeds their carrying value. None of the sensitivities in the table above, applied either in isolation or in aggregate (as improbable as this scenario may be) to the Cadia Valley and Gosowong CGUs would cause an impairment in either CGU as at 30 June 2014. The gold price assumptions required in order for the estimated Fair Values to equal the carrying amounts for these two CGUs are:
Cadia Valley – less than approximately US$725 per ounce; and Gosowong – less than approximately US$825 per ounce.
NOTES TO THE CONSOLIDATED FINANCIAL STATEMENTS FOR THE YEAR ENDED 30 JUNE 2014
Newcrest Mining Limited – Annual Financial Report – Year Ended 30 June 2014 E 58
21. Investment in Associate 2014 2013 $M $M (a) Investment in Evolution Mining Ltd (1) Carrying amount at 1 July 132 395 Share of comprehensive income/(loss) 2 (2) Dividends received (5) - Share of results of associate: - Share of associate’s operational profit 22 12 - Share of associate’s impairment - (122) 22 (110) Reversal of/(additional) impairment loss recognised (2) (3) 11 (151) Carrying amount at 30 June (3) 162 132
(1) The Group holds 231,082,631 shares (2013: 231,082,631) in Evolution Mining Limited (‘Evolution’),
representing a 32.4% (2013: 32.6%) interest. Evolution is an Australian gold mining company listed on the Australian Securities Exchange (ASX).
(2) As a result of the Group’s impairment review at 30 June 2013, the investment was impaired by
$151 million to the market value of $132 million. This was based on the ASX closing market bid price of $0.57 as at 28 June 2013.
(3) At 30 June 2014, an impairment reversal of $11 million was recognised based on the ASX closing
market bid price of $0.70. The carrying amount of the investment is equal to the market value.
(b) Summarised Financial Information The following table discloses summarised financial information of the Group’s investment in Evolution:
2014 2013 $M $M Associate’s statement of financial position: Current assets 154 103 Non-current assets 956 919 Current liabilities (101) (99) Non-current liabilities (204) (176) Net assets 805 747 Proportion of Newcrest’s ownership 32.4% 32.6% Carrying value calculated per ownership percentage 261 242 Fair value adjustment (99) (110) Carrying amount 162 132 Associate’s statement of comprehensive income: Revenue 634 637 Profit/(Loss) after tax 68 (337) Other comprehensive income 6 (6)

NOTES TO THE CONSOLIDATED FINANCIAL STATEMENTS FOR THE YEAR ENDED 30 JUNE 2014
Newcrest Mining Limited – Annual Financial Report – Year Ended 30 June 2014 E 59
21. Investment in Associate (continued)
(e) Transactions with Associate
Directors fees in the amount of $98 thousand were received by the Company from Evolution, a company in which Mr Lawrie Conway and Mr Peter Smith were Directors, for services provided during the period in which they were employed with the Company (2013: $193 thousand).
22. Trade and Other Payables 2014 2013 $M $M Trade payables (1) 88 136 Other payables and accruals (1) 231 484 Total trade and other payables 319 620 (1) All payables are unsecured, non interest-bearing and are normally
settled on 30-60 day terms.

NOTES TO THE CONSOLIDATED FINANCIAL STATEMENTS FOR THE YEAR ENDED 30 JUNE 2014
Newcrest Mining Limited – Annual Financial Report – Year Ended 30 June 2014 E 60
23. Borrowings 2014 2013 Note $M $M Current Finance lease liabilities – secured - 1 US dollar private placement notes – unsecured 112 - Total current borrowings 112 1 Non-Current US dollar bilateral bank debt – unsecured (1) (a) 1,725 1,806 US dollar corporate bonds – unsecured (1) (b) 2,107 2,156 US dollar private placement notes – unsecured (c) 132 248 Total non-current borrowings 3,964 4,210
(1) Transaction costs incurred in the establishment of these facilities have been deducted from the face value of
the facility as at 30 June 2014. Previously transaction costs were disclosed in Other Assets. (a) US dollar bilateral bank debt
The Group has bilateral bank debt facilities of US $3,150 million (2013: US $2,500 million) with 13 banks (2013: 10 banks). These are committed unsecured revolving facilities with maturities ranging between September 2015 and September 2019 (2013: maturities ranging between September 2015 and September 2017), individually negotiated and documented with each bank but with similar terms and conditions. These facilities are on normal terms and conditions and include certain financial covenants. Interest is based on LIBOR plus a margin which varies amongst the lenders. The facility maturity dates profiles are shown in the table below: 2014 2013 2014 2013 Facility Maturity US $M US $M A $M A $M
September 2015 225 1,625 239 1,752 September 2016 875 - 929 - October 2016 125 - 133 - January 2017 200 - 212 - September 2017 725 875 769 943 September 2018 500 - 531 - October 2018 125 - 133 - March 2019 250 - 265 - September 2019 125 - 133 -
3,150 2,500 3,344 2,695
(b) US dollar corporate bonds
In each of November 2011 and October 2012, Newcrest issued US $1,000 million in US dollar corporate bonds (notes). The notes were sold in accordance with Rule 144A and Regulation S of the Securities Act of the United States. The notes consist of: US $750 million Senior Unsecured Notes due 15 November 2021 with a coupon of 4.45%. US $750 million Senior Unsecured Notes due 1 October 2022 with a coupon of 4.20%. US $500 million Senior Unsecured Notes due 15 November 2041 with a coupon of 5.75%.

NOTES TO THE CONSOLIDATED FINANCIAL STATEMENTS FOR THE YEAR ENDED 30 JUNE 2014
Newcrest Mining Limited – Annual Financial Report – Year Ended 30 June 2014 E 61
23. Borrowings (continued)
(c) US dollar private placement notes
During the year ended 30 June 2005, the Group issued US$ 350 million of long term senior unsecured notes into the North American private placement market. The proceeds of the placement were received on 11 May 2005. The tranches remaining are shown in the table below: 2014 2013 2014 2013 Maturity Term US $M US $M A $M A $M
11 May 2015 Fixed 10 years 105 105 112 113 11 May 2017 Fixed 12 years 100 100 106 108 11 May 2020 Fixed 15 years 25 25 26 27 230 230 244 248
These notes are on normal terms and conditions and include certain financial covenants. Interest on the notes is payable semi-annually at an average of 5.7% (2013: 5.7%). These notes were fully drawn as at 30 June 2014 and have been restated to Australian dollars, using the spot exchange rate at the reporting date.
(d) US dollar facility agreement
During the year, PT Nusa Halmahera Minerals entered into a US$ 50 million loan facility with one bank. This is an unsecured revolving facility maturing in January 2015. The facility is on normal terms and conditions and includes certain financial covenants. Interest is based on LIBOR plus a margin. As at 30 June 2014 this facility has not been utilised.
(e) Hedging: US dollar denominated debt
Where considered appropriate the foreign currency component of US dollar denominated debt is designated either as a cashflow hedge of future US dollar denominated commodity sales or a net investment in foreign operations with a US dollar functional currency. Refer Note 32(e) for further details.
(f) Financial arrangements
The Group has access to the following unsecured financing arrangements at the end of the financial year.
2014 2013 2014 2013 US $M US $M A $M A $M Facilities utilised at reporting date: USD Bilateral bank debt facilities 1,630 1,675 1,730 1,806 USD Private placement notes 230 230 244 248 USD Corporate bonds 2,000 2,000 2,123 2,156 3,860 3,905 4,097 4,210 Facilities unutilised USD Bilateral bank debt facilities 1,520 825 1,614 889 USD Facility agreement 50 - 53 - 1,570 825 1,667 889 Total facilities USD Bilateral bank debt facilities 3,150 2,500 3,344 2,695 USD Private placement notes 230 230 244 248 USD Corporate bonds 2,000 2,000 2,123 2,156 USD Facility agreement 50 - 53 - 5,430 4,730 5,764 5,099

NOTES TO THE CONSOLIDATED FINANCIAL STATEMENTS FOR THE YEAR ENDED 30 JUNE 2014
Newcrest Mining Limited – Annual Financial Report – Year Ended 30 June 2014 E 62
24. Provisions 2014 2013 Note $M $M Current Employee benefits (a) 154 119 Mine rehabilitation (b) 7 15 Restructure (c) 16 46 Other (d) 38 61 Total current provisions 215 241 Non-Current Employee benefits (a) 40 43 Mine rehabilitation (b) 309 302 Restructure (c) 10 8 Total non-current provisions 359 353
(a) Employee benefits
Represents annual leave, long service leave, salary at risk and other employee benefits (refer Note 2 (t)).
(b) Mine rehabilitation
The Group recognises that it has an obligation to restore its mine sites to their original condition at the end of the life of mine. Mine rehabilitation costs are provided for at the present value of future expected expenditure when the liability is incurred. Although the ultimate cost to be incurred is uncertain, the Group has estimated its costs based on feasibility and engineering studies using current restoration standards and techniques. When this liability is recognised a corresponding asset is also recognised as part of the development costs of the mine and is amortised across the same useful life.
(c) Restructure Represents the costs associated with the restructuring activities within the Group. Refer to Note 6.
(d) Other provisions Comprises of onerous contracts, community obligations and other miscellaneous items. Movements in provisions Movements in provisions (excluding employee benefits) during the year were as follows:
Mine
Rehabilitation
Restructure Other
Provisions $M $M $M At 1 July 2013 317 54 61 Recognised during the year 25 46 1 Movements in discount rates and timing of cash flows (25) - - Paid/utilised during the year (9) (74) (24) Unwinding of discount 10 - - Foreign currency translation (2) - - At 30 June 2014 316 26 38 Split between: Current 7 16 38 Non-current 309 10 - 316 26 38

NOTES TO THE CONSOLIDATED FINANCIAL STATEMENTS FOR THE YEAR ENDED 30 JUNE 2014
Newcrest Mining Limited – Annual Financial Report – Year Ended 30 June 2014 E 63
25. Other Financial Liabilities 2014 2013 $M $M Current Quotational period derivatives (1) - 68 Copper forward sales contracts 7 - Gold forward sales contracts 3 - Other financial derivatives - 3 Total current financial derivative liabilities 10 71 (1) Represents the embedded derivatives relating to quotational period
movements on commodity sales. Refer note 2(y).
26. Issued Capital 2014 2013 $M $M(a) Movements in Issued Capital Opening balance 13,592 13,561 Shares issued during the year: Dividend reinvestment plan (ii) - 38 Share match plan (i) 1 - Shares repurchased and held in treasury (iii) - (7) Total issued capital 13,593 13,592 2014 2013 (b) Number of Issued Ordinary Shares No. No. Comprises: Shares held by the public 766,165,794 765,607,049 Treasury shares 345,177 903,922 Total issued capital 766,510,971 766,510,971
Movement in issued ordinary shares for the year Opening number of shares 765,607,049 764,561,477 Shares issued under: Share plans (i) 558,745 210,656 Dividend reinvestment plan (ii) - 1,510,971 Purchases by the Newcrest Employee Share Trust (iii) - (676,055) Closing number of shares 766,165,794 765,607,049 Movement in treasury shares for the year Opening number of shares 903,922 438,523 Purchases - 676,055 Issued pursuant to share plans (558,745) (210,656) Closing number of shares 345,177 903,922 (i) Represents rights exercised under the Company’s share-based payments plans and executive service
agreements. Refer to Note 29 for share-based payments. (ii) The Dividend reinvestment plan provides shareholders with an opportunity to reinvest all or part of
their dividend entitlements at the market price at the time of issue. (iii) Represents shares purchased by the Newcrest Employee Share Trust on behalf of Newcrest Mining
Limited to satisfy future share rights and awards as they vest.

NOTES TO THE CONSOLIDATED FINANCIAL STATEMENTS FOR THE YEAR ENDED 30 JUNE 2014
Newcrest Mining Limited – Annual Financial Report – Year Ended 30 June 2014 E 64
27. Retained Earnings/(Accumulated Losses) 2014 2013 Restated $M $M
Opening balance (3,144) 2,890
Assets written-off to retained earnings under transitional
provisions of Interpretation 20 (after tax) - (75)
Restated opening balance (3,144) 2,815
Loss after tax (attributable to owners of the parent) (2,221) (5,783)
Dividends paid - (268)
Changes in equity interests held by the parent - 92
Closing balance (5,365) (3,144)
28. Reserves 2014 2013 Restated Note $M $M Equity Settlements Reserve (a) 71 62
Foreign Currency Translation Reserve (b) (735) (657)
Hedge Reserve (c) 17 13
Fair Value Reserve (d) - (3)
Total Reserves (647) (585) (a) Equity Settlements Reserve The equity settlements reserve is used to recognise the fair value of rights and options issued to employees, including Key Management Personnel in relation to equity-settled share based payments. (b) Foreign Currency Translation Reserve The foreign currency translation reserve is used to record exchange differences arising from the translation of the financial statements of foreign subsidiaries. The reserve is also used to record gains and losses on hedges of the net investment in foreign operations (refer Note 2(v)). In prior years, the Group issued US $2,000 million in US denominated corporate bonds. This debt was designated as a hedge of the net investment in a foreign operation (Lihir Gold Limited). The exchange gains or losses upon subsequent revaluation of this US dollar denominated debt, in an effective hedge relationship, from the historical drawdown rate to the period-end spot exchange rate are deferred in equity in the foreign currency translation reserve. These cumulative gains or losses will remain deferred in equity and will only be transferred to the Income Statement in the event of the disposal of the foreign operation.
NOTES TO THE CONSOLIDATED FINANCIAL STATEMENTS FOR THE YEAR ENDED 30 JUNE 2014
Newcrest Mining Limited – Annual Financial Report – Year Ended 30 June 2014 E 65
28. Reserves (continued) (c) Hedge Reserve The hedge reserve is used to record the effective portion of changes in the fair value of cash flow hedges (refer note 2(v)). The components of the hedge reserve at year end were as follows:
2014 2013 Component $M $M FX gains on US dollar denominated borrowings (i) 20 20 Other cashflow hedges 4 (1) 24 19 Tax effect (7) (6) Total Hedge Reserve 17 13
(i) FX Gains on USD Private Placement Notes
The foreign currency component of this US dollar denominated debt was designated as a cash flow hedge of future US dollar denominated commodity sales. During the 2010 year, this hedge was de-designated. As a result of this de-designation, foreign exchange differences on the retranslation of this debt, from the date of de-designation are recorded in the Income Statement. The balance of this cashflow hedge deferred in equity is $14m (net of tax). This balance will continue to remain deferred in equity and will be released to the Income Statement, in the same period as the anticipated hedged US dollar denominated commodity sales. During the year $nil was transferred to the Income Statement (2013: $nil).
(d) Fair Value Reserve
The Fair Value Reserve records movements in the fair value of available-for-sale financial assets. Where a revalued financial asset is sold or is determined to be impaired, the cumulative gain or loss included in the reserve is recognised in the Income Statement. During the year, the balance of this reserve was recycled to the Income Statement.

NOTES TO THE CONSOLIDATED FINANCIAL STATEMENTS FOR THE YEAR ENDED 30 JUNE 2014
Newcrest Mining Limited – Annual Financial Report – Year Ended 30 June 2014 E 66
29. Share-Based Payments (a) Newcrest Employee Share Acquisition Plan and Share Match Plan Under the Newcrest Employee Share Acquisition Plan (ESAP or the plan), eligible employees are granted shares in Newcrest Mining Limited (‘the Company’) for no cash consideration. All Australian resident permanent employees who have been continuously employed by the Group for a period of at least one year, and are not eligible for the Executive Performance Share Plan, are able to participate in the plan. Under the plan, eligible employees may be granted up to $1,000 worth of fully paid ordinary shares in the Company for no consideration. The market value of shares issued under the plan is measured at the weighted average market price of the shares on the ASX over a period of a week prior to the grant date. The fair value of shares issued under the plan during the year was $1.6 million (2013: $1.6 million). Members of the plan receive all the rights of ordinary shareholders. Unrestricted possession of these shares occurs at the earliest of, three years from the date of issue or the date employment ceases. During 2014, 1,571 employees participated in the plan (2013: 1,642 employees). The Share Match Plan commenced during the 2013 financial year. Employees may contribute up to A$4,950 to acquire shares in the plan year. On the third anniversary of the start of the plan year, the Company will match the number of acquired shares held by the employee at that time with matched shares. (b) Executive Performance Share Plan (LTI Plan) The Executive Performance Share Plan (also referred to as the Long Term Incentive (LTI) plan) entitles participants to receive rights to ordinary fully paid shares in the Company (Performance Rights). The Executive Directors, Executive General Managers, General Managers and Managers participate in this plan. The performance measures for the Performance Rights granted in the 2014 and 2013 financial years comprised of three equally weighted measures, being: Reserves Growth; Comparative Cost Position; and Return on Capital Employed (ROCE). Each LTI measure was chosen by the Board as it is a key driver of group performance: Reserves Growth and Comparative Cost Position being key drivers of shareholder value in a gold mining
company, and; ROCE being a direct measure of returns per unit of capital. Performance against each of these measures over the three year vesting period accounts for 1/3rd of any grant made to participants. There is no ability to re-test performance under the Plan after the performance period. The assessed fair value at grant date of the share rights granted under the plan during the 2014 year was $7.16 (2013: $27.85) per right. The fair value is independently determined using a Black-Scholes option pricing model. The model inputs for share rights granted included: Exercise price: Nil (2013: Nil) Risk-free interest rate: 3.08% (2013: 2.81%) Expected life of right (years): 3 years (2013: 3 years) Share price at grant date: $7.16 (2013: $29.12) Expected dividend yield: 0.0% (2013: 1.5%)

NOTES TO THE CONSOLIDATED FINANCIAL STATEMENTS FOR THE YEAR ENDED 30 JUNE 2014
Newcrest Mining Limited – Annual Financial Report – Year Ended 30 June 2014 E 67
29. Share-Based Payments (continued) (c) Movements in the Number of Rights issued under the LTI Plan Detailed information of share rights over unissued ordinary shares is set out below: Movement in Number of Rights During the Year Number
Grant date
Exercise date on or after
Expiry Date
Number at beginning
of year Granted Exercised Forfeited
Number at end
of year
Exercise-able at end of year
2014
11 Nov 08 11 Nov 10 11 Nov 12 31,175 - (31,175) - - -
11 Nov 08 11 Nov 11 11 Nov 13 110,967 - (110,967) - - -
10 Nov 09 10 Nov 12 10 Nov 14 90,284 - (64,542) (2,645) 23,097 23,097
10 Nov 10 10 Nov 13 10 Nov 15 178,590 - (33,048) (123,134) 22,408 22,408
23 Sep 11 23 Sep 14 23 Sep 14 480,584 - - (73,140) 407,444 -
17 Sep 12 17 Sep 15 17 Sep 15 704,641 - - (178,656) 525,985 -
4 Dec 13 16 Sep 16 16 Sep 16 - 2,048,677 - (221,840) 1,826,837 -
Total 1,596,241 2,048,677 (239,732) (599,415) 2,805,771 45,505
2013
9 Nov 07 9 Nov 10 9 Nov 12 53,280 - (53,280) - - -
11 Nov 08 11 Nov 10 11 Nov 12 42,242 - (11,067) - 31,175 31,175
11 Nov 08 11 Nov 11 11 Nov 13 133,569 - (22,602) - 110,967 110,967
10 Nov 09 10 Nov 12 10 Nov 14 170,553 - (31,181) (49,088) 90,284 90,284
10 Nov 10 10 Nov 13 10 Nov 15 193,098 - - (14,508) 178,590 -
23 Sep 11 23 Sep 14 23 Sep 14 515,439 - - (34,855) 480,584 -
17 Sep 12 17 Sep 15 17 Sep 15 - 743,360 - (38,719) 704,641 -
Total 1,108,181 743,360 (118,130) (137,170) 1,596,241 232,426 All share rights have a nil exercise price. (d) Movement in the Number of Rights issued under the Share Match Plan During the year, 263,161 rights were granted for nil consideration under the Share Match Plan (2013: 97,796). Of these rights 1,914 were exercised (2013: nil) and 28,354 were forfeited (2013: nil). As at 30 June 2014, there are a total of 333,159 unissued shares under rights (2013: 97,796).

NOTES TO THE CONSOLIDATED FINANCIAL STATEMENTS FOR THE YEAR ENDED 30 JUNE 2014
Newcrest Mining Limited – Annual Financial Report – Year Ended 30 June 2014 E 68
30. Key Management Personnel (a) Details of Directors and Key Management Personnel Key Management Personnel (KMP) comprises the Company Directors (including Executive Directors) and Executive General Managers. The Managing Director, Finance Director and the Executive General Managers (EGM) are members of the Group’s Executive Committee (Exco). The members of the Exco exercise the greatest control over the management and strategic direction of the Group and are also the highest paid individuals in the Group. Name Position Directors Peter Hay Non-Executive Chairman (1) Sandeep Biswas Executive Director and Chief Operating Officer (2) Gerard Bond Finance Director and Chief Financial Officer Philip Aiken AM Non-Executive Director Vince Gauci Non-Executive Director Winifred Kamit Non-Executive Director Richard Knight Non-Executive Director Rick Lee Non-Executive Director Tim Poole Non-Executive Director John Spark Non-Executive Director Don Mercer Non-Executive Chairman (3) Greg Robinson Managing Director and Chief Executive Officer (4) Executive General Managers Geoff Day Craig Jones Francesca Lee Colin Moorhead Debra Stirling (5) David Woodall Former Executive General Managers Stephen Creese Lawrie Conway Brett Fletcher Scott Langford Andrew Logan Peter Smith
(1) Appointed as a Non-Executive Director on 8 August 2013 and Non-Executive Chairman on 1 January 2014. (2) Appointed Executive Director and Chief Operating Officer on 1 January 2014. Sandeep Biswas succeeded Greg
Robinson as Managing Director and Chief Executive Officer on 4 July 2014.
(3) Retired from the Board and as Non-Executive Chairman on 31 December 2013.
(4) Retired from the Board and was succeeded by Sandeep Biswas as referred to in note (2) above.
(5) On 4 July 2014, Debra Stirling left the Company.

NOTES TO THE CONSOLIDATED FINANCIAL STATEMENTS FOR THE YEAR ENDED 30 JUNE 2014
Newcrest Mining Limited – Annual Financial Report – Year Ended 30 June 2014 E 69
30. Key Management Personnel (continued) (b) Remuneration of Key Management Personnel and Directors
2014 2013 $’000 $’000
Short-term 17,746 13,998 Long-term 364 - Post-employment 352 265 Termination benefits 5,056 - Share-based payments (579) 2,514 22,939 16,777
(c) Shareholdings and Rights of Key Management Personnel
Details of shareholdings and rights of KMP are outlined in the Remuneration Report.
(d) Loans and other transactions with Key Management Personnel
There are no loans made to KMP, or their related entities, by the Group.
31. Auditors Remuneration 2014 2013 $’000 $’000 (a) Amounts received or due and receivable by Ernst & Young
(Australia) for:
Audit or review of financial reports of the company and subsidiaries 2,372 1,916
Other services: Tax advisory and assurance services 502 - Accounting advice and other assurance-related services 149 14 Assurance services in relation to USD corporate bonds issue - 195 Services in relation to regulatory and business processes - 928 3,023 3,053 (b) Amounts received or due and receivable by related practices
of Ernst & Young (Australia) for: Audit or review of financial reports of subsidiaries 224 213
(c) Amounts received or due and receivable by other auditors for: Audit or review of the financial report of subsidiaries 87 109 87 109

NOTES TO THE CONSOLIDATED FINANCIAL STATEMENTS FOR THE YEAR ENDED 30 JUNE 2014
Newcrest Mining Limited – Annual Financial Report – Year Ended 30 June 2014 E 70
32. Financial and Capital Risk Management (a) Financial Risk Management Objectives and Policies The Group’s management of financial risk is aimed at ensuring the Group is well placed to: withstand significant changes in cash-flow-at-risk scenarios and still meet all financial commitments as
and when they fall due; maintain the capacity to fund forecasted project developments and exploration; and support maintaining the equivalent of an investment grade credit rating. The Group continually monitors and reviews its forecast financial position against these criteria. The Group has a detailed planning process that forms the basis of all cash flow forecasting and updates these plans through a monthly estimation process. The cash flow forecast is then used to stress test financial risk and forms the basis for the Capital Management Plan. Credit, liquidity and market risk (including foreign exchange risk, commodity price risk and interest rate risk) arise in the normal course of the Group’s business. These are managed under Board approved directives which underpin Group Treasury policies and processes. The Group’s principal financial instruments, other than derivatives, comprise interest-bearing debt, cash and short term deposits. Other financial instruments include trade receivables and trade payables which arise directly from operations. The Group’s forecast financial risk position with respect to key financial objectives and compliance with Treasury policy are regularly reported to the Board. The following table discloses the carrying amounts of each class of financial assets and financial liabilities at year end. 2014 2013 $M $M
Financial Assets Cash and cash equivalents 141 69 Loans and receivables 169 178 Derivatives at fair value through profit or loss 20 26 Derivatives in designated hedge accounting relationship 4 2 334 275 Financial Liabilities Trade and other payables 319 620 Borrowings 4,076 4,211 Derivatives at fair value through profit or loss 10 68 Derivatives in designated hedge accounting relationship - 3 4,405 4,902
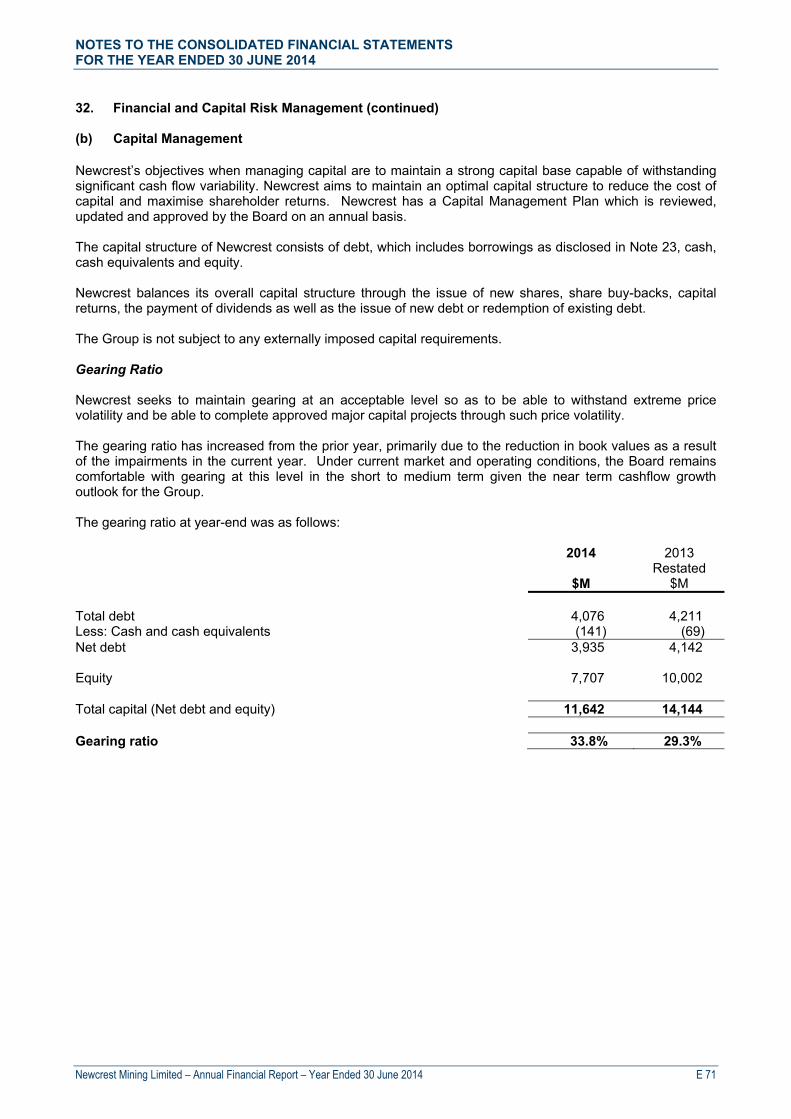
NOTES TO THE CONSOLIDATED FINANCIAL STATEMENTS FOR THE YEAR ENDED 30 JUNE 2014
Newcrest Mining Limited – Annual Financial Report – Year Ended 30 June 2014 E 71
32. Financial and Capital Risk Management (continued) (b) Capital Management Newcrest’s objectives when managing capital are to maintain a strong capital base capable of withstanding significant cash flow variability. Newcrest aims to maintain an optimal capital structure to reduce the cost of capital and maximise shareholder returns. Newcrest has a Capital Management Plan which is reviewed, updated and approved by the Board on an annual basis. The capital structure of Newcrest consists of debt, which includes borrowings as disclosed in Note 23, cash, cash equivalents and equity. Newcrest balances its overall capital structure through the issue of new shares, share buy-backs, capital returns, the payment of dividends as well as the issue of new debt or redemption of existing debt. The Group is not subject to any externally imposed capital requirements. Gearing Ratio Newcrest seeks to maintain gearing at an acceptable level so as to be able to withstand extreme price volatility and be able to complete approved major capital projects through such price volatility. The gearing ratio has increased from the prior year, primarily due to the reduction in book values as a result of the impairments in the current year. Under current market and operating conditions, the Board remains comfortable with gearing at this level in the short to medium term given the near term cashflow growth outlook for the Group. The gearing ratio at year-end was as follows:
2014
$M
2013 Restated
$M Total debt 4,076 4,211 Less: Cash and cash equivalents (141) (69) Net debt 3,935 4,142 Equity 7,707 10,002 Total capital (Net debt and equity) 11,642 14,144 Gearing ratio 33.8% 29.3%

NOTES TO THE CONSOLIDATED FINANCIAL STATEMENTS FOR THE YEAR ENDED 30 JUNE 2014
Newcrest Mining Limited – Annual Financial Report – Year Ended 30 June 2014 E 72
32. Financial and Capital Risk Management (continued) (c) Credit Risk Credit risk arises from the financial assets of the Group, which comprise cash and cash equivalents, trade and other receivables and derivative financial instruments. The Group’s exposure to credit risk arises from the potential default of the counterparty with a maximum exposure equal to the carrying amount of these financial assets as recorded in the financial statements. It is the Group’s policy that all customers who wish to trade on credit terms and providers of capital or financial counterparties are subject to a credit risk analysis including assessment of credit rating, short term liquidity and financial position. The Group obtains sufficient collateral (such as a letter of credit) where appropriate from customers, as a means of mitigating the risk of financial loss from defaults. At the reporting date the value of collateral held was $36 million (2013: $22 million). Receivables balances are monitored on an ongoing basis with the result that the Group’s exposure to bad debts is not significant. There were no material impairments of receivables as at 30 June 2014 or 30 June 2013. The majority of the Group’s receivables are due from concentrate customers in Japan, China, Europe and Korea. There have been no credit defaults with these customers in recent history. Newcrest’s Treasury department evaluates credit risk on a continual basis. At the reporting date there were no other significant concentrations of credit risk. The Group limits its counterparty credit risk on liquid funds and derivative financial instruments by dealing only with banks or financial institutions with credit ratings of at least A- equivalent. The ageing of trade and other receivables at the reporting date was as follows: Past due but not impaired Trade and other receivables
Not Past Due
Less than 30 days
Greater than 30 days
Total
$M $M $M $M 2014 Bullion awaiting settlement 34 - - 34 Metal in concentrate receivables 62 - - 62 GST receivable 46 - - 46 Other receivables 25 1 1 27 167 1 1 169 2013 Bullion awaiting settlement 12 - - 12 Metal in concentrate receivables 77 - - 77 GST receivable 57 - - 57 Other receivables 26 3 3 32 172 3 3 178
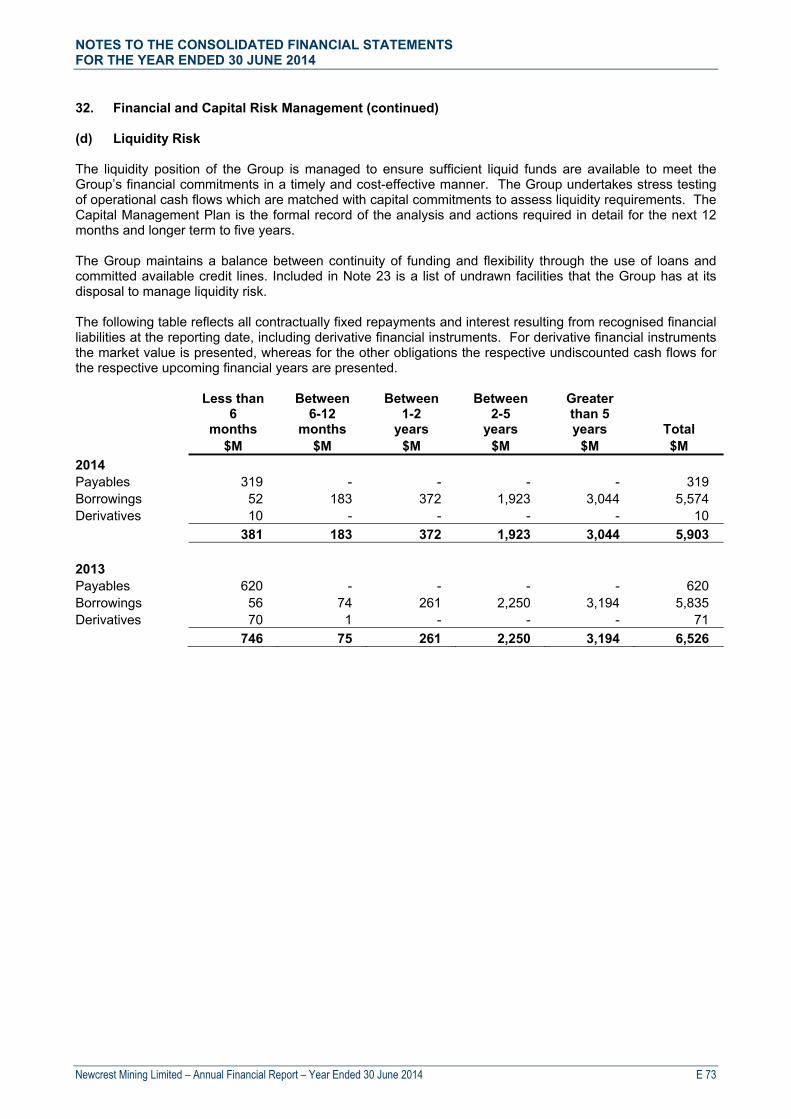
NOTES TO THE CONSOLIDATED FINANCIAL STATEMENTS FOR THE YEAR ENDED 30 JUNE 2014
Newcrest Mining Limited – Annual Financial Report – Year Ended 30 June 2014 E 73
32. Financial and Capital Risk Management (continued) (d) Liquidity Risk The liquidity position of the Group is managed to ensure sufficient liquid funds are available to meet the Group’s financial commitments in a timely and cost-effective manner. The Group undertakes stress testing of operational cash flows which are matched with capital commitments to assess liquidity requirements. The Capital Management Plan is the formal record of the analysis and actions required in detail for the next 12 months and longer term to five years. The Group maintains a balance between continuity of funding and flexibility through the use of loans and committed available credit lines. Included in Note 23 is a list of undrawn facilities that the Group has at its disposal to manage liquidity risk. The following table reflects all contractually fixed repayments and interest resulting from recognised financial liabilities at the reporting date, including derivative financial instruments. For derivative financial instruments the market value is presented, whereas for the other obligations the respective undiscounted cash flows for the respective upcoming financial years are presented.
Less than 6
months
Between 6-12
months
Between 1-2
years
Between 2-5
years
Greater than 5 years
Total $M $M $M $M $M $M
2014 Payables 319 - - - - 319 Borrowings 52 183 372 1,923 3,044 5,574 Derivatives 10 - - - - 10
381 183 372 1,923 3,044 5,903 2013 Payables 620 - - - - 620 Borrowings 56 74 261 2,250 3,194 5,835 Derivatives 70 1 - - - 71
746 75 261 2,250 3,194 6,526
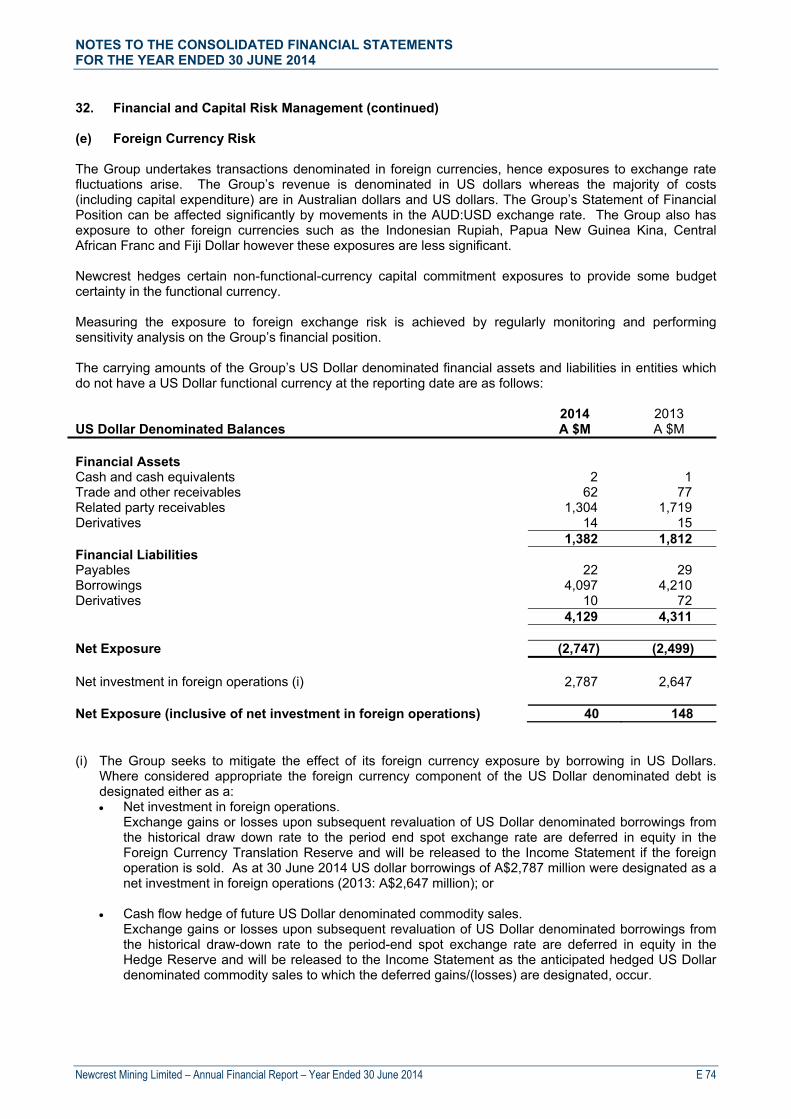
NOTES TO THE CONSOLIDATED FINANCIAL STATEMENTS FOR THE YEAR ENDED 30 JUNE 2014
Newcrest Mining Limited – Annual Financial Report – Year Ended 30 June 2014 E 74
32. Financial and Capital Risk Management (continued) (e) Foreign Currency Risk The Group undertakes transactions denominated in foreign currencies, hence exposures to exchange rate fluctuations arise. The Group’s revenue is denominated in US dollars whereas the majority of costs (including capital expenditure) are in Australian dollars and US dollars. The Group’s Statement of Financial Position can be affected significantly by movements in the AUD:USD exchange rate. The Group also has exposure to other foreign currencies such as the Indonesian Rupiah, Papua New Guinea Kina, Central African Franc and Fiji Dollar however these exposures are less significant. Newcrest hedges certain non-functional-currency capital commitment exposures to provide some budget certainty in the functional currency. Measuring the exposure to foreign exchange risk is achieved by regularly monitoring and performing sensitivity analysis on the Group’s financial position. The carrying amounts of the Group’s US Dollar denominated financial assets and liabilities in entities which do not have a US Dollar functional currency at the reporting date are as follows: 2014 2013 US Dollar Denominated Balances A $M A $M Financial Assets Cash and cash equivalents 2 1 Trade and other receivables 62 77 Related party receivables 1,304 1,719 Derivatives 14 15 1,382 1,812 Financial Liabilities Payables 22 29 Borrowings 4,097 4,210 Derivatives 10 72 4,129 4,311 Net Exposure (2,747) (2,499) Net investment in foreign operations (i) 2,787 2,647 Net Exposure (inclusive of net investment in foreign operations) 40 148 (i) The Group seeks to mitigate the effect of its foreign currency exposure by borrowing in US Dollars.
Where considered appropriate the foreign currency component of the US Dollar denominated debt is designated either as a: Net investment in foreign operations.
Exchange gains or losses upon subsequent revaluation of US Dollar denominated borrowings from the historical draw down rate to the period end spot exchange rate are deferred in equity in the Foreign Currency Translation Reserve and will be released to the Income Statement if the foreign operation is sold. As at 30 June 2014 US dollar borrowings of A$2,787 million were designated as a net investment in foreign operations (2013: A$2,647 million); or
Cash flow hedge of future US Dollar denominated commodity sales.
Exchange gains or losses upon subsequent revaluation of US Dollar denominated borrowings from the historical draw-down rate to the period-end spot exchange rate are deferred in equity in the Hedge Reserve and will be released to the Income Statement as the anticipated hedged US Dollar denominated commodity sales to which the deferred gains/(losses) are designated, occur.
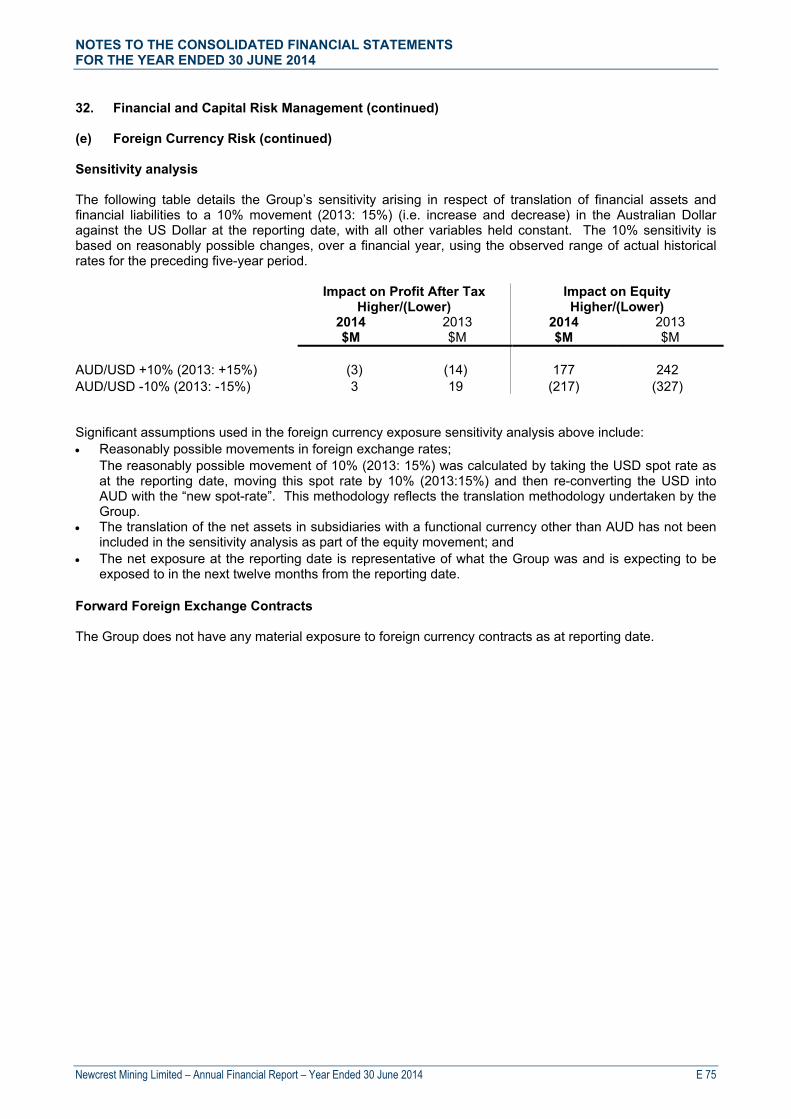
NOTES TO THE CONSOLIDATED FINANCIAL STATEMENTS FOR THE YEAR ENDED 30 JUNE 2014
Newcrest Mining Limited – Annual Financial Report – Year Ended 30 June 2014 E 75
32. Financial and Capital Risk Management (continued) (e) Foreign Currency Risk (continued) Sensitivity analysis The following table details the Group’s sensitivity arising in respect of translation of financial assets and financial liabilities to a 10% movement (2013: 15%) (i.e. increase and decrease) in the Australian Dollar against the US Dollar at the reporting date, with all other variables held constant. The 10% sensitivity is based on reasonably possible changes, over a financial year, using the observed range of actual historical rates for the preceding five-year period.
Impact on Profit After Tax Impact on Equity Higher/(Lower) Higher/(Lower) 2014 2013 2014 2013
$M $M $M $M AUD/USD +10% (2013: +15%) (3) (14) 177 242 AUD/USD -10% (2013: -15%) 3 19 (217) (327) Significant assumptions used in the foreign currency exposure sensitivity analysis above include: Reasonably possible movements in foreign exchange rates;
The reasonably possible movement of 10% (2013: 15%) was calculated by taking the USD spot rate as at the reporting date, moving this spot rate by 10% (2013:15%) and then re-converting the USD into AUD with the “new spot-rate”. This methodology reflects the translation methodology undertaken by the Group.
The translation of the net assets in subsidiaries with a functional currency other than AUD has not been included in the sensitivity analysis as part of the equity movement; and
The net exposure at the reporting date is representative of what the Group was and is expecting to be exposed to in the next twelve months from the reporting date.
Forward Foreign Exchange Contracts The Group does not have any material exposure to foreign currency contracts as at reporting date.

NOTES TO THE CONSOLIDATED FINANCIAL STATEMENTS FOR THE YEAR ENDED 30 JUNE 2014
Newcrest Mining Limited – Annual Financial Report – Year Ended 30 June 2014 E 76
32. Financial and Capital Risk Management (continued) (f) Commodity Price Risk The Group’s revenue is exposed to commodity price fluctuations, in particular to gold and copper prices. The Group has entered into gold and copper forward sales contracts and diesel forward contracts to manage its exposure to movements in commodity prices. The carrying amount of the Group’s derivative financial instruments as at the reporting date are disclosed in Notes 14 and 25. Quotational Period Derivatives
The terms of metal in concentrate sales contracts with third parties contain provisional pricing arrangements whereby the selling price for metal in concentrate is based on prevailing spot prices on a specified future date after shipment to the customer (quotation period). Gold ounces subject to quotational period adjustment at the reporting date is 204 thousand (2013: 151 thousand). Copper tonnes subject to quotational period adjustment at the reporting date is 34 thousand (2013: 30 thousand). The quotational period is usually one month for gold and three or four months for copper. In order to minimise the impact of quotational period adjustments, the Group takes out forward sales contracts at the time of concentrate shipments to lock in the price. Gold and Copper Forward Sales Contracts
The Group enters into gold and copper forward sales contracts to effectively fix the US dollar cash flows receivable on the sale of certain gold and copper concentrate. Gold and copper forward sales contracts are not designated into hedge relationships and therefore fair value adjustments on these contracts are recognised in the Income Statement as “Other Income/Expense”. The Group entered into gold forward sales contracts during the 2014 financial year. The following table details the gold and copper forward sale contracts outstanding as at the reporting date:
2014 2013 Gold and Copper
Quantity
Weighted Average
Price
Fair
Value
Quantity
Weighted Average
Price
Fair
Value forward sale contracts (‘000s) US$ A$M (‘000s) US$ A$M
Gold (ounces) Maturing less than 3 months 181 1,289 (3) - - - Copper (tonnes) Maturing less than 6 months 32 6,754 (7) 30 7,284 16
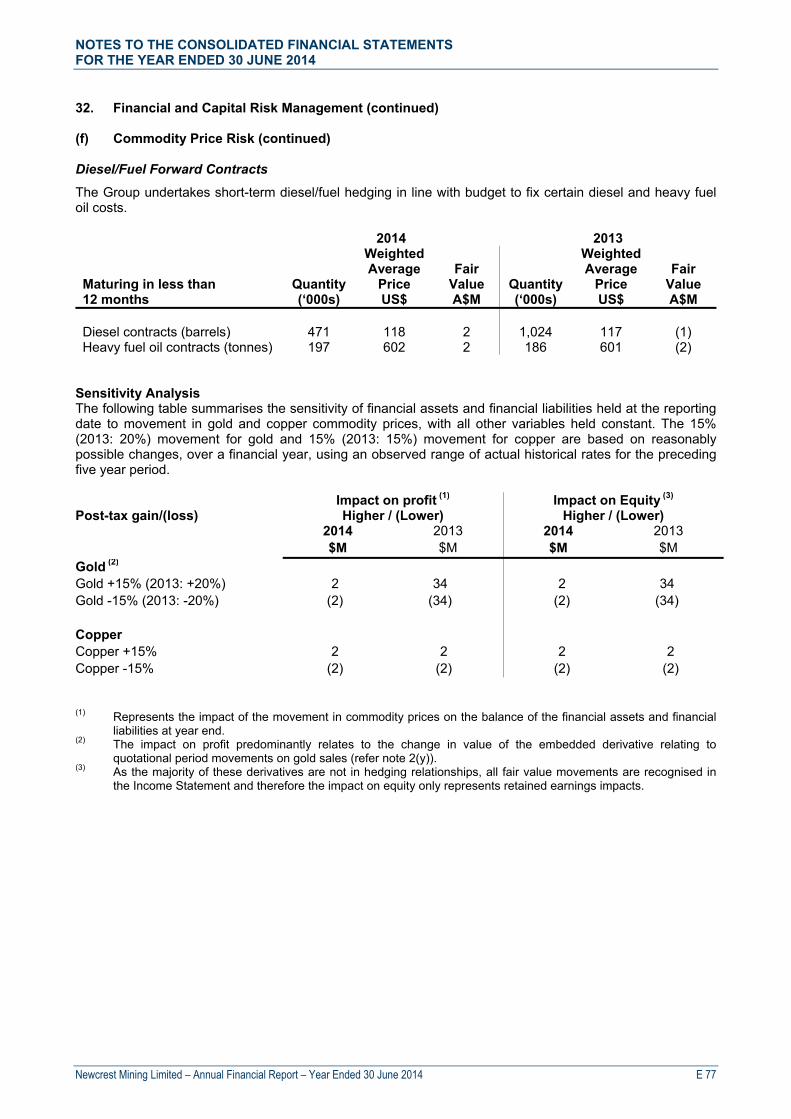
NOTES TO THE CONSOLIDATED FINANCIAL STATEMENTS FOR THE YEAR ENDED 30 JUNE 2014
Newcrest Mining Limited – Annual Financial Report – Year Ended 30 June 2014 E 77
32. Financial and Capital Risk Management (continued) (f) Commodity Price Risk (continued) Diesel/Fuel Forward Contracts
The Group undertakes short-term diesel/fuel hedging in line with budget to fix certain diesel and heavy fuel oil costs.
2014 2013 Maturing in less than
Quantity
Weighted Average
Price
Fair
Value
Quantity
Weighted Average
Price
Fair
Value 12 months (‘000s) US$ A$M (‘000s) US$ A$M
Diesel contracts (barrels) 471 118 2 1,024 117 (1) Heavy fuel oil contracts (tonnes) 197 602 2 186 601 (2)
Sensitivity Analysis The following table summarises the sensitivity of financial assets and financial liabilities held at the reporting date to movement in gold and copper commodity prices, with all other variables held constant. The 15% (2013: 20%) movement for gold and 15% (2013: 15%) movement for copper are based on reasonably possible changes, over a financial year, using an observed range of actual historical rates for the preceding five year period. Impact on profit (1) Impact on Equity (3) Post-tax gain/(loss) Higher / (Lower) Higher / (Lower) 2014 2013 2014 2013 $M $M $M $M
Gold (2) Gold +15% (2013: +20%) 2 34 2 34 Gold -15% (2013: -20%) (2) (34) (2) (34)
Copper Copper +15% 2 2 2 2 Copper -15% (2) (2) (2) (2)
(1) Represents the impact of the movement in commodity prices on the balance of the financial assets and financial
liabilities at year end. (2) The impact on profit predominantly relates to the change in value of the embedded derivative relating to
quotational period movements on gold sales (refer note 2(y)). (3) As the majority of these derivatives are not in hedging relationships, all fair value movements are recognised in
the Income Statement and therefore the impact on equity only represents retained earnings impacts.

NOTES TO THE CONSOLIDATED FINANCIAL STATEMENTS FOR THE YEAR ENDED 30 JUNE 2014
Newcrest Mining Limited – Annual Financial Report – Year Ended 30 June 2014 E 78
32. Financial and Capital Risk Management (continued) (g) Interest Rate Risk The Group is exposed to interest rate risk as entities in the Group borrow funds at both fixed and floating interest rates. The risk is managed by the Group by maintaining an appropriate mix between fixed and floating rate borrowings which is evaluated regularly to align with interest rate views and risk profile. Details of the Group’s types and levels of debt are included in Note 23. Interest rate exposure The Group’s interest rate exposure together with the effective interest rate for each class of financial assets and financial liabilities at the reporting date is summarised as follows:
Consolidated
2014 2013
Floating Interest
Fixed Interest
Effective Interest
Rate Floating Interest
Fixed Interest
Effective Interest
Rate $M $M % $M $M %
Financial Assets Cash and cash equivalents 141 - 0.4 69 - 0.3 141 - 69 - Financial Liabilities Lease liabilities - - - 1 - 3.4 Bilateral debt 1,730 - 1.7 1,806 - 1.8 Corporate bonds - 2,123 4.7 - 2,156 4.7 Private placement - 244 5.7 - 248 5.7 1,730 2,367 1,807 2,404 (1,589) (2,367) (1,738) (2,404)
The other financial instruments of the Group not included in the above table are non-interest bearing and not subject to interest rate risk. Sensitivity analysis The sensitivity analysis below has been determined based on the exposure to interest rates for non-derivative instruments at the reporting date and the stipulated change taking place at the beginning of the financial year and held constant throughout the reporting period. A 100 basis point increase or decrease is used and represents management’s assessment of the reasonably possible change in interest rates over a financial year.
Impact on Profit Impact on Equity Post-tax gain/(loss) Higher / (Lower) Higher / (Lower) 2014 2013 2014 2013
$M $M $M $M
+1% (100 basis points) (11) (12) (11) (12) - 1% (100 basis points) 11 12 11 12

NOTES TO THE CONSOLIDATED FINANCIAL STATEMENTS FOR THE YEAR ENDED 30 JUNE 2014
Newcrest Mining Limited – Annual Financial Report – Year Ended 30 June 2014 E 79
32. Financial and Capital Risk Management (continued) (h) Fair Value Fair value of financial instruments carried at amortised cost Except as detailed in the following table, the carrying amounts of financial assets and financial liabilities recognised at amortised cost in the financial statements approximate their fair value. Carrying amount Fair value Financial Assets/(Liabilities) 2014 2013 2014 2013 $M $M $M $M Borrowings: Fixed rate debt: (1) - Private placement (244) (248) (254) (253) - Corporate Bonds (2,107) (2,156) (1,970) (1,770) (2,351) (2,404) (2,224) (2,023) (1) Amount recorded at amortised cost and the movements in the fair valuation are not recorded on the
Statement of Financial Position. The fair value is a level 2 valuation. Fair values of the Group’s fixed rate borrowings are determined by using discounted cash flow models that use discount rates that reflect the issuer’s borrowing rate as at the end of the reporting period.
Fair value measurements recognised in the Statement of Financial Position The following table provides an analysis of financial instruments that are measured subsequent to initial recognition at fair value, grouped into Levels 1 to 3 based on the degree to which the fair value is observable. Level 1 fair value measurements are those derived from quoted prices (unadjusted) in active markets for
identical assets or liabilities. Level 2 fair value measurements are those derived from inputs other than quoted prices included within
Level 1 that are observable for the asset or liability, either directly (as prices) or indirectly (derived from prices). Valuation inputs include forward curves, discount curves and underlying spot and futures prices.
Level 3 fair value measurements are those derived from valuation techniques that include inputs for the asset or liability that are not based on observable market data (unobservable inputs).
Level 1 Level 2 Level 3 Total Financial Assets/(Liabilities) $M $M $M $M 2014 Financial Assets Quotational period derivatives - 10 - 10 Other financial derivatives - 4 - 4 Other financial assets - - 10 10 Financial Liabilities Copper forward sales contracts - (7) - (7) Gold forward sales contracts - (3) - (3)
- 4 10 14 2013 Financial Assets Copper forward sales contracts - 16 - 16 Other financial derivatives - 2 - 2 Other financial assets - - 10 10 Financial Liabilities Quotational period derivatives - (68) - (68) Other financial derivatives - (3) - (3) - (53) 10 (43)

NOTES TO THE CONSOLIDATED FINANCIAL STATEMENTS FOR THE YEAR ENDED 30 JUNE 2014
Newcrest Mining Limited – Annual Financial Report – Year Ended 30 June 2014 E 80
33. Commitments 2014 2013 $M $M (a) Operating Lease Commitments
Future minimum rentals payable on non-cancellable operating leases due:
Within one year 3 4 Later than one year but not later than five years 10 2 Later than five years 3 - Total 16 6
The Group leases assets for operations including plant and office premises. The leases have an average life ranging from 1 to 10 years. There are no restrictions placed upon the lessee by entering into these leases.
(b) Capital Expenditure Commitments Capital expenditure commitments 143 105
NOTES TO THE CONSOLIDATED FINANCIAL STATEMENTS FOR THE YEAR ENDED 30 JUNE 2014
Newcrest Mining Limited – Annual Financial Report – Year Ended 30 June 2014 E 81
34. Contingent Liabilities a) Hidden Valley
Legal proceedings were commenced in December 2010 against the Hidden Valley mine unincorporated joint venture (in which Newcrest holds a 50% interest) in Papua New Guinea over alleged damage to the Watut River (which runs adjacent to the Hidden Valley gold mine) alleged to have been caused by waste rock and overburden run-off from the mine. The damages sought by the plaintiffs are not specified. The defendants intend to defend the claims. No active steps have been taken by the plaintiffs in this proceeding for more than two years. It is not practicable to make any reasonable assessment of the prospects of the plaintiffs succeeding if they proceed with these claims, nor the potential liability of the defendants if the plaintiffs were to succeed. Accordingly, no provision has been recognised in the financial statements for this matter.
b) Cadia Valley
A private exploration company, Gold & Copper Resources Pty Ltd (‘GCR’), has brought seven legal actions against Newcrest, each relating directly or indirectly to Newcrest’s exploration and mining interests and activities in the Cadia Valley (an increase on the five proceedings commenced in aggregate as at 30 June 2013). The NSW Minister responsible for mining (the “Minister”) is also a defendant in five of the proceedings. The most recent action, brought in the NSW Land and Environment Court (LEC), seeks to challenge Newcrest’s exploration licence 3856. EL3856 was the subject of GCR’s first legal action against Newcrest in the LEC which had resulted in the Court ordering the Minister to re-determine the last renewal of EL3856. The Minister re-determined EL3856 and it was renewed in January 2014. Newcrest is seeking to have this most recent legal action dismissed by the LEC. Of the seven legal actions commenced by GCR, three have been determined by the Court with no material impact on Newcrest and, in one instance, a substantial costs award in Newcrest’s favour (which GCR is challenging). One of the determined proceedings is the subject of appeal by GCR. Newcrest will continue to vigorously defend each of the undetermined proceedings. No provision has been recognised in the financial statements for the undetermined GCR legal claims.
c) Newcrest Mining Limited
As announced by the Company on 22 July 2014, Slater & Gordon Lawyers has commenced a representative proceeding (shareholder class action) in the Federal Court of Australia against Newcrest in relation to Newcrest’s market disclosure prior to its 7 June 2013 market release. The proceeding is brought on behalf of persons who acquired Newcrest shares between 13 August 2012 and 6 June 2013. The proceeding raises issues beyond the subject matter of the ASIC settlement referred to in Newcrest’s 18 June 2014 announcement. Newcrest has announced that it intends to vigorously defend the proceeding. The Court documents do not quantify the damages that the claimants will seek in the proceeding for all or any part of the claim period. Accordingly, Newcrest does not consider that there is a reasonable basis on which to estimate any potential liability, and, therefore, no provision has been recognised in the financial statements. Newcrest has previously noted public statements by Maurice Blackburn Lawyers that it was considering a class action in relation to matters arising from or in connection with the Company’s 7 June 2013 market release. Newcrest has not been contacted by Maurice Blackburn Lawyers, and it is not known if any other plaintiff firm is considering further class action proceedings.
d) Bonikro
The Côte d’Ivoire customs authority has recently completed an audit of LGL Mines CI SA, which is owned 89.89% by the Group. Arising from the audit, the authority has raised concerns regarding foreign exchange in the context of the offshore refining arrangements for the Bonikro mine in respect of the 2010, 2011 and 2012 calendar years. Pending commencement of the formal assessment process by relevant authorities, no provision has been made as at 30 June 2014. The Company intends to oppose any adverse assessment.
NOTES TO THE CONSOLIDATED FINANCIAL STATEMENTS FOR THE YEAR ENDED 30 JUNE 2014
Newcrest Mining Limited – Annual Financial Report – Year Ended 30 June 2014 E 82
34. Contingent Liabilities (continued)
e) Income Tax Matters – Australia
On 17 October 2013 the Company announced that it was voluntarily amending its research and development claims during the 2009-2011 period, following the Company’s further consideration and analysis of its past claims and the outcomes of recent tribunal decisions in relation to research and development claims by other companies. As a result of that voluntary amendment, the Company has recognised a decrease in past income tax benefits of approximately $120 million in the current year (refer to Note 6). Research and development claims made by the Company during the 2005-2011 financial years are the subject of ongoing review by the Australian Taxation Office and Innovation Australia. The income tax benefit recognised by the Company in past financial years for the Company’s remaining research and development claims, net of the voluntary amendment, is approximately $115 million. If an adverse finding were made in relation to the Company’s remaining research and development claims it may result in adjustments to income tax liabilities and the income tax benefits realised in past financial years.
f) Income Tax Matters – Indonesia
During the current period the Indonesian Tax Office (‘ITO’) completed a tax audit of PT Nusa Halmahera Minerals (‘PT NHM’) for the 2010 financial year. PT NHM is 75% owned by Newcrest. The principal issue raised was the income tax rate applicable under the Gosowong Contract of Work (‘COW’). The assessment issued by the ITO to PT NHM applied a higher tax rate in accordance with the ITO interpretation. This resulted in an additional tax assessment of US$8 million. Notwithstanding PT NHM’s disagreement with this assessment, the company paid the assessment to mitigate future penalties. PT NHM has objected to this assessment and is seeking recovery of this payment. The ITO is also conducting tax audits covering the 2011 and 2013 financial years. For the 2011 to 2014 financial years, PT NHM has applied its interpretation of the income tax rate applicable under the COW. If, following the audit, the ITO issues an assessment maintaining its alternative interpretation of the applicable tax rate, the additional tax assessed would be approximately US$77 million (inclusive of interest) on a 100% basis. The Group considers that PT NHM has made adequate provision for its taxation liabilities and is taking appropriate steps to address issues raised by the ITO. There would be a tax impact if any of the ITO audits result in an adjustment that ultimately increases PT NHM’s taxation liabilities.
g) Other Matters
In addition to the above matters, companies in the Group are recipients of, or defendants in, certain claims, proceedings and/or complaints made, commenced or threatened. In the opinion of the Directors, all such matters are of such a kind, or involve such amounts, that they are not anticipated to have a material effect on the financial position of the Group if disposed of unfavourably, or are at a stage which does not support a reasonable evaluation of the likely outcome of the matter.
h) Bank Guarantees
The Group has negotiated a number of bank guarantees in favour of various government authorities and service providers. The total nominal amount of these guarantees at the reporting date is $183 million (2013: $176 million).
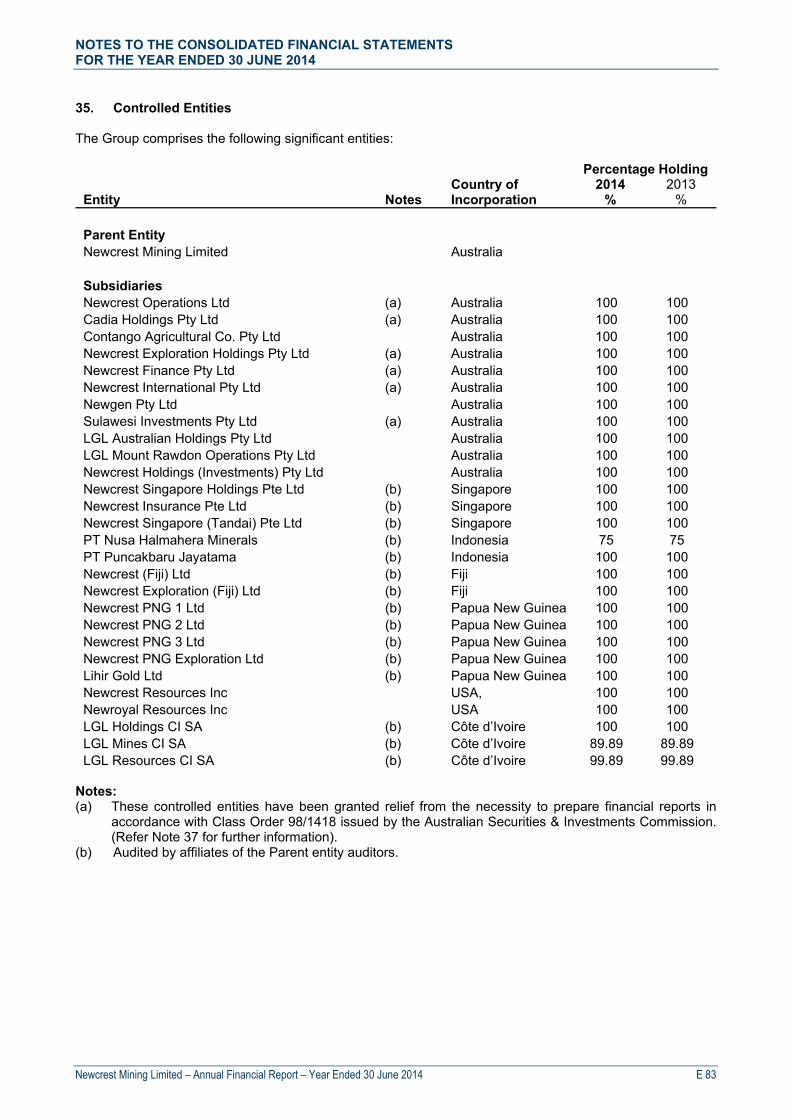
NOTES TO THE CONSOLIDATED FINANCIAL STATEMENTS FOR THE YEAR ENDED 30 JUNE 2014
Newcrest Mining Limited – Annual Financial Report – Year Ended 30 June 2014 E 83
35. Controlled Entities The Group comprises the following significant entities:
Percentage Holding
Entity Notes
Country of Incorporation
2014 %
2013 %
Parent Entity Newcrest Mining Limited Australia Subsidiaries Newcrest Operations Ltd (a) Australia 100 100 Cadia Holdings Pty Ltd (a) Australia 100 100 Contango Agricultural Co. Pty Ltd Australia 100 100 Newcrest Exploration Holdings Pty Ltd (a) Australia 100 100 Newcrest Finance Pty Ltd (a) Australia 100 100 Newcrest International Pty Ltd (a) Australia 100 100 Newgen Pty Ltd Australia 100 100 Sulawesi Investments Pty Ltd (a) Australia 100 100 LGL Australian Holdings Pty Ltd Australia 100 100 LGL Mount Rawdon Operations Pty Ltd Australia 100 100 Newcrest Holdings (Investments) Pty Ltd Australia 100 100 Newcrest Singapore Holdings Pte Ltd (b) Singapore 100 100 Newcrest Insurance Pte Ltd (b) Singapore 100 100 Newcrest Singapore (Tandai) Pte Ltd (b) Singapore 100 100 PT Nusa Halmahera Minerals (b) Indonesia 75 75 PT Puncakbaru Jayatama (b) Indonesia 100 100 Newcrest (Fiji) Ltd (b) Fiji 100 100 Newcrest Exploration (Fiji) Ltd (b) Fiji 100 100 Newcrest PNG 1 Ltd (b) Papua New Guinea 100 100 Newcrest PNG 2 Ltd (b) Papua New Guinea 100 100 Newcrest PNG 3 Ltd (b) Papua New Guinea 100 100 Newcrest PNG Exploration Ltd (b) Papua New Guinea 100 100 Lihir Gold Ltd (b) Papua New Guinea 100 100 Newcrest Resources Inc USA, 100 100 Newroyal Resources Inc USA 100 100 LGL Holdings CI SA (b) Côte d’Ivoire 100 100 LGL Mines CI SA (b) Côte d’Ivoire 89.89 89.89 LGL Resources CI SA (b) Côte d’Ivoire 99.89 99.89
Notes: (a) These controlled entities have been granted relief from the necessity to prepare financial reports in
accordance with Class Order 98/1418 issued by the Australian Securities & Investments Commission. (Refer Note 37 for further information).
(b) Audited by affiliates of the Parent entity auditors.

NOTES TO THE CONSOLIDATED FINANCIAL STATEMENTS FOR THE YEAR ENDED 30 JUNE 2014
Newcrest Mining Limited – Annual Financial Report – Year Ended 30 June 2014 E 84
36. Parent Entity Information The summarised Income Statement and Statement of Financial Position in respect to the parent entity (‘Company’) is set out below.
Company 2014 2013 Restated $M $M a) Income Statement Loss after income tax (2,551) (4,183) Total comprehensive loss for the year (2,551) (4,183) b) Statement of Financial Position Current assets 127 348 Non-current assets 6,838 9,239 Total assets 6,965 9,587 Current liabilities 110 198 Non-current liabilities 98 91 Total liabilities 208 289 Net assets 6,757 9,298 Issued capital 13,593 13,592 Equity settlements reserve 71 62 Retained earnings/(accumulated losses): Opening balance (4,356) 95 Loss after tax (2,551) (4,183) Dividends paid - (268) Closing balance (6,907) (4,356) Total equity 6,757 9,298 c) Commitments Capital expenditure commitments 9 12 d) Guarantees and Contingent Liabilities
The Company and certain Australian controlled entities have entered into a Deed of Cross Guarantee. The effect of the Deed is that the Company guarantees to each creditor payment in full of any debt in the event of winding up of any of the controlled entities under certain provisions of the Corporations Act 2001. Further details are included in Note 37. At the reporting date, no amounts have been recognised in the financial information of the Company in respect of this Deed on the basis that the possibility of default is remote.
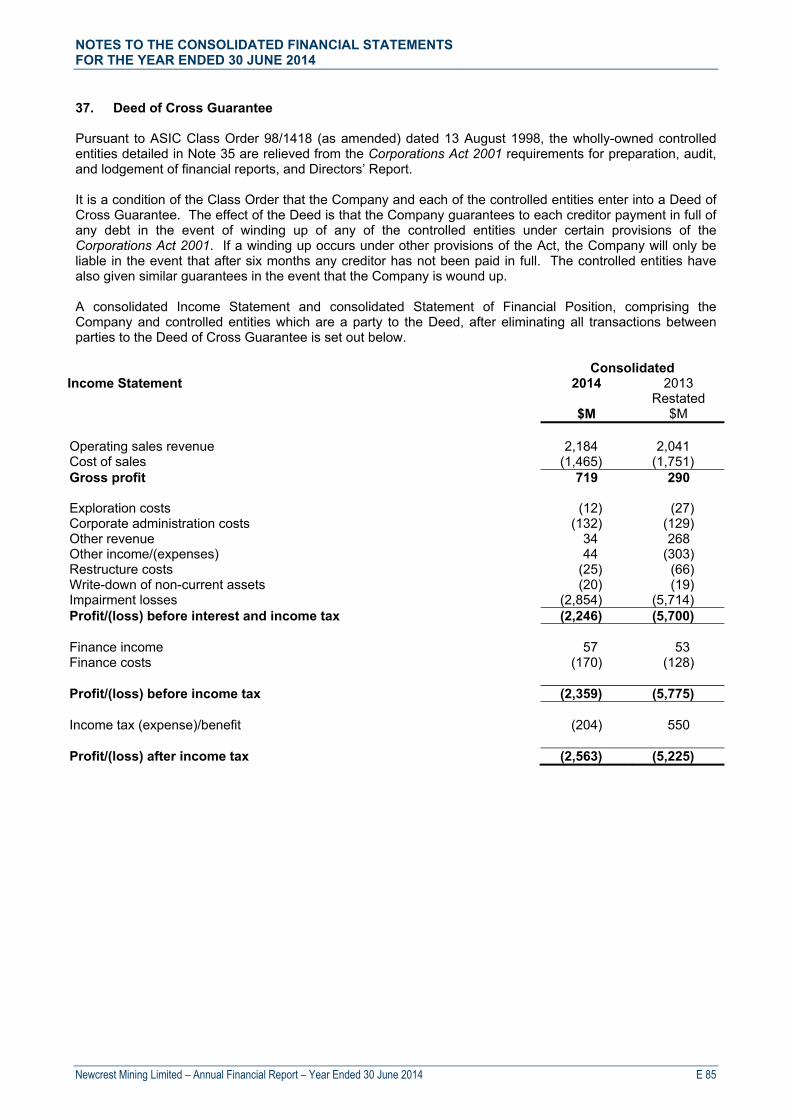
NOTES TO THE CONSOLIDATED FINANCIAL STATEMENTS FOR THE YEAR ENDED 30 JUNE 2014
Newcrest Mining Limited – Annual Financial Report – Year Ended 30 June 2014 E 85
37. Deed of Cross Guarantee Pursuant to ASIC Class Order 98/1418 (as amended) dated 13 August 1998, the wholly-owned controlled entities detailed in Note 35 are relieved from the Corporations Act 2001 requirements for preparation, audit, and lodgement of financial reports, and Directors’ Report. It is a condition of the Class Order that the Company and each of the controlled entities enter into a Deed of Cross Guarantee. The effect of the Deed is that the Company guarantees to each creditor payment in full of any debt in the event of winding up of any of the controlled entities under certain provisions of the Corporations Act 2001. If a winding up occurs under other provisions of the Act, the Company will only be liable in the event that after six months any creditor has not been paid in full. The controlled entities have also given similar guarantees in the event that the Company is wound up. A consolidated Income Statement and consolidated Statement of Financial Position, comprising the Company and controlled entities which are a party to the Deed, after eliminating all transactions between parties to the Deed of Cross Guarantee is set out below. Consolidated
Income Statement 2014 2013 Restated $M $M Operating sales revenue 2,184 2,041 Cost of sales (1,465) (1,751) Gross profit 719 290 Exploration costs (12) (27) Corporate administration costs (132) (129) Other revenue 34 268 Other income/(expenses) 44 (303) Restructure costs (25) (66) Write-down of non-current assets (20) (19) Impairment losses (2,854) (5,714) Profit/(loss) before interest and income tax (2,246) (5,700) Finance income 57 53 Finance costs (170) (128) Profit/(loss) before income tax (2,359) (5,775) Income tax (expense)/benefit (204) 550 Profit/(loss) after income tax (2,563) (5,225)

NOTES TO THE CONSOLIDATED FINANCIAL STATEMENTS FOR THE YEAR ENDED 30 JUNE 2014
Newcrest Mining Limited – Annual Financial Report – Year Ended 30 June 2014 E 86
37. Deed of Cross Guarantee (continued) Consolidated Statement of Financial Position 2014 2013 Restated $M $M Current assets Cash and cash equivalents 15 8 Trade and other receivables 235 287 Inventories 216 263 Other financial assets 14 18 Other assets 33 58 Total current assets 513 634 Non-current assets Other receivables 1,449 2,222 Inventories 12 12 Investment in subsidiaries 5,102 6,882 Property, plant and equipment 1,910 1,943 Exploration, evaluation and development 2,763 2,759 Other intangible assets 49 70 Deferred tax assets 286 326 Other financial assets - - Other assets 9 4 Total non-current assets 11,580 14,218 Total assets 12,093 14,852 Current liabilities Trade and other payables 176 292 Borrowings 112 - Provisions 117 113 Other financial liabilities 10 71 Total current liabilities 415 476 Non-current liabilities Borrowings 3,964 4,210 Provisions 190 191 Deferred tax liabilities 124 40 Total non-current liabilities 4,278 4,441 Total liabilities 4,693 4,917 Net assets 7,400 9,935 Equity Issued capital 13,593 13,592 Retained earnings/(accumulated losses) (6,176) (3,613) Reserves (17) (44) Total equity 7,400 9,935
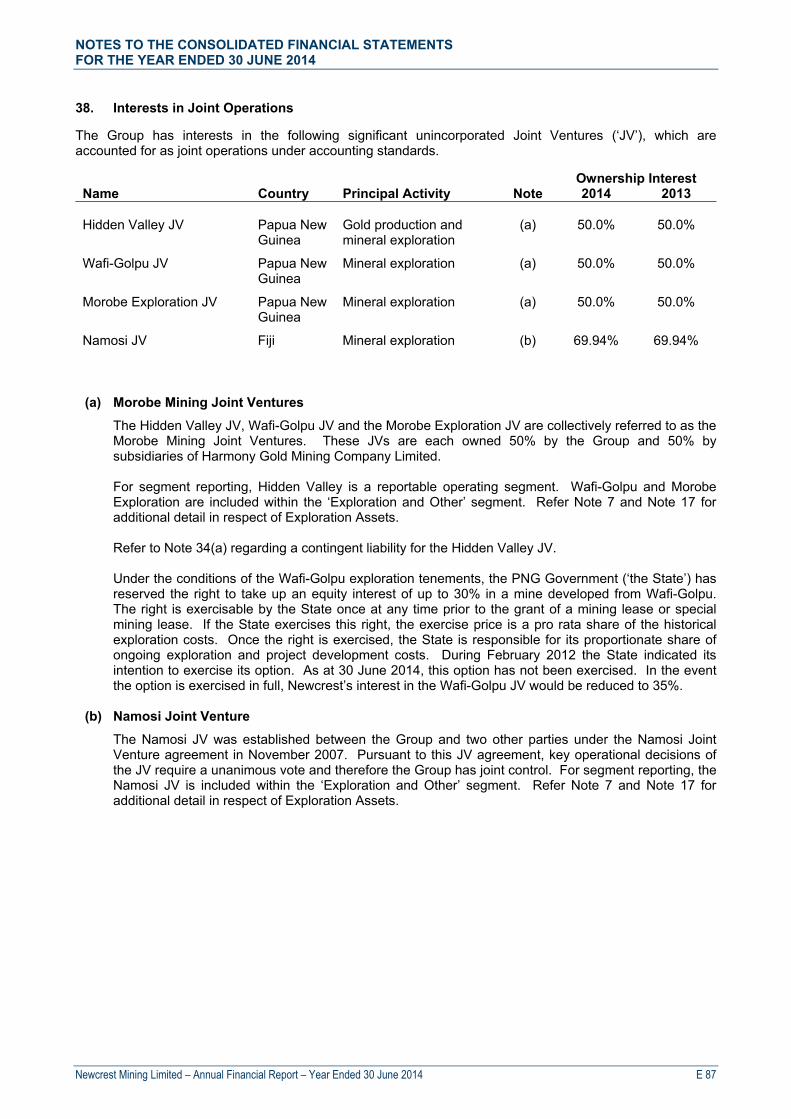
NOTES TO THE CONSOLIDATED FINANCIAL STATEMENTS FOR THE YEAR ENDED 30 JUNE 2014
Newcrest Mining Limited – Annual Financial Report – Year Ended 30 June 2014 E 87
38. Interests in Joint Operations The Group has interests in the following significant unincorporated Joint Ventures (‘JV’), which are accounted for as joint operations under accounting standards.
Name
Country
Principal Activity
Ownership Interest Note 2014 2013
Hidden Valley JV Papua New
Guinea Gold production and mineral exploration
(a) 50.0% 50.0%
Wafi-Golpu JV Papua New Guinea
Mineral exploration (a) 50.0% 50.0%
Morobe Exploration JV Papua New Guinea
Mineral exploration (a) 50.0% 50.0%
Namosi JV Fiji Mineral exploration (b) 69.94% 69.94%
(a) Morobe Mining Joint Ventures
The Hidden Valley JV, Wafi-Golpu JV and the Morobe Exploration JV are collectively referred to as the Morobe Mining Joint Ventures. These JVs are each owned 50% by the Group and 50% by subsidiaries of Harmony Gold Mining Company Limited. For segment reporting, Hidden Valley is a reportable operating segment. Wafi-Golpu and Morobe Exploration are included within the ‘Exploration and Other’ segment. Refer Note 7 and Note 17 for additional detail in respect of Exploration Assets. Refer to Note 34(a) regarding a contingent liability for the Hidden Valley JV. Under the conditions of the Wafi-Golpu exploration tenements, the PNG Government (‘the State’) has reserved the right to take up an equity interest of up to 30% in a mine developed from Wafi-Golpu. The right is exercisable by the State once at any time prior to the grant of a mining lease or special mining lease. If the State exercises this right, the exercise price is a pro rata share of the historical exploration costs. Once the right is exercised, the State is responsible for its proportionate share of ongoing exploration and project development costs. During February 2012 the State indicated its intention to exercise its option. As at 30 June 2014, this option has not been exercised. In the event the option is exercised in full, Newcrest’s interest in the Wafi-Golpu JV would be reduced to 35%.
(b) Namosi Joint Venture
The Namosi JV was established between the Group and two other parties under the Namosi Joint Venture agreement in November 2007. Pursuant to this JV agreement, key operational decisions of the JV require a unanimous vote and therefore the Group has joint control. For segment reporting, the Namosi JV is included within the ‘Exploration and Other’ segment. Refer Note 7 and Note 17 for additional detail in respect of Exploration Assets.
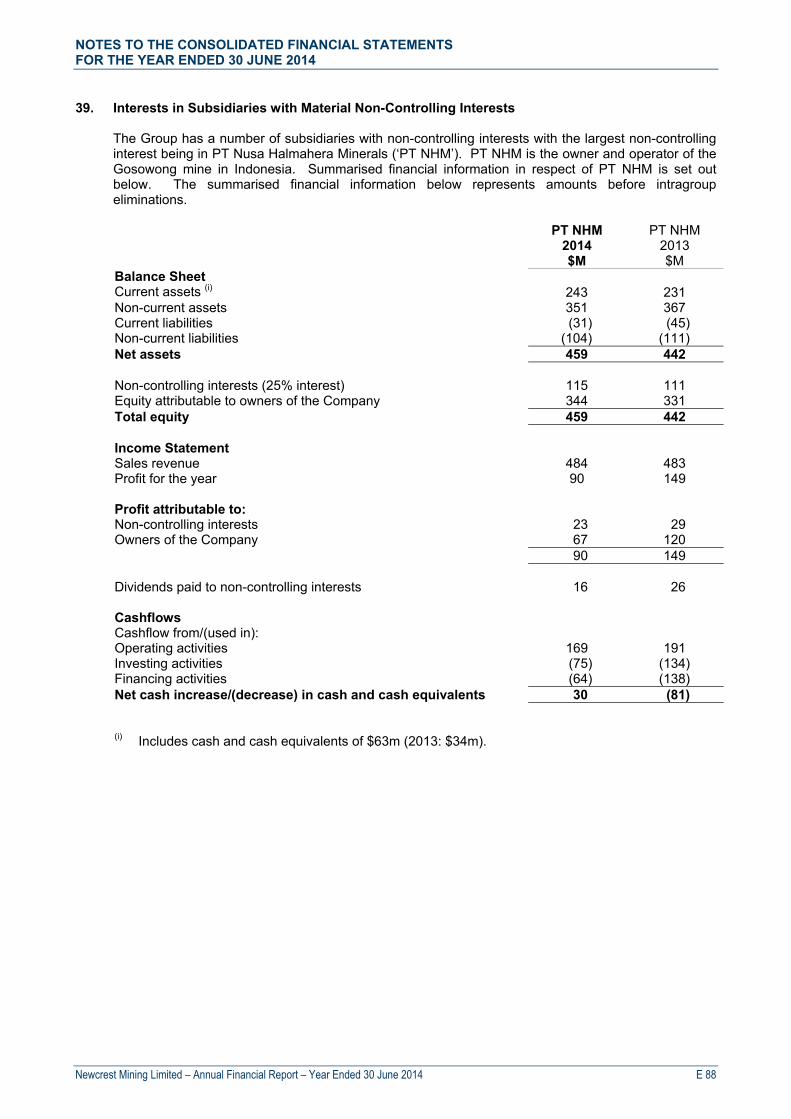
NOTES TO THE CONSOLIDATED FINANCIAL STATEMENTS FOR THE YEAR ENDED 30 JUNE 2014
Newcrest Mining Limited – Annual Financial Report – Year Ended 30 June 2014 E 88
39. Interests in Subsidiaries with Material Non-Controlling Interests
The Group has a number of subsidiaries with non-controlling interests with the largest non-controlling interest being in PT Nusa Halmahera Minerals (‘PT NHM’). PT NHM is the owner and operator of the Gosowong mine in Indonesia. Summarised financial information in respect of PT NHM is set out below. The summarised financial information below represents amounts before intragroup eliminations.
PT NHM PT NHM 2014 2013 $M $M Balance Sheet Current assets (i) 243 231 Non-current assets 351 367 Current liabilities (31) (45) Non-current liabilities (104) (111) Net assets 459 442 Non-controlling interests (25% interest) 115 111 Equity attributable to owners of the Company 344 331 Total equity 459 442 Income Statement Sales revenue 484 483 Profit for the year 90 149 Profit attributable to: Non-controlling interests 23 29 Owners of the Company 67 120 90 149 Dividends paid to non-controlling interests 16 26 Cashflows Cashflow from/(used in): Operating activities 169 191 Investing activities (75) (134) Financing activities (64) (138) Net cash increase/(decrease) in cash and cash equivalents 30 (81) (i) Includes cash and cash equivalents of $63m (2013: $34m).
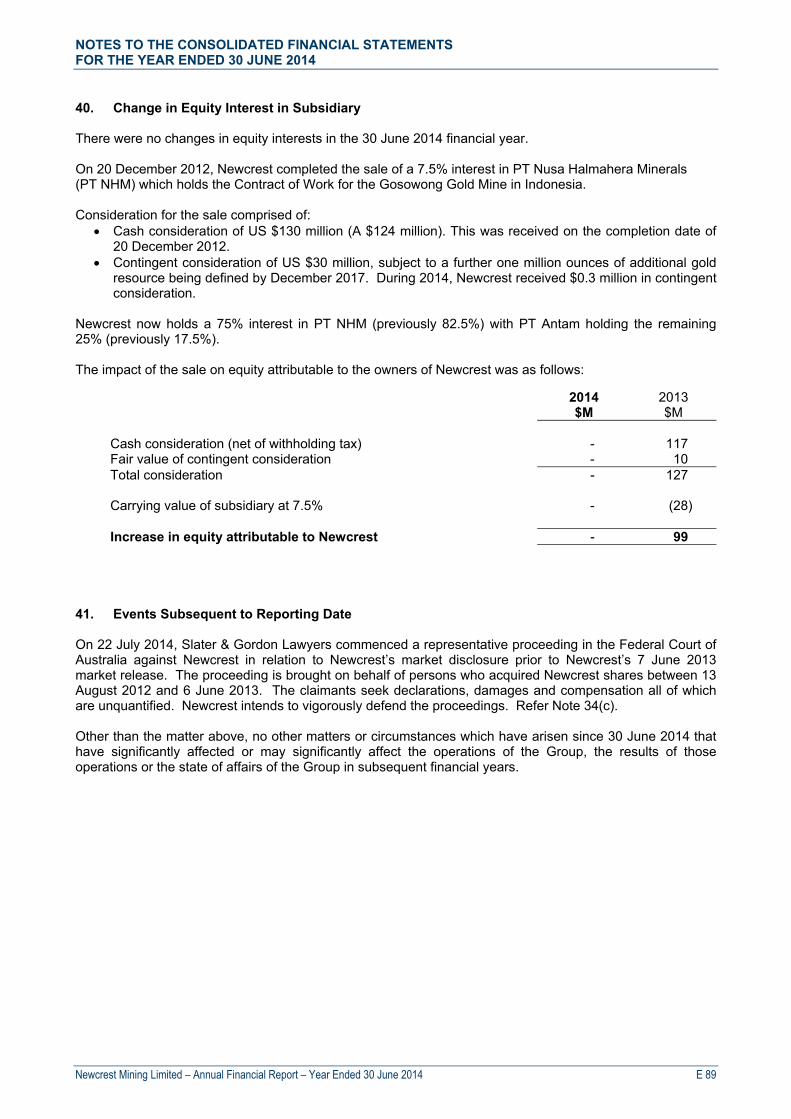
NOTES TO THE CONSOLIDATED FINANCIAL STATEMENTS FOR THE YEAR ENDED 30 JUNE 2014
Newcrest Mining Limited – Annual Financial Report – Year Ended 30 June 2014 E 89
40. Change in Equity Interest in Subsidiary There were no changes in equity interests in the 30 June 2014 financial year. On 20 December 2012, Newcrest completed the sale of a 7.5% interest in PT Nusa Halmahera Minerals (PT NHM) which holds the Contract of Work for the Gosowong Gold Mine in Indonesia. Consideration for the sale comprised of:
Cash consideration of US $130 million (A $124 million). This was received on the completion date of 20 December 2012.
Contingent consideration of US $30 million, subject to a further one million ounces of additional gold resource being defined by December 2017. During 2014, Newcrest received $0.3 million in contingent consideration.
Newcrest now holds a 75% interest in PT NHM (previously 82.5%) with PT Antam holding the remaining 25% (previously 17.5%). The impact of the sale on equity attributable to the owners of Newcrest was as follows:
2014 2013 $M $M Cash consideration (net of withholding tax) - 117 Fair value of contingent consideration - 10 Total consideration - 127 Carrying value of subsidiary at 7.5% - (28) Increase in equity attributable to Newcrest - 99 41. Events Subsequent to Reporting Date On 22 July 2014, Slater & Gordon Lawyers commenced a representative proceeding in the Federal Court of Australia against Newcrest in relation to Newcrest’s market disclosure prior to Newcrest’s 7 June 2013 market release. The proceeding is brought on behalf of persons who acquired Newcrest shares between 13 August 2012 and 6 June 2013. The claimants seek declarations, damages and compensation all of which are unquantified. Newcrest intends to vigorously defend the proceedings. Refer Note 34(c). Other than the matter above, no other matters or circumstances which have arisen since 30 June 2014 that have significantly affected or may significantly affect the operations of the Group, the results of those operations or the state of affairs of the Group in subsequent financial years.


A member firm of Ernst & Young Global LimitedLiability limited by a scheme approved under Professional Standards Legislation
Ernst & Young8 Exhibition StreetMelbourne VIC 3000 AustraliaGPO Box 67 Melbourne VIC 3001
Tel: +61 3 9288 8000Fax: +61 3 8650 7777ey.com/au
Independent auditor's report to the members of Newcrest Mining Limited
Report on the financial report
We have audited the accompanying financial report of Newcrest Mining Limited, which comprises theconsolidated statement of financial position as at 30 June 2014, the consolidated income statement, theconsolidated statement of comprehensive income, the consolidated statement of changes in equity andthe consolidated statement of cash flows for the year then ended, notes comprising a summary ofsignificant accounting policies and other explanatory information, and the directors' declaration of theconsolidated entity comprising the company and the entities it controlled at the year's end or from timeto time during the financial year.
Directors' responsibility for the financial report
The directors of the company are responsible for the preparation of the financial report that gives a trueand fair view in accordance with Australian Accounting Standards and the Corporations Act 2001 and forsuch internal controls as the directors determine are necessary to enable the preparation of the financialreport that is free from material misstatement, whether due to fraud or error. In Note 2, the directorsalso state, in accordance with Accounting Standard AASB 101 Presentation of Financial Statements, thatthe financial statements comply with International Financial Reporting Standards.
Auditor's responsibility
Our responsibility is to express an opinion on the financial report based on our audit. We conducted ouraudit in accordance with Australian Auditing Standards. Those standards require that we comply withrelevant ethical requirements relating to audit engagements and plan and perform the audit to obtainreasonable assurance about whether the financial report is free from material misstatement.
An audit involves performing procedures to obtain audit evidence about the amounts and disclosures inthe financial report. The procedures selected depend on the auditor's judgment, including the assessmentof the risks of material misstatement of the financial report, whether due to fraud or error. In makingthose risk assessments, the auditor considers internal controls relevant to the entity's preparation andfair presentation of the financial report in order to design audit procedures that are appropriate in thecircumstances, but not for the purpose of expressing an opinion on the effectiveness of the entity'sinternal controls. An audit also includes evaluating the appropriateness of accounting policies used andthe reasonableness of accounting estimates made by the directors, as well as evaluating the overallpresentation of the financial report.
We believe that the audit evidence we have obtained is sufficient and appropriate to provide a basis forour audit opinion.
Independence
In conducting our audit we have complied with the independence requirements of the Corporations Act2001. We have given to the directors of the company a written Auditor’s Independence Declaration, acopy of which is included in the directors’ report.
A member firm of Ernst & Young Global LimitedLiability limited by a scheme approved under Professional Standards Legislation
OpinionIn our opinion:
a. the financial report of Newcrest Mining Limited is in accordance with the Corporations Act 2001,including:
i giving a true and fair view of the consolidated entity's financial position as at 30 June 2014 andof its performance for the year ended on that date; and
ii complying with Australian Accounting Standards and the Corporations Regulations 2001; and
b. the financial report also complies with International Financial Reporting Standards as disclosed inNote 2.
Report on the remuneration report
We have audited the Remuneration Report included in the Directors' Report for the year ended30 June 2014. The directors of the company are responsible for the preparation and presentation of theRemuneration Report in accordance with section 300A of the Corporations Act 2001. Our responsibility isto express an opinion on the Remuneration Report, based on our audit conducted in accordance withAustralian Auditing Standards.
OpinionIn our opinion, the Remuneration Report of Newcrest Mining Limited for the year ended 30 June 2014,complies with section 300A of the Corporations Act 2001.
Ernst & Young
Tim WallacePartner
Michael CollinsPartner
Melbourne18 August 2014