asx announcement woodside petroleum ltd.full+year... · asx announcement wednesday, 14 february...
TRANSCRIPT

ASX Announcement Wednesday, 14 February 2018 ASX: WPL OTC: WOPEY
Page 1 of 2
Woodside Petroleum Ltd.
ACN 004 898 962
Woodside Plaza
240 St Georges Terrace
Perth WA 6000
Australia
T +61 8 9348 4000
www.woodside.com.au
WOODSIDE FULL-YEAR PROFIT UP 18% TO $1,024 MILLION
AND INCREASED INTEREST IN SCARBOROUGH GAS FIELD
Woodside has recorded a full-year reported net profit after tax (NPAT) of $1,024 million. Production was 84.4 MMboe and sales revenue was $3.62 billion. The directors have declared a final dividend of US 49 cents per share (cps), bringing the full-year dividend to US 98 cps. Woodside CEO Peter Coleman said that 2017 had been a good year for the company, with strong financial results and progress on projects and activities across each of the three time horizons that underpin Woodside’s strategy. “Our net profit after tax has increased by 18% year-on-year, driven by higher prices for our products and sustained low production costs. At the same time, we were able to maintain our outstanding safety performance and our three FPSO facilities achieved a record average reliability of 95%. “The company generated free cash flow of $832 million, while maintaining investment in growth projects and developments. “The safe start-up of Wheatstone LNG Train 1 was a significant milestone for the company and we look forward to the delivery of LNG Train 2 and the domestic gas facility this year while supporting the operator to optimise lifting costs and maximise production rates.” Woodside also advises that it has entered into a binding Sale and Purchase Agreement (SPA) to acquire ExxonMobil’s share of the Scarborough gas field located in the Carnarvon Basin, offshore Western Australia. Under the terms of the SPA, Woodside will acquire from ExxonMobil an additional 50% interest in WA-1-R which contains the majority of the Scarborough gas field. Upon completion of the transaction Woodside will have a 75% interest in WA-1-R and a 50% interest in WA-61-R, WA-62-R and WA-63-R. Completion is subject to pre-emption rights and customary regulatory approvals, and is targeted by end Q1 2018. Peter Coleman said the Scarborough acquisition delivered greater alignment, control and certainty for the project while also unlocking shareholder value. “Our Burrup Hub concept is advanced by our announcement today of an increased stake in the Scarborough gas field. The development concept involves maximising existing infrastructure at the Pluto LNG plant to meet a market gap we expect will emerge from the early 2020s.” In reviewing other achievements, Peter Coleman said he was pleased with the progress. “We concluded feasibility studies on Pluto LNG expansion and made considerable progress on commercial discussions between the North West Shelf and Browse joint ventures for processing Browse gas through the Karratha Gas Plant. “In Senegal, we achieved concept select for the first phase of the SNE Development. In 2018, we will transition to operator and target entering front-end engineering and design.

Page 2 of 2
“In 2017, we made a third gas discovery in Myanmar and completed our drilling program in Senegal ahead of schedule and under budget while adding acreage in Myanmar, Gabon and Australia. “In addition to executing a long-term LNG supply agreement with Indonesian company Pertamina, we also executed portfolio LNG sales for up to two million tonnes per annum over the period 2017 to 2020, reinforcing our position as a significant supplier of LNG to the Asia-Pacific region. “As the oil price continues to improve and we progress our business priorities, we are well positioned to unlock shareholder value,” he said.
Financial headlines
Reported higher full-year NPAT of $1,024 million.
Maintained low unit production cost of $5.2/boe.
Increased average realised price to $44/boe.
Delivered net cash from operating activities of $2,400 million.
Generated free cash flow of $832 million while investing in growth.
Competitive cost of debt of 3.7%.
Declared a final dividend of US 49 cps, bringing the full-year dividend to US 98 cps.
Key business activities
Improved safety performance with lowest-ever total recordable injury rate.
No Tier 1 or Tier 2 process safety events.
Commenced Wheatstone LNG production and delivered first LNG cargo.
Achieved concept select for SNE Development–Phase 1, offshore Senegal.
Increased Pluto LNG plant capacity resulting in record daily, weekly and monthly production rates.
Delivered the $1 billion Persephone project 30% under budget and six months ahead of schedule.
Achieved reliability across the FPSO fleet of over 95%.
Executed a long-term LNG supply agreement with Pertamina.
Executed portfolio LNG sales for up to 2 mt (equivalent to 28 cargoes) over the period 2017 to 2020.
Concluded feasibility studies on Pluto LNG expansion, broadening options for capacity enhancement.
Approved development of an LNG truck-loading facility at Pluto LNG.
Issued an $800 million, 10.5 year bond with a coupon of 3.7% p.a.
Progressed commercial discussions and joint technical feasibility studies for processing Browse resources through NWS infrastructure.
Subsequent to the period we announced the agreement to acquire ExxonMobil’s interest in WA-1-R containing the Scarborough gas field.
Full-year results teleconference A teleconference providing an overview of the full-year 2017 results and a question and answer session will be held at 7.30am AWST (10.30 am AEST) on 14 February 2018. Investors are encouraged to participate in this event by dialling the numbers listed below and quoting passcode ID: 979 5804. For locations within Australia dial toll-free 1800 123 296, or toll 02 8038 5221. International dial-in numbers (toll-free): Canada 1855 5616 766 China 4001 203 085 Hong Kong 800 908 865 India 1800 3010 6141 Japan 0120 477 087 New Zealand 0800 452 782 Singapore 800 616 2288 United Kingdom 0808 234 0757 The full-year results briefing pack follows this announcement and will be referred to during the conference call.
Contacts:
INVESTORS
Damien Gare
W: +61 8 9348 4421 M: +61 417 111 697 E: [email protected]
MEDIA
Michelle Grady
W: +61 8 9348 5995 M: +61 418 938 660 E: [email protected]

14 February 2018
FULL-YEAR 2017 RESULTS BRIEFING

This presentation contains forward looking statements that are subject to risk factors associated with oil and gasbusinesses. It is believed that the expectations reflected in these statements are reasonable as at the date of thispresentation but they may be affected by a variety of variables and changes in underlying assumptions which couldcause actual results or trends to differ materially, including but not limited to: price fluctuations, actual demand,currency fluctuations, drilling and production results, reserve estimates, loss of market, industry competition,environmental risks, physical risks, legislative, fiscal and regulatory developments, changes in accounting standards,economic and financial market conditions in various countries and regions, political risks, project delay or advancement,approvals and cost estimates. Readers are cautioned not to place undue reliance on these forward looking statements.No representation is made or will be made that any forward looking statements will be achieved or will prove to becorrect. We do not undertake to update or revise any forward looking statement, whether as a result of newinformation, future events or otherwise.
References to a year are to the calendar and financial year ended 31 December 2017 unless otherwise stated.
All references to dollars, cents or $ in this presentation are to US currency, unless otherwise stated.
References to “Woodside” may be references to Woodside Petroleum Ltd or its applicable subsidiaries.
Disclaimer and important notice
14 February 2018 2Full Year Results |

Financial headlines
1. Comparisons are to the full-year period ended 31 December 2016.
2. US cents per share.3. Reduces to $5.0/boe excluding the
impact of Wheatstone LNG and NWS pipeline gas.
4. Dated Brent price at which cash flow from 2017 operating activities would have equalled 2017 cash flow from investing activities (pre-dividend).
Profit: Change1
Net profit after tax $1,024 million 18%
Full-year dividend 98 cps2 18%
Cashflow:
Operating cash flow $2,400 million 7%
Free cash flow $832 million 630%
Portfolio unit production costs $5.2/boe3 4%
Free cash flow breakeven4 $36/bbl
Balance Sheet:
Liquidity $2,942 million 10%
Gearing 24%
OVERVIEW
14 February 2018 3Full Year Results |

Safety and environment Safety
+ 21% reduction in TRIR
+ No process safety events
+ Integrating data analytics
+ Outperforming similar industries
Environment
+ Committed to 5% energy efficiency improvement by end 2020
+ Installing battery for back-up power on Goodwyn-A
OVERVIEW
1. Per million hours worked. Five year average (2012-2016). WA Mining Data for 2017 is not yet available.
2. Source: Government of Western Australia, Department of Mines, Industry Regulation and Safety, WorkSafe: ‘Mining Industry Profile (ANZSIC 2006) – Work Related Lost time Injuries and Diseases in WA 2011-12 to 2015-16p’, Table 3, Page 4.
Personal safetyTotal recordable injury rate (TRIR)
0
1
2
3
4
2013 2014 2015 2016 2017TR
IR p
er m
illio
n ho
urs
wor
ked
0
1
2
3
4
5
2013 2014 2015 2016 2017
Num
ber o
f eve
nts
Tier 1 Tier 2
Nil
Process safety
Lost time injury and disease frequency1
0.59Woodside
5.71WA mining2
14 February 2018 4Full Year Results |

Achievements
1. Annualised loadable LNG production rate (100% project).
2. Subsequent to year-end 2017.
Base business
+ Record Q4 Pluto LNG production; equivalent to 5.1 mtpa1
+ 95% FPSO reliability + Delivered Persephone 30% under budget and six months
ahead of schedule
Building market
+ Long-term LNG supply agreement with Pertaminacommencing in 2019 for up to 1.1 Mtpa
+ Portfolio LNG sales for up to 2 Mt (2017-2020)+ Approved development of LNG truck-loading facility
Financial strength+ Issued $800 million 10.5 year bond at 3.7% coupon+ $10/boe breakeven cash cost of sales
Delivering value growth
+ Commenced Wheatstone LNG production+ Achieved concept select for SNE–Phase 1+ Agreed to acquire increased Scarborough interest2
+ Progressing Browse to NWS commercial discussions
OVERVIEW
14 February 2018 5Full Year Results |

Delivering committed growth
OVERVIEW
1. Based on existing business and current schedules of Wheatstone LNG, Greater Western Flank-2 and Greater Enfield.
Wheatstone:+ Commenced production from Train 1 and achieved full production
rates + Targeting start-up of Train 2 Q2 2018 and domestic gas Q3 2018+ Expected to deliver over 13 MMboe in 2020
Targeting ~100 MMboe annual production in 20201
NWS subsea tiebacks:+ Delivered Persephone under budget and schedule + Greater Western Flank-2 drilling activities completed+ Expected to contribute over 10 MMboe in 2020
Greater Enfield:+ Drilling campaign and subsea installation to commence Q1 2018+ On schedule for first oil mid-2019+ Expected to deliver over 10 MMboe in 2020
14 February 2018 6Full Year Results |
OVERVIEW
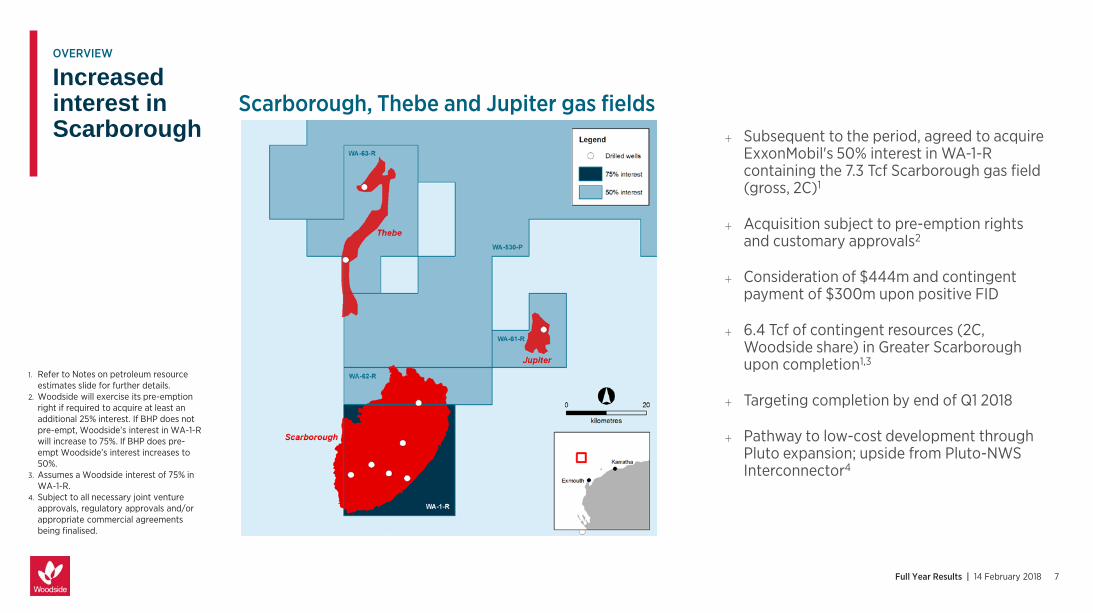
Increased interest in Scarborough + Subsequent to the period, agreed to acquire
ExxonMobil's 50% interest in WA-1-Rcontaining the 7.3 Tcf Scarborough gas field (gross, 2C)1
+ Acquisition subject to pre-emption rights and customary approvals2
+ Consideration of $444m and contingent payment of $300m upon positive FID
+ 6.4 Tcf of contingent resources (2C, Woodside share) in Greater Scarborough upon completion1,3
+ Targeting completion by end of Q1 2018
+ Pathway to low-cost development through Pluto expansion; upside from Pluto-NWS Interconnector4
1. Refer to Notes on petroleum resource estimates slide for further details.
2. Woodside will exercise its pre-emption right if required to acquire at least an additional 25% interest. If BHP does not pre-empt, Woodside’s interest in WA-1-R will increase to 75%. If BHP does pre-empt Woodside’s interest increases to 50%.
3. Assumes a Woodside interest of 75% in WA-1-R.
4. Subject to all necessary joint venture approvals, regulatory approvals and/or appropriate commercial agreements being finalised.
Scarborough, Thebe and Jupiter gas fields
14 February 2018 7Full Year Results |

LNG market
+ Increasing global LNG demand as the energy mix shifts to gas
+ Economic growth and public policy changes underpinning Asian LNG demand growth:
+ Chinese LNG demand to grow at 7% CAGR to 20252
+ Spot price volatility supports term contracts
OVERVIEW
1. Committed supply means operational supply and supply under construction.
2. Compound annual growth rate. Source: Wood Mackenzie Ltd, Q4 2017.
0
100
200
300
400
500
600
2010 2015 2020 2025 2030 2035
Mtp
a
Committed supply¹ Demand
Commitment to new supply required
Source: Wood Mackenzie Ltd, Q4 2017
14 February 2018 8Full Year Results |

Strategy delivers value
OVERVIEW
Asia Pacific uncontracted demand
Out
stan
ding
bas
e bu
sine
ss
Sust
aina
ble
ener
gy
Lower capital intensity developments
New revenue streams
Preparing for Horizon II growth
New growth platforms through exploration and acquisitions
Expanding the LNG market
+ Developments leveraging existing infrastructure
+ Growth funded by base business and Horizon I growth
+ Monetise exploration and acquisition success
+ Increase supply to new and traditional markets
+ Capital efficient developments
+ Unlock new major hubs
Horizon I 2017-2021
Horizon II 2022-2026
Horizon III 2027+
CASH GENERATION
VALUE UNLOCKED
SUCCESS REPEATED
14 February 2018 9Full Year Results |

FINANCIAL UPDATE
Sherry DuheChief Financial Officer and Executive Vice President14 February 2018

Net profit after tax
FINANCIAL UPDATE
1. Other includes impact of 2016 NWS price review payment, finance costs, shipping and direct sales costs and gain on disposal, offset by net trading margin movement, general administrative and other costs and inventory and foreign exchange movements.
2. The Domestic Gas Joint Venture (DGJV) production entitlement was fulfilled on 8 May 2017. Woodside’s equity share of pipeline gas and associated condensate in the DGJV was 50%. All remaining gas will be sold under the Incremental Pipeline Gas Joint Venture (IPGJV). Woodside’s equity share of the IPGJV is 16.67%.
+ Profit 18% higher than FY 2016
+ Sales revenue supported by higher realised prices
+ Lower production volumes:
+ Reduction in NWS pipeline gas2
+ Lower LNG production and higher inventory build
+ Lower depreciation due to positive reserves movements and lower production
+ Higher tax expense due to higher taxable income, one-off prior period adjustments and FX movements
868
258 (392)
29
132
120
103 (79)(15) 1,024
0
200
400
600
800
1,000
1,200
2016
Sale
s re
venu
e: p
rice
Sale
s re
venu
e: v
olum
e
Prod
uctio
n co
sts
Dep
reci
atio
n
Prov
isio
n re
leas
ed
Expl
orat
ion
and
eval
uatio
n
Taxe
s
Oth
er¹
2017
$ m
illio
n
14 February 2018 11Full Year Results |

Production costs
FINANCIAL UPDATE
1. Unit production cost adjusted for the impact of Wheatstone LNG and the reduced volume and associated production cost of NWS pipeline gas.
+ 9% reduction in total production cost (excluding Wheatstone)
+ Unit production cost:+ Reduces to $5.0/boe excluding
Wheatstone LNG and NWS pipeline gas impact1
+ NWS gas - $3.8/boe+ Pluto LNG - $3.9/boe
+ Pluto LNG impacted by minor turnaround
705
639
472 443
7.4
6.9
5.0 5.2
-
2.0
4.0
6.0
8.0
10.0
12.0
-
100
200
300
400
500
600
700
800
2014 2015 2016 2017
$/bo
e
$ m
illio
n
Total (LHS) Units (RHS)
14 February 2018 12Full Year Results |

Gross margin
FINANCIAL UPDATE
+ Higher realised prices
+ World-class, low-cost assets
+ Increased margins
Gross Margin
23.0 $/boeDepreciation
13.8 $/boe
Production and other costs
9.4 $/boe
50%
50%
30%
20%
14 February 2018 13Full Year Results |
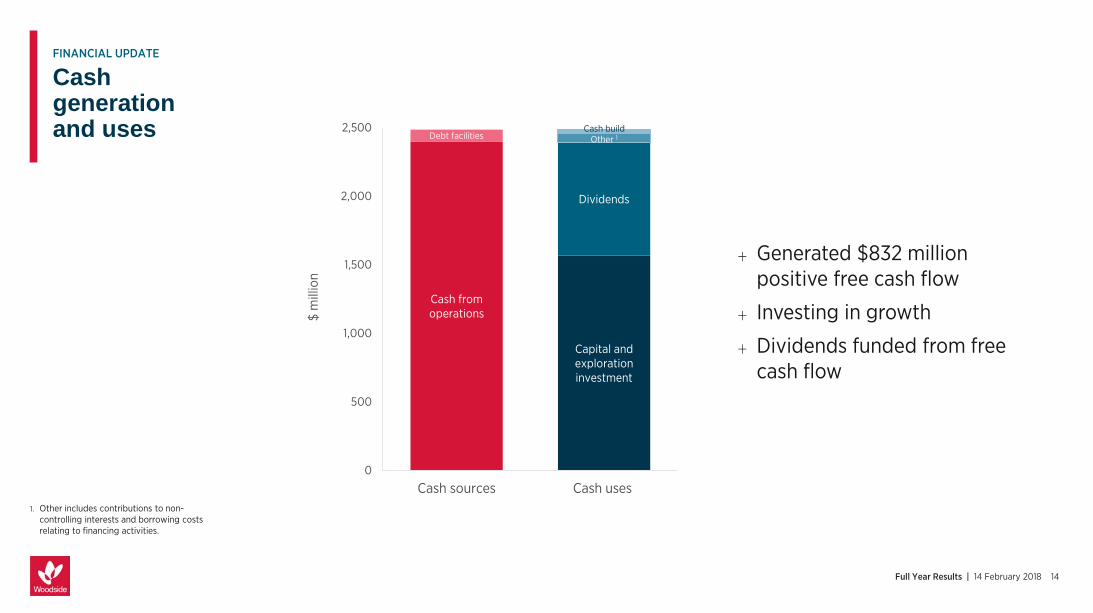
Cash generation and uses
FINANCIAL UPDATE
1. Other includes contributions to non-controlling interests and borrowing costs relating to financing activities.
+ Generated $832 million positive free cash flow
+ Investing in growth
+ Dividends funded from free cash flow
Cash from operations
Debt facilities
Capital and exploration investment
Dividends
Other 1Cash build
0
500
1,000
1,500
2,000
2,500
Cash sources Cash uses
$ m
illio
n
14 February 2018 14Full Year Results |

DividendsFINANCIAL RESULTS
1. Dividend yield based on 2017 gross dividends declared and share price at year-end 2017.
+ Strong distributions to shareholders
+ 98 cps fully franked dividend declared for 2017
+ Dividend yield of 5.4%1 in 2017
+ Maintained 80% dividend payout ratio
255
109
8398
99
54
45
54
0
10
20
30
40
50
60
70
80
90
100
0
50
100
150
200
250
300
2014 2015 2016 2017
$/bb
l
cps
Full-year dividend (LHS) Annual average dated Brent (RHS)
14 February 2018 15Full Year Results |

Balance sheet, debt service and liquidity
FINANCIAL UPDATE
1. S&P Global BBB+ (negative outlook), Moody’s Baa1 (negative outlook), as at 31 December 2017.
+ Gearing maintained at 24%
+ Strong investment grade credit ratings maintained1
+ Actively managed debt portfolio: + Extended average term to
maturity to 4.7 years+ Executed $800 million, 10.5 year
term, 3.7% corporate bond+ Portfolio cost of debt of 3.7%
+ Liquidity increased to $2.9 billion
0
500
1,000
1,500
2018 2019 2020 2021 2022 2023 2024 2025 2026 2027 2028
$ m
illio
n
Drawn debt Undrawn debt facilities
Debt maturity profile
14 February 2018 16Full Year Results |

2017 highlights
FINANCIAL UPDATE
NPAT $1,024 million up 18%
Dividend 98 cps up 18%
Free cash flow $832 million up 630%
14 February 2018 17Full Year Results |

Production guidance
FINANCIAL UPDATE
2017 Actual(MMboe)
2018 Guidance(MMboe)
LNG 61.7 69 – 71
Liquids1 14.8 10 – 12
NWS pipeline gas2 6.0 4 – 5
Other3 1.9 2
Total 84.4 85 – 90
+ Production guidance for 2018 is 85 – 90 MMboe
+ Increased LNG from higher Wheatstone contribution
+ Oil impacted by Ngujima-Yin FPSO off-station from May 20184
1. Liquids includes oil and condensate.2. First full year of NWS pipeline gas at
16.67% equity. 3. Other includes LPG and other pipeline
gas.4. The Ngujima-Yin FPSO (Vincent oil) is
leaving station from May 2018 for modifications ahead of forecast Greater Enfield production from mid-2019.
14 February 2018 18Full Year Results |
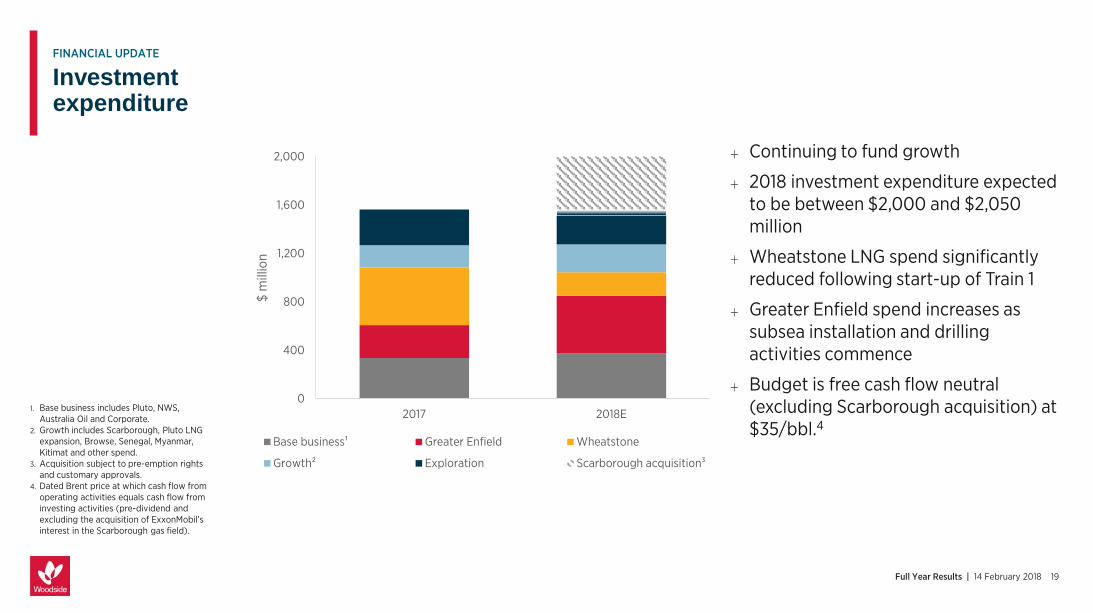
Investmentexpenditure
FINANCIAL UPDATE
1. Base business includes Pluto, NWS, Australia Oil and Corporate.
2. Growth includes Scarborough, Pluto LNG expansion, Browse, Senegal, Myanmar, Kitimat and other spend.
3. Acquisition subject to pre-emption rights and customary approvals.
4. Dated Brent price at which cash flow from operating activities equals cash flow from investing activities (pre-dividend and excluding the acquisition of ExxonMobil’s interest in the Scarborough gas field).
+ Continuing to fund growth
+ 2018 investment expenditure expected to be between $2,000 and $2,050 million
+ Wheatstone LNG spend significantly reduced following start-up of Train 1
+ Greater Enfield spend increases as subsea installation and drilling activities commence
+ Budget is free cash flow neutral (excluding Scarborough acquisition) at $35/bbl.4
0
400
800
1,200
1,600
2,000
2017 2018E
$ m
illio
n
Base business¹ Greater Enfield Wheatstone
Growth² Exploration Scarborough acquisition³
14 February 2018 19Full Year Results |

SUMMARY
Peter ColemanChief Executive Officer and Managing Director14 February 2018

2018 prioritiesSUMMARY
+ Delivering Wheatstone Train 2, domestic gas and optimising performance
+ Executing Greater Enfield and GWF-2Committed growth
+ SNE - Phase 1 FEED entry+ Progress drilling in Myanmar, West Africa and AustraliaInternational developments
+ Safe, reliable, low-cost production+ Delivering our projects Base business excellence
+ Concept select for Scarborough to Pluto LNG and Browse to NWS
+ Enter FEED for Pluto-NWS interconnector+ Commence Pluto LNG truck-loading
Unlock Burrup Hub
14 February 2018 21Full Year Results |

Contingent resources (2C)
2
88
102 98
0
20
40
60
80
100
120
2014 2015 2016 2017
Perc
ent
SUMMARY
Reserves and resources
1. Based on year end 2017 Wheatstone and Canada 2P reserves.
2. Based on year end 2017 Wheatstone, Canada, Senegal and Scarborough 2C best estimate contingent resources.
3. Subsequent to year-end 2017. Acquisition subject to pre-emption rights and customary approvals. Refer to Notes on petroleum resource estimates slide for further details. Assumes a Woodside interest of 75% in WA-1-R.
+ Balance sheet supporting resource growth through acquisitions:+ ~280 MMboe 2P reserves1
+ ~3,260 MMboe 2C resources2
+ Improving depth and quality of exploration portfolio
+ Higher-risk prospects targeted in 2017. Drilling lower-risk prospects in Myanmar and Australia 2018
Three-year reserves replacement ratio (2P)
1,743
4,398
5,014 5,012
0
1,000
2,000
3,000
4,000
5,000
6,000
2014 2015 2016 2017
MM
Boe
Scarborough acquisition
14 February 2018 22Full Year Results |

SUMMARY
ConclusionGenerating increasing cash flow and returns from
existing business and committed projects
Unlocking value by delivering capital efficient developments to meet growing demand
Maximising the value of existing infrastructure
14 February 2018 23Full Year Results |

ANNEXURE

ANNEXURE
Production reconciliation
1. The Domestic Gas Joint Venture (DGJV) production entitlement was fulfilled on 8 May 2017. Woodside’s equity share of pipeline gas and associated condensate in the DGJV was 50%. All remaining gas will be sold under the Incremental Pipeline Gas Joint Venture (IPGJV). Woodside’s equity share of the IPGJV is 16.67%.
2. Other includes planned and unplanned shutdowns.
+ Higher LNG capacity following Pluto high-rate production trials
+ Lower NWS pipeline gas1
94.9 (6.9)(0.5) (0.8) 2.1 0.4 (4.8)
84.4
0
20
40
60
80
100
2016
Pro
duct
ion
NW
S pi
pelin
e ga
s¹
Dis
cont
inue
d op
erat
ions
Res
ervo
ir de
clin
e
LNG
Cap
acity
Whe
atst
one
Oth
er²
2017
Pro
duct
ion
MM
boe
14 February 2018 25Full Year Results |

Realisedprices
ANNEXURE
1. Japanese Customs-cleared Crude is the average price of customs-cleared crude oil imports into Japan as reported in customs statistics and used as reference price for long-term LNG supply contracts.
Products
$/boeChange
%
$m Revenue impact2017 2016
NWS LNG 38 33 15 117
Pluto LNG 47 48 (2) (23)
Wheatstone LNG 48 - - -
Pipeline gas 20 21 (5) (1)
Condensate 54 45 20 76
LPG 57 45 27 7
Oil 56 44 27 82
Volume weighted average realised price 44 40 10 258
Average Brent price 54 45 20
Average 3-month lagged JCC1 51 42 21
14 February 2018 26Full Year Results |
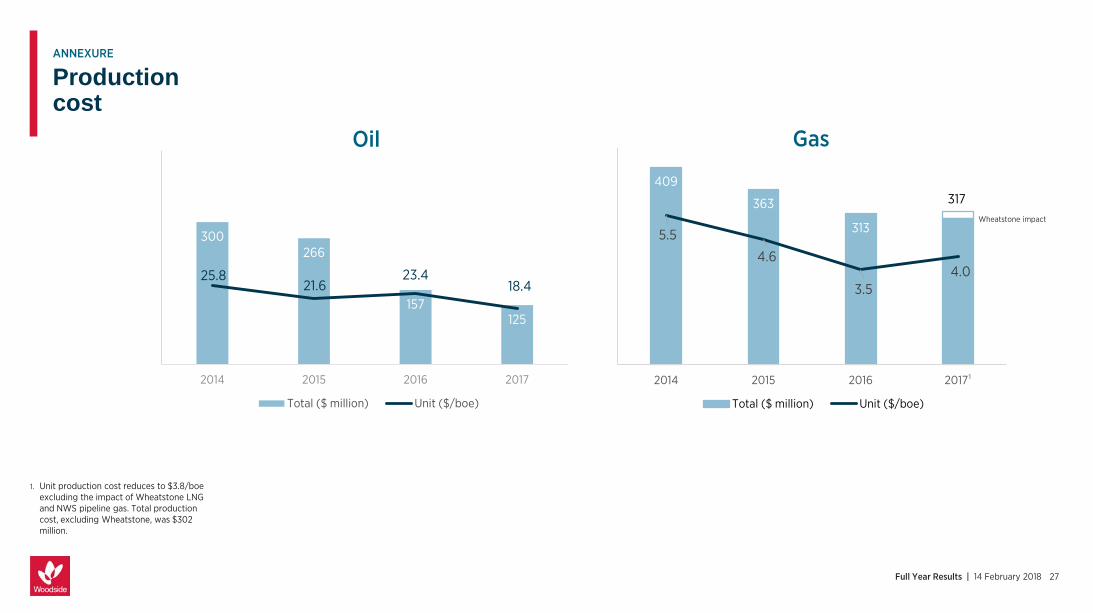
Production cost
ANNEXURE
1. Unit production cost reduces to $3.8/boeexcluding the impact of Wheatstone LNGand NWS pipeline gas. Total production cost, excluding Wheatstone, was $302 million.
GasOil
Wheatstone impact
300266
157125
25.821.6
23.418.4
0
10
20
30
40
50
60
70
0
50
100
150
200
250
300
350
400
450
2014 2015 2016 2017
Total ($ million) Unit ($/boe)
409
363
313
317
5.5
4.6
3.54.0
0
1
2
3
4
5
6
7
8
0
50
100
150
200
250
300
350
400
450
2014 2015 2016 2017¹
Total ($ million) Unit ($/boe)
14 February 2018 27Full Year Results |

ProfitabilityANNEXURE
1. Impacted by the release of the provision relating to the Balnaves FPSO lease.
SegmentsGroup
11 8 4
7 20 14
20
25 39
0
10
20
30
40
50
60
70
80
90
NWS Gas Pluto Aus Oil¹
$/bo
e
Production and other costs Depreciation Gross margin
15 17 10 9
15 16
14 14
48
21
19 23
0
10
20
30
40
50
60
70
80
90
2014 2015 2016 2017
$/bo
e
Production and other costs Depreciation Gross Margin
14 February 2018 28Full Year Results |
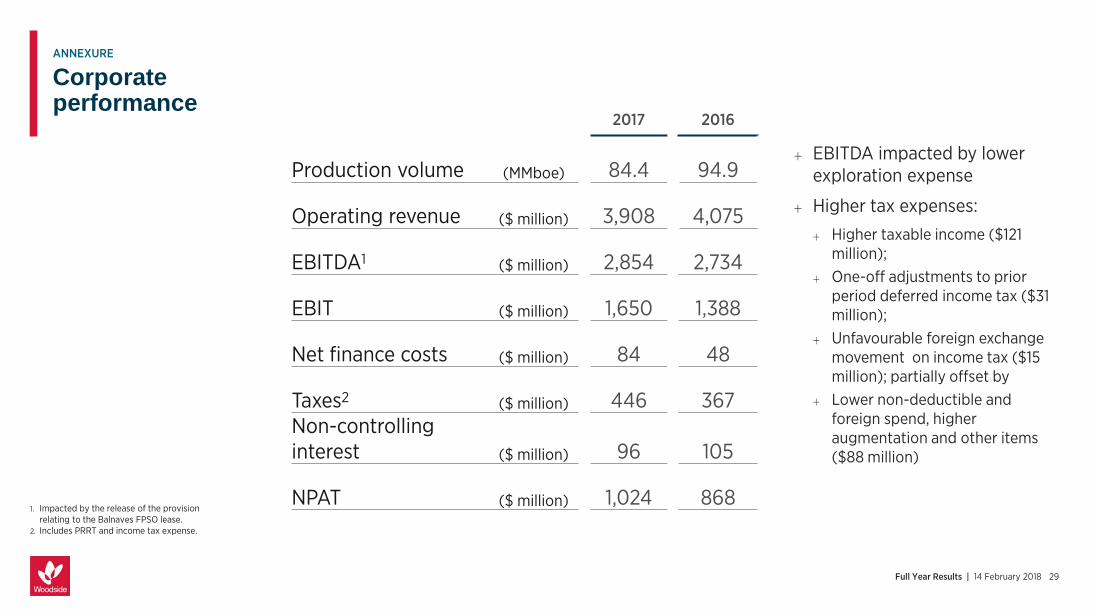
Corporate performance
ANNEXURE
1. Impacted by the release of the provision relating to the Balnaves FPSO lease.
2. Includes PRRT and income tax expense.
2017 2016
Production volume (MMboe) 84.4 94.9
Operating revenue ($ million) 3,908 4,075
EBITDA1 ($ million) 2,854 2,734
EBIT ($ million) 1,650 1,388
Net finance costs ($ million) 84 48
Taxes2 ($ million) 446 367Non-controlling interest ($ million) 96 105
NPAT ($ million) 1,024 868
14 February 2018 29Full Year Results |
+ EBITDA impacted by lower exploration expense
+ Higher tax expenses:+ Higher taxable income ($121
million);+ One-off adjustments to prior
period deferred income tax ($31 million);
+ Unfavourable foreign exchange movement on income tax ($15 million); partially offset by
+ Lower non-deductible and foreign spend, higher augmentation and other items ($88 million)
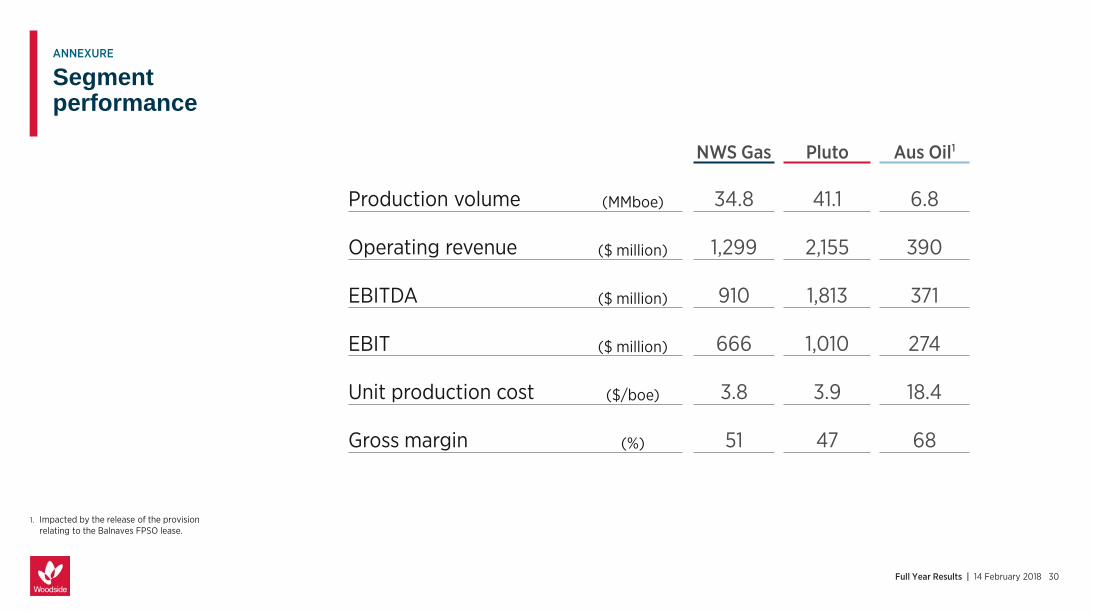
Segment performance
ANNEXURE
1. Impacted by the release of the provision relating to the Balnaves FPSO lease.
NWS Gas Pluto Aus Oil1
Production volume (MMboe) 34.8 41.1 6.8
Operating revenue ($ million) 1,299 2,155 390
EBITDA ($ million) 910 1,813 371
EBIT ($ million) 666 1,010 274
Unit production cost ($/boe) 3.8 3.9 18.4
Gross margin (%) 51 47 68
14 February 2018 30Full Year Results |

ANNEXURE
Exploration pipeline
1. This is a forecast activity plan subject to change due to final approvals, weather conditions and other external circumstances.
2. Target size: unrisked gross mean success volume (100% basis). Medium >20 MMboeand <100 MMboe and large >100 MMboe.
3. Subject to government and joint venture approval.
4. Completion of acquisition remains subject to satisfaction of conditions precedent. The well spudded in October 2017.
14 February 2018 31Full Year Results |

Notes on petroleum resource estimates
Unless otherwise stated, all petroleum resource estimates are quoted as at the balance date (i.e. 31 December) of the Reserves Statement in Woodside’s most recent Annual Report released to ASX and available at http://www.woodside.com.au/Investors-Media/Announcements, net Woodside share at standard oilfield conditions of 14.696 psi (101.325 kPa) and 60 degrees Fahrenheit (15.56 deg Celsius). Woodside is not aware of any new information or data that materially affects the information included in the Reserves Statement. All the material assumptions and technical parameters underpinning the estimates in the Reserves Statement continue to apply and have not materially changed.
Woodside reports reserves net of the fuel and flare required for production, processing and transportation up to a reference point. For offshore oil and floating LNG (FLNG) projects, the reference point is defined as the outlet of the floating production storage and offloading (FPSO) vessel, or FLNG facility respectively, while for the onshore gas projects the reference point is defined as the inlet to the downstream (onshore) processing facility.
Woodside uses both deterministic and probabilistic methods for estimation of petroleum resources at the field and project levels. Unless otherwise stated, all petroleum estimates reported at the company or region level are aggregated by arithmetic summation by category. Note that the aggregated Proved level may be a very conservative estimate due to the portfolio effects of arithmetic summation.
‘MMboe’ means millions (106) of barrels of oil equivalent. Dry gas volumes, defined as ‘C4 minus’ hydrocarbon components and non-hydrocarbon volumes that are present in sales product, are converted to oil equivalent volumes via a constant conversion factor, which for Woodside is 5.7 Bcf of dry gas per 1 MMboe. Volumes of oil and condensate, defined as ‘C5 plus’ petroleum components, are converted from MMbbl to MMboe on a 1:1 ratio.
The estimates of petroleum resources are based on and fairly represent information and supporting documentation prepared by qualified petroleum reserves and resources evaluators. The estimates have been approved by Mr Ian F. Sylvester, Woodside’s Vice President Reservoir Management, who is a full-time employee of the company and a member of the Society of Petroleum Engineers. Mr Sylvester’s qualifications include a Master of Engineering (Petroleum Engineering) from Imperial College, University of London,England, and more than 20 years of relevant experience.
The Woodside contingent resource estimate for the Scarborough area resources is based on SPE-PRMS:
1. As at the date of this release, the Woodside contingent resource estimate for the Scarborough area resources, being the Scarborough, Thebe and Jupiter gas fields, is gross (100%) 9.2 Tcf of dry gas (at the 2C confidence level). Upon completion of the acquisition, Woodside’s net share of the resources is estimated to increase from 2.8 Tcf to 6.4 Tcf of dry gas.
2. The Woodside contingent resource estimate for the Scarborough area resources is based on Woodside’s technical evaluation of subsurface and seismic data, has been calculated using deterministic methods and has been based on a development scenario utilising existing Woodside-operated infrastructure on the Burrup Hub. There is no requirement for further appraisal to confirm the estimate. There is no identified requirement for the development of new technology.
3. The fields covered by the contingent resource estimate, being the Scarborough, Thebe and Jupiter gas fields, are contained within Retention Leases WA-1-R, WA-61-R, WA-62-R and WA-63-R. Subject to completion of the acquisition, Woodside will have a 75% interest in Retention Lease WA-1-R and a 50% interest in Retention Leases WA-61-R, WA-62-R and WA-63-R. For the purpose of the net 2C estimate, interest in the Scarborough gas field is assumed to be 75% based on WA-1-R interest only. WA-1-R and WA-62-R together contain the Scarborough gas field.
4. Any booking by Woodside of the increased Scarborough area contingent resources is subject to the completion of the acquisition and will be made as part of separate reporting. Technical and commercial maturation of a development concept would be required to later book any contingent resources as reserves.
14 February 2018Full Year Results | 32