asx announcement...chris was appointed the managing director and under his careful management,...
TRANSCRIPT

ASX ANNOUNCEMENT
Page 1 | 3
Wednesday 19 August 2020
Mineral Resources Results Announcement – FY2020 Mineral Resources Limited (ASX: MIN) (‘MRL’ or ‘the Company’) is pleased to announce its financial results for the full year ended 30 June 2020 (FY20).
The coronavirus (COVID-19) pandemic did not impact the Company’s financial performance in FY20. MRL recognised the seriousness of this pandemic early and adopted the strategy to keep everyone employed and the workplace virus free. To achieve this, MRL procured the world’s leading, gold standard, COVID-19 Polymerase Chain Reaction (PCR) equipment, to screen every person prior to entering site. To date, 45,000 tests have been completed and this program will continue until COVID-19 is no longer a threat. By implementing these actions, MRL was able to protect jobs and shield our employees and their families from this virus, enabling the Company to maintain and increase production and benefit from current high iron ore prices. The Company generated record statutory Earnings Before Interest, Tax, Depreciation and Amortisation (EBITDA) of $2.01 billion. This result included a $1.30 billion gain on the disposal of a 60% interest in the Wodgina Lithium Project (Wodgina). Underlying1 EBITDA was $765 million, up 77% on the prior corresponding period (pcp)2, underpinned by strong growth in both MRL’s Mining Services and Commodities operations. Statutory Net Profit After Tax (NPAT) amounted to $1.002 billion and underlying NPAT was $334 million, up 63% on pcp. Statutory NPAT included $200 million of post-tax impairment charges ($286 million pre-tax) relating to the write-down of capitalised exploration and mine development expenditure, intangibles, plant and equipment and stockpiles.
The Directors have resolved to distribute a fully franked final dividend of 77.0 cents per share for shareholders. The final dividend, together with the interim dividend of 23.0 cents per share, makes a total fully franked dividend for FY20 of 100.0 cents per share. Highlights of FY20 include:
An 18% improvement in the Total Recordable Injury Frequency Rate and another year of zero Lost Time Injury incidents, a strong achievement across the MRL team of more than 3,100 employees and contractors;
Completion of the sale of a 60% interest in Wodgina to Albemarle Corporation (NYSE: ALB, Albemarle) and establishment of the 60:40 Albemarle/MRL unincorporated MARBL Lithium Joint Venture (MARBL JV)3, providing MRL the opportunity to participate in the lithium hydroxide market on an accelerated basis while preserving optionality for future capacity expansions. The transaction returned the Company to a net cash position and, through MARBL, delivers MRL a 40% stake in the lithium hydroxide modules being built by Albemarle in Kemerton;
1 Underlying EBITDA has been derived from statutory EBITDA by deducting $1,298 million gain on the Wodgina disposal, adding back $40 million unrealised fair value losses on listed investments, net $21 million foreign exchange losses on the Company’s US$ denominated notes and cash holdings and a $4 million gain on acquisition of an investment 2 Comparison to pcp being the finaniclal year ended 30 June 2019 3 See ASX announcement 01 November 2019

Page 2 | 3
Mining Services production volumes increased by 65% year on year as a result of a number of
new external contracts and the increase in internal volumes;
Iron ore exports totalled 14.1 million wet metric tonnes (wmt), up 33% on pcp; and
Mt Marion increased production of spodumene by 17%, despite the challenging lithium market.
The FY20 performance has continued the Company’s track record of generating very strong returns for shareholders. Since listing on the ASX in 2006, the Company has delivered an average annual post-tax return on invested capital of 27%, which has enabled MRL to grow cashflow through cycles while maintaining a strong balance sheet and delivering a 19% per annum increase in dividends to our loyal shareholders.
MRL’s Managing Director Chris Ellison said: “This has been the most extraordinary year in the Company’s history. It is a credit to the entire MRL family that we have been able to withstand the impact of COVID-19 to keep our people safe and employed. Our guiding principle that drove all of our actions, and continues to drive everything we do, was to keep all of our people in jobs so that they could support their families with certainty. “Notwithstanding the fact that the impact of COVID-19 dominated much of the past financial year, MRL has delivered record production and record profitability. We expanded our blue-chip client base for the Mining Services division and advanced our Commodities division’s strategy to develop long-life projects that provide predictable volume and income streams for the Mining Services division. “MRL has entered FY21 with a strong balance sheet and positive momentum in our operations. We remain vigilant to the ongoing threat posed by COVID-19, as well as opportunities for which we can quickly and efficiently deploy the Mining Services capabilities that are the hallmark of our Company. “We remain committed to financial discipline and using our innovative approach to deliver outstanding outcomes for our team, our customers and our shareholders.” Financial performance
FY20 Result Comparison to pcp
Revenue $2,125m Up 41%
EBITDA (statutory) $2,006m Up 420%
EBITDA (underlying) $765m Up 77%
NPAT (statutory) $1,002m Up 507%
NPAT (underlying) $334m Up 63%
Diluted earnings per share (EPS) 533cps Up 512%
Dividends declared (interim and final) 100cps Up 127%
Operating cash flow $595m Up $409m
Capex and investments $391m Down $467m
Net cash $231m Up $1,103m
Net assets $2,296m Up $916m
Return on invested capital (ROIC) 49.6% Up from 9.8%

Page 3 | 3
Ends This announcement dated 19 August 2020 has been authorised for release to the ASX by Mineral Resources Limited’s Board of Directors. For further information: Investor Relations Media James Bruce Peter Klinger Head of Investor Relations Cannings Purple T: +61 8 9329 3706 T: +61 (0)411 251 540 E: [email protected] E: [email protected] About Mineral Resources Mineral Resources Limited (ASX: MIN) is a Perth-based leading integrated mining services provider, with a particular focus on the iron ore and hard-rock lithium sectors in Western Australia. Using technical know-how and an innovative approach to deliver exceptional outcomes, Mineral Resources has become one of the ASX’s best-performing contractors since listing in 2006. To learn more, please visit www.mrl.com.au. Follow us on:

Annual Financial Report30 June 2020
MINERAL RESOURCES LIMITEDABN 33 118 549 910
WWW.MRL.COM.AU

Mineral Resources Limited Appendix 4E Preliminary final report
1
1. Company details
Name of entity: Mineral Resources Limited ABN: 33 118 549 910 Reporting period: For the year ended 30 June 2020 Previous period: For the year ended 30 June 2019
2. Results for announcement to the market
$m
Revenues from ordinary activities up 40.5% to 2,124.7
Profit from ordinary activities after tax attributable to the owners of Mineral Resources Limited up 513.5% to 1,003.7
Profit for the year attributable to the owners of Mineral Resources Limited up 513.5% to 1,003.7
Comments A commentary on the results for the period is contained within the Financial Report as well as the Media Release that accompanies this announcement.
3. Net tangible assets
Reporting period
Previous period
$ $
Net tangible assets per ordinary security 11.78 6.89
4. Control gained over entities
Name of entities (or group of entities) Resource Development Group Limited (RDG)
Date control gained 17 June 2020
5. Dividends
Cents Franked % $m
2020 Financial Year final dividend – declared 19 August 2020 77.00 100% 144.6 2020 Financial Year interim dividend – paid 26 March 2020 23.00 100% 43.4 2019 Financial Year final dividend – paid 4 October 2019 31.00 100% 58.1 2019 Financial Year interim dividend – paid 17 April 2019 13.00 100% 24.4
Record date for determining entitlements to the 2020 final dividend 26 August 2020
Payment date for the 2020 final dividend 15 September 2020

Mineral Resources Limited Appendix 4E Preliminary final report
2
6. Dividend reinvestment plans The following dividend or distribution plans are in operation: Shareholders are able to elect to participate in the following Dividend Reinvestment Plan (DRP) for the final dividend:
Date of final dividend declaration 19 August 2020 Record date for determining entitlements to the final dividend 26 August 2020 Closing date for election to participate in the DRP 27 August 2020 Closing date for calculation of DRP share issue price, based on the Volume Weighted Average Price (VWAP) for Mineral Resources Limited shares sold on the ASX in the five business days following record date (rounded to the nearest whole cent)
3 September 2020
DRP discount to be applied None DRP to be underwritten No Payment date for final dividend/issue of shares under the DRP 15 September 2020 DRP share ranking with existing Mineral Resources Limited shares Equally in all respects Date by which DRP participant’s holdings will be updated with additional shares issued under the DRP
17 September 2020
7. Audit qualification or review The financial statements have been audited and an unqualified opinion has been issued.

Mineral Resources Limited Corporate directory 30 June 2020
3
Directors Peter Wade Chris Ellison Kelvin Flynn James McClements Xi Xi Company secretaries Mark Wilson Derek Oelofse Registered office 1 Sleat Road Applecross WA 6153 P: + 61 8 9329 3600 F: + 61 8 9329 3601 Postal address: Locked Bag 3, Canning Bridge, Applecross WA 6153 Principal place of business 1 Sleat Road Applecross WA 6153 Share register Computershare Investor Services Pty Limited Level 11, 172 St Georges Terrace Perth WA 6000 P: + 61 8 9323 2000 F: + 61 8 9322 2033 www.computershare.com/au Auditor RSM Australia Partners Level 32 Exchange Tower 2 The Esplanade Perth WA 6000 P: + 61 8 9261 9100 F: + 61 8 9261 9111 www.rsm.com.au Bankers National Australia Bank 100 St Georges Terrace Perth WA 6000 www.nab.com.au Stock exchange listing Mineral Resources Limited shares are listed on the Australian Securities Exchange
(ASX: MIN) Website www.mrl.com.au

Mineral Resources Limited Contents 30 June 2020
4
Directors' report 5 Auditor's independence declaration 47 Income statement 48 Balance sheet 49 Statement of changes in equity 50 Statement of cash flows 51 Notes to the financial statements 52 Directors' declaration 104 Independent auditor's report to the members of Mineral Resources Limited 105
General information The financial statements cover Mineral Resources Limited as a group consisting of Mineral Resources Limited (the 'Company' or 'parent entity') and the entities it controlled at the end of, or during, the year (the 'Group'). The financial statements are presented in Australian dollars, which is the Group's functional and presentation currency. Mineral Resources Limited is a listed public company limited by shares, incorporated and domiciled in Australia. Its registered office and principal place of business is: 1 Sleat Road Applecross WA 6153 A description of the nature of the Group's operations and its principal activities are included in the notes to the financial statements. The financial statements were authorised for issue, in accordance with a resolution of directors, on 19 August 2020.

Mineral Resources Limited Directors' report 30 June 2020
5
The directors present their report, together with the financial statements, for the Group for the year ended 30 June 2020.
Directors The following persons were directors of Mineral Resources Limited during the whole of the financial year and up to the date of this report, unless otherwise stated: Peter Wade Chris Ellison Kelvin Flynn James McClements Xi Xi
Principal activities During the financial year, the principal continuing activities of the Group consisted of the integrated supply of goods and services to the resources sector.
Dividends Cents Franked % $m 2020 Financial Year final dividend – declared 19 August 2020 77.00 100% 144.6 2020 Financial Year interim dividend – paid 26 March 2020 23.00 100% 43.4 2019 Financial Year final dividend – paid 4 October 2019 31.00 100% 58.1 2019 Financial Year interim dividend – paid 17 April 2019 13.00 100% 24.4
Review of operations Financial performance The Group generated statutory earnings before interest, tax, depreciation and amortisation (EBITDA) of $2,006 million and an underlying EBITDA of $765 million for the financial year ended 30 June 2020 (FY20). The underlying result was up $332 million (77%) on the prior corresponding period (pcp). Underlying EBITDA has been derived by excluding from statutory EBITDA the gain on disposal of 60% interest in the Wodgina Lithium Project of $1,298 million, along with $40 million of unrealised fair value losses on listed investments (pcp was a $42 million loss) net $21 million foreign exchange losses on the translation impact of the Group’s US dollar denominated notes and cash holdings (pcp was a $4 million loss) and a $4 million gain on acquisition of an investment. Statutory net profit after tax (NPAT) was $1,002 million which was up $837 million (507%) on pcp. Statutory NPAT included $200 million of post-tax impairment charges ($286 million pre-tax) in relation to capitalised exploration and mine development expenditure, intangibles, plant and equipment and stockpiles. Group revenue for the year ended 30 June 2020 was $2,125 million, up $613 million (41%) on pcp. FY20 was a year of significant growth with the Mining Services Division’s volume growth of 65%, and the Commodity Division’s tonnage exports growth of 27%. Volatility in commodity prices saw lithium prices fall a further 50% during the year, while the Platts Iron Ore 62% Fines Index (Platts) increased by 7% over the same period. The coronavirus (COVID-19) crisis did not materially impact the Group in FY20. Following the outbreak in January 2020, the Group moved quickly to implement preventative action and continuously monitored developments around the world. This included the adoption, as a minimum, of all guidelines introduced by the Australian Federal and State Government health authorities to minimise health risks presented by COVID-19. In April 2020 the Group began testing all workers and visitors to operational sites with gold-class PCR testing equipment from the USA. These actions and initiatives assisted in the Group achieving a strong result, with growth in both the Mining Services and Commodities operations, despite the challenging lithium market and changes to operational conditions to mitigate the risks brought about by COVID-19.

Mineral Resources Limited Directors' report 30 June 2020
6
Further highlights during the period include:
Sale of a 60% interest in the Wodgina Lithium Project to Albemarle Corporation, Inc. (Albemarle) resulting in the recognition of a pre-tax gain on disposal of $1,298 million (post-tax $909 million) and the establishment of the 60:40 Albemarle/MRL unincorporated MARBL Lithium Joint Venture (MARBL JV). As part of the transaction, MRL now also owns 40% of the lithium hydroxide modules being built by Albemarle in Kemerton. MARBL JV placed the Wodgina Lithium Project on care and maintenance during the first half of FY20 to preserve the world class orebody for future periods of higher prices;
Iron ore revenue sales growth of 63% to $1,553 million, due to a 33% increase in sales volumes and a 22% increase in average price received, with further growth expected in FY21 as Koolyanobbing achieved an annualised shipped tonnes run rate of over 12 million wet metric tonnes (wmt) in June 2020; and
An increase in Mt Marion Lithium Project plant output of 17%, despite the challenging lithium market. Following the exceptional financial performance in FY20 and given its strong balance sheet at 30 June 2020, the Board resolved on 19 August 2020 to declare a fully franked final dividend of 77.0 cents per ordinary share for shareholders as at 26 August 2020 to be paid on 15 September 2020. Inclusive of the fully franked interim dividend of 23.0 cents per ordinary share paid in March 2020, total dividends declared in respect of FY20 amount to 100.0 cents per ordinary share. Operational performance Mining Services Division Mining Services EBITDA of $359 million was $150 million (72%) above pcp. Mining Services achieved volume growth of 65% during the year; mainly as a result of the ramp up of the Koolyanobbing project and growth in external contracts, including haulage and external mining. Mining Services revenue of $1,275 million (internal and external) was $425 million (50%) higher than pcp. During the period the Group secured two new contracts and extended its operations at a number of existing sites. Commodities Division Commodity volumes and price impacts on financial performance for FY20 were as follows:
Iron ore pricing continued the strong position encountered in the second half of FY19, with added production stemming from the ramp up of Koolyanobbing to end the year with an annualised shipped tonnes run rate of over 12 million wmt in June 2020; and
Lithium volumes strengthened in FY20 as demand from Mt Marion’s offtake partner increased, despite Wodgina operations moving into care and maintenance.
The Group’s actual commodity export sales volumes in the period were as follows:
Commodity exports 1H20 2H20 Total FY20 1H19 2H19 Total FY19 ('000 wet metric tonnes) Iron Ore Iron Valley 3,590 3,106 6,696 3,673 3,733 7,406 Koolyanobbing 3,158 4,221 7,379 292 2,864 3,156
Total Iron Ore 6,748 7,327 14,075 3,965 6,597 10,563 Spodumene Mt Marion1 194 213 407 186 192 378 Wodgina2 3 - 3 - - -
Total Spodumene 197 213 410 186 192 378 Lithium DSO Wodgina2 - - - 422 - 422
Total DSO - - - 422 - 422 Total Commodity Exports 6,945 7,540 14,485 4,573 6,790 11,362
1 Volumes presented as 100% for the Mt Marion Lithium Project. MRL operates 100% of the project, in which it owns a 50% interest. 2 Volumes presented as 100% for the Wodgina Lithium Project. The project is structured as an unincorporated joint venture from 1 November 2019 with MRL holding a 40% interest. The project is currently on care and maintenance.

Mineral Resources Limited Directors' report 30 June 2020
7
Iron Ore The Group operates two iron ore projects; Iron Valley and Koolyanobbing. Iron ore produced an EBITDA of $479 million, $264 million (123%) higher than the pcp, reflecting increased tonnes shipped and higher prices following strong market conditions. Iron ore revenue of $1,553 million was $599 million (63%) higher than pcp. Iron ore exports in FY20 of 14.1 million wmt were higher than pcp as a result of a 134% increase in the tonnes shipped from Koolyanobbing, offset by a 10% reduction in Iron Valley exports. The Group’s average iron ore price achieved for FY20 was A$110.3 per wet tonne, an increase of 22% on the pcp. This was driven by strong Platts pricing combined with a weaker Australian dollar, along with a further narrowing of discounts in the second half. Mt Marion Lithium Project The Mt Marion Lithium Project is operated by the Group under a life-of-mine Mining Services contract and is a joint project between the Group (50%) and one of the world’s largest lithium producers, Jiangxi Ganfeng Lithium Co. Ltd. (Ganfeng) (50%). Mt Marion produced an EBITDA of $16 million for the Group, 78% down on pcp. This was mainly due to:
The achieved price for 6% and 4% spodumene products averaging A$597 per wet tonne for all tonnes exported, representing a decrease of 43% on pcp;
An increase in total sales volumes in FY20 to 408,000 wmt, 8% higher on pcp;
A reduction in CFR Cost in the second half to A$540 per wet tonne as beneficiation was optimised, resulting in higher yields; and
A grade adjustment in the last quarter of FY20, which resulted in further cost savings. Spodumene concentrate is not exchange traded, and the pricing for Mt Marion output is linked to Chinese domestic and import lithium carbonate and hydroxide prices, with the pricing agreement making provision for periods of low lithium pricing. Wodgina Lithium Project The Group owns 40% of the Wodgina Lithium Project, following the completion of the sale of 60% of the Wodgina Lithium Project to Albemarle and the establishment of the MARBL JV on 1 November 2019. The Group recognised a pre-tax gain on disposal of $1,298 million (post-tax $909 million) during the year. MARBL JV placed the Wodgina project on care and maintenance during the first half of FY20 to preserve the world class orebody for future periods of higher prices. Cash and capital management At 30 June 2020, the Group held cash and cash equivalents of $1,522 million, an increase from $265 million at 30 June 2019. In addition to its 30 June 2020 cash holdings, the Group has access to substantial undrawn debt facilities to support business development activities ($286 million as at 30 June 2020). Completion of the Wodgina transaction with Albemarle during the year resulted in the Group moving back to a net cash positive position with cash inflow of $1,206 million in proceeds from the transaction. Strong underlying EBITDA of $765 million contributed to net cash from operating activities of $595 million, an increase of $409 million from pcp. Cash generated by investing activities of $844 million in FY20 included proceeds from the completion of the Wodgina transaction of $1,206 million, less expenditure on maintenance and growth capex that included:
o Completion of the construction of the Wodgina spodumene concentrate plant and related infrastructure o Growth in the Yilgarn region; and o Investment in the Group’s Pilbara iron ore strategy.
Significant changes in the state of affairs There were no significant changes in the state of affairs of the Group during the financial year.

Mineral Resources Limited Directors' report 30 June 2020
8
Matters subsequent to the end of the financial year The following significant events have arisen since the end of the financial year. Dividend On 19 August 2020, the directors declared a final fully franked dividend for the year ended 30 June 2020 of 77.0 cents per share to be paid on 15 September 2020, a total estimated distribution of $144.6 million based on the number of ordinary shares on issue as at 26 August 2020. Purchase of corporate headquarters On 30 July 2020, the Group executed a contract for the sale and purchase of land and buildings intended for the Group’s new corporate headquarters in Osborne Park approximating $65.0 million inclusive of purchase price, duty and other transactional costs. Subsequent to the reporting date, the Group terminated the lease agreement for corporate headquarters in Subiaco, which has been recognised as a right-of-use asset with a corresponding lease liability on the balance sheet as at 30 June 2020. The parties are in dispute over the termination. Given the proximity of the matter to the reporting date, the legal costs or potential claims cannot be reliably estimated as at the date of this report. COVID-19 pandemic The impact of the COVID-19 pandemic is ongoing and has not had a material impact for the Group's operations during the year ended 30 June 2020. It is not practicable to estimate the potential impact, positive or negative, after the reporting date. The challenges presented by COVID-19 are fluid and continue to change. The Group will continue to assess and update the Group’s response to the COVID-19 pandemic. No other matter or circumstance has arisen since 30 June 2020 that has significantly affected, or may significantly affect the Group's operations, the results of those operations, or the Group's state of affairs in future financial years.
Likely developments and expected results of operations Information on likely developments in the operations of the Group and the expected results of operations have not been included in this report because the directors believe it would be likely to result in unreasonable prejudice to the Group.
Environmental regulation The Group is subject to environmental regulation of its operations, including exploration and mining activities. The directors are not aware of any significant known breaches of environmental regulations to which the Group is subject. The Group is registered under the National Greenhouse and Energy Reporting Act 2007, under which it is required to report annual energy consumption and greenhouse gas emissions for its Australian facilities. The Group has systems and processes in place for the collection and calculation of associated data. Further information on the reporting and results under the Act can be found on the Group’s website.

Mineral Resources Limited Directors' report 30 June 2020
9
Information on directors Name: Peter Wade Title: Non-Executive Chairman Appointment: 27 February 2006 Qualifications: BE (Hons), LGE Experience and expertise: Peter has over 46 years of experience in engineering, construction, project
management, mining and infrastructure services. He started his career with the NSW Public Service managing the construction of significant infrastructure projects in NSW including the Port Kembla coal loader and the grain terminals at Newcastle and Wollongong and was also the Deputy Director for the Darling Harbour Redevelopment construction project. Following his period of employment with the NSW Public Service, Peter joined the executive team of the Transfield Group. Throughout the 1980s and 1990s he was General Manager of Sabemo Pty Ltd, Transfield Construction Pty Ltd, and Transfield Power Technologies and subsequently became Transfield Chief Operations Officer (Southern). During this period Peter was responsible for significant build, own, operate projects including the Melbourne City Link, the Airport Link, the Northside Storage Tunnel and the Collinsville and Smithfield Power Plants. Peter became Managing Director of Crushing Services International Pty Ltd and PIHA Pty Ltd in 1999, and subsequently Process Minerals International Pty Ltd in 2002 (now wholly owned subsidiaries of Mineral Resources Limited). He managed the companies through a sustained period of growth and development prior to the formation and listing of Mineral Resources Limited in 2006 at which time he was appointed Managing Director of the Group. He was subsequently appointed Executive Chairman in 2008 and Non-Executive Chairman in 2012.
Other current directorships: None Former directorships (last 3 years): SRG Global Limited (ASX: SRG) (ceased 26 November 2019) Special responsibilities: Chairman of Board of Directors Interests in shares: 344,710 Interests in options: None Name: Chris Ellison Title: Managing Director Appointment: 27 February 2006 Experience and expertise: Chris is the founding shareholder of each of the three original subsidiary companies
of Mineral Resources Limited (Crushing Services International Pty Ltd, PIHA Pty Ltd and Process Minerals International Pty Ltd) and has over 36 years of experience in the mining contracting, engineering and resource processing industries. In 1979, Chris founded Karratha Rigging and was Managing Director until its acquisition by Walter Wright Industries in 1982. Chris was subsequently appointed as the General Manager, Walter Wright Industries for the Western Australia and Northern Territory regions. In 1986, Chris founded Genco Ltd and following two years of considerable growth, Genco Ltd merged with the Monadelphous Group in 1988. In September 1988, receivers and managers were appointed to the Monadelphous Group. At this time, Chris was appointed the Managing Director and under his careful management, Monadelphous Group successfully traded out of its financial difficulties and eventually relisted on the ASX in late 1989. In 1992, Chris founded PIHA Pty Ltd, a company focused on the provision of specialised pipe lining and general infrastructure.
Other current directorships: None Former directorships (last 3 years): None Special responsibilities: Managing Director Interests in shares: 22,191,729 Interests in options: None

Mineral Resources Limited Directors' report 30 June 2020
10
Name: Kelvin Flynn Title: Independent Non-Executive Director Appointment: 22 March 2010 Qualifications: B Com, CA Experience and expertise: Kelvin is a qualified Chartered Accountant with over 29 years’ experience in
investment banking and corporate advisory roles, including private equity and special situations investments in the mining and resources sector. He has held various leadership positions in Australia and Asia, having previously held the position of Executive Director/Vice President with Goldman Sachs and Managing Director of Alvarez & Marsal in Asia. He has worked in complex financial workouts, turnaround advisory and interim management. Kelvin is the Managing Director of the specialist alternative funds manager Harvis, which focuses on investments and financing in the real estate and real assets sectors. Kelvin is currently a Director of privately held Global Advanced Metals Pty Ltd and a Non-Executive Director of Silver Lake Resources Limited.
Other current directorships: Silver Lake Resources Limited (ASX: SLR) Former directorships (last 3 years): None Special responsibilities: Chair of Audit Committee
Member of Nomination Committee Member of Remuneration Committee
Interests in shares: 15,987 Interests in options: None Name: James McClements Title: Lead Independent Non-Executive Director Appointment: 29 May 2015 Qualifications: B Econ (Hons) Experience and expertise: James has 35 years’ experience in the mining industry as a banker and fund manager
financing projects globally. He was raised and educated in the Pilbara region of Western Australia and began his professional career with BHP Limited before joining Standard Chartered Bank in Perth and N.M. Rothschild & Sons in Sydney then Denver. James also spent 11 years in the USA and co-founded Resource Capital Funds during that time. James is currently the Managing Partner of Resource Capital Funds (RCF) and has extensive Board experience having served as a Director of 12 RCF portfolio companies.
Other current directorships: None Former directorships (last 3 years): None Special responsibilities: Member of Audit Committee
Member of Nomination Committee Chair of Remuneration Committee
Interests in shares: 15,987 Interests in options: None

Mineral Resources Limited Directors' report 30 June 2020
11
Name: Xi Xi Title: Independent Non-Executive Director Appointment: 11 September 2017 Experience and expertise: Xi Xi has extensive experience in the global natural resources sector having served
as a director of Sailing Capital, a US$2 billion private equity fund founded by the Shanghai International Group in 2012. She has worked with numerous Chinese state owned and privately owned enterprises, advising on international acquisitions and investments overseas. Xi Xi has previously served as an analyst and portfolio manager for the Tigris Financial Group in New York, focused in the oil and gas and mining sector. Xi Xi currently serves as a non-executive director of Zeta Resources, a closed-end investment company with a broad portfolio of oil and gas, as well as mining assets. Xi Xi has an MA in International Relations (China Studies & International Finance) from Johns Hopkins University, and holds a double BS in Chemical Engineering & Petroleum Refining, as well as Economics, from the Colorado School of Mines.
Other current directorships: None Former directorships (last 3 years): Galaxy Resources Limited (ASX: GXY) (ceased 11 September 2017) Special responsibilities: Chair of Nomination Committee Interests in shares: 14,607 Interests in options: None 'Other current directorships' quoted above are current directorships for listed entities only and excludes directorships of all other types of entities, unless otherwise stated. 'Former directorships (in the last 3 years)' quoted above are directorships held in the last 3 years only for listed entities and excludes directorships of all other types of entities, unless otherwise stated. 'Interest in shares' quoted above are as at the date of this report.
Company secretaries Mark Wilson joined Mineral Resources Limited as Chief Financial Officer in August 2018. Mark is an experienced senior executive with a strong track record in development and implementation of business strategy, balance sheet management, organisational design, project management, and transaction execution. Mark has held senior positions in a number of Australian and international companies, including Laing O’Rourke, Multiplex and Brookfield Multiplex, where he led Multiplex’s listing on the ASX. Mark holds a Bachelor of Commerce (Finance) and Bachelor of Laws from the University of New South Wales, and has a Graduate Diploma in Applied Finance and Investment from the Securities Institute of Australia (FINSIA). Derek Oelofse has over 35 years financial and commercial management experience in large private, governmental and listed entities based within Australia, South Africa and the United Kingdom. Derek has a Bachelor of Accounting and Bachelor of Commerce degree from the University of the Witwatersrand in South Africa, a Master of Business Administration from Henley Management College in the United Kingdom, and is a Fellow of the Institute of Chartered Accountants Australia and New Zealand. Derek joined Mineral Resources Limited in 2012 as Group Financial Controller and was appointed joint Company Secretary on 4 October 2018. Meetings of directors The number of meetings of the Company's Board of Directors (the Board) and of each Board committee held during the year ended 30 June 2020, and the number of meetings attended by each director while they were a member of the Board/committee were: Full Board Audit Committee Remuneration Committee Nomination Committee Attended Held Attended Held Attended Held Attended Held
Peter Wade 14 15 n/a n/a 3* 6 n/a n/a Chris Ellison 15 15 n/a n/a n/a n/a n/a n/a Kelvin Flynn 15 15 2 2 6 6 2 2 James McClements 15 15 2 2 6 6 2 2 Xi Xi 14 15 n/a n/a n/a n/a 2 2
* A third member is currently being sought as part of the review of the Board composition, with the Chairman, Peter Wade, assisting as a member of the Committee in the interim
12
Mineral Resources Limited
Directors' report
30 June 2020
Remuneration report (audited)
Letter from the Remuneration Committee Chair
Dear Shareholder,
I am pleased to present the 2020 Financial Year (FY20) Remuneration Report (Remuneration report) for Mineral Resources Limited (MRL or the Company) on behalf of the Remuneration Committee (the Committee). The Committee was pleased with shareholder support for our 2019 Financial Year (FY19) Remuneration report. We have sought to build on that support, and implemented the changes for FY20 that were outlined in the FY19 Remuneration Report. No further changes, other than those outlined in the FY19 Remuneration report, were implemented in FY20.
FY20 has been the most successful year in the Company’s history. The year saw record iron ore shipments, successful completion of the disposal of 60% of Wodgina leading to the formation of the MARBL Joint Venture with Albemarle, significant progress made on our growth plans for iron ore in the Pilbara region, and record lithium spodumene production from Mt Marion. Most notably, however, the Company has continued to strengthen its unique identity and culture whilst successfully navigating the early stages of the COVID-19 pandemic.
The Committee is particularly pleased with the Company’s response to the COVID-19 pandemic. The Company moved very quickly in response to the pandemic; it determined the importance of ensuring its sites remained virus-free, as far as possible, by testing all staff prior to mobilisation to site, and quickly secured molecular-level PCR gold standard testing equipment capable of conducting approximately 8,000 tests per day. It also secured the delivery of scarce reagents and testing kits accredited by the Therapeutic Goods Administration, and for the equipment to be installed in two accredited laboratories in Perth. It established collection facilities in seven locations around Western Australia. These measures enabled the company to maintain employment levels during the pandemic and avoid any forced reductions as a result of the pandemic.
By taking these and other steps, the Company was able to ensure the risk of interruption to production was minimised as far as possible. In addition, the Company was also able to offer the testing service to others in the WA resource industry at cost, and in doing so the Company played a key role in enabling the resource industry in Western Australia to continue with minimal disruption over this period. Importantly, after an initial short stint of extended shifts, rosters were able to return to normal, further minimising the disruption to family life for its employees.
During the early stages of the pandemic, the Company took a number of additional steps to address the physical and mental health of its workers, and has since worked to continue the significant progress made to date.
The FY20 changes have been made while remaining cognisant of a very competitive executive labour market within the Western Australian resources industry.
Changes to Managing Director remuneration As noted in the FY19 Remuneration report, the Managing Director agreed to reduce his Fixed Annual Remuneration (FAR) to $1.2 million from $1.5 million in FY20. The result has been a net reduction in his realisable remuneration despite the ongoing strategic and financial success of the Company.
The Managing Director’s FAR is now close to the median of the Comparator Businesses selected by the Committee, rather than at the 75th percentile, with more remuneration ‘at risk’ and able to be earned only through performance (see Section 3.3 for further detail on the Comparator Businesses). To ensure the Comparator Businesses remain relevant for remuneration comparison purposes the Remuneration Committee reviewed its composition again in FY20, removing two companies, at the bottom and top end of the target filter range (revenue and enterprise value) and adding two others that fit more closely within the target filter range. Details of the revised Comparator Businesses are included in the body of the report.
In addition to the change in his FAR, the Company identified that the Managing Director’s Short Term Incentive (STI) opportunity in FY19 was well below that offered at Comparator Businesses. As advised in the FY19 Remuneration Report, in FY20 the STI opportunity for the Managing Director was increased from 50% to 100% of FAR, with any amounts declared under the STI programme above 50% of FAR settled in equity over the following two years (FY21 and FY22) subject to ongoing service and malus. The Managing Director’s STI Key Performance Indicators (KPIs) have also been reweighted such that financial KPI weights have almost doubled, to 40% of scorecard outcomes, up from 25%.

Mineral Resources Limited Directors' report 30 June 2020
Remuneration report (audited) (continued)
13
Changes to Divisional reporting structures To ensure we have the right level of focus to execute the large growth opportunities that lie ahead of us, we have changed the operating structure of MRL, aligning a Chief Executive with each of our core operating segments; Mining Services and Commodities. Mike Grey has been appointed Chief Executive, Mining Services, and Paul Brown has been appointed Chief Executive, Commodities. Mike’s responsibilities cover the full scope of the Company’s mining services, including CSI, Construction, PMI and Energy. In addition, Mike has responsibility for business development, focusing on ensuring we successfully deliver the major new resources projects currently under development. Paul Brown has been appointed Chief Executive, Commodities, reporting to the Managing Director. Paul will continue the focus that he has had on the safe and profitable operations of all of our mines over a number of years, and has also assumed responsibility for Health and Safety and Project Services (Exploration, Evaluation and Tenement Management) across the Group. Paul will oversee our planned mining operations expansion and growth, including opening up new mining areas in FY21 in the Pilbara and the Yilgarn. Changes to Divisional Chief Executive and Chief Financial Officer Short Term Incentives (STI) The Company identified that the level of STI opportunity offered to the Divisional Chief Executives and Chief Financial Officer in FY19 was well below the average offered at Comparator Businesses. As advised in the FY19 Remuneration Report, in FY20 the STI opportunity for KMP was increased from 40% to 80% of FAR. In addition, any amounts declared under the STI programme above 40% of FAR for the Divisional Chief Executives and Chief Financial Officer is settled in equity over the following two years (FY21 and FY22) subject to ongoing service and malus. Combined, these changes mean all KMP had a greater proportion of ‘at-risk’ pay as part of their total remuneration opportunity, delivered for alignment with shareholder interests, and accompanied by governance mechanisms for enhanced risk management and retention. Changes to Long Term Incentive (LTI) arrangements As noted in the FY19 Remuneration report, we have simplified the LTI plan while maintaining a focus on longer term, sustainable Return on Invested Capital (ROIC). We feel it is important to highlight that we measure ROIC on a post-tax basis, and the 12% ROIC hurdle is materially above the Company’s nominal post-tax Weighted Average Cost of Capital (WACC). After a review of alternative structures, the Company implemented the changes it outlined in the FY19 Remuneration report, with the adoption of a new scheme. The new scheme sees grants made to participants annually that will vest after four years, subject to the Company’s average ROIC exceeding the 12% hurdle through that period. At 12% to 18% the ROIC hurdle rates remain unchanged, recognising that rate reflects a long term requirement to achieve a sustainable return through commodity cycles. While the outstanding results achieved in FY20 are expected to underpin the average ROIC over the next few financial years, they represent an outcome of strategies implemented and executed over a number of years, and are an outcome of the innovative culture of this business.

14
Mineral Resources Limited
Directors' report
30 June 2020
Remuneration report (audited) (continued)
FY20 outcomes and alignment FY20 has been an exceptional year for the Company, with a record result for shareholders. The result is all the more exceptional given it was delivered despite the unprecedented business conditions created by the COVID19 pandemic. Due to the actions of management, Mineral Resources was able to not only maintain operations and continue to meet customer expectations, but the Company was also able to offer vital assistance to others in our sector to ensure production and delivery to end-customers continued unabated. In a period where redundancies and job uncertainty has been widespread, not one Mineral Resources position has been made redundant, indeed the Company had been able to expand its workforce over the past six months.
In such circumstances, the Committee is pleased that the incentive programs in place have assisted in delivering outstanding results for Shareholders.
Consistent with the design of the STI programme, a significant portion of rewards will be deferred and settled in equity to further align management and shareholder interests. Further detail of these outcomes can be found in Section 5 of the Remuneration Report.
In addition to the deferral and settlement via equity of a major portion of the STI plan, the majority of at-risk rewards available under the Company’s remuneration structure arise through the LTI plan, which is based on the Company’s ROIC performance. While ROIC for FY20 was an outstanding 49.6%, under the LTI plan adopted in FY20, KMP’s LTI will be awarded in full only if the four year average of ROIC exceeds 18%, with FY20 being the first of those four years. In other words, the LTI programme will make significant rewards to managers only if strong performance persists.
With respect to LTI grants made in previous years, the significant investments made in the Company’s lithium portfolio meant ROIC in FY19 was 9.7%. Under the LTI plan rules in place for FY19, this result saw no LTI grant for FY19. The Company’s LTI scheme for FY18 also did not vest in FY19. However, the average ROIC for FY19 and FY20 is 29.4% and as a result, Tranche 1 of the FY18 LTI award, suspended due to FY19’s ROIC being less than 12%, now vests, along with Tranche 2 of the FY18 LTI award.
Pleasingly, while many organisations have been laying off staff and furloughing workers with the support of government grants, our Company has continued to grow, taking on 300 staff since the beginning of January 2020. This is a 15% growth in the number of employees since December 2019, i.e. the worst period of the pandemic in Western Australia, with no positions made redundant as a result of the pandemic.
In conclusion, we are satisfied that the FY20 remuneration outcomes reflect and support the Company’s strategic and financial performance.
Our Chairman Peter Wade, newly appointed Head of Investor Relations, James Bruce, and I met with a number of Institutional Investors and Proxy Advisors over the last few months. It was pleasing to note at these sessions the level of support that the changes to our Remuneration arrangements, outlined above, has received; this feedback is sincerely appreciated, and we continue to value any further feedback you may have in this regard.
I invite you to review the full report laid out over the following pages, and thank you for your interest in our Company.
Yours faithfully
James McClements Lead Independent Non-Executive Director Chairman, Remuneration Committee

Mineral Resources Limited Directors' report 30 June 2020
Remuneration report (audited) (continued)
15
Remuneration report contents
This Remuneration Report forms part of the Directors’ Report for the year ended 30 June 2020 and has been audited in
accordance with section 300A of the Corporations Act 2001.
The report addresses the following key areas:
1. Key Management Personnel
2. Remuneration governance
3. Remuneration strategy
4. Remuneration framework for FY20
5. Remuneration outcomes for FY20
6. Key changes to remuneration for FY21
7. Summary of KMP employment conditions
8. KMP statutory remuneration schedules
9. Share rights granted, vested and potential future vesting
10. Equity instruments held by KMP
11. Transactions with related parties

Mineral Resources Limited Directors' report 30 June 2020
Remuneration report (audited) (continued)
16
1. Key Management Personnel Key Management Personnel (KMP) comprise those persons that have responsibility, authority and accountability for planning, directing and controlling the activities of the entity, directly or indirectly, including any director of that entity. In this report, a reference to an “Executive" or "Executives” is a reference to a KMP executive, including the Managing Director. The following table outlines the KMP of the Group during the whole of FY20 and up to the date of this report, unless otherwise stated: Executive KMP
Current
Chris Ellison Managing Director (MD)
Paul Brown Chief Executive – Commodities
Mike Grey Chief Executive – Mining Services
Mark Wilson Chief Financial Officer
Former
Rohan O’Grady Chief Operating Officer – Mining Services (Ceased employment on 13 September 2019)
Non-Executive KMP
Current
Peter Wade Non-Executive Chairman
Kelvin Flynn Non-Executive Director
James McClements Lead Independent Non-Executive Director
Xi Xi Non-Executive Director
2. Remuneration governance
2.1 Remuneration Committee Independence
The Remuneration Committee continued to be comprised solely of independent Non-Executive Directors:
James McClements, Committee Chair
Kelvin Flynn, Committee Member
The third position on the Remuneration Committee remains vacant following the departure last year of Tim Roberts, who has not yet been replaced on the Board. The intention is to appoint another member that will enhance the independence of the Committee and the search for the additional appointee remains underway. Until then, the Board is satisfied that the Remuneration Committee is independent and has sufficient expertise to undertake its mandate. 2.2 Role of the Remuneration Committee The Remuneration Committee advises the Board on KMP remuneration by performing the following functions:
(a) making recommendations to the Board on remuneration structure, practices, policy and quantum for CEO, KMP, and NEDs
(b) determining the eligibility and vesting of long-term incentive (LTI) awards; and (c) providing oversight of company diversity and gender pay equity and recommendations to the board on appropriate
targets. The Remuneration Committee convened regularly throughout FY20 and invited senior management and external consultants’ input as required. In addition, our Chairman, Head of Investor Relations, and the Chair of the Remuneration Committee conducted a number of engagements with Proxy Advisors and Institutional Investors in FY20 to assess feedback and obtain comments on their views relating to the remuneration levels and current structures.

Mineral Resources Limited Directors' report 30 June 2020
Remuneration report (audited) (continued)
17
2.3 External and independent advice As with previous years, the Remuneration Committee engaged the services of independent external consultants to provide insights on KMP remuneration trends, regulatory and governance updates and market data. No remuneration recommendations as defined in Section 9B of the Corporations Act 2001 were obtained during FY20. 3. Remuneration strategy
3.1 The context in which we set our remuneration strategy The remuneration framework is designed to help achieve the Company’s vision to be recognised as a great Australian company that:
is a leading provider of innovative and sustainable mining services;
provides innovative and low-cost solutions across the mining infrastructure supply chain;
operates with integrity and respect; and
works in partnership with our clients, our customers, our people and our community to achieve these objectives. To create wealth for shareholders, we task our management team with employing the capital entrusted to them to sustain attractive rates of return, that is, exceeding the long-term returns that could be achieved elsewhere at comparable levels of risk. The Board has approved a strategy to deliver on this objective comprising:
a core business as a mining services contractor;
an owner and operator of mining-related infrastructure;
an acquirer of significant profit share stakes in mineral projects with rights to operate the associated mines, for longer-term sustainability, higher capital efficiency and lower risk including from diversification;
recycling of capital; and
a flexible balance sheet to fund organic growth to its mining services and mining infrastructure businesses, while retaining a level of agility for opportunistic growth opportunities as they arise.
The ability to execute this strategy innovatively, sustainably and in a way that creates attractive returns for shareholders is highly dependent on the quality of MRL’s culture, management and workforce. The difficulty of attracting and retaining executives of the necessary calibre to realise the above vision and strategy varies depending on the current phase of Australia’s resources industry. Presently, industry demand for executive talent is strong. This requires the Company to have adequate and effective retention mechanisms in place (such as the newly introduced STI deferral) to ensure we maintain experienced and competent employees who are capable of innovating to promote growth that leads to attractive long-term rates of return. Mineral Resources’ requirement that each of its KMP be an outperformer in terms of innovation and agile thinking, is also reflected in the low ratio between CEO and direct report fixed remuneration. Long-term sustainable growth of the Company is promoted within the framework by the delivery of a significant portion of remuneration in equity, and equity holdings of the equivalent of at least one year’s FAR for KMP, assisting in aligning the senior leadership team’s interest with shareholders’ interests. 3.2 Remuneration principles The following principles guide the Company’s KMP remuneration decisions:
fairness and impartiality;
transparency;
promotion of a direct link between reward and performance;
encouraging retention of key personnel over the longer term;
alignment of employee, customer and shareholder interests;
incentivising behaviour that optimises return on shareholder capital;
flexibility to optimise returns via changes in investment strategy; and
prioritisation of MRL culture and behaviours that continue to promote safety, social and environmental responsibility, innovation and risk management.

Mineral Resources Limited Directors' report 30 June 2020
Remuneration report (audited) (continued)
18
3.3 Market position for remuneration The Company again conducted a review of its market position for KMP remuneration that included examination of common practice within comparable businesses, external advice and input from investors and their advisors. Changes introduced from FY20 resulted in fixed remuneration for the Managing Director targeted at the 50th percentile of comparable roles in Comparator Businesses (see below) while total remuneration, inclusive of fixed and at-risk remuneration, is targeted at the 75th percentile of Comparator Businesses. Comparator Businesses The Company’s business model is not typical of peers in the resource sector due to its dual-pronged business operations – first in providing mining services to resources companies and secondly in the ownership and management of resource tenements. It is also unusual in the level of cash reserves it retains, along with undrawn debt facilities, which are to be quickly called on to support strategic investments that improve shareholder returns and provide long-term sustainable returns. Therefore, in determining the amount and mix of remuneration to offer, the Board considers remuneration on offer in a broad group of ASX-listed companies of a comparable size in terms of enterprise value and revenue, with a particular focus on those in the commercial services and mining sectors (Comparator Businesses). Enterprise value provides a more complete valuation of a company than market capitalisation alone. The list of Comparator Businesses was reviewed in FY20 to ensure it remains relevant. As a result of this review, Oceana Gold Corporation Limited and Newcrest Mining Limited were removed from the list of Comparator Businesses used in FY20, with both lying at the extremes of the Comparator Businesses from a revenue and enterprise value perspective. In turn, Washington H. Soul Pattinson (ASX: SOL) an investment house with interests in energy, copper, gold and zinc mining and property, and NRW Holdings Ltd (ASX: NWH) a service provider to the resources and infrastructure industry sectors, have been added to the Comparator Businesses for FY20. The current Comparator Businesses therefore comprise:
ALS Limited Perenti Global Limited Downer EDI Limited
Evolution Mining Limited Iluka Resources Limited IGO Limited
Maca Limited New Hope Corporation Limited Northern Star Resources Limited
NRW Holdings Ltd OZ Minerals Limited Qube Holdings Ltd
Regis Resources Limited Resolute Mining Limited Saracen Mineral Holdings Limited
St Barbara Limited Sims Limited Washington H. Soul Pattinson
Whitehaven Coal Limited Worley Limited

Mineral Resources Limited Directors' report 30 June 2020
Remuneration report (audited) (continued)
19
4. Remuneration framework for FY20
4.1 Market position for remuneration The table below outlines the remuneration framework that applied in FY20.
Fixed remuneration At-risk remuneration
Element Salary, superannuation & other fixed benefits
Short-Term Incentive (STI) Long-Term Incentive (LTI)
Delivery format
Cash Share rights
Up to 40% of FAR (50% for MD) paid in
cash after the financial year
Portion of award over 40% of FAR (50% for MD) deferred
and awarded as Share Rights – the first half of which
vest 12 months, and the second half 24 months, after
grant date, subject to ongoing service and claw-
back provisions
Rights will vest, subject to performance, 4 years after the grant date
Performance measures
Personal, business unit and corporate KPIs Return on Invested Capital (ROIC)
Performance period
One year Vesting subject to four-year average ROIC performance over the performance period (Starting 1 July in financial year of grant)
Link to MRL strategy
Serves to attract high-calibre people and motivate them to deliver on the business’ immediate business objectives over a 12-month period
Recognises that we are a capital intensive business and management and shareholder wealth are created through achieving superior returns on capital deployed
The timeline below illustrates the timing of rewards under the FY20 remuneration arrangements for KMP. Details for each component are set out in section 4.3.
FY20 FY21 FY22 FY23 FY24
FAR (Salary, superannuation & fixed benefits)
Paid throughout the year
STI
Performance period (12 months)
STI less than 40% of FAR (50% for MD) paid
Aug 2020. Any portion of award over 40% of FAR (50% for MD) deferred to Aug. 2021 and Aug.
2022
Half of deferred portion vests Aug. 2021, subject to
ongoing service and claw-back
provisions. Number of shares awarded based on value of award divided by VWAP up to and
including to 30 June 2020
Half of deferred portion vests Aug 2022, subject to
ongoing service and claw-back
provisions. Number of shares awarded based on value of award divided by VWAP up to and including 30 June
2020
LTI
Total Performance Period (4 years)
LTI rights granted July 2019. Number of shares awarded based on value of award divided by VWAP up to and including 1 July
2020
Aug 2023: Portion of LTI rights vest, subject
to 4 year average ROIC and continuous
service

Mineral Resources Limited Directors' report 30 June 2020
Remuneration report (audited) (continued)
20
4.2 Remuneration mix The mix of executive KMP fixed, short and long-term remuneration reflects the Company’s remuneration strategy of:
Having substantial amounts of pay subject to service and performance so that remuneration can only be maximised by sustained high levels of performance over rolling 4-year periods.
Rewarding strong performance by paying a significant portion in equity, to reduce cash remuneration costs, align executive and shareholder interests, and enable the enactment of malus provisions if Mineral Resources’ values of integrity and respect are not upheld.
The table below summarises the ‘on-target’ remuneration mix, with ‘on target being two thirds of maximum entitlement, applicable in FY20 for KMP.
* FAR for the purpose of the Remuneration Mix comprises base FAR and other long-term benefits, and excludes one-off benefits such as relocation allowances (refer to the Remuneration tables in section 8 for these details). 4.3 Key components of remuneration The tables below summarise the key components of executive KMP remuneration for FY20.
Fixed Annual Reward
Composition Fixed Annual Reward (FAR) comprises salary, superannuation and other fixed elements of remuneration such as vehicle allowances.
Determination Fixed remuneration is determined based on market comparisons for similar positions, taking into account the experience and skills of the manager involved.
Review FAR is determined on appointment and reviewed annually.
35% 40% 39%
25%22% 23%
40% 38% 38%
0%
20%
40%
60%
80%
100%
120%
On target On target On target
MD CFO Chief Executives
Remuneration Mix
FAR* STI LTI

Mineral Resources Limited Directors' report 30 June 2020
Remuneration report (audited) (continued)
21
Short-Term Incentive The key elements of the FY20 STI plan are as follows:
Purpose Focus participants on delivery of business objectives over a 12-month period.
Participation All KMP
Opportunity The STI opportunity is targeted at 100% of FAR for the MD and 80% for other KMP.
This represents an increase from FY19, to bring executive STI opportunities in line with Comparator Businesses.
Performance period Performance is measured per financial year (1 July to 30 June).
Performance measures
Performance measure and link to remuneration framework:
Safety, governance, ESG: Safety is part of MRL’s DNA. It is how we do things, and is embedded into our systems and processes. Our continuing success depends on our people and our ability to deliver quality results safely for our customers, our shareholders and each other. Governance and ESG are critical drivers of shareholder value
Strategic growth options: Growth through acquisitions and transactions that maximise value creation for shareholders while maintaining a strong balance sheet
Operational efficiency and performance measures:
MRL’s roots as a mining services contractor foster an environment focused on delivery and innovation. This culture drives industry-leading performance in efficiency and cost management
Financial management and performance targets: Ensuring MRL’s financial position is adequate to support the growth agenda will set MRL up for future success
Organisational culture and development: Providing a harmonious and nurturing environment will allow our employees to reach their full potential.
Individual performance measures are designed to ensure alignment to business plans and to stretch levels of performance.
The precise mix of metrics selected for each KMP is configured to ensure they are linked to and measurable against business outcomes that the KMP can influence, so that the assessment is both relevant and fair.
Example of metric used:
Total Reported Injury Frequency Rate (TRIFR), Lost Time Injury Frequency Rate (LTIFR), Client feedback, Investor Feedback
Identification and execution of investment transactions that increase MRL’s reserves or strengthen its balance sheet, and exceed the Group’s target ROIC
Shipped tonnes and cost per tonne shipped
NPAT, Net Cash
Retention rate for key staff, Innovation and gender diversity
Exercise of discretion The Board has discretion, taking into account recommendations from the Remuneration Committee, to adjust overall STI awards or an individual’s final STI award. This discretion will be exercised in the case of extraordinary events, exceptional circumstances/business performance and/or individuals’ scorecard outcomes.

Mineral Resources Limited Directors' report 30 June 2020
Remuneration report (audited) (continued)
22
Payment For payments made in relation to FY20 onwards, awards made under the STI plan to KMP that exceed 50% of FAR for the Managing Director or 40% of FAR for other KMP, are deferred in the form of MRL shares that vest equally one and two years following the grant, subject to continued service and the application of clawback provisions. The quantity of MRL shares provided for each deferred portion is based on the deferred value for each financial year divided by the Volume Weighted Average Price for the five trading days up to and including 30 June 2020.
Rights on termination To be eligible for payment, a participant in the STI must be employed by the Company on the date of payment and on the date at which, for amounts that exceed 50% of FAR for the Managing Director or 40% of FAR for other KMP, are deferred by way of a grant of MRL shares, subject to the application of the clawback provisions mentioned below. KMP whose employment is terminated before the date of payment/grant of shares for whatever reason are not eligible for any STI payment/grant of shares.
Clawback and malus policy
The Board may, at its discretion, reduce or rescind any awards made under the STI for a period of up to two years following cash payment/grant of shares in the event that it determines that the cash payment/grant of shares has been made inappropriately, including in the instance of fraud, dishonesty, breach of duties, or misstatement or manipulation of financial information.

Mineral Resources Limited Directors' report 30 June 2020
Remuneration report (audited) (continued)
23
Long-Term Incentive The key elements of the FY20 LTI plan are as follows:
Purpose To focus KMP on:
achieving a high and sustained ROIC over the longer term, being a total of four years, including the current financial year (Grant Year)
encouraging agility and entrepreneurialism to seize opportunities for higher returns, contingent on rapid capital deployment within relatively short timeframes
alignment with shareholders’ interests through share rights that do not vest until the fourth financial year after the Grant Year.
Payment vehicle LTI grants provide rights to MRL shares (Rights). Subject to the Performance Measures mentioned below, Rights vest in the fourth financial year after the Grant Year. Participants have up until the fifteenth anniversary of the Grant Date (Expiry Date) to exercise Rights (convert Rights to MRL Shares) with no exercise price being payable. Any vested Rights not previously exercised are automatically exercised at the Expiry Date.
Opportunity The maximum LTI grant opportunity for the Managing Director is equal to 180% of FAR and up to 150% of FAR for other KMP. In absolute terms, the FY20 LTI opportunity for the MD is lower than that in FY19, due to the 20% reduction in FAR implemented at the start of the year.
LTI grant value An amount equal to the maximum LTI opportunity is granted to each LTI participant annually; being the Grant Year (e.g. FY20). Vesting takes place three full financial years after the Grant Year (e.g. following the end of FY23 for the FY20 award) subject to the Performance measure mentioned below. The number of Rights to be issued is determined using the following formula:
LTI Rights issued = (FAR x Maximum LTI Opportunity)/VWAP Where ‘VWAP’ is the five-day Volume Weighted Average Price to the Grant date (in the case of the FY20 LTIP, 1 July 2019).
Performance Period Performance is measured over four consecutive years, being the Grant Year and the following three financial years. For grants made in FY20, the Performance Period is FY20 to FY23 inclusive, with Rights vesting in FY24.
Performance measure
The number of Rights that vest is subject to the four-year average ROIC enjoyed by the Company over the Performance Period. The four-year average ROIC is determined as follows:
Four-year average ROIC = Cumulative 4 year NOPAT/Cumulative 4 year Invested Capital
Further discussion of the calculation of ROIC is included in Section 4.4.
Vesting hurdle The amount of Rights that vest at the end of the Performance Period is determined by reference to the following hurdles:
4 year average ROIC % of maximum achievement LTI opportunity
Less than 12% Nil Between 12% and 18% Pro-rata between 67% & 100%
18%+ 100%
The selection of 12% ROIC, being an after tax measure, as the minimum hurdle below which the LTI is zero, is materially above the Company’s nominal post-tax Weighted Average Cost of Capital and ensures that value destroying performance is not rewarded – i.e. that KMP’s focus is on achieving returns for shareholders in excess of the Company’s cost of capital.

Mineral Resources Limited Directors' report 30 June 2020
Remuneration report (audited) (continued)
24
Vesting period All Rights vest, subject to performance and continued service, four years after the grant date.
Holding lock No holding lock applies to Rights that vest under the FY20 LTI plan, as Rights vest only at the end of the Performance Period, provided the Performance Measures has been achieved.
Dividends No dividends are received by executives on any unvested Performance Rights. To ensure alignment between shareholder and executive interests, each vested right entitles executives to one plus an additional number of Shares equal in value to the dividends paid on an MRL Share over the period from the Grant Date of the Share Rights to the date of exercise. Without this entitlement, executives might be motivated to seek growth over dividend payments.
Clawback and malus Policy
The Board has the discretion to lapse awards that are on foot or claw back previously vested LTI awards in the event that the Board concludes that such awards should not vest or should not have vested due to: (a) fraud, dishonesty or fundamental breach of duties (including misstatement or manipulation of financial information) of any person; or (b) the intentional or inadvertent conduct of any person that the Board determines resulted in an unfair benefit being obtained by a participant.
Hedging Hedging, or the use of derivatives such as collars, caps or similar products in relation to MRL securities, including vested shares or unvested Rights, allocated under MRL incentive schemes, is strictly prohibited, as is the KMP providing share enlistments/Rights as security for loans that may result in margin calls.
Cessation of employment
Cessation of employment prior to the Vesting date will result in automatic forfeiture of all unvested rights unless the Board exercises its discretion (e.g. for health reasons or Change of Control as set out below).
Change of Control / Resignation / Retirement in the event of ill health
In the event of a change of control, resignation or retirement due to ill health, the Board may exercise its discretion to determining whether to vest any granted but unvested MRL share Rights.
Board discretion The Board retains the discretion to amend, vary, terminate or suspend the LTI Plan at any time. Any such variation, amendment, termination or suspension is not to adversely affect or prejudice rights of LTI participants holding MRL shares or Rights at that time.
4.4 LTI performance measures Calculating Return on Capital Employed (ROIC) ROIC is measured at a Group consolidated level, on the following basis: ROIC = NOPAT/Invested Capital Where:
Net Operating Profit After Tax (NOPAT) is calculated as the Company’s statutory Earnings Before Interest and Taxes (EBIT) for the year, adjusted to remove the impact of changes to accounting policies (such as the treatment of operating leases or fair value adjustments for listed investments) whether favourable or unfavourable, and after applying the prevailing corporate tax rate. Profits, arising on the monetisation of investments such as on the formation of joint ventures or the divestment of portion of the Group’s operations, are a standard part of the Group’s strategy and are therefore included in NOPAT. Invested Capital is calculated as the sum of Net Assets and Net Interest Bearing Debt at balance date adjusted for accumulative accounting policy adjustments.

Mineral Resources Limited Directors' report 30 June 2020
Remuneration report (audited) (continued)
25
Treatment of cash balances for the purposes of calculating ROIC Strategic cash is defined as cash, over and above normal operational requirements, retained for future opportunities. The Board nominated strategic cash holdings ($100 million) is excluded from the calculation of Invested Capital on the basis that retention of a strong cash balance, and available borrowing facilities, are required to enable strategic growth and investment. As retention of strategic cash holdings is a Board decision that senior executives and KMP are unable to influence, the Board has determined it is reasonable not to require KMP to earn a return on these facilities. The quantity of the strategic cash holding will be reviewed in FY21 as the Board reviews the strategic growth plans for the business. Why ROIC has been chosen as the sole measure to determine LTI awards The Remuneration Committee continues to be of the view that:
(a) ROIC remains the most appropriate measure for evaluating entitlement to an LTI award, as: (i) it provides a clear and unambiguous link between Company performance and the creation of shareholder value; (ii) it is the key value driver considered when management decides when and how to invest capital; and (iii) the financial return earned on capital deployed is a true measure of value creation and a long-term
representation of Company value. (b) MRL continues to be a highly capital intensive business. As such, it is vital that KMP ensure that maximum returns
are generated on invested capital, which again supports utilisation of ROIC as the most appropriate measure for assessing senior executives and KMPs’ entitlement to LTI.
(c) Any additional measure would dilute KMP’s focus on what is viewed by the Board as the Company’s key objective – i.e. the effective deployment of capital to ensure creation of long-term wealth.
(d) Total shareholder return is already an implicit hurdle, due to the LTI being delivered as Rights, with dividend entitlements provided on vested equity. If KMP increase the share price and maintain dividends, like shareholders, they benefit via an increase in intrinsic value of the grant at vesting.
(e) ROIC is a measure that is directly controlled by KMP and is not influenced by market sentiment which can result in alternate measures, such as Total Shareholder Returns (TSR), delivering volatile outcomes.
The use of ROIC and the target of 12%, materially above the Company’s post-tax WACC, are designed to encourage strong longer-term performance of the Company.

Mineral Resources Limited Directors' report 30 June 2020
Remuneration report (audited) (continued)
26
ROIC for FY20 was 49.6%. This result was boosted by completion of the partial disposal of Wodgina during the year. The capital investment made in developing Wodgina, and the associated impact on Wodgina, was incurred in the period FY17 to FY20, with the majority of spend incurred in FY19.
$ millions FY16 FY17 FY18 FY19 FY20
Actual Actual Actual Actual Actual
NOPAT:
EBITDA 278.2 473.5 575.2 385.9 2,006.1
Normalised (a)
-
- (68.5) 46.8 35.4
EBITDA for ROIC 278.2 473.5 506.7 432.7 2,041.5
Less impairments (186.2) (16.7) (65.4) (9.8) (285.8)
Less depreciation and amortisation (134.0) (160.2) (112.9) (108.6) (193.6)
Net Operating Profit Before Tax (42.0) 296.5 328.5 314.2 1,562.1
Less tax at 30% 12.6 (89.0) (98.5) (94.3) (468.7)
NOPAT (29.4) 207.6 229.9 220.0 1,093.4
Invested Capital:
Net assets (per balance sheet) 1,008.7 1,132.1 1,304.6 1,380.2 2,295.6
Normalised (cumulative, net of tax) (a)
-
- (47.9) (14.8) 6.9
Net Assets for ROIC 1,008.7 1,132.1 1,256.6 1,365.4 2,302.5
Net Debt 136.1 - 98.9 997.1 -
Total invested capital 1,144.7 1,132.1 1,355.5 2,362.5 2,302.5
Strategic cash holding (100.0) (100.0) (100.0) (100.0) (100.0)
Net Invested Capital 1,044.7 1,032.1 1,255.5 2,262.5 2,202.5
ROIC % -2.8% 20.1% 18.3% 9.7% 49.6%
(a) Normalised for the impact of matters outside of the control of management, such as gains/losses on strategic investments where such investments are held at the discretion of the Board. Adjustments are also made to operating profits for the effect of new/revised accounting standards, where these adjustments are outside of management’s day-to-day operational control.

Mineral Resources Limited Directors' report 30 June 2020
Remuneration report (audited) (continued)
27
The Company’s focus on disciplined investment has, since listing, delivered outstanding returns on the capital invested in it, and in turn delivered outstanding returns for its shareholders.
5. Remuneration outcomes for FY20 5.1 Summary of performance FY20 has been an outstanding year for the Group. In particular, the Board was pleased with the foresight, agility and responsiveness demonstrated by Management in responding to the risk of COVID-19 on our workforce, production and our communities, and the reliability of services and production to our customers. This response enabled the Company to continue to operate its sites with significantly reduced risk of disruption, allowing it to continue to employ its workforce and ensure its employees would continue to bring home a pay packet during a period of significant economic uncertainty.
Examples include:
Securing the early import of four top quality USA manufactured PCR testing machines to swab screen our FIFO workers to protect our workers their families and the community from any virus spread;
Establishing accredited testing capabilities for up to 47,000 tests per week, with same-day turnaround, with collection facilities in multiple locations within Western Australia. We also provided this service at cost to other resources companies which were not able to secure the in-demand machines, reducing the risk to those companies;
Ensuring additional focus on the mental and physical wellbeing of employees during the COVID-19 pandemic with numerous programs introduced over this period such as;
o employing a full-time in-house psychologist o conducting welfare checks for any workers who were required to self-isolate or quarantine o participated in the Lifeline WA/CME Focus Groups to develop a mental health program for FIFO
workers o holding several community events including R U OK Day, Mental Health Month, Movember and the
Blue Tree Project o As part of our partnership with the West Coast Eagles Australian Football League (AFL) Team, we
recruited some of its coaching crew to join our workers on site on their FIFO rosters, and provide one-on-one motivation and advice on personal health, nutrition and wellbeing. This was done while the AFL season was suspended due to COVID-19.
Target 12%
Max Target 18%
-10%
0%
10%
20%
30%
40%
50%
60%
2007 2008 2009 2010 2011 2012 2013 2014 2015 2016 2017 2018 2019 2020
ROIC since listing (%)
4-yr Rolling Ave ROIC Annual ROIC Target Max Target

Mineral Resources Limited Directors' report 30 June 2020
Remuneration report (audited) (continued)
28
Other highlights included:
5.1.1 Safety, Governance and Sustainability1 The Company continued to drive safety improvements throughout the business, consistent with its record of being amongst the safest companies in its industry. It also made significant progress through the year with its sustainability agenda.
Total Recordable Injury Frequency Rate (TRIFR) of 3.29 as compared to 3.99 in the prior year an improvement insafety performance of 18% year-on-year
Lost Time Injury Frequency Rate (LTIFR) of 0.00 - an improvement from 0.12 in prior year
Development of a Sustainability Policy, Human Rights Policy, Anti-Bribery and Corruption Policy and Supplier Codeof Conduct
Establishment of a cross functional Sustainability Working Group to support and advise the business with themanagement and monitoring of key sustainability topics
Rollout of the Code of Conduct and Business Integrity e-learning training programme across the business
Completion of a climate-related risk and opportunity identification and assessment exercise based on theRecommendations of the Taskforce on Climate Related Financial Disclosures (TCFD)
Development of a sustainable procurement and modern slavery screening program to meet the requirements of theModern Slavery Act, 2018 (Cth)
Community contributions increased by 30% from prior year to $2.6 million.
1 LTIFR, TRIFR, and Community Contributions are currently undergoing external assurance by accounting firm Ernst and Young. Assured numbers will be included in the FY20 Sustainability Report to be published with the Annual Report in October 2020
5.1.2 Strategic growth Over the course of the year a new strategy was developed for the Company’s operations in the Yilgarn region. This strategy resulted in the decision to target an increase in production in iron ore to 11 million tonnes per annum out of the Group’s operations at Koolyanobbing. By year end, this operation had achieved this annualised rate of production and shipping. This assisted in providing an increase in iron ore shipments of 33% year-on-year to a record 14.1million tonnes.
In addition to the record Mining Services growth from Koolyanobbing ramp-up, the Company achieved:
Higher tonnes in existing external contracts, and two new external contracts won in FY20, resulting in an increase inMining Services contract volumes of 65% year-on-year
An increase in Mt Marion spodumene shipments up 8% to 394,000 dry metric tonnes.
5.1.3 Financial management and performance The Company achieved a number of record financial milestones during the financial year, including:
Revenue of $2.1 billion, up 41% year-on-year
EBITDA of $2.0 billion, including the successful completion of the partial sale of Wodgina and the formation of theMARBL Joint Venture with Albemarle
Underlying EBITDA of $765 million, up 77% year-on-year
Cash at bank $1.5 billion, with net cash on hand of $231 million
ROIC of 49.6%
5.1.4 Organisational culture and development
A key element of employee attraction and retention is workplace culture; the Company embraced the “We aredifferent” expression to express the ‘can do’ attitude and capabilities of the organisation
MRL is invested in creating and maintaining an inclusive, inspiring and high-performing workplace enabled by asupportive culture; these efforts have created a greater number of clearer succession options throughout thebusiness
Recruitment efforts lead to a 47% increase in apprentices compared to the prior year, with a substantial numberbeing second generation MRL employees
MRL has a dedicated General Manager for Culture and Performance, who reports to the Managing Director.

Mineral Resources Limited Directors' report 30 June 2020
Remuneration report (audited) (continued)
29
A summary of the Group’s financial performance over the past five years is set out in the tables below. The relationship between the Group’s financial performance, return to shareholders and KMP remuneration reflects the direct correlation between financial performance, shareholder value creation and executive remuneration.
Financial Summary ($millions unless otherwise stated) 2016 2017 2018 2019 2020
Earnings
Revenue 1,178 1,458 1,624 1,512 2,125
EBITDA 278 473 575 386 2,006
NPAT (26) 201 272 165 1,002
Return on Revenue -2% 14% 17% 11% 47%
Return on Equity -3% 18% 21% 12% 44%
ROIC -2.8% 20.1% 18.3% 9.7% 49.6%
Diluted EPS (cents/share) (13.31) 107.66 145.30 87.09 532.96
Financial Year Ended 30 June 2016 2017 2018 2019 2020
Final dividend for the preceding financial year 0.1500 0.2100 0.3300 0.4000 0.7700
Interim dividend for the current financial year 0.0850 0.2100 0.2500 0.1300 0.2300
Total dividend paid 0.2350 0.4200 0.5800 0.5300 1.0000
Share price 8.31 10.85 16.00 14.98 21.17
Total Shareholder Return (TSR) (cumulative) 10.38 13.34 19.07 18.58 25.31
-
50
100
150
200
250
300
350
400
450
Jul 20
15
Jan
20
16
Jul 20
16
Jan
20
17
Jul 20
17
Jan
20
18
Jul 20
18
Jan
20
19
Jul 20
19
Jan
20
20
MRL Share Price PerformanceTotal Shareholder Returns5 Years to 30 June 2020
Comparator Businesses - Median MRL ASX 300 Resources ASX 300

Mineral Resources Limited Directors' report 30 June 2020
Remuneration report (audited) (continued)
30
5.2 STI performance outcomes KMP individual performance outcomes In FY20 the weighting of financial to non-financial metrics was adjusted in response to investor feedback that significant bonuses could be paid in years where performance on financial measures is suboptimal. The tables below summarise the STI performance outcomes for KMP for FY20. Managing Director
STI element Weight Performance Comments
Threshold Target Max
Safety, governance and ESG
20%
Continued delivery of better than industry safety performance, although at 3.29 TRIFR exceeds target, a 0 LTIFR is a positive lead indicator. While TRIFR still requires increased focus, the proactive
and effective COVID-19 response, resulting in improved safety, wellbeing and financial security of our workforce and increasing safety outcomes for the industry by means on making testing
available for all in the industry on a non-profit basis was viewed favorably by the Remuneration Committee.
Rating 16 out of 20
Strategic growth 20%
Restructured and completed Albemarle transaction, other deals
positioning MRL for future growth including increased resource base. Continued growth in Mining Services business
Rating 20 out of 20
Financial management performance
40%
Strong outperformance driven by growth in external mining services tonnes, record iron ore production, record production at Mt Marion in
a soft market, strong cost management
Rating 40 out of 40
Organisational culture and development
20%
Retention of key staff, supporting continued strengthening of culture.
Positive impact on site culture during COVID-19 through employment of third party professionals including AFL coaching staff
and comedians. Introduction of internal clinical psychological capability to promote mental health programme. Introduction of new
leadership and culture development programme
Rating 20 out of 20
Total 100% The Remuneration Committee determined that the MD’s STI for FY20 would be set at 94% of his maximum opportunity.
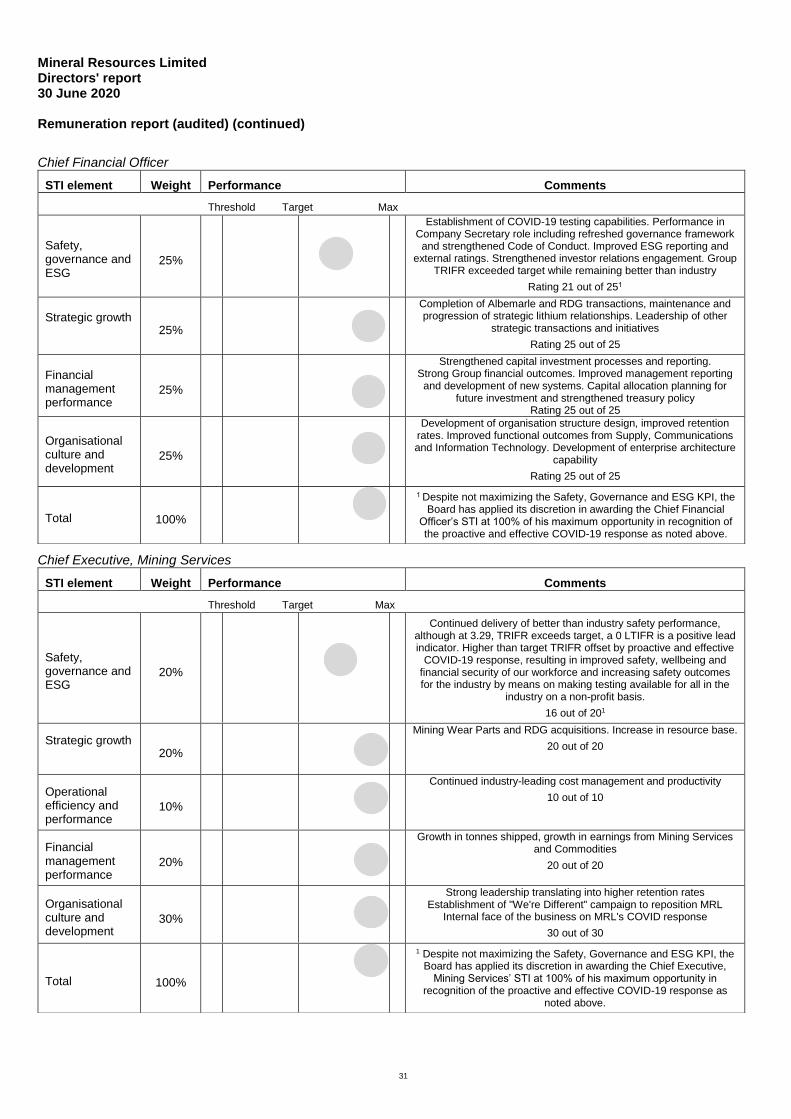
Mineral Resources Limited Directors' report 30 June 2020
Remuneration report (audited) (continued)
31
Chief Financial Officer
STI element Weight Performance Comments
Threshold Target Max
Safety, governance and ESG
25%
Establishment of COVID-19 testing capabilities. Performance in Company Secretary role including refreshed governance framework and strengthened Code of Conduct. Improved ESG reporting and
external ratings. Strengthened investor relations engagement. Group TRIFR exceeded target while remaining better than industry
Rating 21 out of 251
Strategic growth 25%
Completion of Albemarle and RDG transactions, maintenance and progression of strategic lithium relationships. Leadership of other
strategic transactions and initiatives
Rating 25 out of 25
Financial management performance
25%
Strengthened capital investment processes and reporting. Strong Group financial outcomes. Improved management reporting and development of new systems. Capital allocation planning for
future investment and strengthened treasury policy Rating 25 out of 25
Organisational culture and development
25%
Development of organisation structure design, improved retention rates. Improved functional outcomes from Supply, Communications and Information Technology. Development of enterprise architecture
capability
Rating 25 out of 25
Total 100%
1 Despite not maximizing the Safety, Governance and ESG KPI, the Board has applied its discretion in awarding the Chief Financial
Officer’s STI at 100% of his maximum opportunity in recognition of the proactive and effective COVID-19 response as noted above.
Chief Executive, Mining Services
STI element Weight Performance Comments
Threshold Target Max
Safety, governance and ESG
20%
Continued delivery of better than industry safety performance, although at 3.29, TRIFR exceeds target, a 0 LTIFR is a positive lead indicator. Higher than target TRIFR offset by proactive and effective
COVID-19 response, resulting in improved safety, wellbeing and financial security of our workforce and increasing safety outcomes for the industry by means on making testing available for all in the
industry on a non-profit basis.
16 out of 201
Strategic growth 20%
Mining Wear Parts and RDG acquisitions. Increase in resource base.
20 out of 20
Operational efficiency and performance
10%
Continued industry-leading cost management and productivity
10 out of 10
Financial management performance
20%
Growth in tonnes shipped, growth in earnings from Mining Services and Commodities
20 out of 20
Organisational culture and development
30%
Strong leadership translating into higher retention rates Establishment of "We're Different" campaign to reposition MRL
Internal face of the business on MRL's COVID response
30 out of 30
Total 100%
1 Despite not maximizing the Safety, Governance and ESG KPI, the Board has applied its discretion in awarding the Chief Executive,
Mining Services’ STI at 100% of his maximum opportunity in recognition of the proactive and effective COVID-19 response as
noted above.

Mineral Resources Limited Directors' report 30 June 2020
Remuneration report (audited) (continued)
32
Chief Executive, Commodities
STI element Weight Performance Comments
Threshold Target Max
Safety, governance and ESG
20%
Continued delivery of better than industry safety performance although at 3.29 TRIFR exceeds target, a 0 LTIFR is a positive lead indicator. Higher than target TRIFR offset by and effective COVID-19
response, resulting in improved safety, wellbeing and financial security of our workforce and increasing safety outcomes for the
industry by means on making testing available for all in the industry on a non-profit basis.
16 out of 201
Strategic growth
20%
Developed Yilgarn iron ore strategy, driving substantial tonnes
increase at Koolyanobbing. Improved efficiency and performance at Mt Marion. Continued strong performance at Iron Valley
20 out of 20
Operational efficiency and performance
10%
Continued strong performance across the mine sites and the
haulage contracts. Plant management adapted to drive greater efficiencies and utilisation
10 out of 10
Financial management performance
20%
Strong cost management on portfolio. Substantial increase in tonnages driving revenue improvement
20 out of 20
Organisational culture and development
30%
Strong leadership and team development; development of new training programmes including second generation MRL employees
30 out of 30
Total 100%
1 Despite not maximizing the Safety, Governance and ESG KPI, the
Board has applied its discretion in awarding the Chief Executive, Commodities’ STI at 100% of his maximum opportunity in
recognition of the proactive and effective COVID-19 response as noted above.
5.2.1 STI Performance Outcomes: FY20 grant While substantial weight is given to the scorecard results as outlined above in determining STI outcomes, consistent with the rules of the STI programme, the Board has discretion to adjust STI awards in the case of extraordinary events or circumstances. Reflecting on the extraordinary outcomes achieved in all areas of the business in FY20, the Remuneration Committee recommended, and the Board Accepted, that the STI award to the CFO and the Divisional Chief Executives be at the maximum of their STI opportunity, being 80% of their FAR In making this recommendation, the Remuneration Committee took into account, and the Board accepted, the following:
business performance throughout FY20 was outstanding in each of the key focus areas, as outlined previously in this Report,
that through their actions, management were able to not only retain the existing workforce, they grew employee numbers, during the biggest decline in GDP in recent history, and
the extraordinary lengths to which management went to avoid the potentially devastatingly adverse impacts from COVID-19. These measures benefitted not only the Company’s operations, they also contributed towards the overall ongoing success of the Western Australian resource and extractives industries.
5.3 LTI performance outcomes: FY20 grant Consistent with the redesigned LTI programme, a grant equal to the maximum LTI opportunity has been made to FY20 plan participants. The LTI awards will vest in early FY24 with the amount vesting dependent on the Company’s average ROIC performance over the four year period FY20 to FY23. Where average ROIC is less than 12% no LTI award will vest. Where average annual ROIC is between 12% and 18% over the four year period the LTI will vest pro-rata from 67% to 100% of the LTI grant. Where average annual ROIC is greater than 18%, 100% of the LTI grant will vest.

Mineral Resources Limited Directors' report 30 June 2020
Remuneration report (audited) (continued)
33
5.4 LTI performance outcomes: earlier grants on-foot FY17 Grant Although FY19’s ROIC was less than 12%, the average ROIC over FY18 and FY19 was 12.8%. Therefore, a total of 89,910 MRL shares vested on 22 August 2019, representing the third and final tranche of MRL share rights granted under the FY17 LTI scheme. Of the current KMP, only the Managing Director was eligible to receive an award under this scheme. FY18 Grant Due to FY19’s ROIC being less than 12%, a total of 56,052 MRL shares, representing the first tranche of MRL share rights granted under the FY18 LTI scheme, became a Suspended Tranche subject to Performance Hurdle testing in FY20 and is eligible to vest in August 2020, along with Tranche 2 of the FY18 LTI scheme. With FY20’s ROIC being 49.6%, the average ROIC for FY19 and FY20 is 29.4%. Therefore Tranche 1 (56,052 MRL share rights) vest on 19 August 2020. In addition Tranche 2 (56,052 MRL share rights) will vest due to FY20 ROIC exceeding 12%. Vested shares are subject to a holding lock until August 2021. The third tranche will vest in August 2021 based on ROIC performance in FY21. FY19 Grant As FY19’s ROIC was less than 12%, there was no LTI grant for FY19.

Mineral Resources Limited Directors' report 30 June 2020
Remuneration report (audited) (continued)
34
5.5 Remuneration outcomes schedules The following tables provide a summary of remuneration received by KMP during the year, which may be useful in understanding current year pay and alignment with performance. These remuneration outcomes tables differ from the statutory remuneration tables in Section 8 which are prepared in accordance with Australian Accounting Standards.
FY20 FAR
(cash)4 STI cash bonus5
LTI vesting6
NED fees (shares)7
Other benefits8 Total
LTI vesting share price
growth9
Total including share price
growth
$ $ $ $ $ $ $ $
Non-Executive Directors
Peter Wade 125,000 - - 125,000 23,750 273,750 - 273,750
Kelvin Flynn 70,000 - - 70,000 13,300 153,300 - 153,300
James McClements 70,000 - - 70,000 13,300 153,300 - 153,300
Xi Xi 83,300 - - 70,000 - 153,300 - 153,300
Executive Director
Chris Ellison 1,200,000 600,000 1,762,738 - 52,583 3,615,321 77,015 3,692,336
Other Executives
Current1
Michael Grey 824,038 340,000 - - 68,409 1,232,447 - 1,232,447
Mark Wilson 937,019 380,000 - - 140,809 1,457,828 - 1,457,828
Paul Brown2 350,000 140,000 - - 22,753 512,753 - 512,753
Former
Rohan O'Grady3 148,077 - - - 24,931 173,008 - 173,008
Total 3,807,434 1,460,000 1,762,738 335,000 359,835 7,725,007 77,015 7,802,022
Current KMP subtotal 3,659,357 1,460,000 1,762,738 335,000 334,904 7,551,999 77,015 7,629,014
Former KMP subtotal 148,077 - - - 24,931 173,008 - 173,008
Total 3,807,434 1,460,000 1,762,738 335,000 359,835 7,725,007 77,015 7,802,022 1 Current as at the date of this Remuneration Report (19 August 2020).
2 Paul Brown regarded as KMP with effect from 1 January 2020. Remuneration disclosed is for the period 1 January 2020 to 30 June 2020. 3 Rohan O'Grady resigned as Chief Operating Officer - Construction & Development on 13 September 2019. Remuneration disclosed is for the period 1 July 2019 to 13 September 2019. 4 FAR is excluding superannuation contributions, which is reported within 'Other Benefits'
5 40% of the FY20 STI plan to KMP is paid in cash (50% for the Managing Director) and relates to the performance during FY20.
6 LTI awards that have vested during FY20, calculated as the number of rights vested multiplied by the face value at grant date. Vested shares may still be subject to trading restrictions and clawback provisions. 7 Equity component of Non-Executive Directors' (NED) remuneration. NED fees continue to be paid 50% in cash and 50% in MIN shares. Remuneration disclosed relates to the performance during FY20. 8 Other Benefits relate to non-monetary benefits, superannuation and termination benefits that are awarded for performance during FY20 or have vested during FY20. 9 The ‘share price growth’ amount is equal to the number of rights vested multiplied by the increase in the MIN share price over the period from grant date to vesting date.

Mineral Resources Limited Directors' report 30 June 2020
Remuneration report (audited) (continued)
35
FY19 FAR
(cash)9 STI cash bonus10
LTI vesting11
NED fees (shares)12
Other benefits13 Total
LTI vesting share price
growth14
Total including share price
growth
$ $ $ $ $ $ $ $
Non-Executive Directors
Current1
Peter Wade 125,000 - - 125,000 23,750 273,750 - 273,750
Kelvin Flynn 70,000 - - 70,000 13,300 153,300 - 153,300
James McClements 70,000 - - 70,000 13,300 153,300 - 153,300
Xi Xi 83,300 - - 70,000 - 153,300 - 153,300
Former
Tim Roberts2 65,192 - - 65,192 12,387 142,771 - 142,771
Executive Director
Chris Ellison 1,500,000 585,000 1,762,737 - 88,967 3,936,704 304,230 4,240,934
Other Executives
Current1
Michael Grey3 107,692 35,863 - - - 143,555 - 143,555
Rohan O'Grady4 535,769 154,615 - - 19,235 709,619 - 709,619
Mark Wilson5 916,346 250,913 - - 302,635 1,469,894 - 1,469,894
Former
Bruce Goulds6 656,963 - 3,382,424 - 830,266 4,869,653 484,419 5,354,072
Danny McCarthy7 588,216 - 1,150,937 - 596,060 2,335,213 249,940 2,585,153
Scott Winter8 463,286 - - - 365,399 828,685 - 828,685
Total 5,181,764 1,026,391 6,296,098 400,192 2,265,299 15,169,744 1,038,589 16,208,333
Current KMP subtotal 3,408,107 1,026,391 1,762,737 335,000 461,187 6,993,422 304,230 7,297,652
Former KMP subtotal 1,773,657 - 4,533,361 65,192 1,804,112 8,176,322 734,359 8,910,681
Total 5,181,764 1,026,391 6,296,098 400,192 2,265,299 15,169,744 1,038,589 16,208,333 1 Current as at the date of FY19 Remuneration Report (22 August 2019).
2 Tim Roberts resigned on 5 June 2019. Fees shown are for the period 1 July 2018 to 5 June 2019.
3 Michael Grey was appointed Chief Operating Officer - Mining Services on 6 May 2019. Remuneration disclosed is for period from appointment 6 May 2019 to 30 June 2019. Michael Grey’s total STI for FY19 was $237,346. The STI value shown in the table above represents a pro-rata portion of his FY19 STI for the period for which he was a KMP. 4 Rohan O'Grady commenced as Chief Operating Officer - Construction & Development on 3 September 2018. Remuneration is for the period 3 September 2018 to 30 June 2019. 5 Mark Wilson commenced as Chief Financial Officer on 27 August 2018. Remuneration is for the period 27 August 2018 to 30 June 2019.
6 Bruce Goulds retired as Chief Financial Officer on 6 December 2018. Remuneration is for the period 1 July 2018 to 6 December 2018.
7 Danny McCarthy resigned as Chief Operating Officer on 30 November 2018. The negative value shown for LTI equity represents the value of LTI forfeited on resignation. Remuneration is for the period 1 July 2018 to 30 November 2018. 8 Scott Winter commenced as Chief Operating Officer - Commodities on 9 October 2018. He resigned on 18 June 2019. Remuneration is for the period 9 October 2018 to 11 June 2019. 9 FAR is excluding superannuation contributions, which is reported within 'Other Benefits'
10 Value of STIP cash relates to performance during FY19. Payments made to KMP under STI plans prior to FY20 were 100% cash and did not contain deferred equity components. 11 LTI awards that have vested during FY19, calculated as the number of rights vested multiplied by the face value at grant date. Vested shares may still be subject to trading restrictions and clawback provisions.
12 Equity component of Non-Executive Directors' (NED) remuneration. NED fees continue to be paid 50% in cash and 50% in MIN shares. Remuneration disclosed relates to the performance during FY19.
13 Other Benefits relate to non-monetary benefits, superannuation and termination benefits that are awarded for performance during FY19.
14 The ‘share price growth’ amount is equal to the number of rights vested multiplied by the increase in the MIN share price over the period from grant date to vesting date.

Mineral Resources Limited Directors' report 30 June 2020
Remuneration report (audited) (continued)
36
6. Key changes to remuneration for FY21 At the time of preparing this report, there are no changes planned for remuneration of KMP in FY21. 7. Summary of KMP employment conditions 7.1 Executives The table below summarises the employment agreements in place with executive KMP as at the date of this report.
KMP Term of agreement FAR Notice period: KMP and MRL
Termination entitlements1
Chris Ellison (MD) Full time – permanent $1,200,000 12 months Notice period per contract
Paul Brown (Chief Executive - Commodities)
Full time – permanent $850,000 12 months Notice period per contract
Michael Grey (Chief Executive – Mining Services)
Full time – permanent $850,000 12 months Notice period per contract
Mark Wilson (CFO) Full time – permanent $950,000 12 months Notice period per contract 1 Should this amount be a value that requires shareholder approval then it can be reduced to maximum permissible amount without shareholder agreement.
7.2 Non-Executive Directors Non-Executive Director remuneration remains unchanged from the amounts set in FY17, and as disclosed in FY19, as follows:
Chairman $250,000 (plus superannuation) Non-Executive Director $140,000 (plus superannuation)
Non-Executive Director (NED) remuneration is reviewed annually by the Remuneration Committee. Remuneration is based on the maximum total aggregate amount of fees payable (currently $1,000,000) as approved by shareholders. It is proposed that a resolution be passed in the 2020 AGM to approve an increase in the maximum pool to $2,000,000 to facilitate sufficient headroom in the pool to allow for the appointment of additional NEDs, an allocation of entitlements for participation in Board Sub-committees, and for an increase in NED fees should this be recommended by the Remuneration Committee. NED remuneration is not linked to Company performance, however to create alignment with shareholders, Non-Executive Director fees continue to be paid 50% in cash and 50% in MIN shares. All directors are subject to the Company’s Security Trading Policy. Since this policy’s introduction on 1 July 2017, no directors have sold their share allocations, such that directors are aligned with shareholders

Mineral Resources Limited Directors' report 30 June 2020
37
8. KMP statutory remuneration schedules The following tables detail the statutory remuneration disclosures prepared in accordance with Australian Accounting Standards. These tables differ from the remuneration outcomes tables in section 5.5, due to the accounting treatment of share-based payments.
Short-Term Benefits
Post-Employment
Benefits
Share-based payments
Cash salary and fees Other4
STI cash value5
Non-Monetary Superannuation
STI equity value
LTI equity value
NED remuneration6 Total
Performance related
FY20 $ $ $ $ $ $ $ $ $ %
Non-Executive Directors
Peter Wade 125,000 - - - 23,750 - 125,000 273,750 -
Kelvin Flynn 70,000 - - - 13,300 - 70,000 153,300 -
James McClements 70,000 - - - 13,300 - 70,000 153,300 -
Xi Xi 83,300 - - - - - 70,000 153,300 -
Executive Director
Chris Ellison 1,200,000 - 600,000 31,581 21,003 222,876 2,260,533 - 4,335,993 71%
Other Executives
Current1 Michael Grey 824,038 - 340,000 47,406 21,003 143,515 253,322 - 1,629,284 45%
Mark Wilson 937,019 79,408 380,000 40,398 21,003 160,398 353,905 - 1,972,131 45%
Paul Brown2 350,000 - 140,000 - 22,753 59,095 139,080 - 710,928 48%
Former
Rohan O'Grady3 148,077 19,681 - - 5,251 - - - 173,009 0%
Total 3,807,434 99,089 1,460,000 119,385 141,363 585,884 3,006,840 335,000 9,554,995
Current KMP subtotal 3,659,357 79,408 1,460,000 119,385 136,112 585,884 3,006,840 335,000 9,381,986
Former KMP subtotal 148,077 19,681 - - 5,251 - - - 173,009
Total 3,807,434 99,089 1,460,000 119,385 141,363 585,884 3,006,840 335,000 9,554,995

Mineral Resources Limited Directors' report 30 June 2020
Remuneration report (audited) (continued)
38
1 Current as at the date of this Remuneration Report (19 August 2020). 2 Paul Brown regarded as KMP with effect from 1 January 2020. Remuneration disclosed is for the period 1 January 2020 to 30 June 2020.
3 Rohan O'Grady resigned as Chief Operating Officer - Construction & Development on 13 September 2019. Remuneration disclosed is for the period 1 July 2019 to 13 September 2019.
4 Annual leave payout on termination of Rohan O'Grady and relocation allowance for Mark Wilson.
5 40% of the FY20 STI plan to KMP is paid in cash (50% for the Managing Director) and relates to the performance during FY20.
6 Equity component of Non-Executive Directors' (NED) remuneration. NED Remuneration is not linked to Company performance, however to create alignment with shareholders, Non-Executive Director fees continue to be paid 50% in cash and 50% in MIN shares.

Mineral Resources Limited Directors' report 30 June 2020
Remuneration report (audited) (continued)
39
Short-Term Benefits
Post-Employment
Benefits Share-based payments
Cash salary and fees Other9 STI
Non-Monetary Superannuation
LTI equity value10
NED remuneration11 Total
Performance related
FY19 $ $ $ $ $ $ $ $ %
Non-Executive Directors
Current1
Peter Wade 125,000 - - - 23,750 - 125,000 273,750 -
Kelvin Flynn 70,000 - - - 13,300 - 70,000 153,300 -
James McClements 70,000 - - - 13,300 - 70,000 153,300 -
Xi Xi 83,300 - - - - - 70,000 153,300 -
Former
Tim Roberts2 65,192 - - - 12,387 - 65,192 142,771 -
Executive Director
Chris Ellison 1,500,000 - 585,000 68,436 20,531 847,276 - 3,021,243 47%
Other Executives
Current1
Michael Grey3 107,692 - 35,863 - - - - 143,555 25%
Rohan O'Grady4 535,769 - 154,615 - 19,235 - - 709,619 22%
Mark Wilson5 916,346 250,000 250,913 32,104 20,531 - - 1,469,894 17%
Former
Bruce Goulds6 656,963 820,000 - - 10,266 1,221,095 - 2,708,324 45%
Danny McCarthy7 588,216 476,923 - 108,871 10,266 (506,713) - 677,563 -75%
Scott Winter8 463,286 350,000 - - 15,399 - - 828,685 -
Total 5,181,764 1,896,923 1,026,391 209,411 158,965 1,561,658 400,192 10,435,304
Current KMP subtotal 3,408,107 250,000 1,026,391 100,540 110,647 847,276 335,000 6,077,961
Former KMP subtotal 1,773,657 1,646,923 - 108,871 48,318 714,382 65,192 4,357,343

Mineral Resources Limited Directors' report 30 June 2020
Remuneration report (audited) (continued)
40
Total 5,181,764 1,896,923 1,026,391 209,411 158,965 1,561,658 400,192 10,435,304
1 Current as at the date of FY19 Remuneration Report (22 August 2019)
2 Tim Roberts resigned on 5 June 2019. Fees shown are for the period 1 July 2018 to 5 June 2019.
3 Michael Grey was appointed Chief Operating Officer - Mining Services on 6 May 2019. Remuneration disclosed is for period from appointment 6 May 2019 to 30 June 2019. Michael Grey’s total STI for FY19 was $237,346. The STI value shown in the table above represents a pro-rata portion of his FY19 STI for the period for which he was a KMP.
4 Rohan O'Grady commenced as Chief Operating Officer - Construction & Development on 3 September 2018. Remuneration is for the period 3 September 2018 to 30 June 2019
5 Mark Wilson commenced as Chief Financial Officer on 27 August 2018. Remuneration is for the period 27 August 2018 to 30 June 2019
6 Bruce Goulds retired as Chief Financial Officer on 6 December 2018. Remuneration is for the period 1 July 2018 to 6 December 2018
7 Danny McCarthy resigned as Chief Operating Officer on 30 November 2018. The negative value shown for LTI equity represents the value of LTI forfeited on resignation. Remuneration is for the period 1 July 2018 to 30 November 2018.
8 Scott Winter commenced as Chief Operating Officer - Commodities on 9 October 2018. He resigned on 18 June 2019. Remuneration is for the period 9 October 2018 to 11 June 2019
9 Termination entitlements for Bruce Goulds, Danny McCarthy and Scott Winter, and joining bonus for Mark Wilson
10 Refer to section 4 for details of the long-tern incentive (LTI) scheme. The amounts for the value of LTI equity represents the expense over the performance period calculated in accordance with Australian Accounting Standards and includes the FY16, FY17 and FY18 LTI schemes which continue to be expensed in FY19 based on the probability of vesting, as these shares are subject to performance and forfeiture conditions.
11 Equity component of Non-Executive Directors' (NED) remuneration. NED Remuneration is not linked to Company performance, however to create alignment with shareholders, Non-Executive Director fees continue to be paid 50% in cash and 50% in MIN shares.

Mineral Resources Limited Directors' report 30 June 2020
Remuneration report (audited) (continued)
41
9. Share rights granted, vested and potential future vesting
KMP Plan Grant Date1
Performance Periods
No. of share rights
granted
Value per share right
granted at grant
Total value of share rights
granted at grant date
Vested during the year
No. forfeited during
the year
% forfeited in during the year
Remaining, subject to
vesting conditions
Rights to shares:
Year in which share rights may
vest
No. of shares rights which
may vest
Maximum value yet to vest
$/right $ % % $
Chris Ellison FY16 LTI2 18/08/2016 FY16 to FY19 215,082 10.62 2,284,171 47,796 22% - - - - - -
FY17 LTI3 16/08/2017 FY17 to FY20 269,730 13.96 3,765,431 89,910 33% - - 89,910 FY21 89,910 1,255,144
FY18 LTI4 15/08/2018 FY18 to FY21 168,157 14.97 2,517,310 - 0% - - 168,157 FY21 112,105 1,678,207
FY22 56,052 839,103
FY19 LTI5 22/08/2019 FY19 to FY22 - - - - 0% - - - FY21 - -
FY22 - -
FY23 - -
FY20 LTI6 01/07/2019 FY20 to FY23 142,577 15.05 2,145,784 - 0% - - 142,577 FY24 142,577 2,145,784
FY20 STI6 01/07/2020 FY20 to FY22 25,267 21.17 534,902 - 0% - - 25,267 FY22 12,634 267,451
FY23 12,634 267,451
Mark Wilson FY19 LTI5 22/08/2019 FY19 to FY22 - - - - 0% - - - FY21 - -
FY22 - -
FY23 - -
FY20 LTI6 01/07/2019 FY20 to FY23 94,061 15.05 1,415,618 - 0% - - 94,061 FY24 94,061 1,415,618
FY20 STI6 01/07/2020 FY20 to FY22 18,184 21.17 384,955 - 0% - - 18,184 FY22 9,092 192,478
FY23 9,092 192,478

Mineral Resources Limited Directors' report 30 June 2020
Remuneration report (audited) (continued)
42
Michael Grey FY19 LTI5 22/08/2019 FY19 to FY22 - - - - 0% - - - FY21 - -
FY22 - -
FY23 - -
FY20 LTI6 01/07/2019 FY20 to FY23 67,328 15.05 1,013,286 - 0% - - 67,328 FY24 67,328 1,013,286
FY20 STI6 01/07/2020 FY20 to FY22 16,270 21.17 344,436 - 0% - - 16,270 FY22 8,135 172,218
FY23 8,135 172,218
Paul Brown FY20 LTI6 01/07/2019 FY20 to FY23 55,447 15.05 834,477 - 0% - - 55,447 FY24 55,447 834,477
FY20 STI6 01/07/2020 FY20 to FY22 13,399 21.17 283,657 - 0% - - 13,399 FY22 6,700 141,828
FY23 6,700 141,828
1 Grant date is determined in accordance with AASB 2 Share Based Payments. 2 FY16 LTI Plan vests in favour of participants provided participants remain employed with the Company over each of the Performance Periods. 3 FY17 was the Award Year for the LTI Plan (ROIC exceeded 12%). Each tranche of the FY17 LTI Plan vests in favour of participants provided participants remain employed with the Company over each of the subsequent Performance Years (FY18 to FY20) and ROIC for each subsequent Performance Years (FY18 to FY20) equals or exceeds 12%. As the average ROIC for FY18 and FY19 exceeds 12% (the average being 12.8%), Tranche 2 of the FY17 LTI Plan vests in favour of participants who remained employed for all of FY19. 4 FY18 was the Award Year for the LTI Plan (ROIC for FY18 exceeded 12%). Each tranche of the FY18 LTI Plan vests in favour of participants provided participants remain employed with the Company over each of the subsequent Performance Years (FY19 to FY21) and ROIC for each subsequent Performance Years (FY19 to FY21) equals or exceeds 12%. As ROIC for FY19 is less than 12%, Tranche 1 of the FY18 LTI Plan becomes a Suspended Tranche, subject to retesting if ROIC is equal to or exceeds 12% when averaged over the FY19 and subsequent (FY20 to FY21) Performance Years. 5 FY19 was the Award Year for the FY19 LTI Plan. As ROIC for FY19 is less than 12% there is no LTI award for FY19.
6 FY20 was the Award Year for the FY20 LTI Plan and the FY20 STI Plan.

Mineral Resources Limited Directors' report 30 June 2020
Remuneration report (audited) (continued)
43
10. Equity instruments held by KMP 10.1 Rights awarded under incentive plans The following table details share rights awarded under incentive plans that are subject to service conditions and performance hurdles that are yet to be tested and vested rights that have not yet been exercised and converted into shares. Non-executive Directors do not participate in incentive plans and do not hold unvested share rights.
Number of rights
Balance at the
start of the year
Granted
Exercised and
converted to shares
Other Additions1
Disposals/ other2
Balance at the end of
the year
Balance vested and exercisable
Executive Director
Chris Ellison 395,772 167,844 (137,706) - - 425,910 -
Other KMP Current Mark Wilson - 112,245 - - - 112,245 -
Michael Grey - 83,598 - - - 83,598 -
Paul Brown - 68,846 - 39,376 - 108,222 -
Former Rohan O'Grady - - - - - - -
Total 395,772 432,533 (137,706) 39,376 - 729,975 - 1 Other additions include share rights on commencement as KMP
2 Disposals/other include share rights forfeited; and on cessation as KMP
10.2 KMP shareholdings The number of MRL shares held during FY20 by each Director and Other Executive of the Company, including their related parties, is set out below:
Number of Shares Balance at the
start of the year
Issued as part of
remuneration
Other Additions2
Disposals/other3 Balance at the end of the year
Non-Executive Directors
Current
Peter Wade 328,656 8,159 336,815
Kelvin Flynn1 6,997 4,569 11,566
James McClements1 6,997 4,569 11,566
Xi Xi1 5,617 4,569 10,186
Executive Director
Chris Ellison 22,032,591 137,706 21,432 22,191,729
Other KMP
Current
Mark Wilson 8,670 - 16,439 25,109
Michael Grey - - -
Paul Brown - - 21,578 (10,789) 10,789
Former
Rohan O'Grady - - -
Total 22,389,528 159,572 59,449 (10,789) 22,597,760 1 Shares paid to Non-Executive Directors disclosed in this table were part of their FY19 remuneration package. Shares for their FY20 remuneration package were issued post the financial year end. The quantity of shares granted is based on the proportion of fees payable divided by the Volume Weighted Average price for the five trading days to the end of each quarter of the financial year 2 Other additions include shares on commencement as KMP and other shares purchased.
3 Disposals/other include shares sold; forfeited; and on cessation as KMP

Mineral Resources Limited Directors' report 30 June 2020
Remuneration report (audited) (continued)
44
11. Transactions with related parties The following transactions occurred with related parties: 2020
$ 2019
$ Key Management Personnel / directors’ interests: Properties from which some of the Group’s operations are performed are rented from parties related to Chris Ellison and Peter Wade.
(2,118,828) (2,026,840)
Occupation of these premises date back prior to the Company’s listing in 2006. The ongoing need for occupation of these premises, as well as rental arrangements, are assessed periodically. The Group has a Related Party Transaction Policy that requires the review and approval of Related Party Transactions by the Audit and Risk Committee (the Committee). A resolution is required by the Company’s Board of Directors (where applicable, excluding those involved in the Related Party Transaction) to confirm that the transaction is on terms not materially less favourable than terms generally available from an unaffiliated third party under the same or similar circumstances. The Group is presently examining the feasibility of acquiring these properties in order to terminate these arrangements.
This concludes the Remuneration Report, which has been audited.

Mineral Resources Limited Directors' report 30 June 2020
45
Indemnity and insurance of officers The Company has indemnified the directors and executives of the Company for costs incurred, in their capacity as a director or executive, for which they may be held personally liable, except where there is a lack of good faith. During the financial year, the Company paid a premium in respect of a contract to insure the directors and executives of the Company against a liability to the extent permitted by the Corporations Act 2001. The contract of insurance prohibits disclosure of the nature of the liability and the amount of the premium.
Indemnity and insurance of auditor The Company has not, during or since the financial year, indemnified or agreed to indemnify the auditor of the Company or any related entity against a liability incurred by the auditor. During the financial year, the Company has not paid a premium in respect of a contract to insure the auditor of the Company or any related entity.
Proceedings on behalf of the Company No person has applied to the Court under section 237 of the Corporations Act 2001 for leave to bring proceedings on behalf of the Company, or to intervene in any proceedings to which the Company is a party for the purpose of taking responsibility on behalf of the Company for all or part of those proceedings.
Non-audit services Details of the amounts paid or payable to the auditor for non-audit services provided during the financial year by the auditor are outlined in note 35 to the financial statements. The directors are satisfied that the provision of non-audit services during the financial year, by the auditor (or by another person or firm on the auditor's behalf), is compatible with the general standard of independence for auditors imposed by the Corporations Act 2001. The directors are of the opinion that the services as disclosed in note 35 to the financial statements do not compromise the external auditor's independence requirements of the Corporations Act 2001 for the following reasons: ● all non-audit services have been reviewed and approved to ensure that they do not impact the integrity and objectivity
of the auditor; and ● none of the services undermine the general principles relating to auditor independence as set out in APES 110 Code
of Ethics for Professional Accountants issued by the Accounting Professional and Ethical Standards Board, including reviewing or auditing the auditor's own work, acting in a management or decision-making capacity for the Company, acting as advocate for the Company or jointly sharing economic risks and rewards.
Officers of the Company who are former partners of RSM Australia Partners There are no officers of the Company who are former partners of RSM Australia Partners.
Rounding of amounts The Company is of a kind referred to in Corporations Instrument 2016/191, issued by the Australian Securities and Investments Commission, relating to 'rounding-off'. Amounts in this report have been rounded off in accordance with that Corporations Instrument to the nearest hundred thousand dollars, unless otherwise stated.
Auditor's independence declaration A copy of the auditor's independence declaration as required under section 307C of the Corporations Act 2001 is set out immediately after this directors' report.
Auditor RSM Australia Partners continues in office in accordance with section 327 of the Corporations Act 2001.

Mineral Resources Limited Directors' report 30 June 2020
46
This report is made in accordance with a resolution of directors, pursuant to section 298(2)(a) of the Corporations Act 2001. On behalf of the directors
Chris Ellison Managing Director 19 August 2020 Perth

THE POWER OF BEING UNDERSTOODAUDIT | TAX | CONSULTING
RSM Australia Partners is a member of the RSM network and trades as RSM. RSM is the trading name used by the members of the RSM network. Each member of the RSM network is an independent accounting and consulting firm which practices in its own right. The RSM network is not itself a separate legal entity in any jurisdiction.
RSM Australia Partners ABN 36 965 185 036
Liability limited by a scheme approved under Professional Standards Legislation
RSM Australia Partners
Level 32, Exchange Tower 2 The Esplanade Perth WA 6000 GPO Box R1253 Perth WA 6844
T +61 (0) 8 9261 9100 F +61 (0) 8 9261 9111
www.rsm.com.au
AUDITOR’S INDEPENDENCE DECLARATION
As lead auditor for the audit of the financial report of Mineral Resources Limited for the year ended 30 June 2020, I declare that, to the best of my knowledge and belief, there have been no contraventions of:
(i) the auditor independence requirements of the Corporations Act 2001 in relation to the audit; and
(ii) any applicable code of professional conduct in relation to the audit.
RSM AUSTRALIA PARTNERS
Perth, WA TUTU PHONG Dated: 19 August 2020 Partner

Mineral Resources Limited Income statement For the year ended 30 June 2020
Group Note 2020 2019 $m $m
The above income statement should be read in conjunction with the accompanying notes 48
Revenue 4 2,124.7 1,512.0 Other income 5 1,326.3 10.5 Expenses Changes in closing stock 130.3 60.3 Raw materials and consumables (218.2) (165.7) Equipment costs (113.9) (60.2) Subcontractors (180.2) (106.6) Employee benefits expense (383.1) (278.1) Transport and freight (482.7) (431.7) Depreciation and amortisation 6 (193.6) (108.6) Impairment charges 6 (285.8) (9.8) Other expenses 6 (182.7) (152.3) Finance costs 6 (104.9) (33.9)
Profit before tax 1,436.2 235.9 Income tax expense 7 (434.0) (71.0) Profit after tax for the year 1,002.2 164.9
Other comprehensive income Items that may be reclassified subsequently to profit or loss Net (loss)/gain on cash flow hedges (9.3) 5.2
Other comprehensive income for the year, net of tax (9.3) 5.2
Total comprehensive income for the year 992.9 170.1
Profit for the year is attributable to: Non-controlling interest (1.5) 1.3 Owners of Mineral Resources Limited 1,003.7 163.6
1,002.2 164.9
Total comprehensive income for the year is attributable to: Non-controlling interest (1.5) 1.3 Owners of Mineral Resources Limited 994.4 168.8
992.9 170.1
Cents Cents Basic earnings per share 8 532.96 87.09 Diluted earnings per share 8 532.96 87.09

Mineral Resources Limited Balance sheet As at 30 June 2020
Group Note 2020 2019 $m $m
The above balance sheet should be read in conjunction with the accompanying notes 49
Assets Current assets Cash and cash equivalents 9 1,521.8 265.4 Trade and other receivables 10 177.5 167.5 Inventories 11 155.6 180.2 Current tax assets - 54.4 Other assets 12 38.8 35.4
1,893.7 702.9 Assets held for sale 13 - 503.9
Total current assets 1,893.7 1,206.8
Non-current assets Trade and other receivables 10 649.6 40.1 Inventories 11 35.3 - Financial assets 14 42.3 75.1 Property, plant and equipment 15 1,365.9 1,300.6 Intangibles 16 47.9 84.7 Exploration and mine development 17 476.4 408.5 Deferred tax 7 119.8 45.5 Total non-current assets 2,737.2 1,954.5
Total assets 4,630.9 3,161.3
Liabilities Current liabilities Trade and other payables 19 319.1 259.5 Borrowings 20 100.5 55.2 Income tax 415.9 - Employee benefits 21 53.4 35.6 Provisions 22 29.5 11.4 Other 5.9 -
924.3 361.7 Liabilities directly associated with assets classified as held for sale 13 - 63.1
Total current liabilities 924.3 424.8
Non-current liabilities Borrowings 20 1,190.2 1,081.7 Deferred tax 7 122.5 185.6 Provisions 22 98.3 89.0
Total non-current liabilities 1,411.0 1,356.3
Total liabilities 2,335.3 1,781.1
Net assets 2,295.6 1,380.2
Equity Issued capital 23 516.3 507.9 Reserves 10.1 16.1 Retained profits 1,738.4 837.2
Equity attributable to the owners of Mineral Resources Limited 2,264.8 1,361.2 Non-controlling interest 30.8 19.0
Total equity 2,295.6 1,380.2

Mineral Resources Limited Statement of changes in equity For the year ended 30 June 2020
The above statement of changes in equity should be read in conjunction with the accompanying notes 50
Issued
Retained Non-
controlling
Total equity capital Reserves profits interest Group $m $m $m $m $m Balance at 1 July 2018 511.2 1.4 773.0 17.8 1,303.4 Profit after tax for the year - - 163.6 1.3 164.9 Other comprehensive income for the year, net of tax
-
5.2
-
-
5.2
Total comprehensive income for the year - 5.2 163.6 1.3 170.1 Transactions with owners in their capacity as owners:
Share issued under Dividend Reinvestment Plan (note 23)
5.9
-
-
-
5.9
Purchase of shares under employee share plans (note 23)
(18.9)
-
-
-
(18.9)
Equity settled share-based payments - 20.9 - - 20.9 Employee share awards issued (note 23) 9.7 (11.4) - - (1.7) Other - - - (0.1) (0.1) Dividends paid (note 24) - - (99.4) - (99.4) Balance at 30 June 2019 507.9 16.1 837.2 19.0 1,380.2
Issued
Retained Non-
controlling
Total equity capital Reserves profits interest Group $m $m $m $m $m Balance at 1 July 2019 507.9 16.1 837.2 19.0 1,380.2 Prior period remeasurement on adoption of AASB 16 (note 1.3(a))
-
-
(1.0)
-
(1.0)
Balance at 1 July 2019 - restated 507.9 16.1 836.2 19.0 1,379.2 Profit/(loss) after tax for the year - - 1,003.7 (1.5) 1,002.2 Other comprehensive income for the year, net of tax
-
(9.3)
-
-
(9.3)
Total comprehensive income for the year - (9.3) 1,003.7 (1.5) 992.9 Transactions with owners in their capacity as owners:
Share issued under Dividend Reinvestment Plan (note 23)
5.4
-
-
-
5.4
Equity settled share-based payments - 6.0 - - 6.0 Employee share awards issued (note 23) 3.0 (2.7) - - 0.3 Acquisition of subsidiary - - - 13.3 13.3 Dividends paid (note 24) - - (101.5) - (101.5)
Balance at 30 June 2020 516.3 10.1 1,738.4 30.8 2,295.6

Mineral Resources Limited Statement of cash flows For the year ended 30 June 2020
Group Note 2020 2019 $m $m
The above statement of cash flows should be read in conjunction with the accompanying notes 51
Cash flows from operating activities Receipts from customers 2,189.2 1,449.4 Payments to suppliers and employees (1,394.7) (1,180.1)
794.5 269.3 Interest received 14.3 2.5 Interest and other finance costs paid (97.6) (19.5) Income taxes paid (116.6) (66.2)
Net cash from operating activities 9 594.6 186.1
Cash flows from investing activities Payments for investments in financial assets (8.1) (3.4) Proceeds from disposal of investments in financial assets 1.0 4.0 Payments for property, plant and equipment (217.4) (686.6) Proceeds from disposal of property, plant and equipment 26.5 16.8 Payments for intangibles (15.9) (17.8) Payments for exploration and evaluation (52.3) (43.5) Payments for mine development expenditure (105.3) (62.1) Acquisition of businesses and joint operation, net of cash 9.5 (44.4) Amounts received from joint operations - 6.7 Amounts advanced to other parties - (10.0) Proceeds from sale of disposal group 1,206.1 -
Net cash from/(used in) investing activities 844.1 (840.3)
Cash flows from financing activities Dividends paid (96.1) (93.5) Proceeds from borrowings 11.6 1,671.4 Repayment of borrowings (11.5) (796.8) Payment of finance lease liabilities (64.0) (82.7) Purchase of shares under employee share plans - (18.9)
Net cash (used in)/from financing activities (160.0) 679.5
Net increase in cash and cash equivalents 1,278.7 25.3 Cash and cash equivalents at the beginning of the financial year 265.4 240.4 Effects of exchange rate changes on cash and cash equivalents (22.3) (0.3)
Cash and cash equivalents at the end of the financial year 9 1,521.8 265.4

Mineral Resources Limited Notes to the financial statements 30 June 2020
52
Notes to the financial statements Basis of preparation 1. Significant accounting policies 53 2. Critical accounting judgements, estimates and assumptions 58 Financial performance 3. Operating segments 58 4. Revenue 61 5. Other income 63 6. Expenses 64 7. Income tax 65 8. Earnings per share 68 Key balance sheet items 9. Cash and cash equivalents 68 10. Trade and other receivables 70 11. Inventories 71 12. Other assets 71 13. Assets held for sale 71 14. Financial assets 73 15. Property, plant and equipment 74 16. Intangibles 77 17. Exploration and mine development 78 18. Impairment of non-financial assets 81 19. Trade and other payables 82 20. Borrowings 82 21. Employee benefits 83 22. Provisions 84 23. Issued capital 85 24. Dividends 86 25. Financial instruments 86 Unrecognised items 26. Contingent liabilities 93 27. Commitments 94 Other information 28. Parent entity information 94 29. Business combinations 95 30. Interests in subsidiaries 99 31. Interests in joint operations 99 32. Related party transactions 99 33. Key Management Personnel disclosures 100 34. Share based payments 100 35. Remuneration of auditors 103 36. Events after the reporting period 103

Mineral Resources Limited Notes to the financial statements 30 June 2020
53
1. Significant accounting policies 1.1 Basis of preparation These general purpose financial statements have been prepared in accordance with Australian Accounting Standards and Interpretations issued by the Australian Accounting Standards Board (AASB) and the Corporations Act 2001, as appropriate for for-profit oriented entities. These financial statements also comply with International Financial Reporting Standards as issued by the International Accounting Standards Board (IASB). Historical cost convention The financial statements have been prepared under the historical cost convention, except for, where applicable, the revaluation of financial assets and liabilities at fair value through profit or loss, certain classes of property, plant and equipment and derivative financial instruments. Critical accounting estimates The preparation of the financial statements requires the use of certain critical accounting estimates. It also requires management to exercise its judgement in the process of applying the Group's accounting policies. The areas involving a higher degree of judgement or complexity, or areas where assumptions and estimates are significant to the financial statements, are disclosed in note 2. Rounding of amounts The Company is of a kind referred to in Corporations Instrument 2016/191, issued by the Australian Securities and Investment Commission, relating to 'rounding-off'. Amounts in this report have been rounded off in accordance with that Corporations Instrument to the nearest hundred thousand dollars, unless otherwise stated. Foreign currency The financial statements are presented in Australian dollars, which is Mineral Resources Limited's functional and presentation currency. Foreign currency transactions are translated into Australian dollars using the exchange rates prevailing at the dates of the transactions. Foreign exchange gains and losses resulting from the settlement of such transactions and from the translation at financial year-end exchange rates of monetary assets and liabilities denominated in foreign currencies are recognised in profit or loss. 1.2 Principles of consolidation (a) Subsidiaries The consolidated financial statements incorporate the assets and liabilities of all subsidiaries of the Company as at 30 June 2020 and the results of all subsidiaries for the year then ended. Subsidiaries are all those entities over which the Group has control. The Group controls an entity when the Group is exposed to, or has rights to, variable returns from its involvement with the entity and has the ability to affect those returns through its power to direct the activities of the entity. Subsidiaries are fully consolidated from the date on which control is transferred to the Group. They are de-consolidated from the date that control ceases. Intercompany transactions, balances and unrealised gains on transactions between entities in the Group are eliminated. Unrealised losses are also eliminated unless the transaction provides evidence of the impairment of the asset transferred. Accounting policies of subsidiaries have been changed where necessary to ensure consistency with the policies adopted by the Group. The acquisition of subsidiaries is accounted for using the acquisition method of accounting. A change in ownership interest, without the loss of control, is accounted for as an equity transaction, where the difference between the consideration transferred and the book value of the share of the non-controlling interest acquired is recognised directly in equity attributable to the parent. Profit or loss and each component of other comprehensive income are attributed to the equity holders of the parent of the Group and to the non-controlling interests, even if this results in the non-controlling interests having a deficit balance.

Mineral Resources Limited Notes to the financial statements 30 June 2020
1. Significant accounting policies (continued)
54
Where the Group loses control over a subsidiary, it derecognises the assets including goodwill, liabilities and non-controlling interest in the subsidiary together with any cumulative translation differences recognised in equity. The Group recognises the fair value of the consideration received and the fair value of any investment retained together with any gain or loss in profit or loss. (b) Joint operations A joint operation is a joint arrangement whereby the parties that have joint control of the arrangement have rights to the assets, and obligations for the liabilities, relating to the arrangement. The Group has recognised its share of jointly held assets, liabilities, revenues and expenses of joint operations. These have been incorporated in the financial statements under the appropriate classifications. (c) Employee share trust The Group has in place a trust to administer the Group's employee share and share option schemes. This trust is consolidated, as the substance of the relationship is that the trust is controlled by the consolidated entity. Shares held by the Mineral Resources Employee Share Trust are disclosed as treasury shares and deducted from contributed equity. 1.3 Summary of significant accounting policies This note provides a summary of the accounting policies that are considered significant and relevant to the preparation of the financial statements, to the extent that they have not already been disclosed in other notes to the financial statements throughout the report. These policies have been consistently applied to all the years presented, unless otherwise stated. (a) New or amended Accounting Standards and Interpretations adopted The Group has adopted all of the new, revised or amending Accounting Standards and Interpretations issued by the Australian Accounting Standards Board (AASB) that are mandatory for the current reporting period. The adoption of these Accounting Standards and Interpretations did not have any significant impact on the financial performance or position of the Group. Any new or amended Accounting Standards or Interpretations that are not yet mandatory have not been early adopted. AASB 16 Leases The Group has adopted AASB 16 Leases (AASB 16) from 1 July 2019. The standard replaces AASB 117 Leases (AASB 117) and for lessees, eliminates the classifications of operating leases and finance leases. Except for short-term leases and leases of low-value assets, right-of-use assets and corresponding lease liabilities are recognised in the balance sheet when a contract is, or contains, a lease. That is, if the contract conveys the right to control the use of an identified asset for a period of time in exchange for consideration Lease accounting policy (applied from 1 July 2019) Right-of-use assets Refer to note 15. Lease liabilities Refer to note 20. Transition Straight-line operating lease expense recognition is replaced with a depreciation charge for the right-of-use assets (included in operating costs) and an interest expense on the recognised lease liabilities (included in finance costs). In the earlier periods of the lease, the expenses associated with the lease under AASB 16 will be higher when compared to lease expenses under AASB 117. However, EBITDA results improve as the operating expense is now replaced by interest expense and depreciation in the income statement. For classification within the statement of cash flows, the interest portion is disclosed in operating activities and the principal portion of the lease payments are separately disclosed in financing activities. For lessor accounting, AASB 16 does not substantially change how a lessor accounts for leases. In accordance with the transition provisions of AASB 16, the Group has adopted the modified retrospective transition approach to implementing the new standard. Under this approach, comparatives are not restated. Instead, the reclassifications and adjustments arising from the new leasing rules are recognised in the balance sheet on 1 July 2019.

Mineral Resources Limited Notes to the financial statements 30 June 2020
1. Significant accounting policies (continued)
55
Adjustments recognised on adoption of AASB 16 On adoption of AASB 16, the Group recognised lease liabilities in relation to leases which had previously been classified as ‘operating leases’ under the principles of AASB 117. These liabilities were measured at the present value of the remaining lease payments, discounted using the lessee’s incremental borrowing rate as of 1 July 2019. The weighted average lessee’s incremental borrowing rate applied to these lease liabilities on 1 July 2019 was 4.7%. For leases previously classified as finance leases the Group recognised the carrying amount of the lease asset and lease liability immediately before transition as the carrying amount of the right of use asset and the lease liability at the date of initial application. The measurement principles of AASB 16 are only applied after that date. $m Operating lease commitments disclosed 30 June 2019 44.2 (Exclude): Committed leases not commenced (38.7) (Less): Short-term leases recognised on a straight-line basis as an expense (0.2) Add: Adjustments as a result of different treatment of extension and termination options 4.2 Add: Contracts reassessed to contain leases 2.3 Add: Finance leases recognised at 30 June 2019 178.7 Discounted using the lessee’s incremental borrowing rate (0.2)
Lease liability recognised at 1 July 2019 190.3
Right-of-use assets were measured on a retrospective basis as if AASB 16 had been applied since the commencement date, but discounted using the lessee’s incremental borrowing rate at the date of initial application. The recognised right-of-use assets relate to the following types of assets: 30 Jun 2020 1 Jul 2019 $m $m - Buildings 40.0 10.2 - Plant and equipment 271.3 159.1 - Plant and equipment (held for sale) - 29.2
311.3 198.5
The change in accounting policy impacted the following items in the balance sheet on 1 July 2019: 1 July 2019 $m Property, plant and equipment - increase 10.3 Deferred tax asset - increase 0.4
10.7
Borrowings (Lease liability) - increase (11.7)
Net impact on retained earnings, tax effected (1.0)
Impact of adoption on the current reporting period The impact on the Group's consolidated income statement, compared with the amount that would have been reflected under AASB 117, for the year ended 30 June 2020 is:

Mineral Resources Limited Notes to the financial statements 30 June 2020
1. Significant accounting policies (continued)
56
30 Jun 2020 $m Decrease in operating lease expense 5.9 Increase in finance cost expense (2.3) Increase in right-of-use asset depreciation (6.4)
Decrease in profit before tax (2.8)
Increase in income tax expense 0.8
Decrease in profit after tax (2.0)
The impact of the adoption on segment disclosures was principally in the Central segment. The Group’s earnings per share was not materially impacted. Practical expedients applied In applying AASB 16 for the first time, the Group has used the following practical expedients permitted by the standard: ● applying a single discount rate to a portfolio of leases with reasonably similar characteristics; ● accounting for operating leases with a remaining term of less than 12 months as at 1 July 2019 as short-term leases; ● using hindsight in determining the lease term where the contract contains options to extend or terminate the lease; and ● for contracts entered into before the transition date, the Group chose to ‘grandfather’ previous assessments made
applying AASB 117 and Interpretation 4 Determining whether an Arrangement contains a Lease, instead of reassessing whether existing contracts were or contained a lease.
(b) Current and non-current classification Assets and liabilities are presented in the balance sheet based on current and non-current classification. An asset is current when it is expected to be realised or intended to be sold or consumed in normal operating cycle; it is held primarily for the purpose of trading; it is expected to be realised within 12 months after the reporting period; or the asset is cash or cash equivalent unless restricted from being exchanged or used to settle a liability for at least 12 months after the reporting period. All other assets are classified as non-current. A liability is current when it is expected to be settled in normal operating cycle; it is held primarily for the purpose of trading; it is due to be settled within 12 months after the reporting period; or there is no unconditional right to defer the settlement of the liability for at least 12 months after the reporting period. All other liabilities are classified as non-current. Deferred tax assets and liabilities are always classified as non-current. (c) Goods and Services Tax (GST) and other similar taxes Revenues, expenses and assets are recognised net of the amount of associated GST, unless the GST incurred is not recoverable from the tax authority. In this case it is recognised as part of the cost of the acquisition of the asset or as part of the expense. Receivables and payables are stated inclusive of the amount of GST receivable or payable. The net amount of GST recoverable from, or payable to, the tax authority is included in other receivables or other payables in the balance sheet. Cash flows are presented on a gross basis. The GST components of cash flows arising from investing or financing activities which are recoverable from, or payable to the tax authority, are presented as operating cash flows. Commitments and contingencies are disclosed net of the amount of GST recoverable from, or payable to, the tax authority.

Mineral Resources Limited Notes to the financial statements 30 June 2020
1. Significant accounting policies (continued)
57
(d) New Accounting Standards and Interpretations not yet mandatory or early adopted Australian Accounting Standards and Interpretations that have recently been issued or amended but are not yet mandatory, have not been early adopted by the Group for the annual reporting period ended 30 June 2020. The Group's assessment of the impact of these new or amended Accounting Standards and Interpretations, most relevant to the Group, are set out below. AASB 2018-6 Amendments to Australian Accounting Standards – Definition of a Business The amendments to AASB 3 Business Combinations, applicable to annual reporting periods beginning on or after 1 January 2020, clarifies the definition of a business, with the objective of assisting entities to determine whether a transaction should be accounted for as a business combination or as an asset acquisition. The amendments clarify the minimum requirements for a business, remove the assessment of whether market participants are capable of replacing any missing elements, add guidance to help entities assess whether an acquired process is substantive, narrow the definitions of a business and of outputs, and introduce an optional fair value concentration test. New illustrative examples were provided along with the amendments. The amendments will be applied prospectively by the Group to all business combinations and asset acquisitions for which the acquisition date is on or after 1 July 2020. AASB 2018-7 Amendments to Australian Accounting Standards – Definition of Material The amendments applies to annual reporting periods beginning on or after 1 January 2020 and is intended to address concerns that the wording in the definition of ‘material’ was different in the Conceptual Framework for Financial Reporting, AASB 101 Presentation of Financial Statements and AASB 108 Accounting Policies, Changes in Accounting Estimates and Errors. The amendments address these concerns by: • Replacing the term ‘could influence’ with ‘could reasonably be expected to influence’ • Including the concept of ‘obscuring information’ alongside the concepts of ‘omitting’ and ‘misstating’ information in the definition of material • Clarifying that the users to which the definition refers are the primary users of general purpose financial statements referred to in the Conceptual Framework • Aligning the definition of material across Australian Accounting Standards and other publications. The adoption of these amendments from 1 July 2020 is not expected to have a material impact on the Group’s consolidated financial statements. AASB 2019-1 Amendment to Australian Accounting Standards – References to the Conceptual Framework for Financial Reporting (Conceptual Framework) Makes amendments to various Accounting Standards to reflect the issue of the revised Conceptual Framework. The Amending Standard updates references to, or quotations from, previous versions of the Framework contained in many Accounting Standards. This Amending Standard applies to for-profit sector entities that have public accountability and are required by legislation to comply with Australian Accounting Standards and other for-profit entities that elect to apply the Conceptual Framework, for annual reporting periods beginning on or after 1 January 2020. Where the Group has relied on the existing framework in determining its accounting policies for transactions, events or conditions that are not otherwise dealt with under the Australian Accounting Standards, the Group may need to review such policies under the revised framework. At this time, the application of the Conceptual Framework by the Group from 1 July 2020 is not expected to have a material impact on the Group's financial statements.

Mineral Resources Limited Notes to the financial statements 30 June 2020
58
2. Critical accounting judgements, estimates and assumptions The preparation of the financial statements requires management to make judgements, estimates and assumptions that affect the reported amounts in the financial statements. Management continually evaluates its judgements and estimates in relation to assets, liabilities, contingent liabilities, revenue and expenses. Management bases its judgements, estimates and assumptions on historical experience and on other various factors, including expectations of future events, management believes to be reasonable under the circumstances. The resulting accounting judgements and estimates will seldom equal the related actual results. The judgements, estimates and assumptions that have a significant risk of causing a material adjustment to the carrying amounts of assets and liabilities (refer to the respective notes) within the next financial year are discussed below. COVID-19 pandemic Judgement has been exercised in considering the impacts that the COVID-19 pandemic has had, or may have, on the Group based on known information. This consideration extends to the nature of the products and services offered, customers, supply chain, staffing and geographic regions in which the Group operates. As at the date of this report, the Group's operations have not been materially impacted by the COVID-19 crisis during the year ended 30 June 2020. The Group has taken actions to minimise the risk that COVID-19 presents and as a result of these actions, the Group has continued to maintain its operations. Other than as addressed in specific notes, there does not currently appear to be either any significant impact upon the financial statements or any significant uncertainties with respect to events or conditions which may impact the Group unfavourably as at the reporting date. The challenges presented by COVID-19 are fluid and continue to change. The Group will continue to assess and update the Group’s response. Other key judgements, estimates and assumptions Other key judgements, estimates and assumptions which are material to the financial report are found in the following notes: Note Income tax 7 Recovery of deferred tax assets 7 Exploration and evaluation costs 17 Ore reserve and resource estimates 17 Impairment of non-financial assets 18 Site rehabilitation provisions 22 Project closure 22
3. Operating segments Business segment The Group has identified its operating segments based on internal management reports that are reviewed by the Board (the Chief Operating Decision Makers) in assessing performance and in determining the allocation of resources. The Group continues to report its business results as three operating segments being Mining Services (previously reported as ' Mining Services and Processing'), Commodities (previously reported as 'Mining'), and Central. All are operating within the Australian resources sector. The measurement of segment results is in line with the basis of information presented to management for internal management reporting purposes and the performance of each segment is measured based on EBITDA contribution. The accounting policies applied for internal reporting purposes are consistent with those applied in the preparation of the financial statements.

Mineral Resources Limited Notes to the financial statements 30 June 2020
3. Operating segments (continued)
59
Operating segment information Mining Inter- Services Commodities Central segment* Total Group - 2020 $m $m $m $m $m Revenue External revenue 440.7 1,684.0 - - 2,124.7 Intersegment revenue 834.3 - - (834.3) - Total revenue 1,275.0 1,684.0 - (834.3) 2,124.7
Other income 7.9 1,298.7 5.3 - 1,311.9 Expenses (923.7) (1,227.8) (90.3) 811.3 (1,430.5)
EBITDA 359.2 1,754.9 (85.0) (23.0) 2,006.1 Depreciation and amortisation (125.4) (63.1) (9.9) 4.8 (193.6) Impairment charges (139.4) (109.1) (37.3) - (285.8) Interest income - 3.1 12.9 (1.6) 14.4 Finance costs (7.1) (2.8) (96.6) 1.6 (104.9) Profit/(loss) before tax 87.3 1,583.0 (215.9) (18.2) 1,436.2
Income tax expense (434.0)
Profit after tax for the year 1,002.2
Assets Segment assets 1,223.8 1,847.2 1,608.5 (48.6) 4,630.9
Liabilities Segment liabilities 481.7 278.0 1,575.6 - 2,335.3
Segment net assets 742.1 1,569.2 32.9 (48.6) 2,295.6
* Represents elimination of internal profits that are temporarily unrealised to the Group

Mineral Resources Limited Notes to the financial statements 30 June 2020
3. Operating segments (continued)
60
Mining Inter- Services Commodities Central Segment* Total Group - 2019 $m $m $m $m $m Revenue External sales 327.7 1,184.2 0.1 - 1,512.0 Intersegment sales 522.5 - - (522.5) - Total revenue 850.2 1,184.2 0.1 (522.5) 1,512.0
Other income 7.4 0.1 0.5 - 8.0 Expenses (648.8) (937.8) (55.7) 508.0 (1,134.3)
EBITDA 208.8 246.5 (55.1) (14.5) 385.7 Depreciation and amortisation (79.3) (26.0) (3.3) - (108.6) Impairment charges (9.8) - - - (9.8) Interest income - 0.2 3.6 (1.3) 2.5 Finance costs (6.0) (4.1) (25.1) 1.3 (33.9) Profit/(loss) before tax 113.7 216.6 (79.9) (14.5) 235.9
Income tax expense (71.0)
Profit after tax for the year 164.9
Assets Segment assets 928.7 930.5 1,327.1 (25.0) 3,161.3
Liabilities Segment liabilities 384.5 340.4 1,056.2 - 1,781.1
Segment net assets 544.2 590.1 270.9 (25.0) 1,380.2
* Represents elimination of internal profits that are temporarily unrealised to the Group
Geographical information Refer Note 4 for segment revenue disaggregated based on geographical locations of external customers. All non-current assets of the Group, exclusive of, where applicable, financial instruments, deferred tax assets, post-employment benefits assets and rights under insurance contracts, are located in Australia. Major customer information During the year ended 30 June 2020, Commodities segment revenues from two customers amounted to $863.8 million and $258.9 million respectively, arising from the sale of commodities and related freight revenue. No other single customer contributed 10% or more to the Group's revenue for the year. During the year ended 30 June 2019, Commodities segment revenues from two customers amounted to $209.1 million and $176.8 million respectively, arising from the sale of commodities and related freight revenue. No other single customer contributed 10% or more to the Group's revenue for the year.

Mineral Resources Limited Notes to the financial statements 30 June 2020
61
4. Revenue (a) Disaggregation of revenue The disaggregation of revenue from contracts with customers is as follows:
Mining
Services Commodities
Central
Total
Group - 2020 $m $m $m $m Type of goods or service Sale of iron ore - 1,552.7 - 1,552.7 Sale of lithium - 131.1 - 131.1 Contract and operational revenue 435.1 - - 435.1 Other 5.5 0.3 - 5.8
Total external revenue from contracts with customers 440.6 1,684.1 - 2,124.7
Geographical information (by location of customer) Australia 440.6 0.3 - 440.9 China - 292.8 - 292.8 Singapore - 1,391.0 - 1,391.0
Total external revenue from contracts with customers 440.6 1,684.1 - 2,124.7
Mining
Services Commodities
Central
Total
Group - 2019 $m $m $m $m Type of goods or service Sale of iron ore - 954.4 - 954.4 Sale of lithium - 229.9 - 229.9 Contract and operational revenue 326.0 - - 326.0 Other 1.6 - 0.1 1.7
Total external revenue from contracts with customers 327.6 1,184.3 0.1 1,512.0
Geographical information (by location of customer) Australia 327.6 - 0.1 327.7 China - 662.4 - 662.4 Singapore - 521.9 - 521.9
Total external revenue from contracts with customers 327.6 1,184.3 0.1 1,512.0
(b) Contract balances Contract assets A contract asset is the right to consideration in exchange for goods or services transferred to the customer. If the Group performs by transferring goods or services to a customer before the customer pays consideration or before payment is due, a contract asset is recognised for the earned consideration that is conditional. The Group does not have any material contract assets as at 30 June 2020 as performance and a right to consideration occurs within a short period of time and all rights to consideration are unconditional.
Mineral Resources Limited Notes to the financial statements 30 June 2020
4. Revenue (continued)
62
Trade receivables A receivable represents the Group’s right to an amount of consideration that is unconditional (i.e., only the passage of time is required before payment of the consideration is due). Refer to Note 10 for trade receivables. Contract liabilities A contract liability is the obligation to transfer goods or services to a customer for which the Group has received consideration (or an amount of consideration is due) from the customer. If a customer pays consideration before the Group transfers goods or services to the customer, a contract liability is recognised when the payment is made or the payment is due (whichever is earlier). Contract liabilities are recognised as revenue when the Group performs under the contract. From time to time, the Group recognises contract liabilities in relation to:
commodity sales which are sold under Cost and Freight (CFR) or Cost, Insurance and Freight (CIF) International Commercial Terms (Incoterms), whereby a portion of the cash may be received from the customer before the freight/insurance services are provided
mining services revenue, including crushing services, whereby mobilisation charges may be received from the customer but is to be allocated and recognised based on the actual tonnes crushed each period (each performance obligation)
See Note 19 for further details of contract liabilities disclosed within Trade and Other Payables. Accounting policy for revenue recognition Revenue from contracts with customers Revenue is recognised at an amount that reflects the consideration to which the Group is expected to be entitled in exchange for transferring goods or services to a customer. For each contract with a customer, the Group: identifies the contract with a customer; identifies the performance obligations in the contract; determines the transaction price which takes into account estimates of variable consideration and the time value of money; allocates the transaction price to the separate performance obligations on the basis of the relative stand-alone selling price of each distinct good or service to be delivered; and recognises revenue when or as each performance obligation is satisfied in a manner that depicts the transfer to the customer of the goods or services promised. Variable consideration within the transaction price, if any, reflects concessions provided to the customer such as discounts, rebates and refunds, any potential bonuses receivable from the customer and any other contingent events. Such estimates are determined using either the 'expected value' or 'most likely amount' method. The measurement of variable consideration is subject to a constraining principle whereby revenue will be recognised only to the extent that it is highly probable that a significant reversal in the amount of cumulative revenue recognised will not occur. The measurement constraint continues until the uncertainty associated with the variable consideration is subsequently resolved. Amounts received that are subject to the constraining principle are recognised as a refund liability. (i) Sale of goods The Group earns revenue by mining, processing, and subsequently selling commodity products (including iron ore and lithium) by export to customers under a range of commercial terms. Revenue from the sale of product is recognised at the point in time when control has been transferred to the customer, no further work or processing is required by the Group, the quantity and quality of the goods has been determined with reasonable accuracy, the price is fixed or determinable, and collectability is reasonably assured. This is generally when title passes. The majority of the Group's sales agreements specify that title passes when the product is delivered to the destination specified by the customer, which is typically the vessel on which the product will be shipped. In practical terms, revenue is generally recognised on the bill of lading date, which is the date the commodity is delivered to the shipping agent. Within each contract to sell commodity products, each unit of product shipped is a separate performance obligation. Revenue is generally recognised at the contracted price at this reflects the stand-alone selling price. The Group’s sales agreements may provide for provisional pricing of sales with pricing subsequently adjusted to reflect market prices over a quotation period stipulated in the sales contract, typically on or after the vessel’s arrival at the port of discharge. The estimated consideration in relation to provisionally priced contracts is marked to market using the spot price at the end of each reporting period with the impact of the price movements recorded as an adjustment to sales revenue. These sales agreements also allow for an adjustment to the sales price based on a survey of the goods by the customer (an assay for mineral content) therefore recognition of the sales revenue is based on the most recently determined estimate of product specifications. The effect of variable consideration arising from these arrangements with customers is included in revenue to the extent that it is highly probable that there will be no significant reversal of the cumulative amount of revenue recognised when any pricing uncertainty is resolved.

Mineral Resources Limited Notes to the financial statements 30 June 2020
4. Revenue (continued)
63
The Group sells the majority its commodity products on CFR or CIF Incoterms which means that the Group is responsible for providing freight services and, in CIF instances, insurance, after the date at which title of the goods passes. The Group therefore has separate performance obligations for freight/insurance services provided for sale of products under CFR and CIF Incoterms. Freight/insurance revenue is allocated from the overall contract price at its standalone selling price (where observable) or otherwise at its estimated cost plus margin. The recognition of freight/insurance revenue is deferred until the product is delivered rather than when the product is shipped. The Group does not disclose sales revenue from freight and insurance services separately as it does not consider that this is necessary in order to understand the impact of economic factors on the Group; and the Group's Chief Operating Decision Makers (as defined in the operating segments Note 3) do not review information specifically relating to these sources of revenue in order to evaluate the performance of business segments, neither is information on these sources of revenue provided externally. The Group applies the practical expedient in AASB 15 Revenue from Contracts with Customers (AASB 15) paragraph 121 for its freight/insurance services and does not disclose information on the transaction price allocated to performance obligations that remain unsatisfied at the end of the reporting period as the performance obligations arising under sales arrangement for its commodity products have an original expected duration of one year or less. (ii) Rendering of services The Group’s Mining Services segment earns contract and operational revenue from the provision of a range of mining services, including crushing services. Revenue from mining services is recognised over time as the services are rendered. As mining services are invoiced on a monthly basis based on the actual services provided or at cost plus margin incurred to date, the Group has used the practical expedient available under AASB 15 to recognise revenue based on the right to invoice, on the basis that the invoiced amount corresponds directly with the value to the customer of the Group’s performance completed to date. For crushing service contracts specifically, each tonne of ore crushed represents a separate performance obligation. Revenue from the rendering of crushing services is measured and recognised as each tonne is crushed based on a schedule of rates that is invoiced to the customer, being the estimate of the price to which the Group expects to be entitled, and a corresponding trade receivable is recognised. Mobilisation / demobilisation charges on crushing service contracts constitute variable charges that will be associated and allocated to each tonne crushed (each performance obligation) and therefore recognised based on the actual tonnes crushed each period, rather than when invoiced. The Group applies the practical expedient in AASB 15 paragraph 121 for its mining services revenue and does not disclose information on the transaction price allocated to performance obligations that remain unsatisfied at the end of the reporting period as these are not material.
5. Other income Group 2020 2019 $m $m Net gain on disposal of property, plant and equipment 5.4 0.9 Net gain on sale of disposal group (note 13) 1,297.8 - Interest income 14.4 2.5 Gain on bargain purchase 4.2 - Other 4.5 7.1
Other income 1,326.3 10.5

Mineral Resources Limited Notes to the financial statements 30 June 2020
64
6. Expenses Group 2020 2019 $m $m Profit before tax includes the following specific expenses: Depreciation and amortisation Plant and equipment 161.7 92.9 Depreciation capitalised to assets (0.7) (1.6) Total depreciation 161.0 91.3
Amortisation Mine development 28.7 14.5 Other 3.9 2.8
Total amortisation 32.6 17.3
Total depreciation and amortisation 193.6 108.6
Impairment Exploration and mine development (note 18) 71.2 - Intangibles (note 18) 50.0 - Property, plant and equipment (note 18) 145.4 9.8 Trade receivables 0.2 - Inventory (note 18) 19.0 -
Total impairment 285.8 9.8
Finance costs Interest on borrowings 94.2 25.1 Interest on lease liabilities 9.0 6.3 Other 1.7 2.5
Finance costs expensed 104.9 33.9
Included within other expenses: Net foreign exchange loss 22.7 6.1 Fair value loss on equity instruments at fair value through profit or loss 40.9 42.4
Minimum lease payments recognised as operating lease expense (i) - 4.4 Short-term leases, low value leases and leases with variable payments (i) 0.9 -
0.9 4.4
Superannuation expense included in employee benefits expense: Defined contribution superannuation expense 27.7 25.6
(i) Until the end of the comparative period, leases were accounted for by applying the principles of AASB 117, which classified arrangements as either finance leases or operating leases. From 1 July 2019, the Group accounting policy was changed so that leases are recognised under the principles of AASB 16, therefore only payments associated with short-term leases, low-value leases and variable lease payments are recognised as an expense in the income statement. Refer note 1.3(a) for details of the impact on the Group of adopting the new standard.

Mineral Resources Limited Notes to the financial statements 30 June 2020
65
7. Income tax (a) Income tax expense Group 2020 2019 $m $m Income tax expense Current tax 563.1 48.7 Deferred tax - origination and reversal of temporary differences (131.1) 20.5 Adjustment recognised for prior periods 2.0 1.8
Aggregate income tax expense 434.0 71.0
Deferred tax included in income tax expense comprises: Increase in deferred tax assets (note 7(b)) (73.8) (13.7) (Decrease)/increase in deferred tax liabilities (note 7(c)) (57.3) 34.2
Deferred tax - origination and reversal of temporary differences (131.1) 20.5
Numerical reconciliation of income tax expense and tax at the statutory rate Profit before tax 1,436.2 235.9
Tax at the statutory tax rate of 30% 430.9 70.8 Tax effect amounts which are not deductible/(taxable) in calculating taxable income:
Non allowable expenses 0.1 0.3 Research and development concessions - (0.9)
431.0 70.2 Adjustment recognised for prior periods 2.0 1.8 Current year tax losses not recognised 1.0 0.4 Prior year tax losses not recognised now recouped - (1.4)
Income tax expense 434.0 71.0
Group 2020 2019 $m $m Amounts charged directly to equity Deferred tax liabilities 0.2 -
Tax losses not recognised Unused tax losses for which no deferred tax asset has been recognised (i) 30.0 26.7
Potential tax benefit @ 30% 9.0 8.0 (i) These losses relate to subsidiaries not within the MRL tax consolidated group that have a history of losses, do not expire, and may not be used to offset taxable income elsewhere in the Group. On this basis, the Group has not recognised deferred tax assets for these tax losses carried forward. These tax losses can only be utilised in the future if the continuity of ownership test is passed, or failing that, the continuity of business test is passed.

Mineral Resources Limited Notes to the financial statements 30 June 2020
7. Income tax (continued)
66
(b) Deferred tax asset Group 2020 2019 $m $m Deferred tax asset Deferred tax asset comprises temporary differences attributable to: Amounts recognised in profit or loss:
Allowance for expected credit losses 1.3 1.3 Contract liabilities 4.0 3.2 Employee benefits 16.1 10.5 Provisions 38.3 30.0 Accrued expenses 7.3 - Unrealised foreign exchange loss 13.5 1.8 Financial assets at fair value through profit or loss 22.6 - Inventories 4.6 - Development costs 10.7 - Other 1.4 (1.3)
Deferred tax asset 119.8 45.5
Movements: Opening balance 45.5 38.1 Credited to profit or loss 73.8 13.7 Additions through business combinations (note 29) 0.3 - Under/(over) provision from prior year 0.2 (1.3) Transfer to assets held for sale - (5.0)
Closing balance 119.8 45.5
(c) Deferred tax liability Group 2020 2019 $m $m Deferred tax liability Deferred tax liability comprises temporary differences attributable to: Amounts recognised in profit or loss:
Trade and other receivables (5.1) 30.8 Property, plant and equipment 91.8 101.8 Exploration and evaluation 16.6 35.7 Research and development 8.3 20.0 Prepayments 10.4 - Other 0.5 (2.7)
Deferred tax liability 122.5 185.6
Movements: Opening balance 185.6 165.7 (Credited)/charged to profit or loss (57.3) 34.2 Charged to equity 0.2 - Additions through business combinations (note 29) 0.9 - (Over)/under provision from prior year (6.9) 6.8 Transfer to liabilities associated with assets held for sale - (21.1)
Closing balance 122.5 185.6

Mineral Resources Limited Notes to the financial statements 30 June 2020
7. Income tax (continued)
67
Accounting policy for income tax The income tax expense or benefit for the period is the tax payable on that period's taxable income based on the applicable income tax rate for each jurisdiction, adjusted by the changes in deferred tax assets and liabilities attributable to temporary differences, unused tax losses and the adjustment recognised for prior periods, where applicable. Key judgement: Income tax The Group is subject to income taxes in the jurisdictions in which it operates. Significant judgement is required in
determining the provision for income tax. There are many transactions and calculations undertaken during the ordinary course of business for which the ultimate tax determination is uncertain. The Group recognises the amount of tax payable or recoverable based on management’s best estimate of the most likely outcome. Where the final tax outcome of these matters is different from the carrying amounts, such differences will impact the current and deferred tax provisions in the period in which such determination is made.
Deferred tax assets and liabilities are recognised for temporary differences at the tax rates expected to be applied when the assets are recovered or liabilities are settled, based on those tax rates that are enacted or substantively enacted, except for: ● When the deferred income tax asset or liability arises from the initial recognition of goodwill or an asset or liability in a
transaction that is not a business combination and that, at the time of the transaction, affects neither the accounting nor taxable profits; or
● When the taxable temporary difference is associated with interests in subsidiaries, associates or joint ventures, and the timing of the reversal can be controlled and it is probable that the temporary difference will not reverse in the foreseeable future.
Deferred tax assets are recognised for deductible temporary differences and unused tax losses only if it is probable that future taxable amounts will be available to utilise those temporary differences and losses. Key judgement: Recovery of deferred tax assets Deferred tax assets are recognised for deductible temporary differences only if the Group considers it is probable
that future taxable amounts will be available to utilise those temporary differences and losses. The carrying amount of recognised and unrecognised deferred tax assets are reviewed at each reporting date. Deferred tax assets recognised are reduced to the extent that it is no longer probable that future taxable profits will be available for the carrying amount to be recovered. Previously unrecognised deferred tax assets are recognised to the extent that it is probable that there are future taxable profits available to recover the asset. Deferred tax assets and liabilities are offset only where there is a legally enforceable right to offset current tax assets against current tax liabilities and deferred tax assets against deferred tax liabilities; and they relate to the same taxable authority on either the same taxable entity or different taxable entities which intend to settle simultaneously. Mineral Resources Limited (the 'head entity') and its wholly-owned Australian subsidiaries have formed an income tax group under the tax consolidation regime. The head entity and each subsidiary in the tax consolidated group continue to account for their own current and deferred tax amounts. The tax group has applied the 'separate taxpayer within group' approach in determining the appropriate amount of taxes to allocate to members of the tax group. In addition to its own current and deferred tax amounts, the head entity also recognises the current tax liabilities (or assets) and the deferred tax assets arising from unused tax losses and unused tax credits assumed from each subsidiary in the tax group. Assets or liabilities arising under tax funding agreements with the tax group are recognised as amounts receivable from or payable to other entities in the tax group. The tax funding arrangement ensures that the intercompany charge equals the current tax liability or benefit of each tax group member, resulting in neither a contribution by the head entity to the subsidiaries nor a distribution by the subsidiaries to the head entity.

Mineral Resources Limited Notes to the financial statements 30 June 2020
68
8. Earnings per share Group 2020 2019 $m $m Profit after tax 1,002.2 164.9 Non-controlling interest 1.5 (1.3)
Profit after income tax attributable to the owners of Mineral Resources Limited 1,003.7 163.6
Number Number Weighted average number of ordinary shares used in calculating basic earnings per share 188,326,986 187,929,729
Weighted average number of ordinary shares used in calculating diluted earnings per share 188,326,986 187,929,729
Cents Cents Basic earnings per share 532.96 87.09 Diluted earnings per share 532.96 87.09 Accounting policy for earnings per share Basic earnings per share Basic earnings per share is calculated by dividing the profit attributable to the owners of Mineral Resources Limited, excluding any costs of servicing equity other than ordinary shares, by the weighted average number of ordinary shares outstanding during the financial year, adjusted for bonus elements in ordinary shares issued during the financial year. Diluted earnings per share Diluted earnings per share adjusts the figures used in the determination of basic earnings per share to take into account the after income tax effect of interest and other financing costs associated with dilutive potential ordinary shares and the weighted average number of shares assumed to have been issued for no consideration in relation to dilutive potential ordinary shares.
9. Cash and cash equivalents
(a) Cash and cash equivalents Group 2020 2019 $m $m Current Cash at bank and on hand 1,184.9 265.4 Short-term deposits and other cash equivalents 336.9 -
1,521.8 265.4
Accounting policy for cash and cash equivalents Cash and cash equivalents includes cash on hand, short-term deposits held with financial institutions, other short-term, highly liquid investments with original maturities of three months or less that are readily convertible to known amounts of cash and which are subject to an insignificant risk of changes in value.

Mineral Resources Limited Notes to the financial statements 30 June 2020
9. Cash and cash equivalents (continued)
69
(b) Cash flow information - Reconciliation of profit after tax to net cash from operating activities Group 2020 2019 $m $m Profit after tax for the year 1,002.2 164.9 Adjustments for: Depreciation and amortisation 193.6 108.6 Share-based payments 6.7 3.3 Foreign exchange differences 44.9 5.4 Impairment loss 285.8 9.8 Net gain on disposal of property, plant and equipment (5.4) (0.9) Net gain on sale of disposal group (1,297.8) - Fair value loss on investments held at fair value through profit or loss 40.9 42.4 Other non-cash transactions 1.1 0.9 Change in operating assets and liabilities:
Increase in trade and other receivables (9.1) (97.4) Increase in inventories (53.9) (73.9) Increase in deferred tax assets (68.1) (11.7) Increase in other operating assets (8.9) (18.0) Increase in trade and other payables 70.4 38.2 Increase/(decrease) in provision for income tax 470.4 (23.3) (Decrease)/increase in deferred tax liabilities (85.0) 39.9 Increase/(decrease) in other provisions 6.8 (2.1)
Net cash from operating activities 594.6 186.1
(c) Cash flow information – Changes in liabilities arising from financing activities
Lease
liability
Senior unsecured
notes
Syndicated loan facility
Other
borrowings
Total Group $m $m $m $m $m Balance at 1 July 2018 131.6 - 100.0 7.7 239.3 Net cash from/(used in) financing activities (82.7) 981.3 (100.0) (6.6) 792.0 Transferred to held for sale (25.6) - - - (25.6) Acquisition of leases 130.0 - - - 130.0 Exchange differences - 4.4 - - 4.4 Other changes (0.1) (3.1) - - (3.2)
Balance at 30 June 2019 153.2 982.6 - 1.1 1,136.9 Net cash from/(used in) financing activities (64.1) - - 0.1 (64.0) Lease liabilities recognised on adoption of AASB 16 (note 1.3(a))
11.7
-
-
-
11.7
Acquisition of leases 183.7 - - - 183.7 Exchange differences - 21.8 - - 21.8 Other changes (1.7) 2.3 - - 0.6 Balance at 30 June 2020 282.8 1,006.7 - 1.2 1,290.7

Mineral Resources Limited Notes to the financial statements 30 June 2020
70
10. Trade and other receivables Group 2020 2019 $m $m Current Trade receivables 180.1 171.7 Less: Allowance for expected credit losses (4.2) (4.2)
175.9 167.5
Loan receivables 1.6 - 177.5 167.5
Non-current Loan receivables 37.7 24.4 Less: Allowance for expected credit losses (0.5) - 37.2 24.4
Other receivables 4.9 14.5 Security deposits 1.4 1.2 Deferred consideration receivable from sale of disposal group (i) 606.1 -
649.6 40.1
(i) The Group has recognized a fair value of $606.1 million deferred consideration receivable arising from its right to receive a 40% interest in two lithium hydroxide modules being built in Kemerton as non-cash proceeds from the sale of Wodgina. Refer to Note 13 for further details on the sale. Fair value hierarchy disclosures are in Note 25(f).
Expected credit losses on trade and other receivables are not material. Further information about the Group’s exposure to credit and market risks, and impairment losses for trade receivables and contract assets is included in Note 25(d). Accounting policy for trade and other receivables Trade receivables Trade receivables are initially recognised at fair value and subsequently measured at amortised cost using the effective interest method, less any allowance for impairment losses. Trade receivables are generally due for settlement within 30 days. Refer note 25(d) for the Group’s credit risk management policies. Impairment of trade receivables Collectability of trade receivables is reviewed on an ongoing basis. Loss allowances for trade receivables are measured at an amount equal to lifetime expected credit losses (ECLs). Lifetime ECLs are the ECLs that result from all possible default events over the expected life of a financial instrument. Significant financial difficulties of the debtor, probability that the debtor will enter bankruptcy or financial reorganisation and default or delinquency in payments are considered indicators that a receivable is credit-impaired. ECLs are a probability-weighted estimate of credit losses. Credit losses are measured as the present value of all cash shortfalls (i.e. the difference between the cash flows due to the entity in accordance with the contract and the cash flows that the Group expects to receive). Cash flows relating to short-term receivables are not discounted if the effect of discounting is immaterial. Debts which are known to be uncollectable are written off by reducing the carrying amount directly. If an impairment allowance has been recognised for a debt that then becomes uncollectable, the debt is written off against the allowance account. If an amount is subsequently recovered, it is credited against profit or loss. Loans and other receivables Other receivables generally arise from transactions outside the usual operating activities of the Group. Loans and other receivables are classified as financial assets held at amortised cost, less any allowance for impairment losses. The Group’s other receivables do not contain impaired assets and are not past due. Based on the credit history, it is expected that these other receivables will be received when due.

Mineral Resources Limited Notes to the financial statements 30 June 2020
71
11. Inventories Group 2020 2019 $m $m Current Raw materials and stores 48.5 29.0 Ore inventory stockpiles 91.7 136.4 Work in progress 15.4 14.8
155.6 180.2
Non-current Ore inventory stockpiles 35.3 -
Accounting policy for inventories Raw materials, work in progress and finished goods are stated at the lower of weighted average cost and net realisable value. Cost comprises direct materials and delivery costs, direct labour, import duties and other taxes, an appropriate proportion of variable and fixed overhead expenditure based on normal operating capacity, and, where applicable, transfers from cash flow hedging reserves in equity. Costs of purchased inventory are determined after deducting rebates and discounts received or receivable. Net realisable value is the estimated selling price in the ordinary course of business less the estimated costs of completion and the estimated costs necessary to make the sale.
12. Other assets Group 2020 2019 $m $m Current Prepayments 38.8 29.4 Foreign exchange forward contracts - 6.0
38.8 35.4
13. Assets held for sale Sale of 60% interest in Wodgina Lithium Project In June 2019, the Group committed to selling a 60% interest in certain tenements, assets and related infrastructure, together comprising the Wodgina Lithium Project within the Commodities segment under a binding Asset Sale and Share Subscription Agreement (Sale Agreement) with Albemarle Corporation (NYSE: ALB, Albemarle). Accordingly, the 60% interest in the assets and associated liabilities was presented as a disposal group held for sale as at 30 June 2019. The transaction completed on 1 November 2019. The Group recognised a pre-tax gain on disposal of $1,297.8 million (post-tax $908.5 million) in the year ended 30 June 2020.

Mineral Resources Limited Notes to the financial statements 30 June 2020
13. Assets held for sale (continued)
72
(a) Assets and liabilities of disposal group classified as held for sale Group 2020 2019 $m $m Current Inventories - 25.7 Property, plant and equipment - 356.3 Exploration and mine development - 116.9 Deferred tax asset - 5.0
Assets held for sale - 503.9
Group 2020 2019 $m $m Current Lease liability - 25.6 Provisions - site rehabilitation - 16.4 Deferred tax liability - 21.1 Liabilities associated with the assets held for sale - 63.1
(b) Assets and liabilities of disposal group at date of disposal Group $m Assets Inventories 54.8 Property, plant and equipment 348.1 Exploration and mine development 128.4
Total assets disposed 531.3
Liabilities Lease liability (13.5) Provisions - site rehabilitation (16.5)
Total liabilities associated with assets disposed (30.0)
Net assets disposed 501.1
(c) Gain on disposal Group $m Proceeds 1,826.3 Net of transaction costs and other items (27.4) Less carrying amount of net assets disposed (501.1)
Gain on disposal before tax 1,297.8
Income tax expense (389.3)
Gain on disposal after tax 908.5

Mineral Resources Limited Notes to the financial statements 30 June 2020
13. Assets held for sale (continued)
73
(d) Proceeds from sale of disposal group Disposal proceeds received in the year ended 30 June 2020 included: ● Cash proceeds totalling $1,206.1 million, comprising of $1,187.5 million (US$820.0 million) cash consideration and
$18.6 million completion adjustments net of disposal costs, reflected in 'cash flows from investing activities' on the statement of cash flows
● Non-cash deferred consideration of $606.1 million, recognised in 'non-current trade and other receivables' on the balance sheet
Accounting policy for non-current assets or disposal groups classified as held for sale Non-current assets and assets of disposal groups are classified as held for sale if their carrying amount will be recovered principally through a sale transaction rather than through continued use. They are measured at the lower of their carrying amount and fair value less costs of disposal. For non-current assets or assets of disposal groups to be classified as held for sale, they must be available for immediate sale in their present condition and their sale must be highly probable. An impairment loss is recognised for any initial or subsequent write down of the non-current assets and assets of disposal groups to fair value less costs of disposal. A gain is recognised for any subsequent increases in fair value less costs of disposal of a non-current assets and assets of disposal groups, but not in excess of any cumulative impairment loss previously recognised. Non-current assets are not depreciated or amortised while they are classified as held for sale. Interest and other expenses attributable to the liabilities of assets held for sale continue to be recognised. Non-current assets classified as held for sale and the assets of disposal groups classified as held for sale are presented separately on the face of the balance sheet, in current assets. The liabilities of disposal groups classified as held for sale are presented separately on the face of the balance sheet, in current liabilities.
14. Financial assets Group 2020 2019 $m $m Non-current Shares in listed corporations - at fair value through profit or loss 42.3 75.1
Reconciliation Reconciliation of the fair values at the beginning and end of the current and previous financial year are set out below:
Opening fair value 75.1 118.1 Additions 8.1 3.4 Disposals (1.1) (4.0) Revaluation (39.8) (42.4)
Closing fair value 42.3 75.1
Refer to note 25 for further information on fair value measurement.

Mineral Resources Limited Notes to the financial statements 30 June 2020
14. Financial assets (continued)
74
Accounting policy for investments and other financial assets Investments and other financial assets are initially measured at fair value. Transaction costs are included as part of the initial measurement, except for financial assets at fair value through profit or loss. Such assets are subsequently measured at either amortised cost or fair value depending on their classification. Classification is determined based on both the business model within which such assets are held and the contractual cash flow characteristics of the financial asset unless an accounting mismatch is being avoided. Financial assets are derecognised when the rights to receive cash flows from the financial assets have expired or have been transferred and the Group has transferred substantially all the risks and rewards of ownership. Financial assets at fair value through profit or loss Financial assets not measured at amortised cost or at fair value through other comprehensive income (FVOCI) are classified as financial assets at fair value through profit or loss (FVTPL). Typically, such financial assets will be either: (i) held for trading, where they are acquired for the purpose of selling in the short-term with an intention of making a profit, or a derivative; or (ii) designated as such upon initial recognition where permitted. Fair value movements are recognised in profit or loss. The Group’s investments in equity instruments that are not held for trading are measured at FVTPL. An irrevocable election has not been made by management to measure any instruments at FVOCI. This election is made on an investment by investment basis.
15. Property, plant and equipment Group 2020 2019 $m $m Non-current Land - cost 14.4 14.4
Buildings - cost 95.4 12.5 Less: Accumulated depreciation (41.0) (2.1)
54.4 10.4
Right-of-use buildings - at cost 47.0 - Less: Accumulated depreciation (7.0) -
40.0 -
Right-of-use plant and equipment - cost 383.5 221.3 Less: Accumulated depreciation (112.2) (62.2)
271.3 159.1
Plant and equipment - cost 1,434.8 1,603.1 Less: Accumulated depreciation (449.0) (486.4)
985.8 1,116.7
1,365.9 1,300.6

Mineral Resources Limited Notes to the financial statements 30 June 2020
15. Property, plant and equipment (continued)
75
Reconciliations Reconciliations of the written down values at the beginning and end of the current and previous financial year are set out below:
Land
Buildings
Right-of-use
Buildings
Right-of-use Plant and equipment
Plant and equipment
Total Group $m $m $m $m $m $m Balance at 1 July 2018 14.4 10.7 - 186.6 760.8 972.5 Additions - - - 98.2 700.2 798.4 Additions through business combinations (note 29)
-
-
-
-
1.7
1.7
Classified as held for sale - - - (29.2) (327.1) (356.3) Disposals - - - (0.3) (14.3) (14.6) Impairment of assets - - - - (9.8) (9.8) Transfers - - - (59.0) 59.0 - Depreciation expense - (0.3) - (37.2) (53.8) (91.3)
Balance at 30 June 2019 14.4 10.4 - 159.1 1,116.7 1,300.6 Additions - - 47.0 135.5 218.1 400.6 Additions through business combinations (note 29)
-
-
-
0.1
9.2
9.3
Disposals - - - (10.1) (12.6) (22.7) Impairment of assets - - - - (145.4) (145.4) Transfers - 50.7 - 40.4 (106.6) (15.5) Depreciation expense - (6.7) (7.0) (53.7) (93.6) (161.0)
Balance at 30 June 2020 14.4 54.4 40.0 271.3 985.8 1,365.9
Capitalised borrowing costs The amount of borrowing costs capitalised during the year ended 30 June 2020 was not material. In the prior year ended 30 June 2019, the amount of borrowing costs capitalised was $21.9 million relating to the construction of the Wodgina spodumene concentrate plant which was financed for a substantial part of the financial year under a syndicated loan facility. The rate used to determine the amount of borrowing costs eligible for capitalisation was 4.33%, which is the effective interest rate (EIR) of the specific borrowing. Assets in the course of construction At 30 June 2020, there were no material amounts included in property, plant and equipment relating to assets in the course of construction (2019: $468.9 million). Impairment testing Refer to note 18 for details of impairment testing. Accounting policy for property, plant and equipment Owned assets Items of plant and equipment are stated at cost less accumulated depreciation and impairment losses. The cost of self-constructed assets includes the cost of materials, direct labour and an appropriate portion of production overheads. The cost of self-constructed and acquired assets includes (i) the initial estimate at the time of installation and during the period of use, when relevant, of the costs of dismantling and removing the items and restoring the site on which they are located, and (ii) changes in the measurement of existing liabilities recognised for these costs resulting from changes in the timing or outflow of resources required to settle the obligation or from changes in the discount rate. Where parts of an item of plant and equipment have different useful lives, they are accounted for as separate items of plant and equipment.

Mineral Resources Limited Notes to the financial statements 30 June 2020
15. Property, plant and equipment (continued)
76
Right-of-use assets The Group has adopted AASB 16 Leases (AASB 16) from 1 July 2019. Except for short-term leases and leases of low-value assets, right-of-use assets and corresponding lease liabilities are recognised in the balance sheet when a contract is, or contains, a lease. That is, if the contract conveys the right to control the use of an identified asset for a period of time in exchange for consideration. Refer to note 1.3(a) for details of the impact on adoption of AASB 16. A right-of-use asset is recognised at the commencement date of a lease. The right-of-use asset is measured at cost, which comprises the initial amount of the lease liability, adjusted for, as applicable, any lease payments made at or before the commencement date net of any lease incentives received, any initial direct costs incurred, and, except where included in the cost of inventories, an estimate of costs expected to be incurred for dismantling and removing the underlying asset, and restoring the site or asset. Right-of-use assets are depreciated on a straight-line basis over the unexpired period of the lease or the estimated useful life of the asset, whichever is the shorter. Where the Group expects to obtain ownership of the leased asset at the end of the lease term, the depreciation is over its estimated useful life. Right-of use assets are subject to impairment or adjusted for any re-measurement of lease liabilities. Depreciation Depreciation is calculated on a straight-line basis to write off the net cost of each item of property, plant and equipment over the shorter of the lease term (where applicable) and their expected useful lives, as follows: Buildings 40 years Buildings at mine sites 10 years or usage basis Right-of-use buildings Shorter of 40 years or the term of the lease Right-of-use plant and equipment Shorter of 3 - 20 years or the term of the lease Plant and equipment 1 - 10 years or usage basis The residual values, useful lives and depreciation methods are reviewed, and adjusted if appropriate, at each reporting date. Subsequent costs The Group recognises in the carrying amount of an item of plant and equipment the cost of replacing part of such an item when that cost is incurred if it is probable that the future economic benefits embodied within the item will flow to the Group and the cost of the item can be measured reliably. All other costs are recognised in the income statement as an expense as incurred. Borrowing costs Borrowing costs directly attributable to the acquisition, construction or production of assets that necessarily take a substantial period of time to prepare for their intended use or sale are added to the cost of those assets, until such time as the assets are substantially ready for their intended use or sale. All other borrowing costs are recognised in profit or loss in the period in which they are incurred.

Mineral Resources Limited Notes to the financial statements 30 June 2020
77
16. Intangibles Group 2020 2019 $m $m Non-current Goodwill - cost 1.4 1.4
Development - at cost 21.8 56.7
Patents - cost 1.7 1.7 Access rights - cost 56.7 56.7 Less: Accumulated amortisation and impairment (35.6) (33.1)
21.1 23.6
Others - cost 7.1 5.0 Less: Accumulated amortisation (5.2) (3.7) 1.9 1.3
47.9 84.7
Reconciliations Reconciliations of the written down values at the beginning and end of the current and previous financial year are set out below:
Goodwill
Capitalised development
costs
Patents
Access rights
Others
Total Group $m $m $m $m $m $m Balance at 1 July 2018 1.4 40.1 1.7 24.8 1.1 69.1 Additions - 16.6 - - 2.2 18.8 Amortisation expense - - - (1.2) (2.0) (3.2)
Balance at 30 June 2019 1.4 56.7 1.7 23.6 1.3 84.7 Additions - 15.1 - - 2.0 17.1 Impairment of assets - (50.0) - - - (50.0) Amortisation expense - - - (2.5) (1.4) (3.9)
Balance at 30 June 2020 1.4 21.8 1.7 21.1 1.9 47.9
Allocation of goodwill to cash-generating units The following cash generating units have carrying amounts of goodwill: Group 2020 2019 $m $m Process Minerals International Pty Ltd 1.4 1.4
Impairment testing Refer to note 18 for details of impairment testing

Mineral Resources Limited Notes to the financial statements 30 June 2020
16. Intangibles (continued)
78
Accounting policy for intangible assets Intangible assets acquired as part of a business combination, other than goodwill, are initially measured at their fair value at the date of the acquisition. Intangible assets acquired separately are initially recognised at cost. Indefinite life intangible assets are not amortised and are subsequently measured at cost less any impairment. Finite life intangible assets are subsequently measured at cost less amortisation and any impairment. The gains or losses recognised in profit or loss arising from the derecognition of intangible assets are measured as the difference between net disposal proceeds and the carrying amount of the intangible asset. The method and useful lives of finite life intangible assets are reviewed annually. Changes in the expected pattern of consumption or useful life are accounted for prospectively by changing the amortisation method or period. Goodwill Goodwill arises on the acquisition of a business. Goodwill is not amortised. Instead, goodwill is tested annually for impairment, or more frequently if events or changes in circumstances indicate that it might be impaired, and is carried at cost less accumulated impairment losses. Impairment losses on goodwill are taken to profit or loss and are not subsequently reversed. Research and development Research costs are expensed in the period in which they are incurred. Development costs are capitalised when it is probable that the project will be a success considering its commercial and technical feasibility; the Group is able to use or sell the asset; the Group has sufficient resources; and intent to complete the development and its costs can be measured reliably. Capitalised development costs are amortised when it is available for use in the manner intended by management on a straight-line basis over the period of their expected benefit. Patents and trademarks Significant costs associated with patents and trademarks are deferred and amortised on a straight-line basis over the period of their expected benefit. Access rights Access rights acquired as part of a business combination are recognised separately from goodwill. The rights are carried at their fair value at the date of acquisition less accumulated amortisation and impairment losses. Amortisation is calculated based on the timing of projected cash flows of the access rights over their estimated useful lives.
17. Exploration and mine development Group 2020 2019 $m $m Non-current Exploration and evaluation 132.0 163.4
Mine development 475.9 348.1 Less: Accumulated amortisation (131.5) (103.0) 344.4 245.1
476.4 408.5

Mineral Resources Limited Notes to the financial statements 30 June 2020
17. Exploration and mine development (continued)
79
Reconciliations Reconciliations of the written down values at the beginning and end of the current and previous financial year are set out below:
Exploration
and
Mine
evaluation development Total Group $m $m $m Balance at 1 July 2018 128.9 235.6 364.5 Additions 41.1 67.9 109.0 Additions through business combinations (note 29) 0.1 46.9 47.0 Classified as held for sale (6.7) (110.1) (116.8) Reassessment of rehabilitation - 19.3 19.3 Amortisation expense - (14.5) (14.5)
Balance at 30 June 2019 163.4 245.1 408.5 Additions 47.9 118.1 166.0 Disposals - (10.2) (10.2) Impairment of assets (53.7) (17.5) (71.2) Reassessment of rehabilitation - 12.0 12.0 Transfers (25.6) 25.6 - Amortisation expense - (28.7) (28.7)
Balance at 30 June 2020 132.0 344.4 476.4
Accounting policy for exploration and mine development assets Exploration and evaluation assets Exploration and evaluation expenditure in relation to separate areas of interest for which rights of tenure are current is carried forward as an asset in the balance sheet where it is expected that the expenditure will be recovered through the successful development and exploitation of an area of interest, or by its sale; or exploration activities are continuing in an area and activities have not reached a stage which permits a reasonable estimate of the existence or otherwise of economically recoverable reserves. Key judgement: Exploration and evaluation costs Key judgements are applied in considering costs to be capitalised which includes determining expenditures directly
related to these activities and allocating overheads between those that are expensed and capitalised. In addition, costs are capitalised only if expected to be recovered either through successful development or sale of the relevant mining interest. Factors that could impact the future commercial production at the mine include the level of reserves and resources, future technology changes, which could impact the cost of mining, future legal changes and changes in commodity prices. To the extent that capitalised costs are determined not to be recoverable in the future, the expenditure incurred in relation to the project or an area of interest will be written off in the period in which this determination is made.

Mineral Resources Limited Notes to the financial statements 30 June 2020
17. Exploration and mine development (continued)
80
Mine development Development expenditure incurred by or on behalf of the Group is accumulated separately for each area of interest in which economically recoverable resources have been identified. Such expenditure comprises cost directly attributable to the construction of a mine and the related infrastructure. Once a development decision has been taken, the carrying amount of the exploration and evaluation expenditure in respect of the area of interest is aggregated with the development expenditure and classified under non-current assets as development properties. A development property is reclassified as a mining property at the end of the commissioning phase, when the mine is capable of operating in the manner intended by management. Depreciation is charged using the units-of-production method, with separate calculations being made for each area of interest. The units-of-production basis results in a depreciation charge proportional to the depletion of proved, probable and estimated reserves. These calculations require the use of estimates and assumptions, including the amount of recoverable reserves and estimates of future capital expenditure. The Group adopts a Run of Mine (ROM) tonnes of ore produced methodology. Development properties are tested for impairment in accordance with the policy on impairment of assets. Key estimate: Mineral resources and ore reserves Resources or mineral resources refer to a concentration or occurrence of solid material of economic interest in or on
the Earth’s crust in such form, grade (or quality), and quantity that there are reasonable prospects for eventual economic extraction. The location, quantity, grade (or quality), continuity and other geological characteristics of a mineral resource are known, estimated or interpreted from specific geological evidence and knowledge, including sampling. Ore reserves are estimates of the amount of product that can be economically and legally extracted from the Group's current mining tenements. The Group estimates its ore reserves based on information compiled by appropriately qualified persons able to interpret the geological data. The estimation of recoverable reserves is based on factors such as estimates of foreign exchange rates, commodity prices, future capital requirements, and production costs, along with geological assumptions and judgements made in estimating the size and grade of the ore body. Changes in the reserves or resource estimates may impact on the value of exploration and evaluation assets, mine properties, property plant and equipment, provision for rehabilitation and depreciation and amortisation charges.
Stripping (waste removal) costs As part of its mining operations, the Group incurs stripping (waste removal) costs both during the development phase and production phase of its operations. Development stripping costs arise from the removal of overburden and other mine waste materials removed during the development of a mine site in order to access the mineral deposit. Costs directly attributable to development stripping activities, inclusive of an allocation of relevant overhead expenditure, are initially capitalised to exploration and evaluation expenditure. Capitalisation of development stripping costs ceases at the time that saleable material begins to be extracted from the mine. On completion of development, all capitalised development stripping included in exploration and evaluation is transferred to mine development. Production stripping commences at the time that saleable materials begin to be extracted from the mine and, under normal circumstances, continue throughout the life of the mine. Costs of production stripping are charged to the profit or loss as operating costs when the ratio of waste material to ore extracted for a "component" of the ore body is expected to be constant throughout its estimated life. A "component" is a specific section of the orebody that is made more accessible by the stripping activity. It will typically be a subset of the larger orebody that is distinguished by a separate useful economic life.

Mineral Resources Limited Notes to the financial statements 30 June 2020
17. Exploration and mine development (continued)
81
When the ratio of waste to ore is not expected to be constant, production stripping costs are accounted for as follows: (i) All costs are initially charged to profit or loss and classified as operation costs (ii) When the current ratio of waste to ore is greater than the estimated life-of-component strip ratio, a portion of the stripping
costs (inclusive of an allocation of relevant overhead expenditure) is capitalised to mine development as a stripping activity asset
(iii) The amount of production stripping costs capitalised or charged in a financial year is determined so that the stripping expense for the financial year reflects the estimated life-of-component strip ratio. The stripping activity asset is amortised on a units-of-production method over the life of the component, unless another method is more appropriate.
Life-of-component strip ratios are based on estimates of ore reserves and resources and the latest approved mine plan; they are a function of the mine design and therefore changes to that design will generally result in changes to the ratios. Changes to the estimated life-of-mine ratio are accounted for prospectively from the date of the change.
18. Impairment of non-financial assets Impairment testing The Group tests non-financial assets for impairment: ● At least annually for indefinite life intangibles and goodwill; and ● Where there is an indication that the asset may be impaired If the asset does not generate independent cash inflows and its value in use cannot be estimated to be close to its fair value, the asset is tested for impairment as part of the cash generating unit (CGU) to which it belongs. The recoverable amount of each CGU is determined based on the higher of an asset’s fair value less costs of disposal (FVLCD) and value-in-use (VIU). An impairment loss is recognised for the amount by which the asset's carrying amount exceeds its recoverable amount Key assumptions: Assumptions used in the impairment assessments of non-financial assets In determining the recoverable amount of assets where impairment indicators exist, key assumptions and estimates
are used that require significant levels of judgement and are subject to risk and uncertainty that are beyond the control of the Group, including political risk, climate risk, and other global uncertainty risks, such as the impacts of COVID-19. Where impairment indicators exist, key assumptions contained in the cash flow projections for FVLCD and VIU models include:
Estimates of future production, operating costs, capital expenditure, and rehabilitation: the estimation of the future production driving the cash flow projections is based on a detailed data analysis that reflects current life of mine and long-term production plans. As each area of interest has specific economic characteristics, the cash flows applied have been calculated using appropriate models and key assumptions established by management;
Future commodity prices: commodity prices are estimated with reference to externally sourced, forward
consensus prices, adjusted for ore properties;
Future foreign exchange rates: exchange rates are estimated with reference to externally sourced forward consensus rates;
Discount rates: the cash flows are discounted using a real pre-tax discount rate of 8.3%, representing the target weighted average cost of capital for the Group, with appropriate adjustments made to reflect the risks specific to the cash generating unit;
Terminal values: the terminal value calculation used in VIU models incorporates a nominal growth rate of 2.0% based on industry research and long-term inflation rates.

Mineral Resources Limited Notes to the financial statements 30 June 2020
18. Impairment of non-financial assets (continued)
82
Recognised impairment Assets are firstly assessed for impairment at the individual level. For the current financial year, this resulted in a pre-tax total of $285.8 million of impairments recognised in relation to various classes of assets, being: ● $71.2 million of capitalised exploration and mine development expenditure associated with tenements in the Yilgarn
region. Following a reassessment during the year of the Group's future iron ore operating plans in the Yilgarn region, the Group updated its Yilgarn Iron Ore Strategy which it announced to the ASX on 20 November 2019. The Yilgarn Iron Ore Strategy no longer places dependency on the need to mine at several deposits in which the Group had previously conducted significant exploration and development work. As a result, an impairment charge was recorded to fully write-off associated accumulated exploration and mine development expenditure;
● $145.4 million of various idle plant and equipment was impaired to reflect a change in management's future operational plans which no longer required utilisation of these assets; $22.5 million of this related to infrastructure associated with the Yilgarn tenements noted above;
● $15.4 million of ore stockpiles and $3.6 million of other inventory impaired to net realisable value; and ● $50.0 million of capitalised development costs to align carrying values with future recovery expectations. The Group considered assets which are assessed for impairment at the CGU level, with these assessments net of impairments summarised above. There was no resulting impairment charge for the year ended 30 June 2020 at the CGU level. There was no reversal of previous impairments recorded. Previously recognised impairment In the previous financial year, an impairment expense of $9.8 million represented the write-down of certain plant and equipment in the Mining Services segment which were assessed for impairment at the individual asset level.
19. Trade and other payables Group 2020 2019 $m $m Current liabilities Trade payables and accruals 305.9 248.7 Contract liabilities (note 4(b)) 13.2 10.8 319.1 259.5
Refer to note 25 for further information on financial instruments.
20. Borrowings Group 2020 2019 $m $m Current Other borrowings 1.2 1.1 Lease liability 99.3 54.1
100.5 55.2
Non-current Senior unsecured notes (i) 1,020.0 998.1 Less: capitalised transaction costs (13.3) (15.5) Lease liability 183.5 99.1
1,190.2 1,081.7
(i) US$700 million senior unsecured notes offering due 2027, at an interest rate of 8.125% per annum. Refer to note 25 for further information on financial instruments.

Mineral Resources Limited Notes to the financial statements 30 June 2020
20. Borrowings (continued)
83
Accounting policy for borrowings Loans and borrowings Loans and borrowings are initially recognised at the fair value of the consideration received, net of transaction costs. They are subsequently measured at amortised cost using the effective interest method. Where there is an unconditional right to defer settlement of the liability for at least 12 months after the reporting date, the loans or borrowings are classified as non-current Lease liability A lease liability is recognised at the commencement date of a lease. The lease liability is initially recognised at the present value of the lease payments to be made over the term of the lease, discounted using the interest rate implicit in the lease or, if that rate cannot be readily determined, the Group's incremental borrowing rate. Lease payments are comprised of fixed payments less any lease incentives receivable, variable lease payments that depend on an index or a rate, amounts expected to be paid under residual value guarantees, exercise price of a purchase option when the exercise of the option is reasonably certain to occur, and any anticipated termination penalties. The variable lease payments that do not depend on an index or a rate are expensed in the period in which they are incurred. Lease liabilities are measured at amortised cost using the effective interest method. The carrying amounts are remeasured if there is a change in the following: future lease payments arising from a change in an index or a rate used; residual guarantee; lease term; certainty of a purchase option and termination penalties. When a lease liability is remeasured, an adjustment is made to the corresponding right-of use asset, or to profit or loss if the carrying amount of the right-of-use asset is fully written down. The lease liabilities are effectively secured as the rights to the leased assets, recognised in the balance sheet as right-of-use assets and revert to the lessor in the event of default.
21. Employee benefits Group 2020 2019 $m $m Current Employee benefits 53.4 35.6
Accounting policy for employee benefits Liabilities for wages and salaries, including non-monetary benefits, annual leave and long service leave expected to be settled wholly within 12 months of the reporting date are measured at the amounts expected to be paid when the liabilities are settled. The current provision includes amounts for vested long service leave for which the Group does not have an unconditional right to defer settlement, regardless of when the actual settlement is expected to occur. However, based on past experience, the Group does not expect all employees to take the full amount of accrued leave or require payment within the next 12 months.

Mineral Resources Limited Notes to the financial statements 30 June 2020
84
22. Provisions Group 2020 2019 $m $m Current Project closure 10.8 4.9 Site rehabilitation 17.2 6.2 Other 1.5 0.3
29.5 11.4
Non-current Project closure 9.3 8.7 Site rehabilitation 89.0 80.3
98.3 89.0
Movements in provisions Movements in each class of provision during the current financial year, other than employee benefits, are set out below: Project Site Closure Rehabilitation Other Group - 2020 $m $m $m Carrying amount at the start of the year 13.6 86.5 0.3 Additional provisions recognised 6.5 19.8 1.3 Amounts used (0.1) (1.5) (0.1) Unwinding of discount - 1.5 -
Carrying amount at the end of the year 20.0 106.3 1.5
Accounting policy for provisions Provisions are recognised when the Group has a present (legal or constructive) obligation as a result of a past event, it is probable the Group will be required to settle the obligation, and a reliable estimate can be made of the amount of the obligation. The amount recognised as a provision is the best estimate of the consideration required to settle the present obligation at the reporting date, taking into account the risks and uncertainties surrounding the obligation. If the time value of money is material, provisions are discounted using a current pre-tax rate specific to the liability. The increase in the provision resulting from the passage of time is recognised as a finance cost. Key estimate: Site rehabilitation provisions In accordance with the Group's legal requirements, provision is made for the anticipated costs of future restoration
and rehabilitation of areas from which natural resources have been extracted. The provision includes costs associated with dismantling of assets, reclamation, plant closure, waste site closure, monitoring, demolition and decontamination. The provision is based upon current costs and has been determined on a discounted basis with reference to current legal requirements and current technology. Each reporting period the impact of unwinding of the discount is recognised in the income statement as a financing cost. Any change in the restoration provision is recorded against the carrying value of the provision and the related asset, only to the extent that it is probable that future economic benefits associated with the restoration expenditure will flow to the entity, with the effect being recognised in the income statement on a prospective basis over the remaining life of the relevant operation. The restoration provision is separated into current (estimated costs arising within 12 months) and non-current components based on the expected timing of these cash flows.
Key estimate: Project closure At the completion of some projects the Group has a liability for redundancy and the cost of relocating crushing and
other mobile plant. An assessment is undertaken on the probability that such expenses will be incurred in the normal course of business for contracting services and is provided for in the financial statements.

Mineral Resources Limited Notes to the financial statements 30 June 2020
85
23. Issued capital Group 2020 2019 2020 2019 Shares Shares $m $m Ordinary shares 188,469,830 188,098,571 526.6 519.6 Less: Treasury Shares (698,611) (795,359) (10.3) (11.7)
187,771,219 187,303,212 516.3 507.9
Movements in issued capital Less:
Ordinary
shares Treasury
shares
Total Details Number Number Number Balance at 1 July 2018 187,701,751 (304,559) 187,397,192 Shares issued under Dividend Reinvestment Plan 396,820 - 396,820 Purchase of shares under employee share plans - (1,245,000) (1,245,000) Employee share awards issued - 754,200 754,200
Balance at 30 June 2019 188,098,571 (795,359) 187,303,212 Shares issued under Dividend Reinvestment Plan 371,259 - 371,259 Employee share awards issued - 96,748 96,748
Balance at 30 June 2020 188,469,830 (698,611) 187,771,219
Less:
Ordinary
shares Treasury
shares
Total Details $m $m $m Balance at 1 July 2018 514.4 (3.2) 511.2 Shares issued under Dividend Reinvestment Plan 5.9 - 5.9 Purchase of shares under employee share plans - (18.9) (18.9) Employee share awards issued (0.7) 10.4 9.7
Balance at 30 June 2019 519.6 (11.7) 507.9 Shares issued under Dividend Reinvestment Plan 5.4 - 5.4 Employee share awards issued 1.6 1.4 3.0
Balance at 30 June 2020 526.6 (10.3) 516.3
Ordinary shares Ordinary shares entitle the holder to participate in dividends and the proceeds on the winding up of the Company in proportion to the number of and amounts paid on the shares held. The fully paid ordinary shares have no par value and the Company does not have a limited amount of authorised capital. On a show of hands every member present at a meeting in person or by proxy shall have one vote and upon a poll each share shall have one vote. Incremental costs directly attributable to the issue of new shares are shown in equity as a deduction, net of tax, from the proceeds. Treasury shares Movements in treasury shares represent acquisition of the Company’s shares on market and allocation of shares to the Company’s employees from the vesting of awards and exercise of rights under the employee share-based payment plans.
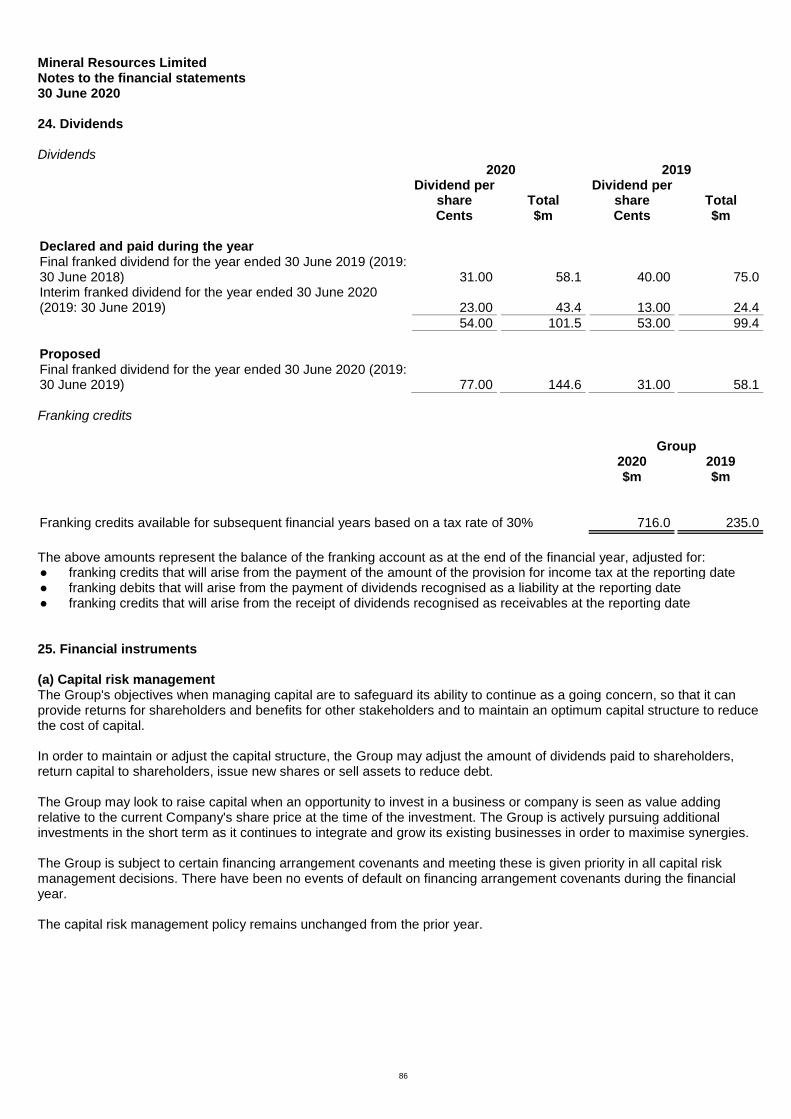
Mineral Resources Limited Notes to the financial statements 30 June 2020
86
24. Dividends Dividends 2020 2019
Dividend per
share
Total Dividend per
share
Total Cents $m Cents $m Declared and paid during the year Final franked dividend for the year ended 30 June 2019 (2019: 30 June 2018)
31.00
58.1
40.00
75.0
Interim franked dividend for the year ended 30 June 2020 (2019: 30 June 2019)
23.00
43.4
13.00
24.4
54.00 101.5 53.00 99.4
Proposed Final franked dividend for the year ended 30 June 2020 (2019: 30 June 2019)
77.00
144.6
31.00
58.1
Franking credits Group 2020 2019 $m $m Franking credits available for subsequent financial years based on a tax rate of 30% 716.0 235.0
The above amounts represent the balance of the franking account as at the end of the financial year, adjusted for: ● franking credits that will arise from the payment of the amount of the provision for income tax at the reporting date ● franking debits that will arise from the payment of dividends recognised as a liability at the reporting date ● franking credits that will arise from the receipt of dividends recognised as receivables at the reporting date
25. Financial instruments (a) Capital risk management The Group's objectives when managing capital are to safeguard its ability to continue as a going concern, so that it can provide returns for shareholders and benefits for other stakeholders and to maintain an optimum capital structure to reduce the cost of capital. In order to maintain or adjust the capital structure, the Group may adjust the amount of dividends paid to shareholders, return capital to shareholders, issue new shares or sell assets to reduce debt. The Group may look to raise capital when an opportunity to invest in a business or company is seen as value adding relative to the current Company's share price at the time of the investment. The Group is actively pursuing additional investments in the short term as it continues to integrate and grow its existing businesses in order to maximise synergies. The Group is subject to certain financing arrangement covenants and meeting these is given priority in all capital risk management decisions. There have been no events of default on financing arrangement covenants during the financial year.
The capital risk management policy remains unchanged from the prior year.

Mineral Resources Limited Notes to the financial statements 30 June 2020
25. Financial instruments (continued)
87
The gearing ratio at the reporting date was as follows: Group 2020 2019 $m $m Current liabilities - borrowings (note 20) 100.5 55.2 Current liabilities - lease liabilities (held for sale) - 25.6 Non-current liabilities - borrowings (note 20) 1,190.2 1,081.7 Total borrowings 1,290.7 1,162.5 Current assets - cash and cash equivalents (note 9) (1,521.8) (265.4)
(Cash and cash equivalents, net of debt)/Net debt (231.1) 897.1 Total equity 2,295.6 1,380.2
Total capital 2,064.5 2,277.3
Gearing ratio (11%) 39% (b) Financial risk management objectives The Group's activities expose it to a variety of financial risks: market risk (including foreign currency risk, price risk and interest rate risk), credit risk and liquidity risk. The Group's overall risk management program focuses on the unpredictability of financial markets and seeks to minimise potential adverse effects on the financial performance of the Group. The Group uses derivative financial instruments such as forward foreign exchange contracts to hedge certain risk exposures. Derivatives are exclusively used for hedging purposes, i.e. not as trading or other speculative instruments. The Group uses different methods to measure different types of risk to which it is exposed. These methods include sensitivity analysis in the case of interest rate, foreign exchange and other price risks, ageing analysis for credit risk and beta analysis in respect of investment portfolios to determine market risk. Risk management is carried out by senior finance and treasury executives ('Senior Finance and Treasury') under policies approved by the Board of Directors ('the Board'). These policies include identification and analysis of the risk exposure of the Group and appropriate procedures, controls and risk limits. Senior Finance and Treasury identifies, evaluates and hedge financial risks within the Group's operating units, and reports to the Board on a monthly basis. (c) Market risk Foreign currency risk The Group undertakes certain transactions denominated in foreign currency and is exposed to foreign currency risk through foreign exchange rate fluctuations. Foreign exchange risk arises from future commercial transactions and recognised financial assets and financial liabilities denominated in a currency that is not the entity's functional currency. The risk is measured using sensitivity analysis and cash flow forecasting. The Group enters into forward exchange contracts to buy and sell specified amounts of foreign currencies in the future at stipulated exchange rates. The objective in entering the forward exchange contracts is to protect the Group against unfavourable exchange rate movements for both the contracted and anticipated future sales undertaken in foreign currencies. Certain of these foreign exchange forward contracts are designated as hedging instruments, detailed in note 25(g). The carrying amount of the Group's foreign currency denominated financial assets and financial liabilities at the reporting date were as follows: Assets Liabilities 2020 2019 2020 2019 Group $m $m $m $m USD denominated 654.2 57.4 1,038.4 1,020.8

Mineral Resources Limited Notes to the financial statements 30 June 2020
25. Financial instruments (continued)
88
The following table demonstrates the sensitivity of these foreign currency denominated financial assets and financial liabilities to a weakening/strengthening in the Australian dollar, with all other variables held constant. The impact on the Group’s profit before tax is due to changes in the fair value of monetary assets and liabilities including non-designated foreign currency derivatives. The impact on the Group’s pre-tax equity is due to changes in the fair value of forward exchange contracts designated as cash flow hedges. 2020 2019
AUD strengthened/
(weakened)
Profit before tax higher/(lower)
Equity
higher/(lower)
Profit before tax higher/(lower)
Equity
higher/(lower) % $m $m $m $m USD denominated +5% 18.3 18.5 46.1 45.9 USD denominated -5% (20.2) (20.4) (51.0) (50.7) Commodity price risk The Group is exposed to commodity price risk which arises from the Group’s sale of iron ore, lithium direct ship ore (DSO) and lithium spodumene concentrate at contracted and/or spot prices. 2020 2019
Change in price
Profit before tax higher/(lower)
Equity higher/(lower)
Profit before tax higher/(lower)
Equity higher/(lower)
% $m $m $m $m Iron Ore +/- 10% 155.5 155.5 95.4 95.4 Lithium DSO +/- 10% 0.9 0.9 5.3 5.3 Lithium Spodumene +/- 10% 12.2 12.2 17.7 17.7 Equity price risk The Group’s investment in listed equity securities are susceptible to market price risk arising from uncertainties about future values of the investment securities. The Board reviews and approves all equity investment decisions. At the reporting date, the Group’s exposure to listed equity securities at fair value was $42.3 million (2019: $75.1 million). A decrease of 10% (2019: 10%) on the share prices could have an impact of approximately $4.2 million (2019: $7.5 million) on the profit or loss attributable to the Group. Interest rate risk The Group's exposure to the risk of changes in market interest rates relates primarily to the Group’s financial instruments that have variable interest rates. As at the reporting date, the Group is exposed to interest rate risk on its variable rate financial instruments as follows: 2020 2019
Weighted average
interest rate
Balance
Weighted average
interest rate
Balance Group % $m % $m Cash at bank and on hand 0.88% 1,184.9 1.72% 265.4
Net exposure to cash flow interest rate risk 1,184.9 265.4
An analysis by remaining contractual maturities is shown in 'liquidity risk' note 25(e) below. The Group has considered sensitivity relating to exposure to interest rate risk at reporting date. An official increase/decrease in interest rate of 100 (2019: 100) basis points would have a favourable/adverse effect on the profit before tax of $11.8 million (2019: $1.3 million) per annum.

Mineral Resources Limited Notes to the financial statements 30 June 2020
25. Financial instruments (continued)
89
(d) Credit risk Nature of the risk Credit risk refers to the risk that a counterparty will default on its contractual obligations resulting in financial loss to the Group. The Group's exposure to financial position credit risk are as indicated by the carrying amounts of its financial assets, primarily from customer receivables from operating activities and deposits with financial instruments from financing activities. The Group does not have a significant exposure to any individual counterparty. Credit risk management: trade receivables and contract assets The Group has adopted a lifetime expected loss allowance in estimating expected credit losses to trade receivables through the use of a provisions matrix using fixed rates of credit loss provisioning. These provisions are considered representative across all customers of the Group based on recent sales experience, historical collection rates and available forward-looking information. The Group has a strict policy for extending credit to customers, including obtaining agency credit information, confirming references and setting appropriate credit limits. The Group obtains guarantees where appropriate to mitigate credit risk and obtains letters of credit to mitigate credit risk for commodity sales. The maximum exposure to credit risk at the reporting date to trade receivables and contract assets is the carrying amount, net of any allowances for credit losses, as disclosed in the balance sheet and notes to the financial statements. The Group does not hold any collateral. Generally, trade receivables are written off when there is no reasonable expectation of recovery. Indicators of this include the failure of a debtor to engage in a repayment plan, no active enforcement activity and a failure to make contractual payments for a period greater than 1 year. In monitoring customer credit risk, customers are grouped according to their credit characteristics and counterparty type, including whether they arise from commodity sales, crushing and processing services or construction contracts, and the existence of previous financial difficulties. The Group's exposure to credit risk for trade receivables and contract assets by counterparty type as at the reporting date was as follows: Group 2020 2019 $m $m Commodity sale customers 33.7 69.6 Crushing and processing services customers 51.5 30.9 Other mining services 47.7 13.7 Other 43.0 53.3
175.9 167.5
The Group uses an allowance matrix to measure the ECLs of trade receivables based on shared credit risk characteristics and days past due. At 30 June 2020, the Group had $14.6 million (2019: $29 million) of trade receivables past due. These past due receivables substantially relate to customers for whom there is no history of default. On this basis, the resulting allowance for credit losses on trade receivables is not material. At 30 June 2020, the carrying amount of receivables and contract assets for the Group's two major customers (commodity sale customers) (2019: two commodity sale customers) totalled $4.3 million (2019: $50.4 million). The Group has no customers who are credit-impaired at the reporting date. Credit risk management: cash deposits and derivatives The credit risk on liquid funds and derivative financial instruments is limited as the counterparties are Australian banks with high credit-ratings assigned by international credit-rating agencies. Credit risk management: loan receivables and other financial assets Lending to external parties may be provided; secured by acceptable collateral as defined in the Group credit policy and business unit procedures. The Group restricts its dealings to counterparties that have acceptable credit ratings. Should the rating of a counterparty fall below certain levels, Group policy dictates that approval by the Board is required to maintain the level of the counterparty exposure. Alternatively, management may consider closing out positions with the counterparty or novating open positions to another counterparty with acceptable credit ratings.

Mineral Resources Limited Notes to the financial statements 30 June 2020
25. Financial instruments (continued)
90
Credit risk management: financial guarantees given to banks There is also exposure to credit risk when the Group provides a guarantee to another party. The Group's maximum exposure in this respect is the maximum amount the Group would have to pay if the guarantee is called upon. Details of contingent liabilities are disclosed in note 26. (e) Liquidity risk Vigilant liquidity risk management requires the Group to maintain sufficient liquid assets (mainly cash and cash equivalents) and available borrowing facilities to be able to pay debts as and when they become due and payable. The Group manages liquidity risk by maintaining adequate cash reserves and available borrowing facilities by continuously monitoring actual and forecast cash flows and matching the maturity profiles of financial assets and liabilities. Financing arrangements Unrestricted access was available at the reporting date to the following lines of credit: Group 2020 2019 $m $m Total facilities
Bank overdraft 4.0 4.0 Syndicated loan facility 250.0 250.0 Senior unsecured notes 1,020.0 998.1 Lease liability 250.0 250.0 Other borrowings 21.0 21.0 Bank guarantee 40.0 40.0
1,585.0 1,563.1
Used at the reporting date
Bank overdraft - - Syndicated loan facility - - Senior unsecured notes 1,020.0 998.1 Lease liability 243.8 178.7 Other borrowings 1.2 1.1 Bank guarantee 33.9 18.9 1,298.9 1,196.8
Unused at the reporting date
Bank overdraft 4.0 4.0 Syndicated loan facility 250.0 250.0 Senior unsecured notes - - Lease liability 6.2 71.3 Other borrowings 19.8 19.9 Bank guarantee 6.1 21.1
286.1 366.3
The bank overdraft facilities may be drawn at any time and may be terminated by the bank without notice. Remaining contractual maturities
The following tables detail the Group's remaining contractual maturity for its financial instrument liabilities. The tables have been drawn up based on the undiscounted cash flows of financial liabilities based on the earliest date on which the financial liabilities are required to be paid. The tables include both interest and principal cash flows disclosed as remaining contractual maturities and therefore these totals may differ from their carrying amount in the balance sheet.

Mineral Resources Limited Notes to the financial statements 30 June 2020
25. Financial instruments (continued)
91
Weighted average
interest rate
1 year or
less
Between 1 and 2 years
Between 2 and 5 years
Over 5 years
Remaining contractual maturities
Group - 2020 % $m $m $m $m $m Non-derivatives Non-interest bearing Trade payables - 319.1 - - - 319.1 Interest-bearing - fixed rate Senior unsecured notes 8.125% - - - 1,020.0 1,020.0 Lease liability 3.616% 99.3 89.9 72.7 20.9 282.8 Other 1.030% 1.2 - - - 1.2
Total non-derivatives 419.6 89.9 72.7 1,040.9 1,623.1
Weighted average
interest rate
1 year or
less
Between 1 and 2 years
Between 2 and 5 years
Over 5 years
Remaining contractual maturities
Group - 2019 % $m $m $m $m $m Non-derivatives Non-interest bearing Trade payables - 259.4 - - - 259.4 Interest-bearing - fixed rate Senior unsecured notes 8.125% - - - 998.1 998.1 Lease liability 4.079% 62.7 54.5 61.5 - 178.7 Other 1.250% 1.1 - - - 1.1
Total non-derivatives 323.2 54.5 61.5 998.1 1,437.3
The cash flows in the maturity analysis above are not expected to occur significantly earlier than contractually disclosed above. (f) Fair value of financial instruments Fair value hierarchy The following tables detail the Group's assets and liabilities, measured or disclosed at fair value, using a three level hierarchy, based on the lowest level of input that is significant to the entire fair value measurement, being: Level 1: Quoted prices (unadjusted) in active markets for identical assets or liabilities that the entity can access at the
measurement date Level 2: Inputs other than quoted prices included within Level 1 that are observable for the asset or liability, either
directly or indirectly Level 3: Unobservable inputs for the asset or liability
Level 1 Level 2 Level 3 Total Group - 2020 $m $m $m $m Assets Financial assets held at fair value through profit or loss: - Shares in listed corporations
42.3
-
-
42.3
- Deferred consideration receivable from sale of disposal group
-
-
606.1
606.1
Total assets 42.3 - 606.1 648.4
Liabilities Other liabilities: Foreign exchange forward contracts in cash flow hedges
(5.9)
-
-
(5.9)
Total liabilities (5.9) - - (5.9)

Mineral Resources Limited Notes to the financial statements 30 June 2020
25. Financial instruments (continued)
92
Level 1 Level 2 Level 3 Total Group - 2019 $m $m $m $m Assets Financial assets held at fair value through profit or loss - Shares in listed corporations
75.1
-
-
75.1
Other assets: Foreign exchange forward contracts in cash flow hedges
6.0
-
-
6.0
Total assets 81.1 - - 81.1
Unless otherwise stated the carrying amount of financial instruments reflect their fair value. The carrying amounts of trade and other receivables and trade and other payables are assumed to approximate their fair values due to their short-term nature. Valuation techniques for fair value measurements categorised within level 3 The basis of the valuation of deferred consideration receivable is fair value. The Group obtained an independent valuation of the deferred consideration measured at fair value, arising from the sale of Wodgina on 1 November 2019 as per Note 13. The main level 3 inputs used in the independent valuation were derived and evaluated as follows:
Discount rate, assumed fixed tolling charges per annum per feed tonne capacity, assumed variable tolling charges per wet metric tonne feed.
Considered against the value implied by the Wodgina sale consideration for the arms-length transaction that completed on 1 November 2019.
The Group assessed that there were no material changes at the end of the reporting period since initial recognition. Accounting policy for fair value measurement When an asset or liability, financial or non-financial, is measured at fair value for recognition or disclosure purposes, the fair value is based on the price that would be received to sell an asset or paid to transfer a liability in an orderly transaction between market participants at the measurement date; and assumes that the transaction will take place either: in the principal market; or in the absence of a principal market, in the most advantageous market. Fair value is measured using the assumptions that market participants would use when pricing the asset or liability, assuming they act in their economic best interests. For non-financial assets, the fair value measurement is based on its highest and best use. Valuation techniques that are appropriate in the circumstances and for which sufficient data are available to measure fair value, are used, maximising the use of relevant observable inputs and minimising the use of unobservable inputs. Assets and liabilities measured at fair value are classified into three levels, using a fair value hierarchy that reflects the significance of the inputs used in making the measurements. Classifications are reviewed at each reporting date and transfers between levels are determined based on a reassessment of the lowest level of input that is significant to the fair value measurement. For recurring and non-recurring fair value measurements, external valuers may be used when internal expertise is either not available or when the valuation is deemed to be significant. External valuers are selected based on market knowledge and reputation. Where there is a significant change in fair value of an asset or liability from one period to another, an analysis is undertaken, which includes a verification of the major inputs applied in the latest valuation and a comparison, where applicable, with external sources of data. Unless otherwise stated, the carrying amounts of financial instruments reflect their fair value. (g) Hedge activities and derivatives The Group is exposed to risk from movements in foreign exchange in relation to its forecast US dollar denominated sales and as part of the risk management strategy has entered into foreign exchange forward contracts. Certain of these foreign exchange forward contracts are designated as hedging instruments in cash flow hedges of forecast sales in US dollar.

Mineral Resources Limited Notes to the financial statements 30 June 2020
25. Financial instruments (continued)
93
The following contracts in relation to US Dollar revenue from forecasted sales remain open at the reporting date: ● Foreign exchange forward contracts covering US$30 million a month up to March 2021; a total of US$210.0 million, at
an average rate of 0.6876 (2019: US$30 million a month to May 2020, total of US$330 at an average rate of 0.6986) These forward contracts were entered into in April 2020 to correspond with the forecasted iron ore sales for the following 12 months to March 2021 (2019: 12 months to May 2020), and were closed out subsequent to the year end in July 2020, with an immaterial gain realised. The hedged US Dollar revenues do not represent the full value of expected sales over this period. The ineffective portion was immaterial in the current period. Accounting policy for derivative financial instruments The Group may hold derivative financial instruments from time to time to hedge its foreign currency risk exposure and a portion of its exposure to iron ore prices. Derivatives are initially recognised at fair value on the date a derivative contract is entered into and are subsequently remeasured to their fair value at each reporting date. The accounting for subsequent changes in fair value depends on whether the derivative is designated as a hedging instrument, and if so, the nature of the item being hedged. Cash flow hedges Cash flow hedges are used to cover the Group's exposure to variability in cash flows that is attributable to particular risks associated with a recognised asset or liability or a firm commitment which could affect profit or loss. When a derivative is designated as a cash flow hedging instrument, the effective portion of the gain or loss on the hedging instrument is recognised in other comprehensive income through the cash flow hedges reserve in equity, whilst the ineffective portion is recognised in profit or loss. Amounts taken to equity are transferred out of equity and included in the measurement of the hedged transaction when the forecast transaction occurs. Cash flow hedges are tested for effectiveness on a regular basis both retrospectively and prospectively to ensure that each hedge is highly effective and continues to be designated as a cash flow hedge. If the forecast transaction is no longer expected to occur, the amounts recognised in equity are transferred to profit or loss.
26. Contingent liabilities Bank guarantees The Group has provided guarantee to third parties in relation to performance of contracts and against warranty obligations for a defects liability period after completion of the work. Defects liability periods are usually from 12 to 18 months duration. Bank guarantees are issued as security for these obligations. Group 2020 2019 $m $m Bank guarantee facility 40.0 40.0 Amount utilised (33.9) (18.9)
Unused facility 6.1 21.1

Mineral Resources Limited Notes to the financial statements 30 June 2020
94
27. Commitments Group 2020 2019 $m $m Capital commitments Commitments relating to the purchase of property, plant and equipment contracted for at reporting date and not recognised as liabilities, payable:
- Within one year 167.4 94.1
Capital commitments relating to the Group's interest in a joint operation contracted for at reporting date but not recognised as liabilities, payable:
-
-
- Within one year 27.4 - - Within one to five years 1.2 -
196.0 94.1
Lease commitments (i) Committed at the reporting date and not recognised as liabilities, payable: - Within one year - 6.6 - One to five years - 16.1 - More than five years - 21.5 - 44.2
(i) Lease commitments committed as at 30 June 2019 and not recognised as liabilities related to operating lease
commitments which included contracted amounts for various retail outlets, warehouses, offices and plant and equipment under non-cancellable operating leases expiring within one to five years with, in some cases, options to extend. The leases have various escalation clauses. On renewal, the terms of the leases are renegotiated.
From 1 July 2019, the Group has adopted AASB 16. The Group has recognised right-of-use assets and corresponding liabilities for these leases on commencement date, except for short-term and low-value leases. Refer note 1.3(a) for further information. Refer to note 25(e) for remaining contractual maturities on lease liabilities. The Group has no non-cancellable leases to which it has committed to, and have not yet commenced, as at 30 June 2020.
28. Parent entity information Set out below is the supplementary information about the parent entity. Income statement Parent 2020 2019 $m $m Profit after tax 49.7 29.8
Total comprehensive income 49.7 29.8

Mineral Resources Limited Notes to the financial statements 30 June 2020
28. Parent entity information (continued)
95
Balance sheet Parent 2020 2019 $m $m Total current assets 1,415.5 1,169.7
Total assets 4,724.9 1,421.5
Total current liabilities 514.8 59.6
Total liabilities 4,620.9 1,267.3
Net assets 104.0 154.2
Equity
Issued capital 516.4 508.0 Reserves 8.8 14.7 Accumulated losses (421.2) (368.5)
Total equity 104.0 154.2
Guarantees entered into by the parent entity in relation to the debts of its subsidiaries The parent entity had no guarantees in relation to the debts of its subsidiaries as at 30 June 2020 and 30 June 2019 other than as obligor under its syndicated financing facilities. Contingent liabilities The parent entity had no contingent liabilities as at 30 June 2020 (2019: $nil). Capital commitments - Property, plant and equipment The parent entity had no capital commitments for property, plant and equipment at as 30 June 2020 (2019: $nil). Significant accounting policies The accounting policies of the parent entity are consistent with those of the Group, as disclosed in note 1, except for the following: ● Investments in subsidiaries are accounted for at cost, less any impairment, in the parent entity ● Investments in associates are accounted for at cost, less any impairment, in the parent entity ● Dividends received from subsidiaries are recognised as other income by the parent entity
29. Business combinations Business combinations in 2020
Acquisition of Resource Development Group Limited (RDG)
On 17 June 2020, the Group acquired 1,897,587,201 fully paid ordinary shares of Resource Development Group Limited (ASX: RDG, RDG), which equates to 75% of RDG’s total issued capital on a fully diluted basis (the Acquisition). The Acquisition was pursuant to an Asset Sale Agreement executed on 18 March 2020 for MRL to transfer a 100% interest in the Ant Hill and Sunday Hill manganese tenements to RDG in return for MRL receiving RGD scrip, equivalent to a 75% shareholding in RDG. The Acquisition results in the restructure of MRL’s non-core manganese assets, which are more relevant in scale to a company such as RDG that can provide the necessary strategic and financial support for the development of these assets, allowing MRL’s core focus to increasingly be on assets that have significant scale and mine life and are able to deliver value for all shareholders.

Mineral Resources Limited Notes to the financial statements 30 June 2020
29. Business combinations (continued)
96
The Acquisition has been accounted for using the Acquisition Method set out in AASB 3 Business Combinations (AASB 3). In accordance with AASB 3, the acquirer is required to fair value all acquired assets and liabilities. The initial accounting for the acquisition of RDG has been provisionally determined (as permitted by AASB 3) due to the proximity of the acquisition to the reporting date. The provisional determination will be reviewed and finalised within 12 months of the Acquisition, in accordance with AASB 3, should any new information obtained affect the fair values at the date of acquisition. Details of the business combination are as follows: $m Fair value of identifiable assets acquired and liabilities assumed: Assets Cash 11.1 Receivables 5.9 Inventories 0.5 Current tax asset 0.1 Property, plant and equipment 9.3 Exploration and mine development 14.8 Deferred tax assets 0.3
Total assets 42.0 Liabilities Payables (4.6) Provisions (0.7) Borrowings - lease liabilities (3.5) Deferred tax liabilities (0.9) Total liabilities (9.7)
Fair value of net identifiable assets acquired 32.3
Non-controlling interest in RDG measured at fair value (13.3) Total consideration transferred (14.8)
Provisional gain on bargain purchase arising on acquisition 4.2
Consideration satisfied by: - Manganese assets transferred 14.8
Total consideration transferred 14.8
Consideration transferred relates to the manganese assets and is not recognised at fair value, in accordance with AASB 3, as the manganese assets remain within the consolidated entity and MRL therefore retains control of the manganese assets. As a result, the manganese assets continue to be measured at their carrying amount immediately before the acquisition date and no gain or loss is recognised before and after the business combination. A Gain on Bargain Purchase (as defined in AASB 3) arose in the business combination of RDG, as the fair value of the net assets of RDG that MRL obtained control over, by virtue of a 75% shareholding in RDG, exceeds the fair value of the non-controlling interest. The gain on bargain purchase of $4.2 million has been recognised as Other Income in the income statement for the year ended 30 June 2020. The fair value of the 25% non-controlling interest in RDG has been estimated with reference to the quoted market price of the shares at acquisition date. $m Analysis of cash flows on acquisition: Net cash acquired with the subsidiary (included in cash flows from investing activities)
11.1

Mineral Resources Limited Notes to the financial statements 30 June 2020
29. Business combinations (continued)
97
Transaction costs relating to the acquisition were immaterial. Given the proximity of the date of acquisition to the reporting date, RDG’s contributed revenue and profit to the combined entity between the date of acquisition and the reporting date 30 June 2020 is immaterial. If the acquisition of RDG had been completed on the first day of the financial year, Group revenues for the year would have been $28.8 million and Group profit after tax would have been $2.2 million higher. Business combinations in 2019 Acquisition of additional interest in Reed Industrial Minerals Pty Ltd (RIM) On 17 March 2019, the Group completed the purchase of an additional 6.9% equity interest in Reed Industrial Minerals Pty Ltd (RIM) under a Share Sale Agreement (Sale Agreement) with Neometals Ltd (ASX: NMT) (Neometals) for the Group and Ganfeng Lithium Co., Ltd (Ganfeng) to jointly and equally acquire Neometals’ 13.8% equity interest. The acquisition would take the Group’s interest in RIM and its underlying Mt Marion Lithium Project from 43.1% to 50.0%. The Group accounts for its interest in RIM as an interest in a joint operation and will continue to do so with its 50.0% interest as joint control has been maintained. The business combination principles were applied to the acquisition of the additional 6.9% interest in the joint operation. The Group’s previously held 43.1% interest in the joint operation was not remeasured. The acquisition accounting balances recognised at 30 June 2019 were based on a provisional assessment of their fair value, which have since been finalised in the current year ended 30 June 2020 with no changes required to the provisional fair values of the identifiable assets acquired and liabilities assumed at the date of acquisition. The fair value of the additional 6.9% interest in the identifiable assets acquired and liabilities assumed at the date of acquisition were: $m Fair value of identifiable assets acquired and liabilities assumed: Assets Cash and cash equivalents 7.5 Receivables 2.4 Inventory 2.0 Property, plant and equipment 1.7 Exploration and mine development 47.0
Total assets 60.6
Liabilities Trade and other payables (7.8) Deferred tax liability (0.9)
Total liabilities (8.7)
Fair value of net identifiable assets acquired 51.9
Consideration satisfied by: - Cash 51.9
Total consideration transferred (51.9)
Goodwill -
The purchase consideration is deemed to be representative of the fair value of the additional 6.9% interest in the underlying assets acquired and liabilities assumed, being substantially the tenements and mine development properties of the underlying Mt Marion Lithium Project, hence no goodwill nor gain on bargain purchase arises.

Mineral Resources Limited Notes to the financial statements 30 June 2020
29. Business combinations (continued)
98
Accounting policy for business combinations The acquisition method of accounting is used to account for business combinations regardless of whether equity instruments or other assets are acquired. The consideration transferred is the sum of the acquisition-date fair values of the assets transferred, equity instruments issued or liabilities incurred by the acquirer to former owners of the acquiree and the amount of any non-controlling interest in the acquiree. For each business combination, the non-controlling interest in the acquiree is measured at either fair value or at the proportionate share of the acquiree's identifiable net assets. All acquisition costs are expensed as incurred to profit or loss. On the acquisition of a business, the Group assesses the financial assets acquired and liabilities assumed for appropriate classification and designation in accordance with the contractual terms, economic conditions, the Group's operating or accounting policies and other pertinent conditions in existence at the acquisition-date. Where the business combination is achieved in stages, the Group remeasures its previously held equity interest in the acquiree at the acquisition-date fair value and the difference between the fair value and the previous carrying amount is recognised in profit or loss. Contingent consideration to be transferred by the acquirer is recognised at the acquisition-date fair value. Subsequent changes in the fair value of the contingent consideration classified as an asset or liability is recognised in profit or loss. Contingent consideration classified as equity is not remeasured and its subsequent settlement is accounted for within equity. The difference between the acquisition-date fair value of assets acquired, liabilities assumed and any non-controlling interest in the acquiree and the fair value of the consideration transferred and the fair value of any pre-existing investment in the acquiree is recognised as goodwill. If the consideration transferred and the pre-existing fair value is less than the fair value of the identifiable net assets acquired, being a bargain purchase to the acquirer, the difference is recognised as a gain directly in profit or loss by the acquirer on the acquisition-date, but only after a reassessment of the identification and measurement of the net assets acquired, the non-controlling interest in the acquiree, if any, the consideration transferred and the acquirer's previously held equity interest in the acquirer. Business combinations are initially accounted for on a provisional basis. The acquirer retrospectively adjusts the provisional amounts recognised and also recognises additional assets or liabilities during the measurement period, based on new information obtained about the facts and circumstances that existed at the acquisition-date. The measurement period ends on either the earlier of (i) 12 months from the date of the acquisition or (ii) when the acquirer receives all the information possible to determine fair value.

Mineral Resources Limited Notes to the financial statements 30 June 2020
99
30. Interests in subsidiaries The consolidated financial statements incorporate the assets, liabilities and results of the following material subsidiaries in accordance with the accounting policy described in note 1: Ownership interest 2020 2019 Name Country of incorporation % % Crushing Services International Pty Ltd Australia 100.00% 100.00% Mesa Minerals Limited Australia 59.40% 59.40% PIHA Pty Ltd Australia 100.00% 100.00% Polaris Metals Pty Ltd Australia 100.00% 100.00% Process Minerals International Pty Ltd Australia 100.00% 100.00% Auvex Resources Pty Ltd Australia 100.00% 100.00% Mineral Resources (Equipment) Pty Ltd Australia 100.00% 100.00% MRL Asset Management Pty Ltd Australia 100.00% 100.00% MIS Carbonart Pty Ltd Australia 60.00% 60.00% Mineral Resources Transport Pty Ltd Australia 100.00% 100.00% Wodgina Lithium Pty Ltd Australia 100.00% 100.00% Bulk Ore Shuttle Systems Pty Ltd Australia 50.00% 50.00% Energy Resources Pty Ltd New Zealand 100.00% 100.00% Cattamarra Farms Pty Ltd Australia 90.00% 90.00% Yilgarn Iron Pty Ltd Australia 100.00% 100.00% Iron Resources Pty Ltd Australia 100.00% 100.00% Kumina Iron Pty Ltd Australia 100.00% 100.00% Mineral Resources Rail Pty Ltd* Australia 100.00% - MinRes Health Pty Ltd (previously ACN 629 928 150) Australia 100.00% 100.00% Bungaroo South Pty Ltd** Australia 100.00% - Buckland Minerals Transport Pty Ltd** Australia 100.00% - Cape Preston Logistics Pty Ltd** Australia 100.00% - Resource Development Group Limited** Australia 75.00% - *Entity incorporated during the year **Entity acquired during the year
31. Interests in joint operations The Group has recognised its share of jointly held assets, liabilities, revenues and expenses of joint operations. These have been incorporated in the financial statements under the appropriate classifications. Information relating to joint operations that are material to the Group are set out below: Ownership interest Principal place of business / 2020 2019 Name Country of incorporation % % Reed Industrial Minerals Pty Ltd Australia 50.00% 50.00% MARBL Lithium Joint Venture Australia 40.00% -
32. Related party transactions Parent entity Mineral Resources Limited is the parent entity. Subsidiaries Interests in subsidiaries are set out in note 30. Joint operations Interests in joint operations are set out in note 31.

Mineral Resources Limited Notes to the financial statements 30 June 2020
32. Related party transactions (continued)
100
Key management personnel Disclosures relating to key management personnel are set out in note 33 and the remuneration report included in the directors' report. Transactions with related parties The value of transactions with related parties and outstanding balances in relation to transactions with related parties were as follows: Group
Transaction values for the year ended 30 June 2020
Transaction values for the year ended 30 June 2019
Balances
outstanding as at 30 June
2020
Balances
outstanding as at 30 June
2019 $m $m $m $m Key Management Personnel: Properties from which the Group's operations are performed are rented from parties related to Chris Ellison and Peter Wade
(2.1)
(2.0)
-
- Occupation of these premises date back prior to the Company’s listing in 2006. The ongoing need for occupation of these premises, as well as rental arrangements, are assessed periodically. The Group has a Related Party Transaction Policy that requires the review and approval of Related Party Transactions by the Audit and Risk Committee (the Committee). A resolution is required by the Company’s Board of Directors (where applicable, excluding those involved in the Related Party Transaction) to confirm that the transaction is on terms not materially less favourable than terms generally available from an unaffiliated third party under the same or similar circumstances. Terms and conditions All transactions were made on normal commercial terms and conditions and at market rates.
33. Key Management Personnel disclosures Compensation The aggregate compensation made to directors and other members of key management personnel of the Group is set out below: Group 2020 2019 $m $m Short-term employee benefits 5.5 8.3 Post-employment benefits 0.1 0.2 Share-based payments 3.9 2.0
9.5 10.5
Detailed information about the remuneration received by each KMP is provided in the Remuneration Report that is audited and forms part of the directors' report.
34. Share based payments Expense arising from share-based payment transactions The expense recognised for employee services received during the year is shown in the following table:

Mineral Resources Limited Notes to the financial statements 30 June 2020
34. Share based payments (continued)
101
Group 2020 2019 $m $m Equity-settled share-based payment transactions 6.7 3.3
Number and fair value of share awards granted during the period
Weighted average fair
value
Granted $ Number FY20 STI plan (for Key Executives) (Share Rights) 21.17 73,120 FY20 LTI plan (for Key Executives) (Share Rights) 15.05 359,413 FY20 Annual and One-off Rights Plans (Share Rights) 13.82 1,431,099 The weighted average fair value of the above equity instruments granted was determined with reference to the share price on the date of grant. Additional information on the award schemes granted in FY20 are as follows: (i) FY20 Short Term Incentive Plan (FY20 STI plan)
Executive KMP are invited to participate in the FY20 STI plan, under which awards made under the STI plan that exceed 50% of the FAR for the Managing Director or 40% of FAR for other KMP, will be settled in the form of MRL shares that vest progressively over the two years following grant, subject to continued service and application of clawback provisions. Further details on the FY20 STI plan are provided in the remuneration report.
(ii) F20 Long Term Incentive Plan (FY20 LTI plan) Executive KMP are invited to participate in the FY20 LTI plan, under which participants receive share rights in the Company, subject to four years of continuing service and testing of the performance measure over a four-year performance period. The performance measure is the four-year average ROIC enjoyed by the Company over the performance period compared with hurdles set in advance by the Board. Further details on the FY20 LTI plan are provided in the remuneration report.
(iii) FY20 Annual and One-off Rights Plans Under the FY20 Annual Rights and One-off Rights Plans, eligible employees are invited to receive share rights in the Company, subject to employees remaining in service for a period of three to five years from the date of grant. Share Rights under the plan do not carry voting entitlements.

Mineral Resources Limited Notes to the financial statements 30 June 2020
34. Share based payments (continued)
102
Equity-settled awards outstanding Details of equity-settled share awards outstanding as at the reporting date are presented in the following table:
Schemes
Grant date
Expected
vesting date
Outstanding at 30 June
2020
Outstanding at 30 June
2019
Vesting
conditions Number Number FY16 LTI (Share Rights) Aug-16 Aug-16/17/18/19 - 102,774 Non-market FY17 LTI (Share Rights) Aug-17 Aug-18/19/20 159,407 653,365 Non-market FY18 LTI (Share Rights) Aug-18 Aug-19/20/21 384,006 410,380 Non-market FY20 STI (for Key Executives)
(Share Rights) Jul-20 Aug-21/22 73,120 - Non-market
FY20 LTI (for Key Executives)
(Share Rights) Sep-19 Aug-23 359,413 - Non-market
FY20 Annual and One-off Rights Plans (Employees)
(Share Rights) Sep-19 Jul-22 / Sep-24 1,317,856 - Non-market
Outstanding balance in relation to Share Rights granted under the FY16, FY17 and FY18 LTI plans represent awards not yet vested nor issued. Shares are issued upon vesting (no exercise required) and may be subject to trading restrictions. Outstanding balance in relation to Share Rights granted under the FY20 plans represent awards not yet exercised. No awards have vested as at reporting date. Accounting policy for share based payments Certain employees may receive remuneration in the form of share-based compensation. Equity-settled Equity-settled transactions are awards of shares, or options over shares that are provided to employees in exchange for the rendering of services. The cost of equity-settled transactions are measured at fair value on grant date and recognised as an expense with a corresponding increase in equity over the vesting period. The cumulative charge to profit or loss is calculated based on the grant date fair value of the award, the best estimate of the number of awards that are likely to vest and the expired portion of the vesting period. The amount recognised in profit or loss for the period is the cumulative amount calculated at each reporting date less amounts already recognised in previous periods. If the non-vesting condition is within the control of the Group or employee, the failure to satisfy the condition is treated as a cancellation. If the condition is not within the control of the Group or employee and is not satisfied during the vesting period, any remaining expense for the award is recognised over the remaining vesting period, unless the award is forfeited.

Mineral Resources Limited Notes to the financial statements 30 June 2020
103
35. Remuneration of auditors During the financial year the following fees were paid or payable for services provided by RSM Australia Partners, the auditor of the Company: Group 2020 2019 $'000 $'000 Audit services - RSM Australia Partners Audit or review of the financial statements 551 446 Other services - RSM Australia Partners & overseas network firms Taxation services 64 204 Due diligence services required for US Notes offering - 169
64 373
615 819
36. Events after the reporting period The following significant events have arisen since the end of the financial year. Dividend On 19 August 2020, the directors declared a final fully franked dividend for the year ended 30 June 2020 of 77.0 cents per share to be paid on 15 September 2020, a total estimated distribution of $144.6 million based on the number of ordinary shares on issue as at 26 August 2020. COVID-19 pandemic The impact of the COVID-19 pandemic is ongoing and has not had a material impact for the Group's operations during the year ended 30 June 2020. It is not practicable to estimate the potential impact, positive or negative, after the reporting date. The challenges presented by COVID-19 are fluid and continue to change. The Group will continue to assess and update the Group’s response to the COVID-19 pandemic. Purchase of corporate headquarters On 30 July 2020, the Group executed a contract for the sale and purchase of land and buildings intended for the Group’s new corporate headquarters in Osborne Park approximating $65.0 million inclusive of purchase price, duty and other transactional costs. Subsequent to the reporting date, the Group terminated the lease agreement for corporate headquarters in Subiaco, which has been recognised as a right-of-use asset with a corresponding lease liability on the balance sheet as at 30 June 2020. The parties are in dispute over the termination. Given the proximity of the matter to the reporting date, the legal costs or potential claims cannot be reliably estimated as at the date of this report.
No other matter or circumstance has arisen since 30 June 2020 that has significantly affected, or may significantly affect the Group's operations, the results of those operations, or the Group's state of affairs in future financial years.

Mineral Resources Limited Directors' declaration 30 June 2020
104
In the directors' opinion: ● the attached financial statements and notes comply with the Corporations Act 2001, the Accounting Standards, the
Corporations Regulations 2001 and other mandatory professional reporting requirements; ● the attached financial statements and notes comply with International Financial Reporting Standards as issued by the
International Accounting Standards Board as described in note 1 to the financial statements; ● the attached financial statements and notes give a true and fair view of the Group's financial position as at 30 June
2020 and of its performance for the financial year ended on that date; and ● there are reasonable grounds to believe that the Company will be able to pay its debts as and when they become due
and payable. The directors have been given the declarations required by section 295A of the Corporations Act 2001. Signed in accordance with a resolution of directors made pursuant to section 295(5)(a) of the Corporations Act 2001. On behalf of the directors
Chris Ellison Managing Director 19 August 2020 Perth

THE POWER OF BEING UNDERSTOODAUDIT | TAX | CONSULTING
RSM Australia Partners is a member of the RSM network and trades as RSM. RSM is the trading name used by the members of the RSM network. Each member of the RSM network is an independent accounting and consulting firm which practices in its own right. The RSM network is not itself a separate legal entity in any jurisdiction.
RSM Australia Partners ABN 36 965 185 036
Liability limited by a scheme approved under Professional Standards Legislation
RSM Australia Partners
Level 32, Exchange Tower 2 The Esplanade Perth WA 6000 GPO Box R1253 Perth WA 6844
T +61 (0) 8 9261 9100 F +61 (0) 8 9261 9111
www.rsm.com.au
INDEPENDENT AUDITOR’S REPORT TO THE MEMBERS OF
MINERAL RESOURCES LIMITED
Opinion
We have audited the financial report of Mineral Resources Limited (the Company) and its subsidiaries (the Group), which comprises the consolidated balance sheet as at 30 June 2020, the consolidated income statement, the consolidated statement of changes in equity and the consolidated statement of cash flows for the year then ended, and notes to the financial statements, including a summary of significant accounting policies, and the directors' declaration.
In our opinion, the accompanying financial report of the Group is in accordance with the Corporations Act 2001, including:
(i) giving a true and fair view of the Group's financial position as at 30 June 2020 and of its financial performance for the year then ended; and
(ii) complying with Australian Accounting Standards and the Corporations Regulations 2001.
Basis for Opinion
We conducted our audit in accordance with Australian Auditing Standards. Our responsibilities under those standards are further described in the Auditor's Responsibilities for the Audit of the Financial Report section of our report. We are independent of the Group in accordance with the auditor independence requirements of the Corporations Act 2001 and the ethical requirements of the Accounting Professional and Ethical Standards Board's APES 110 Code of Ethics for Professional Accountants (the Code) that are relevant to our audit of the financial report in Australia. We have also fulfilled our other ethical responsibilities in accordance with the Code.
We confirm that the independence declaration required by the Corporations Act 2001, which has been given to the directors of the Company, would be in the same terms if given to the directors as at the time of this auditor's report.
We believe that the audit evidence we have obtained is sufficient and appropriate to provide a basis for our opinion.

Key Audit Matters
Key audit matters are those matters that, in our professional judgement, were of most significance in our audit of the financial report of the current period. These matters were addressed in the context of our audit of the financial report as a whole, and in forming our opinion thereon, and we do not provide a separate opinion on these matters.
Key Audit Matter How our audit addressed this matter
Sale of 60% interest in the Wodgina Lithium Project Refer to Note 13 in the financial statementsIn June 2019, the Group committed to sell a 60% interest in certain tenements, assets and related infrastructure, together comprising the Wodgina Lithium Project under a binding Asset Sale and Share Subscription Agreement (Sale Agreement) with Albemarle Corporation (NYSE: ALB, Albemarle).
On 1 November 2019, the Group completed its transaction with Albemarle for the sale of 60% of the Wodgina Lithium Project.
The Group has determined that Albemarle has control over the Joint Venture arrangement and the disposal of the Wodgina Lithium Project was accounted for as a partial asset disposal.
We determined this to be a key audit matter as the accounting treatment of the disposal is complex and the resulting gain on disposal has a significant impact on the financial results of the Group. In addition, proceeds from the sale of the disposal group included non-cash deferred consideration which was measured at fair value.
Our audit procedures included, among others:
Obtaining the Sale Agreement and other associated documents to understand the transaction;
Assessing the Group’s determination that Albemarle has control over the Joint Venture arrangement and the transaction was a partial asset disposal;
Assessing the accuracy and completeness of assets and liabilities of the disposal group at the date of disposal;
Agreeing the proceeds of the consideration transferred to the Sale Agreement, other associated documents and to the bank account; and
Reviewing management’s determination of the fair value of the non-cash consideration.
Impairment consideration for Intangible Assets Refer to Note 16 in the financial statements For the year ended 30 June 2020, the Group has performed an impairment assessment over the capitalised development costs as part of its annual impairment testing process for intangible assets not yet available for use by comparing it’s carrying amount with its future recoverable amount.
This was considered a key audit matter due to the significant judgment involved in the impairment assessment which resulted in a $50.0 million impairment charge in relation to capitalised development costs.
Our audit procedures included, among others:
Updating our understanding of the nature of the capitalised development costs;
Assessing the basis used by management to determine the recoverable amount of the capitalised development costs;
Evaluating the assumptions used by management in determining the recoverable amount; and
Assessing the appropriateness of the impairment charge recorded against capitalised development costs.

Impairment consideration for Mine Development and Exploration Expenditure Refer to Notes 17 and 18 in the financial statements The Group has capitalised mine development and exploration expenditure with a carrying value of $344.4 million and $132.0 million as at 30 June 2020 respectively.
This was considered a key audit matter due to the significant judgment involved in determining whether there are any indicators of impairment and appropriateness of the resulting impairment charges.
Areas of judgment include:
Assessing the risk of impairment of assets associated with tenements in the Yilgarn region following the reassessment of the Yilgarn Iron Ore Strategy. An impairment charge of $71.2 million was recorded against mine development and exploration expenditure and $22.5 million against related infrastructure recorded in property, plant and equipment; and
Assessing whether any impairment indicators existed in its cash generating units (CGU) which would require impairment testing to be performed.
Our audit procedures included, among others:
Assessing the appropriateness of the Group’s impairment charge recorded against the assets associated with the tenements in the Yilarn region; and
Critically assessing and evaluating management’s assessment that no indicators of impairment existed in relation to its cash generating units.
Impairment consideration for individual idle assets Refer to Note 18 in the financial statementsFor the year ended 30 June 2020, management have performed an impairment assessment over individual assets in property, plant and equipment.
This was considered a key audit matter as the assessment resulted in a $145.4 million impairment of various idle plant and equipment to reflect a change in management's future operational plans which no longer required utilisation of these assets. $22.5 million of this impairment charge related to infrastructure associated with the Yilgarn tenements recorded in property, plant and equipment.
Our audit procedures included, among others:
Understanding the nature of idle plant and equipment;
Assessing the appropriateness of the impairment charge recorded against individual assets in plant and equipment; and
Critically assessing and evaluating management’s assessment that the remaining idle assets are recoverable and will be available for use and redeployed in future financial periods.

Other Information
The directors are responsible for the other information. The other information comprises the information included in the Group's annual report for the year ended 30 June 2020, but does not include the financial report and the auditor's report thereon.
Our opinion on the financial report does not cover the other information and accordingly we do not express any form of assurance conclusion thereon.
In connection with our audit of the financial report, our responsibility is to read the other information and, in doing so, consider whether the other information is materially inconsistent with the financial report or our knowledge obtained in the audit or otherwise appears to be materially misstated.
If, based on the work we have performed, we conclude that there is a material misstatement of this other information, we are required to report that fact. We have nothing to report in this regard.
Responsibilities of the Directors for the Financial Report
The directors of the Company are responsible for the preparation of the financial report that gives a true and fair view in accordance with Australian Accounting Standards and the Corporations Act 2001 and for such internal control as the directors determine is necessary to enable the preparation of the financial report that gives a true and fair view and is free from material misstatement, whether due to fraud or error.
In preparing the financial report, the directors are responsible for assessing the ability of the Group to continue as a going concern, disclosing, as applicable, matters related to going concern and using the going concern basis of accounting unless the directors either intend to liquidate the Group or to cease operations, or have no realistic alternative but to do so.
Auditor's Responsibilities for the Audit of the Financial Report
Our objectives are to obtain reasonable assurance about whether the financial report as a whole is free from material misstatement, whether due to fraud or error, and to issue an auditor's report that includes our opinion. Reasonable assurance is a high level of assurance, but is not a guarantee that an audit conducted in accordance with the Australian Auditing Standards will always detect a material misstatement when it exists. Misstatements can arise from fraud or error and are considered material if, individually or in the aggregate, they could reasonably be expected to influence the economic decisions of users taken on the basis of this financial report.
A further description of our responsibilities for the audit of the financial report is located at the Auditing and Assurance Standards Board website at: https://www.auasb.gov.au/auditors_responsibilities/ar1.pdf. This description forms part of our auditor's report.

Report on the Remuneration Report
Opinion on the Remuneration Report
We have audited the Remuneration Report included within the directors' report for the year ended 30 June 2020.
In our opinion, the Remuneration Report of Mineral Resources Limited, for the year ended 30 June 2020, complies with section 300A of the Corporations Act 2001.
Responsibilities
The directors of the Company are responsible for the preparation and presentation of the Remuneration Report in accordance with section 300A of the Corporations Act 2001. Our responsibility is to express an opinion on the Remuneration Report, based on our audit conducted in accordance with Australian Auditing Standards.
RSM AUSTRALIA PARTNERS
Perth, WA TUTU PHONG Dated: 19 August 2020 Partner