asu/sums/mtbi/sfi carlos castillo-chavez joaquin bustoz jr. professor arizona state university...
Post on 18-Dec-2015
213 views
TRANSCRIPT

ASU/SUMS/MTBI/SFI
Carlos Castillo-ChavezJoaquin Bustoz Jr. ProfessorArizona State University
Tutorials 2: Epidemiological Mathematical Modeling Applications of Networks.
Mathematical Modeling of Infectious Diseases: Dynamics and Control (15 Aug - 9 Oct 2005)Jointly organized by Institute for Mathematical Sciences, National University of Singapore and Regional Emerging Diseases Intervention (REDI) Centre, Singapore
http://www.ims.nus.edu.sg/Programs/infectiousdiseases/index.htm
Singapore, 08-24-2005
ASU/SUMS/MTBI/SFI
Bioterrorism
The possibility of bioterrorist acts stresses the need for the development of theoretical and practical mathematical frameworks to systemically test our efforts to anticipate, prevent and respond to acts of destabilization in a global community

ASU/SUMS/MTBI/SFI
Epidemic Models

ASU/SUMS/MTBI/SFI
Basic Epidemiological Models: SIR
Susceptible - Infected - Recovered

ASU/SUMS/MTBI/SFI
S I R
€
μN
€
γI
€
β
€
μS
€
μI
€
μR
S(t): susceptible at time tI(t): infected assumed infectious at time tR(t): recovered, permanently immuneN: Total population size (S+I+R)
€
B(S,I) = βSI
N
€
β =contacts
time
⎛
⎝ ⎜
⎞
⎠ ⎟×
probability of transmission
contact
⎛
⎝ ⎜
⎞
⎠ ⎟

ASU/SUMS/MTBI/SFI
€
dS
dt= μN − βS
I
N− μS (1)
dI
dt= βS
I
N− μ + γ( )I (2)
dR
dt= γI − μR (3)
N = S + I + R (4)
dN
dt=
d
dtS + I + R( ) = 0 (5)
SIR - Equations
Per-capita death (or birth) rate
Per-capita recovery rate
Transmission coefficient
Parameters
€
μ
€
γ
€
β
€
β ≡contacts
unit time
⎛
⎝ ⎜
⎞
⎠ ⎟×
probability of transmission
contact
⎛
⎝ ⎜
⎞
⎠ ⎟

ASU/SUMS/MTBI/SFI
SIR - Model (Invasion)
€
dS
dt= μN − βS
I
N− μS
dI
dt= βS
I
N− μ + γ( )I
S ≈ N
dI
dt= βI − μ + γ( )I = β − μ + γ( )( )I
or I(t) ≈ I(0)e β − μ +γ( )( ) t
I(t) ⇔ R0 =β
μ + γ>1

ASU/SUMS/MTBI/SFI
Ro“Number of secondary infections
generated by a “typical” infectious individual in a population of mostly susceptibles
at a demographic steady state
Ro<1 No epidemic
Ro>1 Epidemic

ASU/SUMS/MTBI/SFI
Establishment of a Critical Mass of Infectives!Ro >1 implies growth while Ro<1 extinction.

ASU/SUMS/MTBI/SFI
Phase Portraits

ASU/SUMS/MTBI/SFI
SIR Transcritical Bifurcation
unstable
€
I*(R0)
€
I*
€
R0

ASU/SUMS/MTBI/SFI
Deliberate Release of Biological Agents

ASU/SUMS/MTBI/SFI
Effects of Behavioral Changes in a Smallpox Attack Model
Impact of behavioral changes on response logistics and public policy (appeared in Mathematical Biosciences, 05)
Sara Del Valle1,2
Herbert Hethcote2, Carlos Castillo-Chavez1,3, Mac Hyman1
1Los Alamos National Laboratory2University of Iowa3Cornell University

ASU/SUMS/MTBI/SFI
The Model
Sn En
In R
V Q W
Sl El Il D
The subscript refers to normally active (n) or less active (l): Susceptibles (S), Exposed (E), Infectious (I), Vaccinated (V), Quarantined (Q), Isolated (W), Recovered (R), Dead (D)
S E I

ASU/SUMS/MTBI/SFI
"An Epidemic Model with Virtual Mass Transportation"

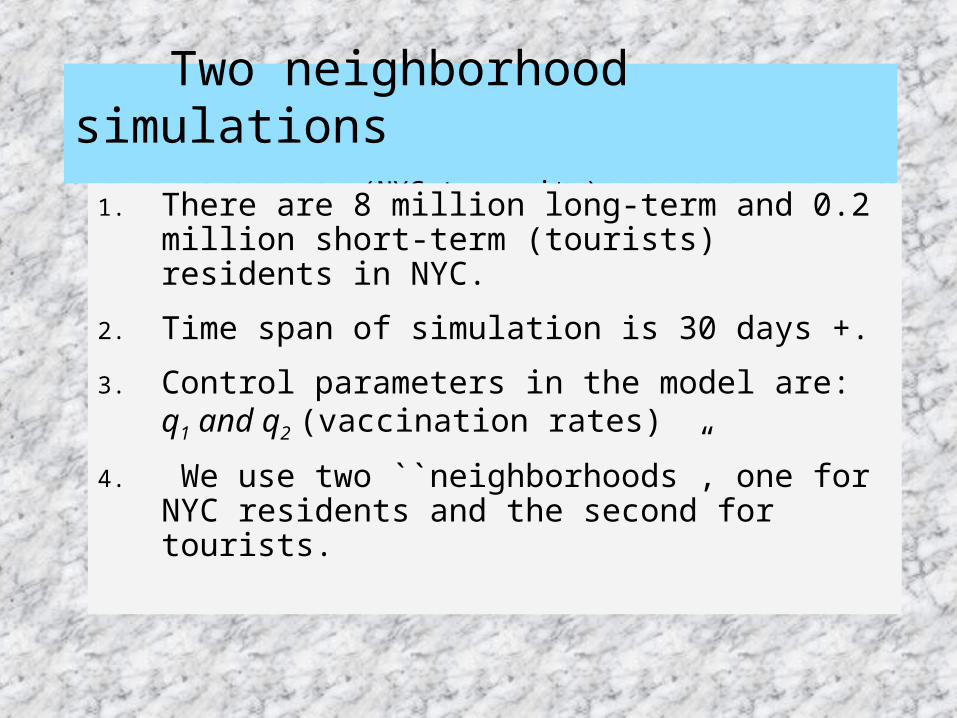
Two neighborhood simulations
(NYC type city)1. There are 8 million long-term and 0.2 million
short-term (tourists) residents in NYC.
2. Time span of simulation is 30 days +.
3. Control parameters in the model are: q1 and q2 (vaccination rates)
4. We use two ``neighborhoods”, one for NYC residents and the second for tourists.

Curve R0 (q1, q2) =1

Plot R0 (q1, q2) vs q1 and q2
ASU/SUMS/MTBI/SFI
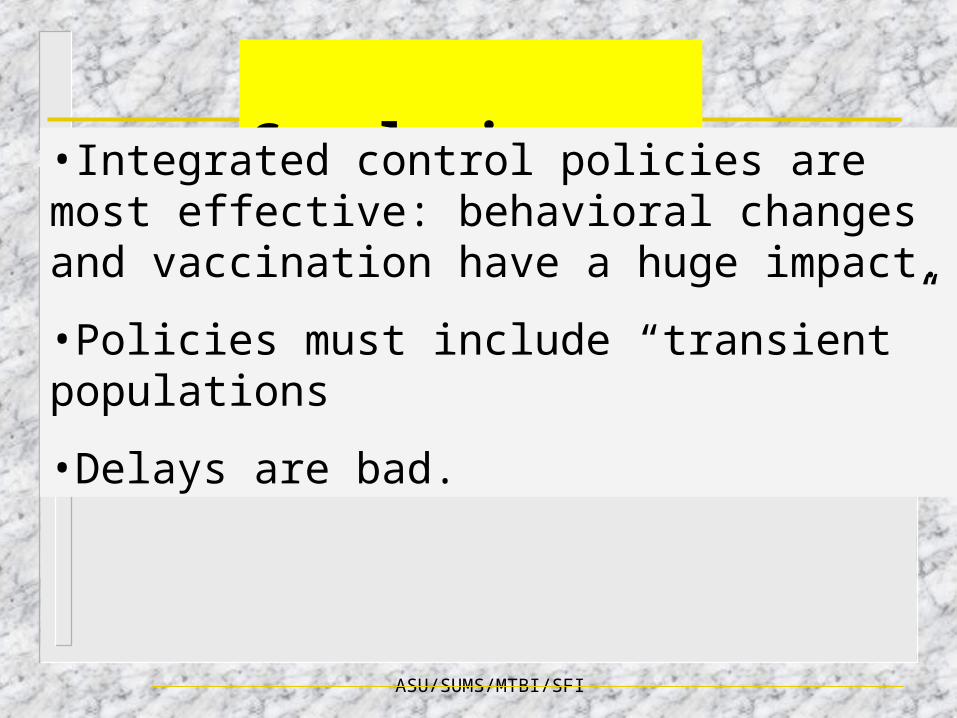
Conclusions•Integrated control policies are most effective: behavioral changes and vaccination have a huge impact.
•Policies must include “transient” populations
•Delays are bad.
ASU/SUMS/MTBI/SFI
Worst Case Scenarios?
ASU/SUMS/MTBI/SFI
Epidemics on Networks?

ASU/SUMS/MTBI/SFI
QuickTime™ and aTIFF (LZW) decompressor
are needed to see this picture.
MMUR May 9, 2003/ 52 (18); 405-411
SARS propagation network in Singapore

ASU/SUMS/MTBI/SFI
Epidemics on Networks? Some caveats
Appeal: Networks look like the real world Typical: To study “fixed” graphs (small
world, scale-free) Network/Graph structure not fixed over
time A connected to B requires temporal co-
habitation in the study of processes on networks

ASU/SUMS/MTBI/SFI
Underlying Philosophy in Classical Epidemiology

ASU/SUMS/MTBI/SFI
Ecological view point Invasion (Networks useful at this level). Short temporal scales--single outbreaks (Networks useful at this
level). Persistence Co-existence Evolution Co-evolution

ASU/SUMS/MTBI/SFI
Processes on Networks Temporal Scales
Single outbreak Long-term dynamics Evolutionary behavior

Nodes? Epidemiological Units Individuals
Cluster of individuals (friends)
Other aggregates? Farms?

Neighborhood
Cities, states, countries
Reach of the Network: Level of Aggregation
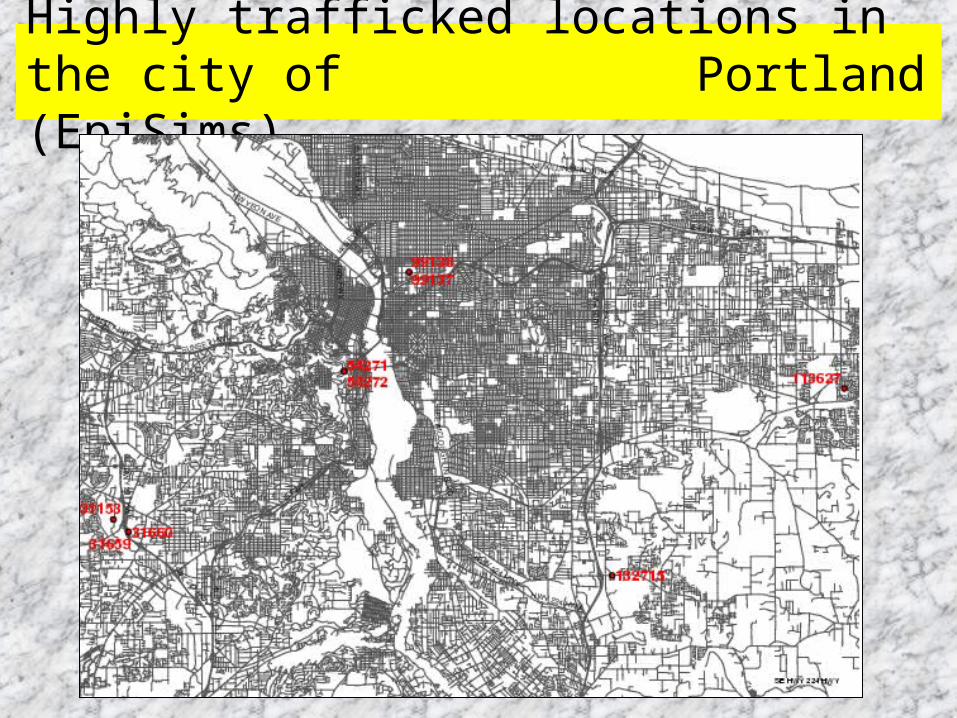
Highly trafficked locations in the city of Portland (EpiSims)

ASU/SUMS/MTBI/SFI
Heterogeneity: Infection curves by routes of transmission (Ping Yang--Health Canada)
Feb .21Feb .25Mar .01Mar .05Mar .09Mar .13Mar .17Mar .21Mar .25Mar .29Apr .02Apr .06Apr .10Apr .14Apr .18Apr .22Apr .26Apr .30May 04May 08May 12May 16May 20May 24May 28
0
2
4
6
8
10
Health Care Settings
Health Care Settings
House Hold Transmission
Convenant

ASU/SUMS/MTBI/SFI
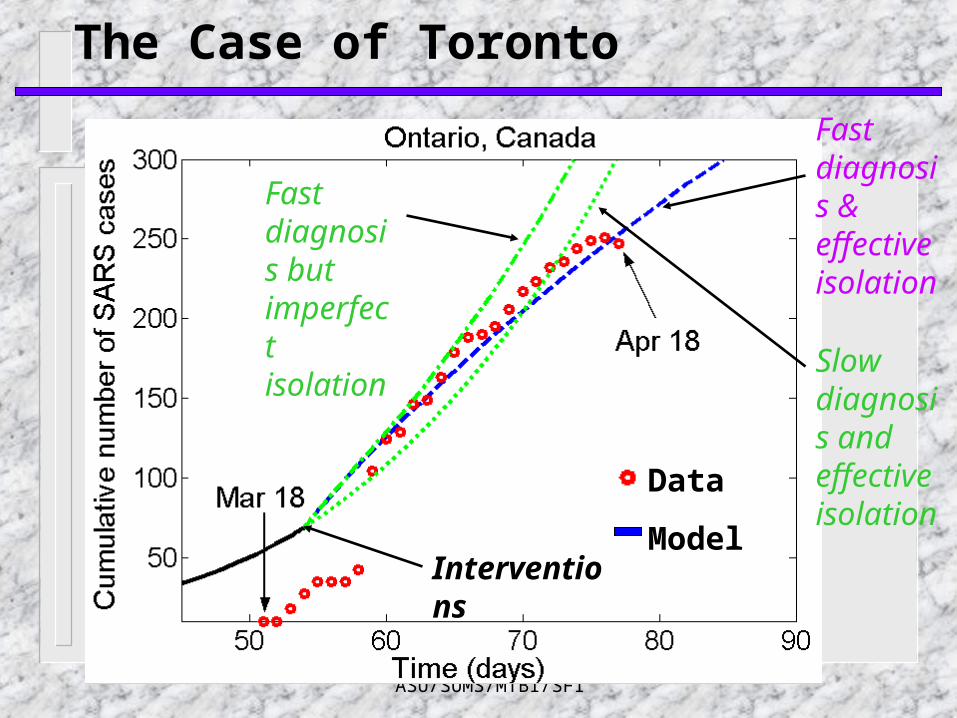
Toronto. SARS was introduced to Toronto by a couple (Guests F and G) at Hotel M in Hong Kong. On February 23, 2003 they returned to Toronto. Two days later, the woman developed SARS, infected 5 out of her 6 adult family members and caused the first outbreak in Toronto. In mid-May, an undiagnosed case at North York General Hospital led to a second outbreak among other patients, family members and healthcare workers (from Glen Webb’s presentation).
ASU/SUMS/MTBI/SFI
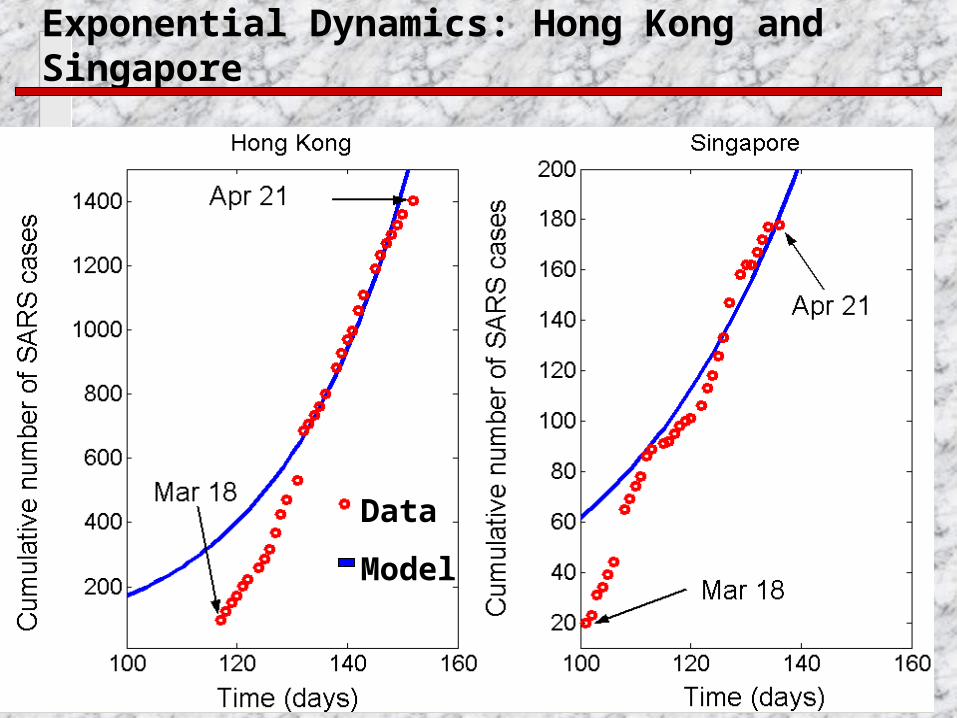
Exponential Dynamics: Hong Kong and Singapore
Data
Model
ASU/SUMS/MTBI/SFI
The Case of Toronto
Data
Model
Slow diagnosis and effective isolation
Fast diagnosis but imperfect isolation
Interventions
Fast diagnosis &effective isolation

ASU/SUMS/MTBI/SFI
Predicting the Final Size of the Epidemic in Toronto
Model prediction = 396 cases
(J. Theor. Biol 224, 1-8, 2003) Actual number as of June 23, 2003 = 377 (Health
Canada website)
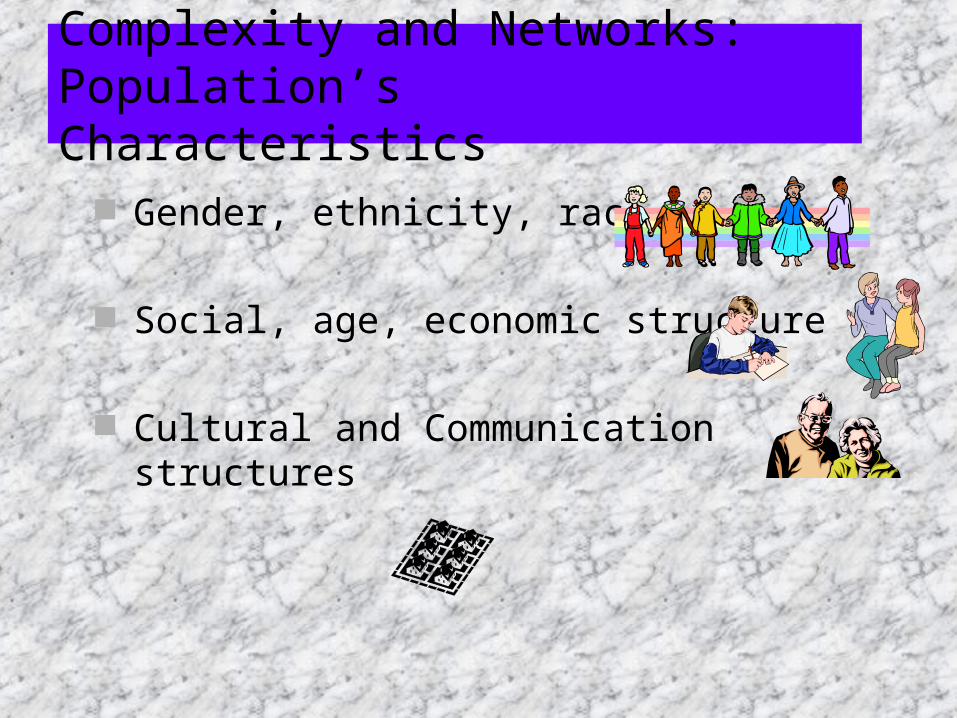
Complexity and Networks: Population’s Characteristics
Gender, ethnicity, race
Social, age, economic structure
Cultural and Communication structures

Connectedness?
Local small isolated populations
Large multi-connected populations
Who mixes with whom?

ASU/SUMS/MTBI/SFI
Scale and topology
Feb 21, ‘03
Nov 05, ‘02
Prof. Liu
Mrs. Mok
Mrs. Siu-Chu
Johny Chen
ASU/SUMS/MTBI/SFI
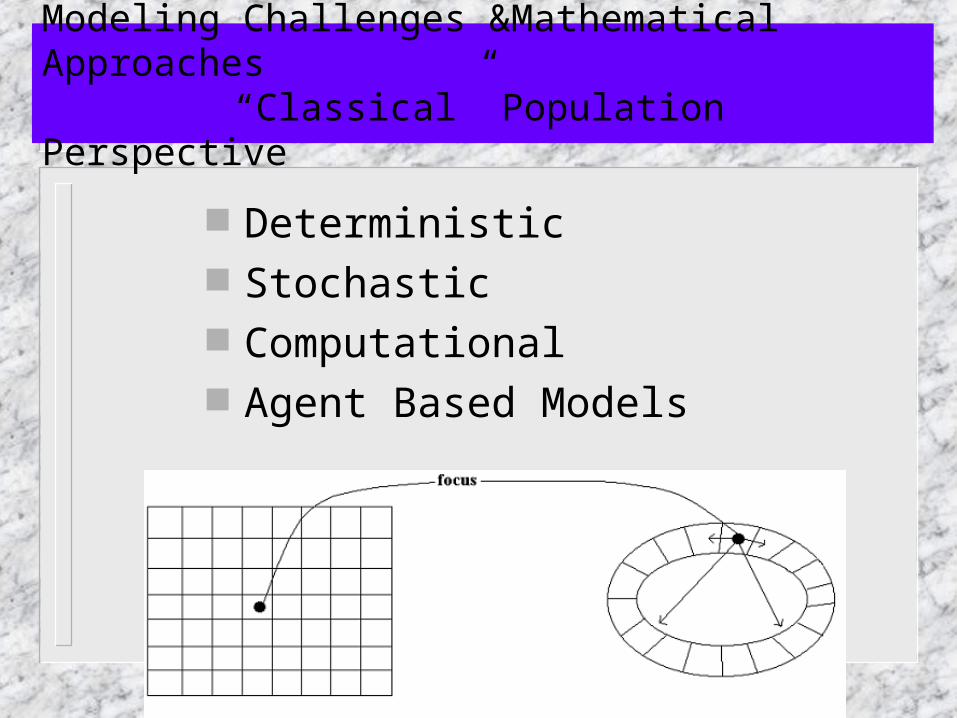
Modeling Challenges &Mathematical Approaches“Classical” Population Perspective
Deterministic Stochastic Computational Agent Based Models

Scaling Laws for the Movement of People Between Locations in a Large City
Gerardo Chowell et al.
Scaling Laws for the Movement of People between locations in a large city, Physical Review E, 68, 066102 (2003), Chowell, Hyman,
Eubank and Castillo-Chavez
LA-UR-02-6658
Outline
Statistical properties of real world networks– Network of actors in Hollywood– www– Internet– Scientific collaboration network– Power generator network of western US

Outline Analysis of a Real World Network: The city of
Portland– Location-based network– Topological properties– Traffic distribution– Total traffic distribution per location– Correlation between connectivity and traffic
distributions– Time evolution of the network

Statistical properties of networks
Connectivity distribution (degree distribution) Clustering (C) Characteristic path length (L)
3
2
3
2

The network of actors in Hollywood
Julia Roberts Diane Lane
Eric Roberts
Mickey RourkeDenzel Washington
Richard Gere Kevin Bacon
(Watts and Strogatz, 1998)

The electric power grid of western US
(Watts and Strogatz, 1998)

The world wide web (www)
Home page
web page
web pageweb page
(Barabasi et al. (1999), Kumar (2000))

Internet(Faloutsos et al., 1998)

Scientific collaboration networks
M. J. Newman

Statistical properties of real world networks
Small-world effect– High levels of clustering– Short Characteristic path length
Connectivity distribution has a tail that decays as a power law of the form:
P(k) ~ k -γ

Connectivity distribution for two real world networks
Random Graph Models of Networks. M. E. J. Newman, 2002

City of Portland: A Social Network

Location-based network
Directed, weighted network Data set contains a detailed description of the
movements of the individuals in the city of Portland.
Location 1
Location 4
Location 3Location 2
W i j

Highly trafficked locations in Portland

Statistical properties
The clustering coefficient for our location-based network is C = 0.058 (roughly 350 times larger than the expected value for an equivalent random graph).
The same situation arises for the electric power grid of western US where C=0.08.
Average distance between nodes = 3.38 (diameter = 9).

Connectivity distribution
Out-degree
Nu
mb
er o
f lo
cati
o ns
γ

Strong or weak connections ?
Very little is known about the distribution of the strength of the connections in real world networks.
Only their structural properties have been analyzed. The main reason being the lack of data to quantify the strength of the connections.

Traffic distribution
Out-traffic
Nu
mb
er o
f co
nn
ecti
ons
bet
wee
n lo
cati
ons
γ

Total traffic distribution
Total out-traffic
Nu
mb
er o
f lo
cati
ons
γ

Correlation in density
out-deg
ree
Nú
mer
o d
e lo
caci
ones
Tráfico total de salida por nodo

Semilog plot
out-degreeTotal out-
traffic
Log
(n
um
ber
of
loca
tion
s)

Hierarchical structures at different levels of aggregationC(k) k –β
a) b)
c) d)
a) Work activities
b) School activities
c) Social/rec activities
d) All activities

Cluster size distribution
Gerardo Chowell
t=4 hrs. t=5 hrs.
t=7 hrs.t=6 hrs.

Location-based networkSize of the largest cluster
Gerardo Chowell

This is joint work with J.M. Hyman, S. Eubank and G Chowell.
Scaling Laws for the Movement of People between locations in a large city, Physical Review E, 68, 066102 (2003), Chowell, Hyman, Eubank and Castillo-Chavez
ASU/SUMS/MTBI/SFI
Structure and Function of Complex Networks
•Introduction:
Strogatz, Nature (2001)
•Comprehensive study
Newman, SIAM Rev. (2003)QuickTime™ and a
TIFF (LZW) decompressorare needed to see this picture.
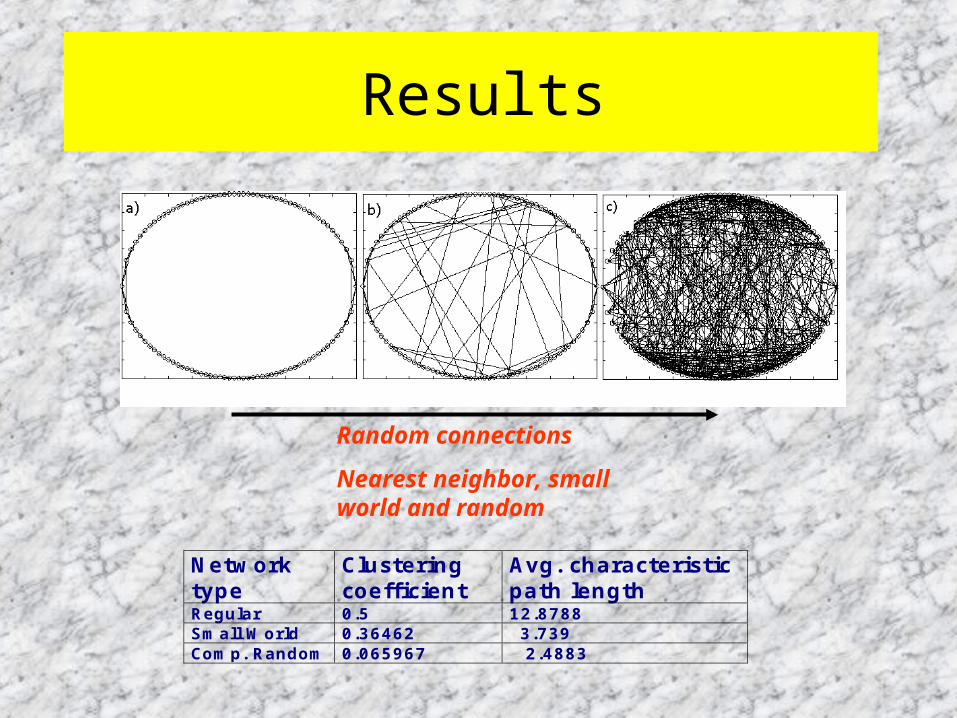
Results
Networktype
Clusteringcoefficient
Avg. characteristicpath length
Regular 0.5 12.8788Small World 0.36462 3.739Comp. Random 0.065967 2.4883
Random connections
Nearest neighbor, small world and random

Questions
Compare disease spread on a
Nearest Neighbor Network
Random Network Small World Network
p = 1 when random and p about 0 when nearest neighbor dominates
∪∪

Small-world and Scale-free networks
Small world network of size 70 with probability of random connections p = 0.1
Scale-free network of size 70 illustrating the presence of a small number of highly nodes connected (hubs).

ASU/SUMS/MTBI/SFI
LLYD Model
Scale-Free NetworksExponentially Distributed Networks
3)( −∝ kkP as
€
p → 0 z
k
ekP−
∝)( as
€
p →1
Barabasi-Albert (BA) Erdos-Renyi

Connectivity distribution
Out-degree
Nu
mb
er o
f lo
cati
o ns
γ

ASU/SUMS/MTBI/SFI
Navigation in a Small-World (Kleinberg, 2000)
•Two dimensional lattice
•Long-range connection between node u and v, with probability , where
• Greedy heuristic algorithm: each message holder forwards the message across a connection that brings it as close as possible to the target in the lattice distance
•T: Expected delivery time.
where
€
r−α
€
r =| u1 − v1 | + | u2 − v2 |
€
T ≥ Ωnβ
€
Ω≡Ω(α ),β ≡ β (α )
a
b
c
d
v
u

Highly trafficked locations in the city of Portland

Building Epidemics
Transition Probabilities: P(S to I), P(I to R)
PSI = 1 – eβ t
PIR = 1 – eγ t

ASU/SUMS/MTBI/SFI

Epidemics on small-world networks
The rate of growth of SIR epidemics increases in a nonlinear fashion as disorder in the network increases.
The rate of growth rd for the analogous deterministic homogeneous mixing model is shown.

The role of the network structure in epidemics
The dotted graph shows the rate of growth of SIR epidemics when the initial infectious source has the highest number of faraway connections (train stations, airports, etc) while the continuous line is the result of placing the source at random.

Rate of growth of epidemics in small-world networks
Growth in the number of infected in an SIR model where individuals live in a ring. Curves give the average number of infected (50 simulations) in a population of 1000 while the growth is exponential. p = 0, disorder parameter, corresponds to no long term connections and p =1 implies that everybody is connected to each other. Graph on the left from a single source (idea, virus, rumor). Top curve is when the spread begin at a pressure point. Lower spread begins at a random point. Graph on
the right, three randomly placed sources of infection (ideas, whatever) versus one.

ASU/SUMS/MTBI/SFI
SIR epidemics on Small worlds
For small worlds, a sharp transition occurs at small values of the disorder parameter p.
5 initial infected nodes chosen at random, β=4/7, γ=2/7.
The mean (red) of 50 realizations and the standard deviation are shown.

ASU/SUMS/MTBI/SFI
SIR epidemics on Small worlds
Similar results are observed when initial infected nodes are chosen by highest degree
β=4/7, γ=2/7. The mean (red) of
50 realizations and the standard deviation are shown.

ASU/SUMS/MTBI/SFI
SIR epidemics on Small worlds
Final epidemic size as a function of the transmission rate β.
5 initial infected nodes chosen at random
γ=2/7. The mean (solid) of
50 realizations and the standard deviation (bars) are shown.

ASU/SUMS/MTBI/SFI
SIR epidemics on Scale-Free networks (Barabasi-Albert model)
Final epidemic size as a function of the transmission rate β.
5 initial infected nodes chosen at random
γ=2/7. The mean (red) of 50 realizations
and the standard deviation are shown.

ASU/SUMS/MTBI/SFI
Small worlds: Epidemic duration(five sources placed at random)

• The impact of alternative agents of disease transmission and evolution—like transportation systems seems critically important.
• The study of epidemics on different topologies (networks) is essential (mobile individuals cause a lot of ``problems”).
• Worst case scenarios may occur in random networks but the focus should be on worst case plausible scenarios-one cannot ignore behavioral changes.
• Worst case scenarios depend on topology• Bigger outbreaks are sometimes caused by releases at
pressure points in the network.
Conclusions

ASU/SUMS/MTBI/SFI
Bioterrorism: Mathematical Modeling Applications in Homeland Security.
H. T. Banks and C. Castillo-Chavez, Editors
Frontiers in Applied Mathematics 28
Globalization and the possibility of bioterrorist acts have highlighted the pressing need for the development of theoretical and practical mathematical frameworks that may be useful in our systemic efforts to anticipate, prevent, and respond to acts of destabilization.
Bioterrorism: Mathematical Modeling Applications in Homeland Security collects the detailed contributions of selected groups of experts from the fields of biostatistics, control theory, epidemiology, and mathematical biology who have engaged in the development of frameworks, models, and mathematical methods needed to address some of the pressing challenges posed by acts of terror. The ten chapters of this volume touch on a large range of issues in the subfields of biosurveillance, agroterrorism, bioterror response logistics, deliberate release of biological agents, impact assessment, and the spread of fanatic behaviors.