astronomy and abell 262 at z=0.0157, j1836.3cr at z=0.414...
TRANSCRIPT

Astron. Astrophys. 363, 41–61 (2000) ASTRONOMYAND
ASTROPHYSICS
Near-infrared adaptive optics observations of galaxy clusters:Abell 262 at z=0.0157, J1836.3CR at z=0.414,and PKS 0743-006 at z=0.994
W. Hackenberg1,2, A. Eckart1,3, R.I. Davies1, S. Rabien1, T. Ott1, M. Kasper4, S. Hippler4, and A. Quirrenbach5
1 Max-Planck-Institut fur Extraterrestrische Physik (MPE), 85740 Garching, Germany2 European Southern Observatory (ESO), 85748 Garching, Germany3 I. Physikalisches Institut, Universitat zu Koln, 50937 Koln, Germany4 Max-Planck-Institut fur Astronomie (MPIA), 69117 Heidelberg, Germany5 University of California, San Diego, La Jolla, CA 92093-0424, USA
Received 7 March 2000 / Accepted 15 May 2000
Abstract. We report on high angular resolution near-infrared(NIR) observations of three galaxy clusters at different red-shifts using adaptive optics (AO). In the case of the barred spi-ral UGC 1347 in Abell 262 we presented the first AO resultsobtained using a laser guide star. The observations have beencarried out with the MPE/MPIA adaptive optics laser guide starsystem ALFA and the ESO AO system ADONIS combined withthe SHARP II+ camera built at MPE. The three clusters are wellsuited for high resolution investigations since bright field starsfor tip-tilt or wavefront sensing are located close to the line ofsight to cluster galaxies. In summary our high angular resolu-tion NIR data combined with other information clearly indicatesstar formation activity or interaction between cluster membersat all three redshifts. The results and implications for future highangular resolution adaptive optics observations are discussed inthe framework of current galaxy and cluster evolution models.
For two barred galaxies in the Abell 262 cluster, UGC 1344and UGC 1347, we interpret our NIR imaging results in com-bination with published radio, far-infrared, and Hα data in theframework of a star formation model. In addition to the star-forming resolved NIR nucleus in UGC 1347 we found a brightand compact region of recent and enhanced star formation atone tip of the bar. TheLK/LLyc ratio as well as the V− Kcolor of that region imply a starburst that happened about 107
years ago. For UGC 1344 we find that the overall star formationactivity is low and that the system is deficient in fuel for starformation.
The importance of star formation in galaxy clusters is alsosupported by a comparison of seeing corrected nuclear bulgesizes of a sample of spiral galaxies within and outside the centralHI deficient zone of the Abell 262 and Abell 1367 clusters. Wefind that the galaxies inside the Abell radii of both clusters showa tendency for more compact bulges than those outside. Thisphenomenon could be due to increased star formation activitytriggered by interactions of cluster members inside the Abellradius.
Send offprint requests to: W Hackenberg ([email protected])
The star formation activity in the two higher redshift clustersJ1836.3CR and PKS 0743-006 is investigated via comparison toGISSEL stellar population models in JHK two-color-diagrams.While J1836.3CR is consistent with an evolved cluster, the ob-jects in the field of PKS 0743-006 show indications of morerecent star formation activity. The central object in J1836.3CRshows a radial intensity profile that is indicative for cD galaxiesin a rich cluster environment. Extended wings in its light distri-bution may be consistent with recent or ongoing galaxy-galaxyinteraction in this cluster.
Key words: galaxies: clusters: general – galaxies: clusters: in-dividual: Abell 262 – galaxies: evolution – galaxies: ISM –galaxies: irregular
1. Introduction
Adaptive optics systems using natural and laser guide stars arean important observational tool that allow large ground basedtelescopes to operate at or close to the diffraction limit. Consid-erable improvements and successes have been obtained in in-stalling such systems at several sites (Davies et al. 1999, Davieset al. 1998, Glindemann et al. 1997, Quirrenbach et al. 1997,Drummond et al. 1998, Hubin 1997, Max et al. 1997, Arsenaultet al. 1994). However, it remains challenging to use them effi-ciently especially in the field of extragalactic observations. Wehave concentrated on three galaxy clusters at different redshiftsfor which adaptive optics observations were possible due to thepresence of sufficiently bright reference stars in the correspond-ing fields.
The galaxy cluster Abell 262 (R.A.(2000) = 01h52.1m,DEC(2000) = 35◦40′) is one of the most conspicuous conden-sations in the Pisces-Perseus super cluster. It has a systemicvelocity of 4704 km s−1 (z = 0.0157, Giovanelli & Haynes1985) and an Abell radius ofrA = 1.75◦. It has been extensivelystudied in X-rays and in the radio. It is a spiral-rich cluster, char-acterized by the presence of a central X-ray source positioned

42 W. Hackenberg et al.: Near-infrared adaptive optics observations of galaxy clusters
on the D galaxy NGC 708 right at the center of the cluster. Thedistribution of galaxies in projection on the sky as well as inredshift space have been studied by Melnick & Sargent (1977),Moss & Dickens (1977), Gregory et al. (1981), and Fanti etal. (1981). The large number of spirals in this cluster as wellas the presence of a central X-ray source and its low redshiftmake Abell 262 an ideal candidate to study the properties ofmember galaxies, such as HI content and star formation activ-ity. As in many other rich galaxy clusters the member galaxiesof Abell 262 show an HI deficiency towards the center of thecluster. For Abell 262 this phenomenon has been investigatedby Giovanelli et al. (1982), Giovanelli & Haynes (1985) andothers.
We used the new MPIA-MPE ALFA adaptive optics systemat the Calar Alto 3.5 m telescope to observe two of the Abell 262cluster members – UGC 1344 and UGC 1347 – at subarcsecondresolution. For UGC 1347 the observations were carried out us-ing the ALFA laser guide star (LGS) and a nearby natural guidestar (NGS) for tip-tilt correction. To our knowledge UGC 1347is the first extragalactic source for which LGS assisted observa-tions have been performed. For the UGC 1344 observations weused a nearby NGS as a wavefront reference.
As the two higher redshift clusters we selected J1836.3CR(R.A.(2000) = 13h45m, DEC(2000) =−00◦53′) at a redshift ofz = 0.414 (Couch et al. 1998) and an area around the quasarPKS 0743-006 at a redshift ofz = 0.994 (Hewitt & Burbidge1993). Both fields contain bright guide stars withmV ∼ 12 mag.that can be used as natural guide stars for adaptive optics obser-vations.
Couch et al. (1998) presented a catalogue of faint southerngalaxy clusters identified on high-contrast film derivatives ofa set of Anglo-Australian Telescope photographic plates. Thecluster J1836.3CR is one of them. A bright star (mV = 12 mag)is located about 60′′ north of 4 prominent cluster members forwhich redshifts have been determined. For three of four galaxiesspectroscopy (Couch et al. 1998) indicates a redshift ofz =0.415 ± 0.003 and one galaxy has a redshift ofz = 0.319.Couch et al. (1998) use a cluster redshift ofz = 0.414. At thisredshift 1′′ corresponds to a linear distance of 6.8 kpc.
PKS 0743-006 is a quasar (R.A.(2000) = 07h45m53.37s,DEC(2000) = −00◦44′11.4′′) of visual magnitudemV =17.1 mag at a redshiftz = 0.994 (Hewitt & Burbidge 1993).The radio spectrum has a convex shape with possible variabilityaround the peak occurring between 5 and 10 GHz. Tornikoski etal. (1993) find this source strongly variable at 90 GHz. Variabil-ity by a few tenths of a magnitudes is also reported in the NIR(White et al. 1988). On the milliarcsecond angular resolutionscale at cm wavelengths this object shows a classical core-jetstructure (Stanghellini et al. 1997). Within the errors, the wholeradio flux density is accounted for by this structure. A naturalguide star for adaptive optics observations is located at onlyabout 12.2′′ northeast of the quasar.
In Sect. 2 we describe the observations and data reduction aswell as the adaptive optics systems we used. In Sect. 3 we presentthe observational results and the data analysis for UGC 1347(Sect. 3.1) and for UGC 1344 (Sect. 3.2) in conjunction with
data available in the literature. In Sect. 3.3 we outline the resultswe obtained for a sample of 11 spiral galaxies in the Abell 262cluster and 15 spiral galaxies in the Abell 1367 cluster. In Sect. 4then we discuss the star formation activity in the observed clustergalaxies and give a summary and conclusions in Sect. 5.
2. Observations and data reduction
Our new high spatial resolution observations in Abell 262 werecarried out using the OMEGA-CASS camera mounted to thelaser guide star adaptive optics system ALFA at the Calar Alto3.5 m telescope. The observations for the two higher redshiftclusters were obtained with the ESO AO system ADONIS. Inthe following we give a brief description of the two systems.
2.1. ALFA
The performance goal of ALFA is to achieve a 50% Strehl-ratioat 2.2µm under average seeing conditions (0.9′′), with good skycoverage. The adaptive optics (Glindemann et al. 1997) and thesodium laser guide star (Quirrenbach et al. 1997, Davies et al.1998) have been designed and built as a joint project betweenMPIA in Heidelberg and MPE in Garching, both in Germany.The system is installed at the German/Spanish 3.5 m telescopeon Calar Alto near Almeria, Spain.
The laser used for generating the artificial guide star is a highpower continuous-wave dye laser. It is installed in the coude labof the telescope, and the laser beam is fed along the coude trainuntil it is picked off near the primary mirror and directed intoa 50-cm launch telescope. The launched laser power is around3 W, and produces amV = 9–10 mag sodium guide star. Thetip-tilt correction is achieved using a natural guide star, currentlywith a limiting magnitudemV ∼ 15 mag. The laser can be usedfor high order wavefront correction. In the wavefront sensorthere are several lenslet arrays which can be interchanged, andthe positions of the resulting laser beacon centroids in the Shack-Hartmann sensor are determined and used to derive coefficientsof Zernike or Karhunen-Loeve modes which are then used tocontrol a 97-actuator deformable mirror. The loop was closedon the laser guide star in September 1997, and it was first usedto improve an image in December 1997 at a sampling rate of60 Hz and correcting 7 modes plus tip and tilt.
OMEGA-CASS is a near-infrared camera for the Cassegrainfocus of the 3.5 m telescope at Calar Alto, which is specializedfor use at high spatial resolution and has been developed atthe MPIA, Heidelberg. It is based around a Rockwell 10242
pixel HAWAII array, and has capabilities for broad and nar-row band imaging, spectroscopy, and polarimetry over the 1.0–2.5µm wavelength range. When used in conjunction with ALFA(f /25), the pixel scales available are 0.04′′, 0.08′′, and 0.12′′ perpixel.
2.2. ADONIS
For the observations of the two higher redshift clusters we usedthe ESO adaptive optics system ADONIS (Beuzit et al. 1994).
W. Hackenberg et al.: Near-infrared adaptive optics observations of galaxy clusters 43
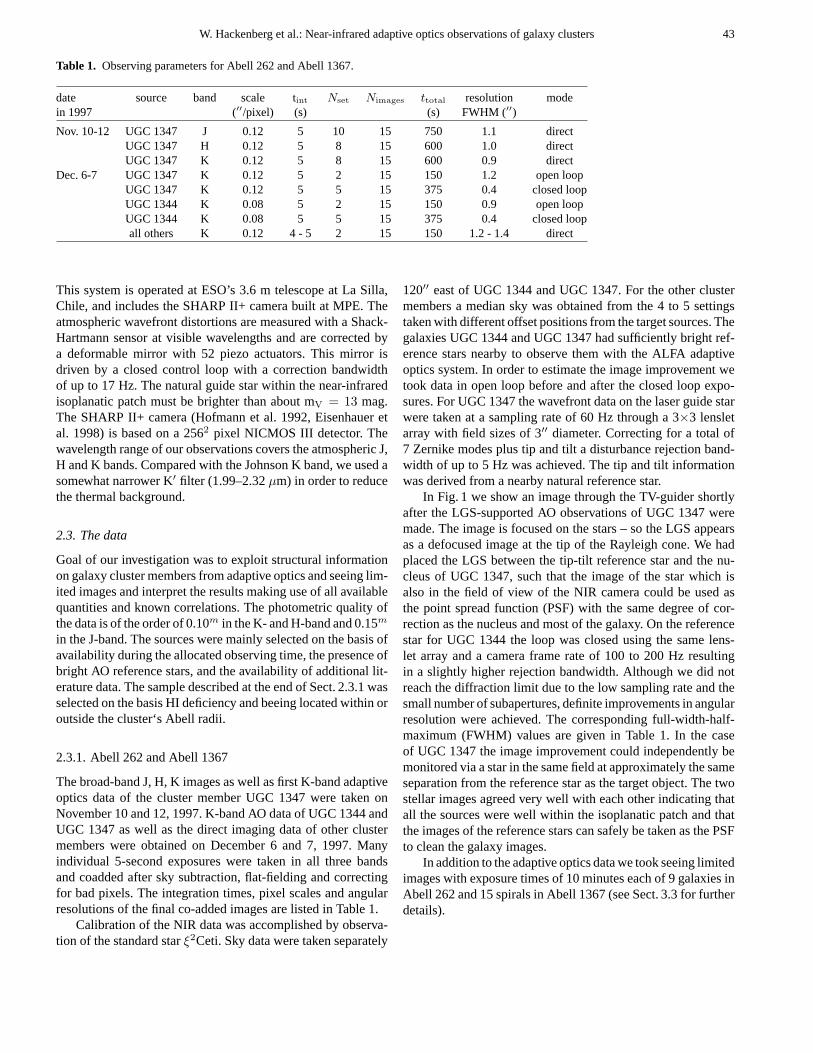
Table 1. Observing parameters for Abell 262 and Abell 1367.
date source band scale tint Nset Nimages ttotal resolution modein 1997 (′′/pixel) (s) (s) FWHM (′′)
Nov. 10-12 UGC 1347 J 0.12 5 10 15 750 1.1 directUGC 1347 H 0.12 5 8 15 600 1.0 directUGC 1347 K 0.12 5 8 15 600 0.9 direct
Dec. 6-7 UGC 1347 K 0.12 5 2 15 150 1.2 open loopUGC 1347 K 0.12 5 5 15 375 0.4 closed loopUGC 1344 K 0.08 5 2 15 150 0.9 open loopUGC 1344 K 0.08 5 5 15 375 0.4 closed loopall others K 0.12 4 - 5 2 15 150 1.2 - 1.4 direct
This system is operated at ESO’s 3.6 m telescope at La Silla,Chile, and includes the SHARP II+ camera built at MPE. Theatmospheric wavefront distortions are measured with a Shack-Hartmann sensor at visible wavelengths and are corrected bya deformable mirror with 52 piezo actuators. This mirror isdriven by a closed control loop with a correction bandwidthof up to 17 Hz. The natural guide star within the near-infraredisoplanatic patch must be brighter than about mV = 13 mag.The SHARP II+ camera (Hofmann et al. 1992, Eisenhauer etal. 1998) is based on a 2562 pixel NICMOS III detector. Thewavelength range of our observations covers the atmospheric J,H and K bands. Compared with the Johnson K band, we used asomewhat narrower K′ filter (1.99–2.32µm) in order to reducethe thermal background.
2.3. The data
Goal of our investigation was to exploit structural informationon galaxy cluster members from adaptive optics and seeing lim-ited images and interpret the results making use of all availablequantities and known correlations. The photometric quality ofthe data is of the order of 0.10m in the K- and H-band and 0.15m
in the J-band. The sources were mainly selected on the basis ofavailability during the allocated observing time, the presence ofbright AO reference stars, and the availability of additional lit-erature data. The sample described at the end of Sect. 2.3.1 wasselected on the basis HI deficiency and beeing located within oroutside the cluster‘s Abell radii.
2.3.1. Abell 262 and Abell 1367
The broad-band J, H, K images as well as first K-band adaptiveoptics data of the cluster member UGC 1347 were taken onNovember 10 and 12, 1997. K-band AO data of UGC 1344 andUGC 1347 as well as the direct imaging data of other clustermembers were obtained on December 6 and 7, 1997. Manyindividual 5-second exposures were taken in all three bandsand coadded after sky subtraction, flat-fielding and correctingfor bad pixels. The integration times, pixel scales and angularresolutions of the final co-added images are listed in Table 1.
Calibration of the NIR data was accomplished by observa-tion of the standard starξ2Ceti. Sky data were taken separately
120′′ east of UGC 1344 and UGC 1347. For the other clustermembers a median sky was obtained from the 4 to 5 settingstaken with different offset positions from the target sources. Thegalaxies UGC 1344 and UGC 1347 had sufficiently bright ref-erence stars nearby to observe them with the ALFA adaptiveoptics system. In order to estimate the image improvement wetook data in open loop before and after the closed loop expo-sures. For UGC 1347 the wavefront data on the laser guide starwere taken at a sampling rate of 60 Hz through a 3×3 lensletarray with field sizes of 3′′ diameter. Correcting for a total of7 Zernike modes plus tip and tilt a disturbance rejection band-width of up to 5 Hz was achieved. The tip and tilt informationwas derived from a nearby natural reference star.
In Fig. 1 we show an image through the TV-guider shortlyafter the LGS-supported AO observations of UGC 1347 weremade. The image is focused on the stars – so the LGS appearsas a defocused image at the tip of the Rayleigh cone. We hadplaced the LGS between the tip-tilt reference star and the nu-cleus of UGC 1347, such that the image of the star which isalso in the field of view of the NIR camera could be used asthe point spread function (PSF) with the same degree of cor-rection as the nucleus and most of the galaxy. On the referencestar for UGC 1344 the loop was closed using the same lens-let array and a camera frame rate of 100 to 200 Hz resultingin a slightly higher rejection bandwidth. Although we did notreach the diffraction limit due to the low sampling rate and thesmall number of subapertures, definite improvements in angularresolution were achieved. The corresponding full-width-half-maximum (FWHM) values are given in Table 1. In the caseof UGC 1347 the image improvement could independently bemonitored via a star in the same field at approximately the sameseparation from the reference star as the target object. The twostellar images agreed very well with each other indicating thatall the sources were well within the isoplanatic patch and thatthe images of the reference stars can safely be taken as the PSFto clean the galaxy images.
In addition to the adaptive optics data we took seeing limitedimages with exposure times of 10 minutes each of 9 galaxies inAbell 262 and 15 spirals in Abell 1367 (see Sect. 3.3 for furtherdetails).

44 W. Hackenberg et al.: Near-infrared adaptive optics observations of galaxy clusters
30 arcsec
tip tilt star
LGS
nucleus
HII region
UGC 1347
Fig. 1.ALFA TV-guider image of UGC 1347 plus laser. The telescopewas focused at infinity, i.e., on natural stars, resulting in a defocusedimage of the sodium LGS.
2.3.2. J1836.3CR and PKS 0743-006
We observed these clusters using the SHARPII+ camera to-gether with the ESO adaptive optics system ADONIS on the3.6 m telescope on La Silla, Chile. The observations were con-ducted during the nights from April 26 till May 1, 1996. A brightstar was used to lock the AO system. We took a series of 60 sec-ond exposures in a dither mode in the near-infrared J, H, andK′ bands, using pixel scales of 0.05 and 0.10 ”/pixel. The totalintegration times and the angular resolution measured on a PSFreference are listed in Table 2 and Table 3.
3. Results
In the following we will present the results obtained for the twogalaxies UGC 1347 and UGC 1344 that were observed withthe ALFA adaptive optics system as well as for a sample ofgalaxies located in the inner and outer part of the Abell 262and Abell 1367 clusters. We also describe source properties atother wavelengths as well as quantities that we derived from
Table 2. Observing parameters for J1836.3CR.All on-source integra-tions were carried out with the AO-loop closed.
date band scale tint Nimages Nset ttotal resolutionin 1996 (′′/Pixel) (s) (s) FWHM (′′)
Apr. 26 K′ 0.10 60 5 4 × 2 2400 0.20H 0.10 60 5 4 1200 0.20J 0.10 60 5 4 1200 0.30
Apr. 27 K′ 0.05 60 5 1 × 5 1500 0.18H 0.05 60 5 1 × 4 1200 0.20
Apr. 29 K′ 0.05 60 5 2 600 0.18J 0.05 60 5 4 1200 0.25
May 5 K′ 0.05 60 5 3 900 0.18H 0.05 60 5 3 900 0.20J 0.05 60 5 2 600 0.25
Table 3. Observing parameters for PKS0743-006. All on-source inte-grations were carried out with the AO-loop closed.
date band scale tint Nimages Nset ttotal resolutionin 1996 (′′/Pixel) (s) (s) FWHM (′′)
Apr. 26 K′ 0.10 30-60 5 4 × 3 3000 0.20H 0.10 20 10 4 800 0.20J 0.10 30 5 4 600 0.30
Apr. 27 K′ 0.10 60 3 3 540 0.20K′ 0.05 60 5 2 600 0.20
Dec. 20 K′ 0.10 60 5 4 1200 0.20H 0.10 60 5 2 600 0.25J 0.10 60 5 1 300 0.40
Dec. 21 K′ 0.05 60 5 8 2400 0.20H 0.05 60 5 1 300 0.25
them. The description of this derivation is given in detail forUGC 1347. For UGC 1344 we have used the same approachand only summarize the results. We regard the correspondinganalysis as an important consistency check between our owndata and the data and correlations available in the literature.Data on external galaxies even at lower or medium redshiftwill always be sparse and it is required to make use of all theknowledge available to allow for a full comparison to what isknown in the local universe and at different redshifts.
Although our NIR data has a subarcsecond resolution weextracted K-band and Hα fluxes in larger apertures to conducta starburst analysis in Sect. 4. The reason for this is that theradio and bolometric luminosities for individual source compo-nents especially the nucleus, disk, and southern component inUGC 1347 can only be estimated indirectly and can probablyonly be attributed to larger regions. We have chosen a circu-lar aperture of 7.2′′ diameter corresponding to a linear size of2.2 kpc.
3.1. UGC 1347
UGC 1347 is an almost face-on SBc galaxy located atR.A.(2000) = 01h52m45.9s and DEC(2000) = 36◦37′09′′ ap-proximately 57′ north of the center of Abell 262, well within

W. Hackenberg et al.: Near-infrared adaptive optics observations of galaxy clusters 45
Fig. 2. AO-corrected K-band image of UGC 1347 with a resolution of0.4′′. The brightest object to the southeast is the tip-tilt guide star. Thelowest contour level corresponds to 16.0 mag/arcsec2.
the region in which the largest amount of HI deficiency is ob-served. There is a bright field star (PPM 1111,mV = 11.5 mag)located about 37′′ to the southeast of the galaxy. The HI contentof UGC 1347 was first studied by Wilkerson (1980). Velocityfields and intensity maps were obtained in HI by Bravo-Alfaro(1997) and in Hα by Amram et al. (1994). Amram et al. (1994)quote an inclination ofi = 30◦. Oly and Israel (1993) mea-sured the 327 MHz radio continuum flux density of UGC 1347,and the far-infrared flux densities as measured by IRAS can befound in the IRAS point source catalogue (Lonsdale et al. 1985).The HI and Hα data indicate a systemic velocity of UGC 1347of 5524 km s−1 (Wilkerson 1980) and 5478 km s−1 (Amramet al. 1994), respectively. Here we assume that the differenceof approximately 800 km s−1 between the cluster velocity of4704 km s−1 and the systemic velocity is due to the motion ofthe galaxy within the cluster. We therefore adopt for UGC 1347the cluster distance of 63 Mpc or a redshift ofz = 0.0157 as-sumingH0 = 75 km s−1 Mpc−1. At this distance 1′′ correspondsto about 310 pc.
3.1.1. Near-infrared emission from UGC 1347
The NIR emission of UGC 1347 is dominated by two almostequally bright components at a separation of 8.85′′ (or 2.74 kpc)oriented approximately north-south. In Fig. 2 we show the NIRcontinuum emission from UGC 1347 together with the digitizedsky survey V-band image in Fig. 3.
In Fig. 4 we show NIR intensity profile cuts of the nucleus,the bright off-nuclear source, and the star PM 1111 in both openloop and closed loop. We have used the image of PPM 1111 asthe point spread function and deconvolved the NIR continuum
Fig. 3. V-band image of UGC 1347 from the Palomar digitized skysurvey. The nucleus (N), the compact, bright off-nuclear source (C),and the tip-tilt guide star (S) are labeled.
image of UGC 1347 with a Lucy-Richardson algorithm (Lucy1974). From the comparison of the images in Figs. 2 and 3 andthe deconvolved image it is evident that the northern componentcoincides with the nucleus of UGC 1347 and has an extent ofabout 1′′ (corrected for the FWHM of the PSF; see Table 1) cor-responding to a diameter of about 310 pc. The southern compactcomponent is located at the southern tip of the galaxy bar and isunresolved compared to the 0.40′′ FWHM PSF. We estimate anupper limit to its angular extent of 0.15′′ corresponding to lessthan 45 pc.
The J, H, and K flux densities listed in Table 4 were measuredin 4.8′′, 3.6′′, 2.4′′, 1.2′′ and 0.72′′ diameter circular aperturescentered on each component.
In Fig. 5 we show the locations of the multi-aperture datain the J− H, H − K two color diagram. The graph indicatesthat the nuclear colors are in agreement with a stellar disk pop-ulation reddened with anAV of about 4 mag corresponding toabout 0.6 magnitudes of reddening in the K band. The valueof AV = 4 mag is large with respect to color variations dueto differences in stellar population, age, and metallicity from a“normal“ Sc disk population. Here we assumed a screen modelfor the extinction. In case of a mixed model the extinction maybe even large. In addition to simple reddening there may also besome contribution from hot dust to the nuclear NIR emission.In the case of the southern component, however, the colors froma normal stellar disk population are apparently more influencedby additional emission from hot dust and an extinction ofAV ≤2 mag (corresponding to the arrows in the figure ledgend). Inboth components the reddening and the influence from hot dustemission increase with decreasing aperture size. This indicates

46 W. Hackenberg et al.: Near-infrared adaptive optics observations of galaxy clusters
Fig. 4.E-W cuts through the direct and AO-correctedimages of the nucleus, the compact HII region atthe tip of the bar, and the tip-tilt reference star ofUGC 1347. The FWHM of the images are given inpixels. One pixel corresponds to 0.08′′.
Table 4. Photometric results on UGC 1347 and UGC 1344.
aperture diameter 4.8′′ 3.6′′ 2.4′′ 1.2′′ 0.72′′
UGC 1347nucleus J 14.41 ± 0.08 14.84 ± 0.06 15.53 ± 0.05 16.85 ± 0.06 17.94 ± 0.06
H 13.57 ± 0.12 13.98 ± 0.09 14.63 ± 0.07 15.94 ± 0.07 17.03 ± 0.07K 13.06 ± 0.01 13.41 ± 0.02 14.03 ± 0.01 15.30 ± 0.02 16.34 ± 0.04
H − K 0.51 ± 0.12 0.57 ± 0.09 0.60 ± 0.07 0.64 ± 0.07 0.69 ± 0.08J− H 0.84 ± 0.14 0.86 ± 0.11 0.90 ± 0.09 0.91 ± 0.09 0.91 ± 0.09
southern J 14.33 ± 0.07 14.65 ± 0.05 15.21 ± 0.04 16.43 ± 0.04 17.47 ± 0.03component H 13.79 ± 0.15 14.11 ± 0.10 14.66 ± 0.07 15.87 ± 0.06 16.91 ± 0.06
K 13.47 ± 0.01 13.75 ± 0.03 14.23 ± 0.01 15.41 ± 0.02 16.40 ± 0.05H − K 0.32 ± 0.15 0.36 ± 0.10 0.43 ± 0.07 0.46 ± 0.06 0.51 ± 0.08J− H 0.54 ± 0.17 0.54 ± 0.11 0.55 ± 0.08 0.56 ± 0.07 0.56 ± 0.07
UGC 1344nucleus K 12.11 ± 0.02 12.45 ± 0.03 12.96 ± 0.03 14.15 ± 0.04 15.12 ± 0.03
a decrease in dilution by a surrounding or underlying stellarpopulation unaffected by reddening. The southern componentis probably similar to the red knot found in the nearby spiralNGC 7552 (Schinnerer et al. 1997) and is likely region of re-cent active star formation in the disk. However, its emissionmay very well be contaminated by red super-giants (see resultsof our starburst analysis in Sect. 4.2). The contribution of hotdust in the nucleus may be indicative for star formation activitythere as well.
In order to analyze the NIR data in conjunction with otherdata taken from the literature we used a starburst model as de-scribed in Sect. 4.
3.1.2. The K-band luminosity
Our K-band images allow us to calculate the nuclear K-bandluminosity LK and compare it to an estimate of the K-band
luminosity from the extended disk and southern component ofUGC 1347. The results are listed in Table 5 and Table 6.
The K-band luminosity is calculated via
LK[L�] = 1.14 × 10⁴ × D[Mpc]2 × SK[mJy] (1)
whereD is the distance in Mpc andSK is the 2.2µm flux densityin mJy (Krabbe et al. 1994). We found K-band flux densities of5.5 mJy for the extended nucleus and 3.7 mJy for the southerncompact component measured in 7.2′′ diameter apertures. In theprevious section we have shown that the K-band flux density ofthe southern component is clearly contaminated by emission ofhot dust. The J− H colors are less effected by hot dust emissionand correspond to that of an un-reddened stellar population. Wehave therefore calculated the stellar K-band flux density fromthe H-band magnitude using the standard spiral disk colors withH − K = 0.21 (e.g. Frogel et al. 1978). The K-band flux densityof the southern component corrected for the contribution of hot

W. Hackenberg et al.: Near-infrared adaptive optics observations of galaxy clusters 47
Fig. 5. JHK two color diagram and the lo-cations taken in by the two components.The JHK flux densities were measured in4.8′′, 3.6′′, 2.4′′, 1.2′′, 0.72′′ diameter cir-cular apertures centered on each component.The graph indicates that the nuclear colorsare in agreement with a stellar populationreddened with anAV of about 4 magnitudes.
dust is then reduced to about 3 mJy (mK = 13.3 mag) resultingin a K-band luminosity of 1.5×10⁸ L� .
In order to estimate the K-band luminosity of the disk weused the total H-band magnitude of 10.48 mag measured byGavazzi et al. (1996) For a mean H− K color of 0.21 (Frogel etal. 1978) this results in a total K-band flux of the order of 49 mJycorresponding to a total K-band luminosity ofLK = 2.1×10⁹
L� . Correcting for the contribution of the nucleus and thesouthern component we obtain a K-band flux and luminosity forthe disk of UGC 1347 of about 40 mJy andLK = 1.6×10⁹ L�.
3.1.3. The Lyman continuum luminosity
For the overall galaxy as well as for individual components anestimate of the Hα luminosities have been obtained using thecontinuum and Hα line images kindly provided by Amram etal. (1994; P. Amram and M. Marcelin 1998, private commu-nication). Both the continuum and Hα line images were takensimultaneously with the same spectral resolution. They have afield of view of4.9′ × 4.9′ and include all of UGC 1347. Mainpurpose of these observations was to derive the Hα velocityfield. In order to determine flux densities we used an estimateof the total Hα continuum flux density of UGC 1347 to cali-brate the data. The Hα continuum flux density was obtained viaa linear interpolation between the flux densities derived fromthe total H-band and V-band magnitudes as given in Gavazzi &
Table 5. Diagnostic parameters for UGC 1344 and UGC 1347.MH2
estimated fromLFIR; LK,total estimated from H-band magnitude;Mtotal estimated from the width of the HI-line. For further informationsee text.
UGC 1347 UGC 1344
MH2 [M� ] 3.2×10⁹ <109
MHI[M� ] 3.2×10⁹ ≤3.3×10⁸
Mtotal [M� ] (0.5-1)×1011 (0.8-1.2)×1010
LK [L� ] 2.1×10⁹ 3.7×10⁹
LLyc [L� ] 5.5×10⁸ <108
LFIR [L� ] 1.18×10¹⁰ <4×10⁹
νSN [yr−1] 0.044 0.012Mtotal/LK 24–48 2.2–3.3Lbol/LLyc 21 –Lbol/LK 5.6 <1.1LK/LLyc 3.8 >37109νSN/LLyc 0.08 >0.121012νSN/Lbol 3.7 >3
Boselli (1996). Although uncertain by probably 30% this esti-mate allows us to further probe the consistency of the availabledata with our own measurements and starburst analysis. Thecorresponding calibration factor between the measured and cal-culated Hα continuum was applied to the Hα line data. Finally

48 W. Hackenberg et al.: Near-infrared adaptive optics observations of galaxy clusters
Table 6. Diagnostic parameters for the UGC 1347 components. Thedata on the nucleus and the southern component have been obtainedin 7.2′′ diameter apertures.LK andLLyc for the disk do not includethe contributions from the nucleus and the southern component.LFIR
for the disk has been separated from the nuclear contribution on theassumption that the 100µm flux density is dominated by the disk andthat a standard log(S60/S100) ratio can be applied for the disk. ThestellarLK for the southern component has been calculated from theH-band magnitude using the standard spiral disk colors with H− K inorder to avoid contamination ofLK by a contribution from hot dust.νSN has been derived on the basis of radio measurements which areassumed to be associated with the nuclear region only. For furtherinformation see text.
Nucleus Disk SouthernComponent
LK [L� ] 3.7×10⁸ 1.6×10⁹ 1.5×10⁸
LLyc [L� ] 9×10⁷ 4.2×10⁸ 4.2×10⁷
LFIR [L� ] 8.6×10⁹ 3.2×10⁹ –νSN [yr−1] 0.044 <0.002 –Lbol/LK 23 2.0 –Lbol/LLyc 95 7.6 –LK/LLyc 4.1 3.8 4109νSN/LLyc 0.49 <0.005 –1012νSN/Lbol 5.1 <0.6 –
the Lyman continuum luminosityLLyc then was derived fromthe Hα flux densityFHα and the source distanceD via:
LLyc[L�] = 5.6 × 10¹⁷ × FHα[ergs−1cm−2] × D[Mpc]2 (2)
(following Osterbrock 1989). Without extinction correction weobtain about 2.3×10⁸ L� for the overall Lyman continuum lu-minosity of UGC 1347. In 7.2′′ diameter apertures centered onthe nucleus and on the southern component we obtain approxi-mately 107 L� and 2×10⁷ L� , respectively. In the followingwe assume the following values for the extinction, which arebased on the JHK measurements and (for the disk) on compar-isons to other galaxies: nucleusAV = 3 mag, southern compo-nentAV = 1 mag, and diskAV ≤ 1 mag. Furthermore we useAHα = 0.8AV (Draine 1989). The corresponding extinction-corrected Lyman continuum luminosities are given in Table 5and Table 6.
3.1.4. The gas content and total mass
The HI content of UGC 1347 was measured by Wilkerson(1980) using the Arecibo telescope with a 3.2′ beam. The distri-bution of atomic hydrogen in UGC 1347 was studied by Bravo-Alfaro (1997) using the Westerbork Synthesis Radio Telescope.The interferometric measurements show that the HI gas extendswell beyond the optical disk although the FWHM of the dis-tribution is in approximate agreement with the optical extent.The HI (Bravo-Alfaro 1997) and Hα (Amram et al. 1994) rota-tion curves are in good agreement. The image suggests a slightHI line flux enhancement to the south-east and extensions tothe west and north. Assuming a distance of 67 Mpc Wilkerson
(1980) obtained 3.5×10⁹ M� of atomic hydrogen gas contain-ing most of the overall HI content of the galaxy. Scaled to ouradopted distance of 63 Mpc this results in MHI = 3.2×10⁹ M�.
No direct measurement of the molecular gas mass inUGC 1347 is available. As an estimate we use the IRAS far-infrared (FIR) flux densities and a dust temperature of 22 K (seethe following section) and the molecular hydrogen mass to LFIRcorrelation by Young & Scoville (1991). We estimate a molec-ular hydrogen mass of approximatelyMH2 = 3.2×10⁹ M� .The resultingMH2/MHI ratio of 1 is then consistent with thevalue expected for late type spirals (Young & Scoville 1991).Although the determination of the molecular gas mass is un-certain, it is very unlikely that it is wrong by a large factor,say 10, since the age derived from(Mtot − MHI − MH2)/LKis fully consistent with theLbol/LLyc and LK/LLyc ratios(see Sect. 4.2) for tis age. We note that we implicitly assumea standardNH2/I(CO) conversion factor. We also note, thatMH2/MHI is of the order of 0.1 for optical selected galaxies,while MH2/MHI ∼ 1 is found for infrared selected samples.This is consistent with UGC 1347 being listed in the IRASpoint source catalogue (see below).
The measured HI line width of 144 km s−1 (Wilkerson1980) and the Hα velocity field corrected for the inclinationof i = 30◦ (Amram et al. 1994) indicates a full velocity widthcovered by the rotation curve of∆v0 ≈ 300 km s−1. FollowingShostak (1978) and Heckman et al. (1978) this allows to esti-mate the total dynamical mass of UGC 1347 asMdyn = (0.5–1.0)×1011 M� . The resulting total gas to dynamical mass ratio(MHI + MH2)/Mdyn of about 5% to 10% is in agreement withtypical values found for spiral galaxies (Shostak 1978).
3.1.5. The FIR luminosity
The FIR luminosity can be derived using the 60µm and 100µmIRAS flux densities ofS60 = 1.40 Jy ofS100 = 3.84 Jy aslisted in the IRAS point source catalogue. At both wavelengthsUGC 1347 is fully contained in the large IRAS beams. Follow-ing the formalism given by Lonsdale et al. (1985) and Fairclough(1985) we find a totalLFIR = 1.18 × 10¹⁰h−2 L� . From the60µm and 100µm data we calculate a dust color temperature of22 K assuming an emissivity proportional toλ−1 (Hildebrand1983) and a silicate to graphite ratio of 7:3 (Whittet 1981).
We can also estimate how large the disk and nuclear con-tributions to the FIR luminosity are. Here we assume that adominant fraction of the disk FIR emission originates in diffuseinterstellar dust and gas clouds which are heated by the inter-stellar UV radiation field of the stellar disk population. Theseclouds have correspondingly large volume and disk area fillingfactors. To obtain a first order estimate of the disk and nuclearcontributions we assume that for this population of clouds theFIR flux densities can be estimated by adopting the relationfound for “cirrus” emission in our Galaxy (De Vries et al. 1987,Helou 1986). These relations have already successfully beenapplied to extragalactic objects by Eckart et al. (1990) for Cen-taurus A and by Jackson et al. (1991) for NGC 2903. Following

W. Hackenberg et al.: Near-infrared adaptive optics observations of galaxy clusters 49
De Vries et al. (1987) the far-IR flux densityS100 of the “cirrus”emission in Ursa Major can be obtained via
S100 = aNHI + bI 12CO(1−0) + S100,BG, (3)
where S100,BG is the flux density of the background emis-sion,NHI the HI column density, andI 12CO(1−0) the integrated12CO(1−0) line flux. The authors determine the constantsa andb asa = (1.0±0.4)×10−20 MJy sr−1 cm2 andb = (1.0±0.5)MJy sr−1 K−1 km−1 s. Here we assume that IRAS point sourcedata do not have to be corrected for significant contributionsof any background emission. In order to obtain a lower limitto the FIR contribution of the disk to the overall FIR luminos-ity we just calculate the contribution expected from the atomicHI gas which is mostly distributed throughout the disk. Thedisk diameter of about 24.5 kpc and the adopted HI mass ofMHI = 3.2×10⁹ M� result in a 100µm flux density contri-bution of about 8.6 MJy sr−1. Integrated over the disk thisgives a flux density ofS100 = 1.26 Jy. For a total moleculargas mass of 3.2×10⁹ M� we find a 100µm flux density con-tribution of the order of 0.3 mJy. The total disk flux density at100µm thus amounts to 1.56 Jy. With a mean ratio betweenthe 60 and 100µm flux density contribution for cirrus clouds oflog(S60/S100) = −0.65 (Helou 1986) the expected 60µm fluxdensity from the disk isS60 = 0.35 Jy. These disk values can nowbe used to derive the nuclear FIR flux densities and luminosity(Table 5 and Table 6). Here we assume that the contribution ofthe southern compact component to the FIR luminosity is neg-ligible because of the small filling factor of the source in theIRAS beam.
Although the presented decomposition of the FIR flux den-sities is very indirect, the FIR luminosities of the nucleus anddisk are consistent with what one expects from the relation be-tween the radio continuum and the FIR luminosity (Wunderlich& Klein, 1988).
3.1.6. The supernova rate
Oly and Israel (1993) measured a 327 MHz flux density ofUGC 1347 ofS327 MHz = 23.6 mJy in a 55′′ beam. The differ-ence between peak and integrated flux density is only+0.5 mJy.The disk size of UGC 1347 is of the order of 90′′ diameter. If theradio flux density were be dominated by the central 10% (30%)of the disk this would result in an approximately 3% (30%) de-viation between the two quantities. In addition the source showsno clear indications for extended emission in the NRAO VLASky survey at 1.4 GHz (Condon et al. 1996) with a beam sizeof 45′′. Therefore we assume that almost all of the flux densitycan be attributed to the nuclear region and that less than 1/20of the radio emission originates in the disk of UGC 1347. Us-ing a mean spectral index (S ∝ ν−α) between 327 MHz and1420/5000 MHz of−0.71 ± 0.05, which the authors obtainedfor a sample of 35 UGC galaxies, we estimate a 5 GHz flux den-sity of S5 GHz = 3.41 mJy. This value can be used to calculatethe supernova rateνSN via
νSN[yr−1] = 3.1 × 10⁻⁶ × S5GHz[mJy] × D[Mpc]2 (4)
(Condon 1992). For UGC 1347 we find a supernova rate ofνSN= 0.044 yr−1. This value for the nuclear region of UGC 1347is of the same order as the estimated overall supernova rate inthe Milky Way of (0.025± 0.006) yr−1 (Tammann et al. 1994).For the disk of UGC 1347 we adopt an upper limit ofνSN =0.002 yr−1. This determination of the SNR assumes that thereis no major contribution to the radio flux density by an activenucleus. In all star burst analyzes were such a contribution couldbe excluded or was unlikely the derived SNR have shown tobe consistent with other measurements of the star formationactivity in the framework of the star burst model calculations.
3.2. UGC 1344
UGC 1344 is a SBc galaxy with an inclination of abouti =60◦ (data in UGC catalogue and visual inspection) locatedat R.A.(2000) = 01h52m34.8s and DEC(2000) = 36◦30′02′′
approximately 21′ north of the center of Abell 262. LikeUGC 1347, it is well within the inner region in which thelargest amount of HI deficiency is observed. A bright fieldstar (GSC 2319-0343,mV = 11.0 mag) is located about 23′′
to the south. In Table 5 we list all parameters and estimates forUGC 1344 that were derived in a similar way as described abovefor UGC 1347.
Fig. 6 shows the NIR continuum emission from UGC 1344together with the digitized sky survey V-band image in Fig. 7.We have used the image of the nearby reference star as thePSF and deconvolved the NIR continuum image of UGC 1344with a Lucy-Richardson algorithm. In Fig. 8 we show intensityprofile cuts through the nuclear component of UGC 1344 andthe reference star, for both open and closed loop as well asdeconvolved.
The K-band flux density distribution of UGC 1344 is verycentrally peaked but smoothly connects to the extended disk.The central 3′′ of the bulge contain about half of the K-bandflux density in a 10′′ aperture. For the nuclear component wemeasured a K-band flux density of 12 mJy in a 7.2′′ aperture.This is about a factor of 1.7 more than for UGC 1347. As forUGC 1347 the K-band disk luminosity can be estimated fromthe deep H-band image presented by Gavazzi et al. (1996) asmH = 9.81 mag. For a mean H− K color of 0.21 (Frogel et al.1978) this results in a total K-band flux of the order of 91 mJy.Correcting for the contribution of the nucleus we obtain a K-band flux and luminosity for the disk of UGC 1344 of about 81mJy andLK = 3.7×10⁹ L� .
Amram et al. (1994) did not detect UGC 1344 in Hα usinga similar integration time as for UGC 1347 (P. Amram andM. Marcelin 1998, private communication). Based on the dataobtained for UGC 1347 we adopt here an upper limit for theLyman continuum luminosity of 108 L� for the entire galaxy.
The HI content of UGC 1344 has been studied by Wilker-son (1980). A weak line has been detected at a systemic ve-locity of 4155 km s−1 and a width of 103 km s−1 (Wilkerson1980). Again we assume that the difference of approximately550 km s−1 between the cluster velocity of 4704 km s−1 and thesystemic velocity are due to the motion of the galaxy within the

50 W. Hackenberg et al.: Near-infrared adaptive optics observations of galaxy clusters
Fig. 6. Closed-loop K-band image of UGC 1344 with a resolution of0.4′′. The object to the south is the AO guide star. The lowest contourlevel corresponds to 16.6 mag/arcsec2.
Fig. 7. V-band image of UGC 1344 from the Palomar digitized skysurvey. The nucleus (N) and the guide star (S) are labeled.
cluster and adopt the same distance of 63 Mpc as for UGC 1347.From the HI detection Wilkerson (1980) derived an upper limitof the HI mass of 3.3×10⁸ M� (scaled to the adopted distanceof 63 Mpc).
Oly and Israel (1993) measured the 327 MHz radio con-tinuum flux density of UGC 1347. The difference between theintegrated 327 MHz flux density of 6.2 mJy and the peak fluxdensity of 4.99 mJy in a55′′ × 68′′ beam indicates that not allof the radio emission can be associated with the nuclear com-
ponent but that at least 1 mJy is due to extended emission. Ifthe radio emission had a Gaussian distribution the angular sizewould be of the order of about 30′′ to 40′′ suggesting that thispossible extended emission is distributed over the entire disk ofUGC 1344.
From an inspection of the IRAS all sky survey we estimatean upper limit of the flux density at a wavelength of 100µm of0.5 Jy. Assuming a FIR spectrum similar to that of UGC 1347this results in an upper limit of the far-infrared luminosity of4×109 L� .
3.3. Near-infrared imaging of the sample
In addition to the adaptive optics observations of UGC 1344and UGC 1347 we took seeing-limited images of additional 9spiral galaxies (a total of 11) in the Abell 262 cluster and 15spiral galaxies in the Abell 1367 cluster. They were selectedaccording to their HI deficiency and separation from the clustercenter as given by Giovanelli et al. (1982) and listed in Table 7and Table 8.
A sample of 6 galaxies in Abell 262 and 7 galaxies inAbell 1367 was selected from the central parts of the clusters.In both cases they have separations from the cluster center lessthan 0.55 Abell radii (rA = 1.75◦ for Abell 262 andrA = 1.40◦
for Abell 1367) and HI deficiencies (as defined in Giovanelli etal. 1982) ranging between 0.06 and>1.18. The only exceptionis UGC 1347 with a deficiency of−0.07 which is HI rich for agalaxy within the Abell radius. A second sample of 5 galaxiesin Abell 262 and 8 galaxies in Abell 1367 was selected fromthe outer cluster regions. Here the separations from the clustercenter range from 1.2 to 5.2 Abell radii and the HI deficienciesrange from 0.03 to 0.6. Our K-band images of these sourcescontain in almost all cases reference stars that allowed us toaccurately estimate the seeing. If no star was contained in theimage we used the stars in adjacent exposures as a reference.From radial averages centered on the galaxy nuclei and on thestars we extracted the sizes as FHWM values (as listed in Ta-ble 7 and Table 8) and deconvolved the measurements on thegalaxies with the stellar data via quadratic subtraction assumingGaussian flux distributions of the sources. A comparison to ourAO results on UGC 1347 and UGC 1344 shows that this pro-cedure gives reliable estimates of the bulge sizes. In Fig. 9 weplot the deconvolved nuclear source sizes against the distancefrom the cluster center. To combine the data sets we scaled theresults according to the mean radial velocities of the two galaxyclusters and corrected the Abell 1367 data to the distance of theAbell 262 cluster. For the galaxies close to the cluster center wefind a median nuclear FWHM and median deviation from thatvalue of 0.77′′ ± 0.07′′. For the outer sources the result is 1.10′′
± 0.18′′. The difference between the two median values is 2.6times the mean of the two median deviations. A Kolmogorov-Smirnov test shows that the two distributions are different at the85% level. This result provides evidence that the K-band fluxdensity distribution of the galaxy bulges in the inner part of thecluster are systematically smaller than those in the outer part.This result is discussed in Sect. 4.3.

W. Hackenberg et al.: Near-infrared adaptive optics observations of galaxy clusters 51
Fig. 8. E-W cuts through direct and AO-corrected images of the nucleus and refer-ence star of UGC 1344. A cut through aLUCY deconvolved image of the nuclearcomponent using the image of the star asa PSF is also shown. The FWHM of the im-ages are given in pixles. One pixel corre-sponds to 0.08′′.
Table 7. The sample of spiral galaxies in Abell 262. Sizesddeconv of the galaxy nuclei extracted from seeing-limited images in K-band byquadratic deconvolution. Objects also observed in closed loop operation are indicated. The sizes evaluated from the uncorrected images agreewell with the corresponding results achieved from the tip-tilt or fully AO corrected images, respectively.
Galaxy r/rA HI- dcore(′′) dstar(′′) ddeconv(′′) CommentDeficiency
UGC 1045 3.71 -0.26 1.36 0.63 1.21UGC 909 3.63 -0.13 1.13 0.63 0.94UGC 1125 2.41 -0.20 0.80 0.62 0.51UGC 1069 3.37 -0.03 1.42 0.59 1.29UGC 1178 1.68 -0.27 1.58 0.59 1.47 tip-tiltUGC 1366 0.32 >0.81 0.95 0.55 0.77UGC 1307 0.27 >0.77 0.99 0.57 0.81UGC 1347 0.26 -0.07 1.24 0.73 1.00 AOUGC 1338 0.22 >0.79 0.81 0.59 0.31 tip-tiltUGC 1344 0.20 >0.78 1.08 0.51 0.95 AOUGC 1350 0.20 >1.18 0.91 0.58 0.70
4. Discussion
The data on UGC 1344 and UGC 1347 indicate ongoing orrecent nuclear star formation. The implications from that pro-vide a framework in which the properties of our Abell 262 andAbell 1367 sample can be explained as well.
4.1. The starburst model
To derive the properties of a starburst from the observed contin-uum and line intensities we have used the starburst code STARS.This model has been successfully applied to NGC 1808 (Krabbeet al. 1994, Tacconi-Garman et al. 1996), NGC 7469 (Genzel etal. 1995), NGC 6764 (Eckart et al. 1996) and NGC 7552 (Schin-nerer et al. 1997). A description of the model can be found in the
appendices of Krabbe et al. (1994) and Schinnerer et al. (1997).The model is similar to other stellar population synthesis mod-els (Larson & Tinsley 1978, Rieke et al. 1980, Gehrz et al. 1983,Mas-Hesse & Kunth 1991, Rieke et al. 1993, Doyon et al. 1994)and includes the most recent stellar evolution tracks (Schaereret al. 1993, Meynet et al. 1994).
We assume power-law initial mass functions (IMFs) whichvary asM−α between a lower and upper mass cut-off,Ml =1 M� andMu = 100M� , with an indexα = 2.35 (Leitherer1996, Salpeter et al. 1955). STARS has as output observableparameters such as the bolometric luminosityLbol, the K bandluminosityLK, the Lyman continuum luminosityLLyc and thesupernova rateνSN, as well as the diagnostic ratios betweenthese quantities. The adopted values forLbol, LLyc, LK, and

52 W. Hackenberg et al.: Near-infrared adaptive optics observations of galaxy clusters
Table 8. The sample of spiral galaxies in Abell 1367. K-band sizesddeconv of the galaxy nuclei extracted from seeing-limited images byquadratic deconvolution.
Galaxy r/rA HI- dcore(′′) dstar(′′) ddeconv(′′)Deficiency
UGC 7040 5.22 -0.01 1.26 0.47 1.17UGC 7087 3.70 -0.20 0.94 0.48 0.80UGC 6483 3.12 -0.08 1.26 0.66 1.07UGC 6891 2.53 -0.06 0.84 0.48 0.69UGC 6693 2.07 -0.09 1.02 0.44 0.92UGC 6876 1.76 -0.04 0.90 0.82 0.38UGC 6863 1.70 -0.04 1.14 0.60 0.97UGC 6583 1.20 -0.60 1.12 0.72 0.85UGC 6746 0.55 >0.79 0.88 0.60 0.64UGC 6663 0.47 >0.65 1.01 0.54 0.85UGC 6719 0.25 0.28 0.95 0.64 0.70UGC 6702 0.18 0.06 1.01 0.66 0.76UGC 6718 0.14 1.09 1.02 0.88 0.52UGC 6688 0.11 >0.80 0.53 0.49 0.19UGC 6697 0.11 0.16 1.25 0.66 1.06
νSN have been derived from observed properties in the previoussections. All relevant quantities as well as the diagnostic ratiosthat can be calculated from them for the present analysis arelisted in Table 5 and Table 6. All the ratios are measures of thetime evolution and the shape of the IMF, with slightly differentdependencies onα andMu.
4.2. Nuclear star formation in UGC 1347 and UGC 1344
UGC 1347:The diagnostic ratios (Table 5 and 6) and the frame-work of the starburst model now allow us to discuss the star for-mation for the whole of UGC 1347 as well as for the nucleus,the southern component and the disk. In summary the overalldisk data of UGC 1347 are consistent with a high age and con-stant star formation, whereas the data for the nucleus and thesouthern compact component indicate more recent or ongoingstar formation activity.
Disk: TheMtot/ LK ratio of 22 to 43 that we obtained for theoverall galaxy indicates an age of the stellar population in thedisk of the order of several 109 to 1010 years (see Fig. 10). Thisis also supported by the ratiosLbol/LLyc = 6.4 andLK/LLyc =3.2 combined with 109νSN/LLyc < 0.004 that results from theupper limit on the extended radio flux.
Nucleus:The diagnostic ratiosLbol/LLyc = 53,LK/LLyc = 2.3combined with 109νSN/LLyc = 0.27 indicate that the nuclearlight is currently dominated by a decaying star formation eventthat happened a few times 107 years ago. This assumes that theupper mass cutoff is 100M� and that the star burst itself didnot last longer than a few times 106 years (see Fig. 10). Theinitial star formation rate was 18M� yr−1 and the current starformation rate would then be of the order of 0.04M� yr−1.
The southern component:The southern component and the nu-cleus belong to the brightest regions in Hα line emission. Theonly diagnostic ratio that we can calculate is that between the K-
band luminosity corrected for the contribution of hot dust and theLyman continuum luminosity. We obtain a value ofLK/LLyc= 4. In addition the compact source of hot dust revealed by ourAO measurements and its location at the tip of the bar suggestthat the star formation activity in that region may be as high andrecent as we find it for the nucleus (see Fig. 10).
UGC 1344:A ratio of Mtot/LK = 2.2 to 3.3 indicates an ageof 109 years (see Fig. 10). This is supported by the lower limitLK/LLyc ≥ 37. The fact that the far-infrared luminosity islower than that of UGC 1347 may imply that the molecular gasmass is below 108 M� . In addition the the system is deficient inneutral hydrogen as well. This indicates that UGC 1344 is defi-cient overall in fuel for star formation. The fact that UGC 1344shows only a weak and narrow HI line may indicate that theHI has largely been stripped and the HI line width cannot nec-essarily be taken as a measure for the total dynamical mass. Ifthe dynamical mass has been underestimated by a factor of 10the log(Mtot/LK) ratio will be similar to the one obtained forUGC 1347 and the age of the dominant stellar population in thedisk is then most likely also of the order of several 109 to 1010
years.
4.3. Nuclear star formation and bulge sizes in the sample
The detailed discussion of the data available for UGC 1344 andUGC 1347 has shown that there is strong evidence for nuclearstar formation activity and that not all of the K-band nuclearflux density can be explained by the presence of an old stellarpopulation alone. Additional K-band flux density may origi-nate from hot dust (see Fig. 5) or a population of supergiants orAGB stars, both of which are indicative for recent or ongoingstar formation activity. The spatial distribution of the sourcesresponsible for additional K-band flux density may be lookedupon as independent of the distribution of the old stellar popula-tion forming the bulge of the galaxies. The relative flux densitycontribution of the additional sources will then have an influenceon the measured size of the bulge.
That star formation activity is an important quantity for theappearance and classification of a galaxy has also been pointedout by Kennicutt et al. (1994). They have combined Hα andUBV measurements of 210 nearby Sa-Irr galaxies with newphotometric synthesis models to reanalyze past and future starformation timescales in the disks. The authors find that the pro-nounced change in the photometric properties of spiral galaxiesalong the Hubble sequence is predominantly due to changes inthe star formation histories of disks, and only secondarily tochanges in the bulge/disk ratio.
It is well known that there is a strong morphological seg-regation in clusters of galaxies, with most of the ellipticals inthe center of the cluster while the spirals are more dispersed.Also early-type spirals seem more concentrated than late-types.Although Abell 262 is an extremly spiral rich cluster this seg-regation will most likely also effect the bulge to disk ratio as afunction of location in the cluster. It is, however, not self-evidentthat this effect has any influence on the measured bulge sizes.In the following we will address this problem.

W. Hackenberg et al.: Near-infrared adaptive optics observations of galaxy clusters 53
Fig. 9. Deconvolved nuclear source sizes in Abell262 and Abell 1367 against the distance from thecluster center (inside and outside of the Abell ra-dius). The size of the data points is proportional tothe HI deficiency of each galaxy.
Fig. 10. Results from the starburst analy-sis: log(M?/LK) (top) and log(LK/LLyc)(bottom) both as a function of starburst age.The ages for the overall galaxy derived fromthe mass-to-light ratio are consistent in eachcase with the disk population ages derivedfrom the analysis of the luminosity ratios.For the discretization in the starburst decaytime constant theLK/LLyc data symbolsdisplay the individual ages consistent withthe availableLbol/LLyc andνSN/Lbol ra-tios (model curves not shown here).

54 W. Hackenberg et al.: Near-infrared adaptive optics observations of galaxy clusters
Fig. 11. AO-corrected K′-band image of the J1836.3CR field witha resolution of 0.15′′. The lowest contour level corresponds to19.7 mag/arcsec2; contour spacing is 0.5 mag/arcsec2. Within the cen-tral dotted area the mosaic provides the highest signal-to-noise ratio.The labeled sources are also detected in J and H band.
Our finding can be discussed in the framework of recent in-vestigations of the bulge-to-disk luminosity ratio. In a sampleof 3114 galaxies Solanes et al. (1989) analyzed the luminosityof bulge and disk components of disk galaxies and their pos-sible correlations with morphological type and local density.Independently of the local environment no evidence is foundfor any bulge segregation among disk galaxies. Instead theyfind that disks appear to be less luminous with increasing lo-cal density. They find that the absolute brightness differenceM (bulge)−M (total) corresponds to about 3 for Sc galaxies, 2for Sb and 1 for Sa and S0 galaxies. A similar trend is alsoobserved in the dependency of the near-infrared concentrationindexC31 (defined in Gavazzi et al. 1990) on the absolute H-band magnitude in a sample of 297 galaxies investigated byGavazzi et al. (1996). In this sample the bulge-to-disk ratio sys-tematically increases with decreasing H-band luminosity. Themorphological segregation reported by Solanes et al. (1989) is(if at all) only weakly indicated.
Both quantities,M (bulge)−M (total) andC31, are concen-tration parameters that simply describe the bulge versus diskbrightness. In a scenario in which bulge components of iden-tical brightness are located in the centers of disks of varyingbrightness the FWHM of the NIR light, measured with respectto the combined peak of the disk and bulge component willresult in smaller values for lower disk luminosities. Thereforethe observed disk luminosity antisegregation could in principlebe responsible for our observed tendency that the FWHM ofgalaxies within the Abell radii of the Abell 262 and Abell 1367clusters are smaller than those outside the Abell radii.
Fig. 12.AO-corrected K′-band image of the PKS 0743-006 field witha resolution of 0.15′′. Within the southeastern dotted area the mosaicprovides the highest signal-to-noise ratio. The lowest contour levelcorresponds to 18.5 mag/arcsec2; contour spacing is 0.6 mag/arcsec2.The sourcesa − d also appear in J- and H-band.
However, it is also possible that a luminosity antisegregationas observed for the disks is also present for the bulges, butis just compensated for by the additional contribution to thebulge luminosity due to enhanced star formation triggered bythe effects of a higher cluster density environment.
Theoretical studies (Moore et al. 1996, Fujita 1998) showthat the velocity perturbation induced by a single high-speedencounter is in most cases too small to affect the star formationrate of a disk galaxy. However, several successive high-speedencounters between galaxies (galaxy harassment) may lead togas inflow and strong star formation activity (Fujita 1998). Thispicture is consistent with the cluster crossing and star formationtime scales. From the sample of 84 Abell 262 cluster memberslisted in Giovanelli & Haynes (1985) we derive a velocity dis-persion of 750 km s−1. The Abell radius of 1.75◦ then indicatesthat several 109 years are required to cross a significant fractionof the central part of the cluster. However, the time scale forformation of supergiants plus their life time amounts to onlyseveral 107 years. This indicates that in gas rich spiral galaxiesstar formation can easily be triggered via galaxy-galaxy inter-actions while passing through the central part of the cluster.
4.4. Star formation in the high redshift clusters
In Fig. 11 we show a K′-band image of the J1836.3CR field andin Fig. 12 a K′-band image of the PKS 0743-006 field.
Model values for the JHK flux densities were calculatedusing the GISSEL stellar population models (Bruzual & Charlot1993), and compared with the measurements for each field and

W. Hackenberg et al.: Near-infrared adaptive optics observations of galaxy clusters 55
Table 9. Photometry and colors of sources in J1836.3CR. The photo-metric quality of the data is of the order of 0.10m in the K- and H-bandand 0.15m in the J-band. All sources can be identified as galaxies (G).
source ident. J H K J − H H − K
a G 17.10 16.20 15.30 0.90 0.90b G 20.23 19.30 18.43 0.93 0.87b2 G 19.59 18.64 17.89 0.94 0.77c G 19.02 18.08 17.25 0.95 0.82d G 20.85 19.70 18.75 1.15 0.95e G 20.35 19.10 17.90 1.25 1.20f G 20.20 18.80 17.60 1.40 1.20g G 19.10 18.25 17.50 0.85 0.75
appropriate redshift. For better comparison we only show thetracks in Fig. 13, and then superimpose the observed data inFig. 14 and Fig. 15.
All the models have been calculated for a passively evolvingpopulation after a 1 Gyr starburst. The Padova initial spectralenergy distribution is used with a Salpeter IMF. Continued starformation, renewed star formation or initial mass functions trun-cated at their high mass end all tend to move galaxies towardsthe starts of the tracks. Since the SHARP II+ data were takenin the K′ filter we transformed the K′ magnitudes to K bandvalues using the following relation:K = K′ + 0.2 × (H − K)(Wainscoat and Cowie 1992). For the color correction we usedthe mean observed H− K colors of those objects which wecould identify as being extragalactic and close to the redshift ofthe corresponding cluster. For the PKS 0743-006 cluster thesemean colors are H− K ∼ 0.55 and for the J1836.3CR clusterwe find H − K ∼ 0.69. In Table 9 and Table 10 we give themagnitudes and flux densities and JHK colors for the objects inour field of view towards both clusters.
In all cases the flux densities were derived from sky-subtracted images, taking into account possible contaminationsby neighboring sources. The mean apertures for J1836.3CR andPKS 0743 were 3.95′′(K′), 3.80′′(H), 3.62′′(J), and 4.13′′(K′),3.60′′(H), 3.33′′(J), respectively.
J1836.3CR: In Fig. 14 we show the colors of all sources inour field of view towards the J1836.3CR cluster atz = 0.414.All galaxies are located at the tip of the evolutionary track fora passively evolving galaxy at that redshift. This is consistentwith an age of 10 Gyrs (or more) and some intrinsic reddeningwith a mean value of the order ofAV = 2–3 mag.
Sourcea is the brightest galaxy in our field of view of theJ1836.3CR cluster. For this source our data allow us for the firsttime to obtain reliable color information close to the diffractionlimit of the 3.6 m telescope. For this purpose the three 0.10′′
pixel scale maps were first deconvolved with the PSF and thenreconvolved with a Gaussian clean beam to be at the same reso-lution. The final resolution of the H and K maps is 0.2′′ and thatof the J map is 0.3′′. From the flux density calibrated maps wetherefore calculated a J− H color map at a resolution of 0.3′′
and a H−K color map at a resolution of 0.2′′. As a result overa 1.9′′ diameter aperture centered on sourcea the colors turned
Table 10. Photometry and colors of sources in PKS 0743-006. Thephotometric quality of the data is of the order of 0.10m in the K- andH-band and 0.15m in the J-band. Three sources in the vicinity of thequasar can be identified as galaxies (G).
source ident. J H K J− H H − K
GS guide star 11.05 10.95 10.90−0.05 −0.05Q quasar 15.80 15.50 14.90 0.30 0.60a G 17.60 17.10 16.60 0.50 0.50b G 17.70 17.40 16.80 0.40 0.50c star 18.00 17.80 16.60 0.70 0.10d G 20.50 20.30 19.80 0.20 0.50e star 20.30 20.10 19.40 0.70 0.30
out to be fairly uniform with mean colors corresponding to thevalues given in Table 9 and color variations of≤ ± 0.15. Thenucleus of sourcea which can be clearly distinguished in theindividual images at the three wavelengths does not appear par-ticularly red or blue. This indicates that there are little variationsin extinction or in spectral type across the source.
PKS 0743-006:In Fig. 15 we show the colors of all sources inour field of view towards the quasar PKS 0743-006 atz = 0.994.Compared to the cluster J1836.3CR this field is more sparselypopulated. Clearly not all of the objects have colors correspond-ing to high-redshift galaxies. Two of the objects (e, c) are at alocation in the JHK color-color diagram that is populated bylocal giant or dwarf stars. For comparison – and as a convenientcheck of our calibration – we have also added the position ofthe bright reference star on which the adaptive optics loop waslocked. This star is of type A0, in agreement with the measuredcolors. All other objects are located close to the middle of theevolutionary track for a passively evolving galaxy at a redshiftof z = 0.994. This is consistent with an age closer to 2 Gyrsthan 10 Gyrs. The age may even be lower under the assump-tion of intrinsic reddening. This would indicate that the light ofthese objects is dominated by a reasonably young, blue stellarpopulation.
Although the identification of these objects asz = 0.994galaxies has to be confirmed spectroscopically, an alternativeexplanation for the nature of these object is difficult to find.Even taking the uncertainties of the measured colors into ac-count these sources are positioned well to the lower right of themean colors of spiral galaxies or those of local dwarfs and giantstars. The only other objects that are located in this area of theJHK-color diagram are local HII regions, if their near-infraredemission is un-reddened and dominated by free-free radiation.Having 3 of these objects in the same field as the quasar (withsimilar colors) is very unlikely.
The best information on the sizes of the sources in this fieldis from the data taken with a 0.05′′/pixel sampling. While thequasar itself is unresolved as compared to radial and tangentialcuts with respect to the direction of the AO reference, we findone of the brighter sources (b) that is close to the quasar asclearly extended in all directions. This source has an angularseparation to the quasar of only 3.8′′. Deconvolving its measured

56 W. Hackenberg et al.: Near-infrared adaptive optics observations of galaxy clusters
Fig. 13.Model values for the JHK flux densi-ties calculated using the GISSEL stellar pop-ulation models (Bruzual & Charlot 1993).Different redshifts are indicated. Every evo-lution track starts (at the lower left corner)at time zero. The dotted lines mark the lo-cation of a10 × 109 yr and20 × 109 yr oldpopulation, respectively.
Fig. 14. GISSEL stellar population modelsfor J1836.3CR atz = 0.414. The data pointsare best explained by a reddening ofAV =3 mag (dash-dotted curve). Sourcese andfare probably background galaxies.
Fig. 15. GISSEL stellar population modelsfor PKS 0743-006 atz = 0.994. Drawn arethe unreddened evolution tracks forz = 0andz = 1, respectively.

W. Hackenberg et al.: Near-infrared adaptive optics observations of galaxy clusters 57
Fig. 16. Radial intensity profiles of theJ1836.3CR cluster members. performed on thedeconvolved ADONIS/SHARP II+ data taken inthe K′ band with a 0.1′′ pixel scale interpolatedonto a 0.05′′ pixel grid. The errors are standarddeviations of values at a given radius. The solidand dashed lines are the result of a reducedχ2
fit of a model (see text) to all data (solid line)and to data at larger radii only (dashed line,De Vaucouleurs law). For comparison we haveplotted the profile of the AO guide star afterthe same number of iterations with the Lucydeconvolution algorithm (data connected witha dash-dotted line).
size with the size of the unresolved quasar by subtracting thevalues in quadrature its deconvolved source size is0.22′′ ×0.16′′ at a position angle of about 45◦. At a redshift ofz =0.994 this corresponds to a linear size of 1.9 kpc× 1.4 kpc.The extent of the source, its small angular separation from thequasar, and its colors make this object the best candidate for acluster galaxy which is associated with the quasar PKS 0743-006. The previously described blue colors with respect to thevalues expected for a passively evolving galaxy at a redshift ofz = 0.994 then imply that we look at a galaxy with a region ofenhanced star formation that extends over an area of 2.7 kpc2.
4.5. Bulge sizes and structures in J1836.3CR
Our best K-band AO images of J1836.3CR can be used to derivestructural information on individual cluster members. We deter-mined radial profiles in the direct and deconvolved images. The
radial profiles of the deconvolved images have the advantagethat they have been corrected for the non-diffraction limited partof the PSF and allow a much clearer view on the detailed distri-bution of light in each object. In Fig. 16 we show the profiles of8 sources in the field including a profile of the guide star afterthe same number of Lucy deconvolution iterations (∼ 1000).
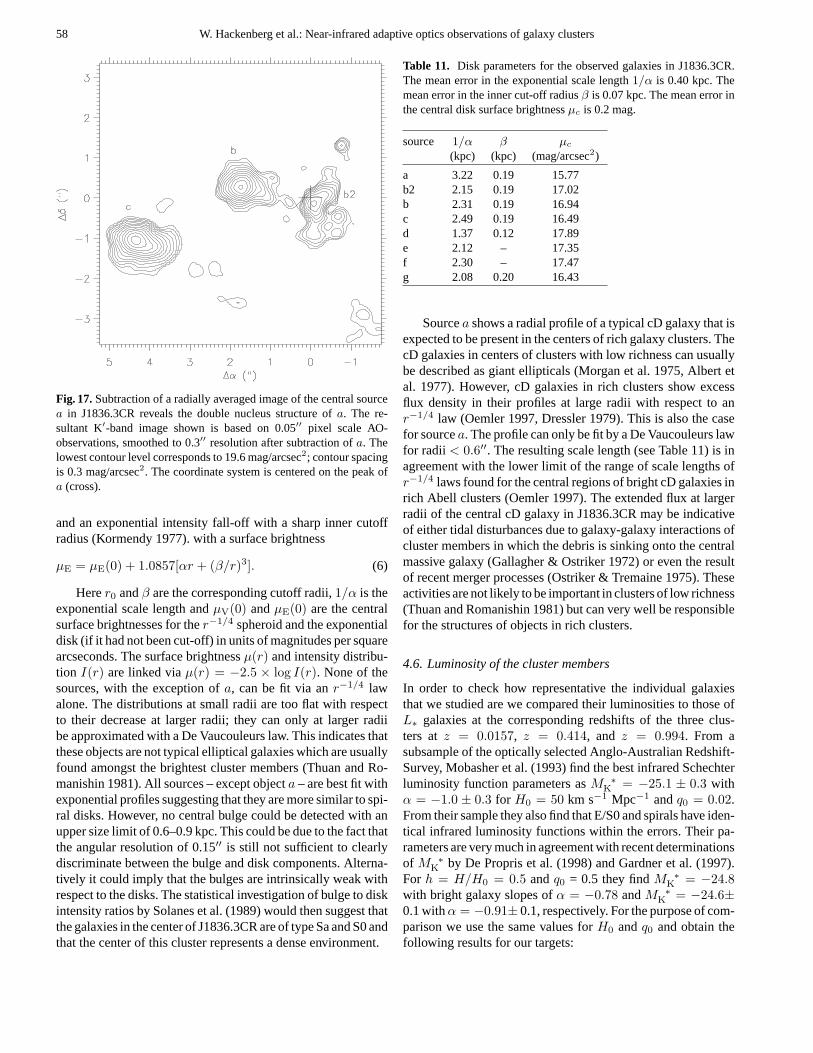
To determine the profile of sourceb we first subtracted aradially averaged image of sourcea as determined from itsnon-contaminated section to the north. This process revealeda further, even weaker sourceb2 (see Fig. 17). Both sourcesbandb2 were subtracted from the image before calculating theaverage radial profile ofa.
Following Kormendy (1977) the radial profiles were fittedvia a reducedχ2 test as a combination of ar−1/4 spheroid (DeVaucouleurs 1959) with a surface brightness
µV = µV(0) + 8.325[(r/r0)1/4 − 1] (5)
58 W. Hackenberg et al.: Near-infrared adaptive optics observations of galaxy clusters
Fig. 17.Subtraction of a radially averaged image of the central sourcea in J1836.3CR reveals the double nucleus structure ofa. The re-sultant K′-band image shown is based on 0.05′′ pixel scale AO-observations, smoothed to 0.3′′ resolution after subtraction ofa. Thelowest contour level corresponds to 19.6 mag/arcsec2; contour spacingis 0.3 mag/arcsec2. The coordinate system is centered on the peak ofa (cross).
and an exponential intensity fall-off with a sharp inner cutoffradius (Kormendy 1977). with a surface brightness
µE = µE(0) + 1.0857[αr + (β/r)3]. (6)
Herer0 andβ are the corresponding cutoff radii,1/α is theexponential scale length andµV(0) andµE(0) are the centralsurface brightnesses for ther−1/4 spheroid and the exponentialdisk (if it had not been cut-off) in units of magnitudes per squarearcseconds. The surface brightnessµ(r) and intensity distribu-tion I(r) are linked viaµ(r) = −2.5 × log I(r). None of thesources, with the exception ofa, can be fit via anr−1/4 lawalone. The distributions at small radii are too flat with respectto their decrease at larger radii; they can only at larger radiibe approximated with a De Vaucouleurs law. This indicates thatthese objects are not typical elliptical galaxies which are usuallyfound amongst the brightest cluster members (Thuan and Ro-manishin 1981). All sources – except objecta – are best fit withexponential profiles suggesting that they are more similar to spi-ral disks. However, no central bulge could be detected with anupper size limit of 0.6–0.9 kpc. This could be due to the fact thatthe angular resolution of 0.15′′ is still not sufficient to clearlydiscriminate between the bulge and disk components. Alterna-tively it could imply that the bulges are intrinsically weak withrespect to the disks. The statistical investigation of bulge to diskintensity ratios by Solanes et al. (1989) would then suggest thatthe galaxies in the center of J1836.3CR are of type Sa and S0 andthat the center of this cluster represents a dense environment.
Table 11. Disk parameters for the observed galaxies in J1836.3CR.The mean error in the exponential scale length1/α is 0.40 kpc. Themean error in the inner cut-off radiusβ is 0.07 kpc. The mean error inthe central disk surface brightnessµc is 0.2 mag.
source 1/α β µc
(kpc) (kpc) (mag/arcsec2)
a 3.22 0.19 15.77b2 2.15 0.19 17.02b 2.31 0.19 16.94c 2.49 0.19 16.49d 1.37 0.12 17.89e 2.12 – 17.35f 2.30 – 17.47g 2.08 0.20 16.43
Sourcea shows a radial profile of a typical cD galaxy that isexpected to be present in the centers of rich galaxy clusters. ThecD galaxies in centers of clusters with low richness can usuallybe described as giant ellipticals (Morgan et al. 1975, Albert etal. 1977). However, cD galaxies in rich clusters show excessflux density in their profiles at large radii with respect to anr−1/4 law (Oemler 1997, Dressler 1979). This is also the casefor sourcea. The profile can only be fit by a De Vaucouleurs lawfor radii < 0.6′′. The resulting scale length (see Table 11) is inagreement with the lower limit of the range of scale lengths ofr−1/4 laws found for the central regions of bright cD galaxies inrich Abell clusters (Oemler 1997). The extended flux at largerradii of the central cD galaxy in J1836.3CR may be indicativeof either tidal disturbances due to galaxy-galaxy interactions ofcluster members in which the debris is sinking onto the centralmassive galaxy (Gallagher & Ostriker 1972) or even the resultof recent merger processes (Ostriker & Tremaine 1975). Theseactivities are not likely to be important in clusters of low richness(Thuan and Romanishin 1981) but can very well be responsiblefor the structures of objects in rich clusters.
4.6. Luminosity of the cluster members
In order to check how representative the individual galaxiesthat we studied are we compared their luminosities to those ofL∗ galaxies at the corresponding redshifts of the three clus-ters atz = 0.0157, z = 0.414, and z = 0.994. From asubsample of the optically selected Anglo-Australian Redshift-Survey, Mobasher et al. (1993) find the best infrared Schechterluminosity function parameters asM ∗
K = −25.1 ± 0.3 withα = −1.0 ± 0.3 for H0 = 50 km s−1 Mpc−1 andq0 = 0.02.From their sample they also find that E/S0 and spirals have iden-tical infrared luminosity functions within the errors. Their pa-rameters are very much in agreement with recent determinationsof M ∗
K by De Propris et al. (1998) and Gardner et al. (1997).For h = H/H0 = 0.5 andq0 = 0.5 they findM ∗
K = −24.8with bright galaxy slopes ofα = −0.78 andM ∗
K = −24.6±0.1 withα = −0.91± 0.1, respectively. For the purpose of com-parison we use the same values forH0 andq0 and obtain thefollowing results for our targets:

W. Hackenberg et al.: Near-infrared adaptive optics observations of galaxy clusters 59
Abell 262: For our low redshift cluster both objects we studyhere – UGC 1344 and UGC 1347 – areL∗ galaxies to withinless than 0.5 magnitudes.
J1836.3CR:For this cluster we find that the bright sourcea isjust 0.6 magnitude brighter and that the other sources are about1 to 2 magnitudes fainter than a typicalL∗ galaxy at that redshiftof z = 0.414.
PKS 0743-006:For the 3 presumed galaxies close to the quasarPKS 0743-006 atz = 0.994 we find that two are about 0.7magnitudes brighter than anL∗ galaxy and the weakest oneis 2 magnitudes fainter thanL∗. This is consistent with thestatement that the brighter members of the observed clustersare on the K-z relation which, as emphasized by Lilly (1988),shows only a small scatter ofσ ∼ 0.3 mag at redshifts belowz = 1.5. In addition it should be mentioned that the quasarPKS 0743-006 itself shows very similar colors compared to thegalaxy candidates in the observed field. However, due to thenuclear contribution it is – as expected (see data in Dunlop et al.1993 and Lehnert et al. 1992) – between 1.5 and 2 mag brighterthan what is predicted by the galaxy K-z relation. We also findthat the measured JHK fluxes of this variable quasar were atthe time we took the data about 0.7 to 1.0 magnitudes belowwhat is given in the literature (White et al. 1988, Lepine et al.1985). Since quasar host galaxies have been found to be often asbright as5 × L∗ (McLeod & Rieke 1995, Sanchez et al. 1997)the underlying host galaxy may contribute substantially to theoverall flux density of the quasar in this low state.
This indicates that the source properties that we determinedin the previous sections are representative for typicalL∗ clustermembers at the corresponding redshifts.
5. Summary and conclusions
We have presented high angular resolution NIR observations ofthree galaxy clusters at different redshifts using adaptive optics.In the case of the barred spiral UGC 1347 in Abell 262 wepresented the first adaptive optics data using the laser guide starprovided by the ALFA system.
The diagnostic ratios for the nucleus of UCG 1347 indicaterecent and ongoing star formation activity. In addition to theresolved NIR nucleus in UGC 1347 we found a bright and com-pact region of recent and enhanced star formation at one tip ofthe bar. TheLK/LLyc ratio as well as the V− K color of thatregion imply that a starburst happened about 107 years ago. ForUGC 1344 we found that the overall star formation activity islow and that the system is deficient in the fuel for star formation.
The comparison of seeing-corrected nuclear bulge sizes ofa sample of 26 cluster galaxies within and outside of the Abellradius of Abell 262 and Abell 1367 indicates that the galax-ies in the inner part of the cluster show a tendency for morecompact bulges than those outside. This phenomenon can ten-tatively be ascribed to an increased star formation activity dueto interactions of cluster members inside the Abell radius. Suchan increase of central activity is also indicated at other wave-lengths. Scodeggio and Gavazzi (1993) find in a 21 cm surveyof spiral galaxies in clusters that about 30% of them show ex-
tended radio continuum emission and that a substantial fractionof those (but not all) show indications of interaction. Moss andWhittle (1993) find from an Hα survey of cluster spirals thatinteracting spirals show a strong tendency to have compact nu-clear Hα emission which the authors conclude to be most likelydue to tidally induced star formation from galaxy-galaxy inter-actions, since interactions are more likely to happen close tothe cluster center. Several successive high-speed encounters be-tween galaxies may lead to gas inflow and strong star formationactivity (Fujita 1998). This would imply that dynamically in-duced star formation is more important in the center than theouter parts of a cluster, although current investigations have notyet convincingly shown the obvious presence of such an corre-lation. Future observations of larger samples of cluster membersare clearly needed to substantiate these correlations.
Since the spiral content of galaxy clusters at higher red-shifts is about as large as the spiral content in the field atz = 0(Oemler et al. 1997), detailed observations of galaxies in low-redshift spiral-rich clusters may provide essential informationof the cluster evolution at higher redshifts in general. In partic-ular it would allow us to study in detail the influence of galaxyharassment. Abell 262 and Abell 1367 are spiral-rich clusters.With a ratio of spirals to S0 and E0 galaxies of 47%/53% and43%/57%, respectively, their spiral content is similar to that inthe field atz = 0 of 55%/45% and to that in clusters at a redshiftof z = 0.4 of 40%/60% (Oemler 1997).
UGC 1347 and UGC 1344 could very well be taken as ex-amples of the blue and red fraction of clusters at higher redshift.Couch et al. (1998) reports on 3 galaxy clusters atz = 0.3 mea-sured with the HST. In these clusters he finds the fraction ofspirals at least 3 times higher than atz = 0 which would ap-proximately correspond to the spiral fraction of Abell 262 andAbell 1367. About 20% of all galaxies show signs of interaction.The blue fraction of the cluster population shows morphologiessimilar to Sb-Sdm/Irr galaxies with compact knotty regions ofstar formation. These knots may be very similar to the brightstar formation region we found for UGC 1347. The red fractionof the cluster population they find is 1-2 Gyr past the last majorstar formation event and has morphological similarities to S0-Sb disks. This may be very similar to UGC 1344 and sourceain J1836.3CR.
However, the radial profile of sourcea in J1836.3CR showsindications for recent or ongoing interactions between clustermembers. Here the enhanced flux above the De Vaucouleursfit to the data at larger radii identifies sourcea as the centralcD galaxy in a rich cluster environment in which interactionsbetween cluster members are probably still of importance fortheir further evolution.
From an investigation of NIR colors Hutchings & Neff(1997) find for 5 quasars at redshifts ranging fromz = 0.06to 0.3 that they are located in mostly evolved groups of galax-ies with an indication for average extinction values ofAV =2–3 mag quite similar to J1836.3CR atz = 0.414 discussed inthis paper. However, on the basis of large-scale investigations(Butcher & Oemler, 1984, Ellis 1997) as well as studies of indi-vidual galaxy clusters (e.g. Morris et al. 1998) one finds that both

60 W. Hackenberg et al.: Near-infrared adaptive optics observations of galaxy clusters
in clusters and in the field the blue fraction of galaxies generallyincreases towards higher redshifts (the Butcher Oemler effect,BOE). This is consistent with our finding of relatively blue NIRcolors in the galaxy candidates associated with PKS 0743-006atz = 0.994.
Based on an investigation of Abell 2390 atz = 0.2279 anda comparison to the cluster MS 1621.5+2640 atz = 0.4274Abraham et al. (1996) and Morris et al. (1998) suggest thatthe star formation process is shut down by a combination ofgas stripping followed by gas exhaustion via star formation.This truncation of star formation activity may explain both theBOE and the large fraction of S0 galaxies in clusters. This alsosuggests that truncated star formation induced by infall doesnot play a major role in driving cluster galaxy evolution at lowerredshifts although this mechanism may have played a role inearlier history. The barred structure of UGC 1347 as well asthe strong recent star formation event at one tip of the bar mayindicate that this object is well suited to study the correspond-ing physical processes of cluster galaxy evolution in great detail.
Acknowledgements.We are grateful to the Calar Alto and La Sillastaff for their excellent support and hospitality. We thank M. Lehnert,H.W. Rix, R. Genzel, L. Tacconi and T. Boller for helpful discussions.We are particularly grateful to P. Amram and M. Marcelin who kindlyprovided the Hα continuum and line images to us. We furthermorethank the referee for very helpful and constructive suggestions.
References
Abraham R.G., Smecker-Hane T.A., Hutchings J.B., et al., 1996, ApJ471, 694
Albert C., White R., Morgan W.W., 1977, ApJ 211, 309Amram P., Marcelin M., Balkowski C., Cayatte V., et al., 1994, A&AS
103, 5Arsenault R., Salmon D.A., Kerr J.M., et al., 1994, in: Ealey M.A.,
Merkle F. (eds.), Adaptive Optics in Astronomy, Proc. SPIE 2201,833
Beuzit J.-L., Hubin N., Gendron E., et al., 1994, in: Ealey M.A., MerkleF. (eds.), Adaptive Optics in Astronomy, Proc. SPIE 2201, 955
Bravo-Alfaro H., Szomoru A., Cayatte V., et al., 1997, A&AS 126, 537Bruzual A.G., Charlot S., 1993, ApJ 405, 538Butcher H., Oemler A., 1984, ApJ 285, 426Condon J.J., Cotton W.D., Greisen E.W., et al., 1996, NCSA Astronomy
Digital Image LibraryCondon J.J., 1992, ARA&A 30, 575Couch W.J., Berger A.J., Smail I., et al., 1998, ApJ 497, 188Davies R.I., Hackenberg W., Ott T., et al., 1999, A&AS 138, 345Davies R.I., Hackenberg W., Ott T., et al., 1998, in: Bonaccini D.,
Tyson R.K. (eds.), Adaptive Optics System Technologies, Proc.SPIE 3353, 116
De Propris R., Eisenhardt P.R., Stanford S.A., Dickinson M., 1998,ApJ 503, L48
De Vaucouleurs G., 1959, in: Flugge S. (ed.), Handbuch der Physik 53,311
De Vries H.W., Heithausen A., Thaddeus P., 1987, ApJ 319, 723Doyon R., Joseph R.D., Wright G.S., 1994, ApJ 421, 101
Draine B.T., 1989, in: Kaldeich B.H. (ed.), Infrared Spectroscopy inAstronomy, Proc. of ESA, ESA-SP 290
Dressler A., 1979, ApJ 231, 659Drummond J.D., Fugate R.Q., Christou J.C., Hege K., 1998, Icarus
132, 80Dunlop J.S., Taylor G.L., Hughes D.H., Robson E.I., 1993 MNRAS
264, 455Eckart A., Cameron M., Boller Th., et al., 1996, ApJ 472, 588-599Eckart A., Cameron M., Rothermel, et al., 1990, ApJ 363, 451Eisenhauer F., Quirrenbach A., Zinnecker H., Genzel R., 1998, ApJ
498, 278Ellis R., 1997, ARA&A 35, 389Fairclough J.H., 1985, in: Gondhalekhar P.M. (ed.), Extragalactic In-
frared Astronomy, Rutherford Appelton Laboratory Workshop,RAL-85-086
Fanti C., Mantovani F., Tomasi P., 1981, A&AS 43, 1Frogel J.A., Persson S.E., Aaronson M., Matthews K., 1978,ApJ 220,
75Fujita Y., 1998, ApJ 509, 587Gardner J.P., Sharples R.M., Frenk C.S., Carrasco B.E., 1997, ApJ 480,
L99Gallagher J.S., Ostriker J.P., 1972, AJ 77, 288Gavazzi G., Boselli A., 1996, Astrophys. Letters & Communcations
35, 1Gavazzi G., Piierini D., et al., 1996, A&AS 120, 521Gavazzi G., Trinchieri G., Boselli A., 1990, A&AS 86, 109Gehrz R.D., Sramek R.A., Weedman D.W., 1983, ApJ 267, 551Genzel R., Weitzel L., Tacconi-Garman, et al., 1995, ApJ 444, 129Giovanelli R., Haynes M.P., 1985, AJ 90, 2445Giovanelli R., Haynes M.P., Chincarini G.L., 1982, ApJ 262, 442Glindemann A., Hamilton D., Hippler S., et al., 1997, in: Hubin N.
(ed.), Proc. of the ESO Workshop on Laser Technology for LaserGuide Star Adaptive Optics Astronomy, 120
Gregory P.C., Thompson L.A., Tifft W.G., 1981, ApJ 243, 411Heckman T.M., Balick B., Sullivan III W.T., 1978, ApJ 224, 745Helou G., 1986, ApJ 311, L33Hewitt A., Burbidge G., 1993, ApJS 87, 451Hildebrand R.H., 1983, QJRAS 24, 267Hofmann R., Blietz M., Duhoux P., et al., 1992, in: Ulrich M.H. (ed.),
Progress in Telescope and Instrumentation Technologies, ESOConference and Workshop Proceedings 42, 617
Hubin N., 1997, in: Ardeberg A.L. (ed.), Optical Telescopes of Todayand Tomorrow, Proc. SPIE 2871, 827
Hutchings J.B., Neff S.G., 1997, ApJ 113, 550Jackson J.M., Eckart A., Cameron M., et al., 1991, ApJ 375, 105Kennicutt R.C., Tamblyn P., Congdon C.E., 1994, ApJ 435, 22Kormendy J., 1977, ApJ 217, 406Krabbe A., Sternberg A., Genzel R., 1994, ApJ 425, 72Larson R.B., Tinsley B.M., 1978, ApJ 219, 46Leitherer C., 1996, in: ASP conf. series 98, 373Lehnert M.D., Heckmann T.M., Chambers K.C., Miley G.K., 1992,
ApJ 393, 68Lepine J.R.D., Braz M.A., Epchtein N., 1985, A&A 149, 351Lilly S.J., 1988, ApJ 340, 77Lonsdale C.H., Helou G., Good J.C., Rice W., 1985, Cataloged Galax-
ies and Quasars Observed in the IRAS Survey, Pasadena: NASA-JPL
Lucy L.B., 1974, AJ 79, 745Mas-Hesse J.M., Kunth D., 1991, A&AS 88, 399Max C.E., Olivier S.S., Friedman, et al., 1997, Sci 277, 1649McLeod K.K., Rieke G.H., 1995, ApJ 454, L77

W. Hackenberg et al.: Near-infrared adaptive optics observations of galaxy clusters 61
Melnick J., Sargent W.L.W., 1977, ApJ 215, 401Meynet G., Maeder A., Schaller, et al., 1994, A&AS 103, 97Mobasher B., Sharples R.M., Ellis R.S., 1993, MNRAS 263, 560Moore B., Katz N., Lake G., et al., 1996, Nat 379, 613Morgan W.W., Kayser S., White R., 1975, ApJ 199, 545Morris S.L., Hutchings J.B., Carlberg R.G., et al., 1998, ApJ 507, 84Moss C., Whittle M., 1993, ApJ 407, L17Moss C., Dickens R.J., 1977, MNRAS 178,701Oemler, Dressler, Butcher, 1997, ApJ 474, 561Oly C., Israel F.P., 1993, A&AS 100, 263Osterbrock D.E., 1989, Astrophysics of Gaseous Nebulae and Active
Nuclei, Mill Valley: University Science BooksOstriker J.P., Tremaine S.D., 1975, ApJ 202, L113Quirrenbach A., Hackenberg W., Holstenberg H.C., Wilnhammer N.,
1997, in: Tyson R.K., Fugate R. (eds.), Adaptive Optics and Ap-plications, Proc. SPIE 3126, 35
Rieke G.H., Loken K., Rieke M.J., Tamblyn P., 1993, ApJ 412, 99Rieke G.H., Lebofsky M.J., Thompson R.I., et al., 1980, ApJ 238, 24Salpeter E.E., 1955, ApJ 121, 161
Sanchez S.F., Conzalez-Serrano J.I., Carballo, et al., 1997, in: ClementsD.L., Perez-Fournon I. (eds.), Proceedings of the ESO/IAC Work-shop on Quasar Hosts, 21
Schaerer D., Maynet G., Maeder A., Schaller G., 1993, A&A 274, 1012Schinnerer E., Eckart A., Quirrenbach, et al., 1997, ApJ 488, 174Scodeggio M., Gavazzi G., 1993, ApJ 409, 110Shostak G.S., 1978, A&A 68, 321Solanes J.M., Salvador-Sole E., Sanroma M., 1989, AJ 98, 798Stanghellini C., O’Dea C.P., Baum, et al., 1997, ApJ 325, 943Tacconi-Garman L.E., Sternberg A., Eckart A., 1996, AJ 112, 918Tammann G.A., Loeffler W., Schroeder A., 1994, ApJS 92, 487Thuan T.X., Romanishin W., 1981, ApJ 248, 439Tornikoski M., Valtaoja E., Terasranta H., et al., 1993, AJ 105, 1680Wainscoat R.J., Cowie L.L., 1992, AJ 103, 332Wilkerson M.S., 1980, ApJ 240, 115White G.L., Jauncey D.L., Savage A., et al., 1988, ApJ 327, 561Whittet D.C., 1981, QJRAS 22, 3Wunderlich E., Klein U., 1988, A&A 206, 47Young J.S., Scoville N., 1991, ARA&A 29, 581