asthma and socioeconomic status in washington … | p a g e 2 about this report for the washington...
TRANSCRIPT

Asthma and Socioeconomic Status in Washington State
Washington State Department of Health Asthma Program
www.doh.wa.gov
360-236-3851
PO Box 47855
Olympia, WA 98504
The role of socioeconomic status on asthma
management, insurance coverage,
medication use, and asthma triggers
DOH 345-333 October 2013

1 | P a g e
1 Table of Contents
About This Report .................................................................................................................................................................. 3
Background ............................................................................................................................................................................. 4
Asthma Demographics ........................................................................................................................................................... 5
Lifetime and current asthma among adults in Washington State ...................................................................................... 5
Asthma prevalence by age and sex ..................................................................................................................................... 5
Asthma prevalence by race and Hispanic origin ................................................................................................................. 6
Socioeconomic Indicators ................................................................................................................................................... 6
Prevalence by income ......................................................................................................................................................... 7
Asthma and overall health ..................................................................................................................................................... 8
Other chronic conditions .................................................................................................................................................... 8
Health status indicators ...................................................................................................................................................... 9
Sleep disturbance ................................................................................................................................................................ 9
Risk Factors ........................................................................................................................................................................... 10
Smoking and secondhand smoke...................................................................................................................................... 10
Indoor risk factors ............................................................................................................................................................. 11
Health Management ............................................................................................................................................................ 12
Access to Health care ....................................................................................................................................................... 12
Preventive health ................................................................................................................................................................. 13
Pneumococcal vaccines .................................................................................................................................................... 13
Flu shots ............................................................................................................................................................................ 13
Use of Health Services ...................................................................................................................................................... 14
Work-related asthma ........................................................................................................................................................... 15
Current job caused or worsened asthma .......................................................................................................................... 15
Work days missed due to asthma ..................................................................................................................................... 15
Self-management ................................................................................................................................................................. 16
Asthma Education ............................................................................................................................................................. 16
Cost of inequity .................................................................................................................................................................... 17
Recommendations and Interventions ................................................................................................................................. 18
Recommendations ............................................................................................................................................................ 18
Intervention Strategies ..................................................................................................................................................... 18
2 | P a g e
Conclusion ............................................................................................................................................................................ 19
Appendix ............................................................................................................................................................................... 20
Methods ............................................................................................................................................................................ 20
Data Sources ..................................................................................................................................................................... 20
Technical Notes ................................................................................................................................................................. 21
Glossary ............................................................................................................................................................................. 22
References ............................................................................................................................................................................ 23

3 | P a g e
2 About This Report
For the Washington State Asthma Program and our partners, clarifying and addressing the asthma burden and inequities
is a priority. Information in this report can be used to identify and understand the relationship of socioeconomic status
with asthma management, medication use, insurance coverage, and other asthma indicators among Washington
residents.
This report also includes information about who is affected by asthma, status of asthma healthcare, and the impact the
home environment has on asthma. It will help target interventions to specific audiences, and help prioritize areas that
need immediate action. A short list of recommended strategies and interventions is also included in the report.
Report Data
This report presents data about Washington adults only. Data were mainly obtained from:
Washington Behavioral Risk Factor Surveillance System (BRFSS)
BRFSS Adult Asthma Callback Survey
See the Appendix to learn more about these surveys.
Lifetime and Current Asthma
This report makes a distinction between people who have ever been diagnosed with asthma – referred to as lifetime
asthma – and those who have current asthma. Lifetime asthma can provide a clearer picture of how many people have
been affected by the disease at some point in their life.
To estimate the number of people affected by asthma, people are asked “Has a doctor or other health professional ever
told you that you had asthma?” Those who answer “yes” are considered to have lifetime asthma. People who report
that they have lifetime asthma are then asked: “Do you still have asthma?” Those who answer “yes” to both questions
are considered to have current asthma.
For most of the analysis presented in this report, current asthma is used to describe the burden of the disease. There are
many overlapping individual and environmental influences that contribute to asthma. Any reference to differences
between groups implies the differences are statistically detectable unless otherwise stated. We have used the following
phrase to describe populations with the disease.
With asthma – refers to people with current asthma
Socioeconomic Status
The socioeconomic status (SES) of people and where they live and work can strongly influence their health. For the
purposes of this report,
Low-income refers to individuals with income less than $35,000
Medium-income refers to individuals with income in the range of $35,000 to $75,000
High-income refers to individuals with income of $75,000 or more

4 | P a g e
3 Background
Asthma is a chronic lung disease that makes breathing difficult during episodes of wheezing and breathlessness. These
episodes are reversible, either spontaneously or with treatment.
Asthma is one of the most common chronic diseases and has been recognized as a growing public health concern.
Asthma differs in severity, symptom presentation, and responsiveness to treatment. There is no cure for asthma, but
symptoms can sometimes improve over time. People with asthma use more healthcare resources and are at higher risk
of poor health outcomes. With quality health care, good self-management, trigger reduction, and medical treatment,
most people with asthma can live normal, productive lives.
Socioeconomic status (SES) is a complex concept. No single measure can fully account for a person’s SES. Many factors
including, but not limited to, education, occupation, income, and neighborhood characteristics can contribute to a
person’s socioeconomic status.1 Most studies use a single indicator to understand the possible effects of SES on health.
This report uses income categories to define SES.
There are prominent disparities in asthma prevalence among different racial and ethnic groups, and level of education
or income. Lack of insurance, environmental risk factors, poor mental health, and inadequate or unavailable medical
care play a significant role in the apparent links among race, ethnicity, poverty, and asthma.2

5 | P a g e
4 Asthma Demographics
Lifetime and current asthma among adults in Washington State More than one in six Washington adults have been told by a health professional at some point during their lifetime that
they have asthma. 3
Figure 1. Adults with asthma
More than 800,000 Washington adults are
estimated as ever having lifetime asthma and
over 500,000 are estimated to have current
asthma. 3
Asthma prevalence by age and sex Overall, adult females are more likely to
report having current asthma than adult
males. This is true across all adult age groups
[Figure 2].
Similar gender-related disparities in asthma
prevalence are seen in national data4 and
throughout epidemiological literature. No
single explanation for these differences has
been identified. Some of the potential
explanations include biological differences –
such as sex hormones or increased bronchial
hyper-responsiveness – and sociocultural
differences – such as differing perceptions of
airflow obstruction or medication
compliance.5, 6
Current Asthma, 9.8%
Lifetime, Not Current
Asthma, 5.7%
Never had Asthma, 86.0%
Washington Behavioral Risk Factor Surveillance System, 2011
7 7 8
7
12 12
14
11
0
2
4
6
8
10
12
14
16
Age 18-34 Age 35-49 Age 50-64 Age 65 +
Pe
rce
nt
Male
Female
Washington Behavioral Risk Factor Surveillance System, 2009-2011; Age-standardized
Figure 2. Adults with current asthma by age and sex
6 | P a g e
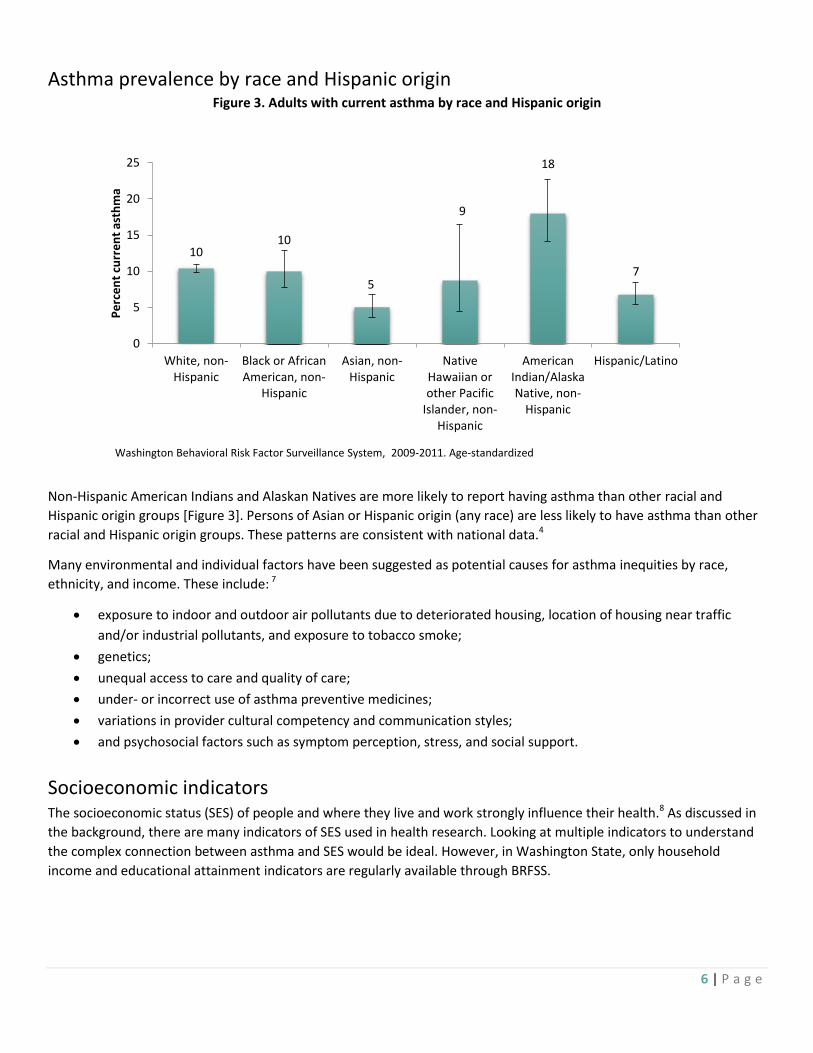
Asthma prevalence by race and Hispanic origin Figure 3. Adults with current asthma by race and Hispanic origin
Non-Hispanic American Indians and Alaskan Natives are more likely to report having asthma than other racial and
Hispanic origin groups [Figure 3]. Persons of Asian or Hispanic origin (any race) are less likely to have asthma than other
racial and Hispanic origin groups. These patterns are consistent with national data.4
Many environmental and individual factors have been suggested as potential causes for asthma inequities by race,
ethnicity, and income. These include: 7
exposure to indoor and outdoor air pollutants due to deteriorated housing, location of housing near traffic
and/or industrial pollutants, and exposure to tobacco smoke;
genetics;
unequal access to care and quality of care;
under- or incorrect use of asthma preventive medicines;
variations in provider cultural competency and communication styles;
and psychosocial factors such as symptom perception, stress, and social support.
Socioeconomic indicators
The socioeconomic status (SES) of people and where they live and work strongly influence their health.8 As discussed in
the background, there are many indicators of SES used in health research. Looking at multiple indicators to understand
the complex connection between asthma and SES would be ideal. However, in Washington State, only household
income and educational attainment indicators are regularly available through BRFSS.
10 10
5
9
18
7
0
5
10
15
20
25
White, non-Hispanic
Black or AfricanAmerican, non-
Hispanic
Asian, non-Hispanic
NativeHawaiian orother Pacific
Islander, non-Hispanic
AmericanIndian/AlaskaNative, non-
Hispanic
Hispanic/Latino
Pe
rce
nt
curr
en
t as
thm
a
Washington Behavioral Risk Factor Surveillance System, 2009-2011. Age-standardized

7 | P a g e
Prevalence by income There is a strong connection between
current asthma and income levels.
Washingtonians living in a household
with an annual income of less than
$15,000 are consistently more likely to
report having asthma than all other
income levels. People in the lowest
income category are more than twice as
likely to report asthma when compared
to people with household incomes of
$75,000 or more per year [Figure 4].
Prevalence by educational attainment Adults 25 and older who have
completed four years of college were
less likely to report current asthma
than people with less education
[Figure 5]. There is no clear difference
in reported asthma between high
school graduates who did not
complete college and people with less
than high school education reported.
Since there is no clear difference in
asthma prevalence among
educational attainment levels, only
household income is used as an
indicator for socioeconomic status
(SES) in this report. In addition,
income is one of the most direct
measures of living standards9 and is
considered to be a suitable indicator of living circumstances.10 For these reasons, household income as a SES indicator
will provide an accurate summary of the impact SES has on adults with asthma in Washington State.
17
12
9 9 9 8
0
5
10
15
20
25
<$15,000 $15,000 -$24,999
$25,000 -$34,999
$35,000 -$49,999
$50,000 -$74,999
$ 75,000 ormore
Pe
rce
nt
curr
en
t as
thm
a
Washington Behavioral Risk Factor Surveillance System, 2009-2011. Age-standardized
8
11
10
0
2
4
6
8
10
12
14
College graduate or more High school graduate Less than high school
Pe
rce
nt
Estimates include respondents ages 25 years or older only Washington Behavioral Risk Factor Surveillance System, 2009-2011
Figure 5. Adults with current asthma by educational attainment
Figure 4. Adults with current asthma by annual household income
8 | P a g e
5 Asthma and overall health
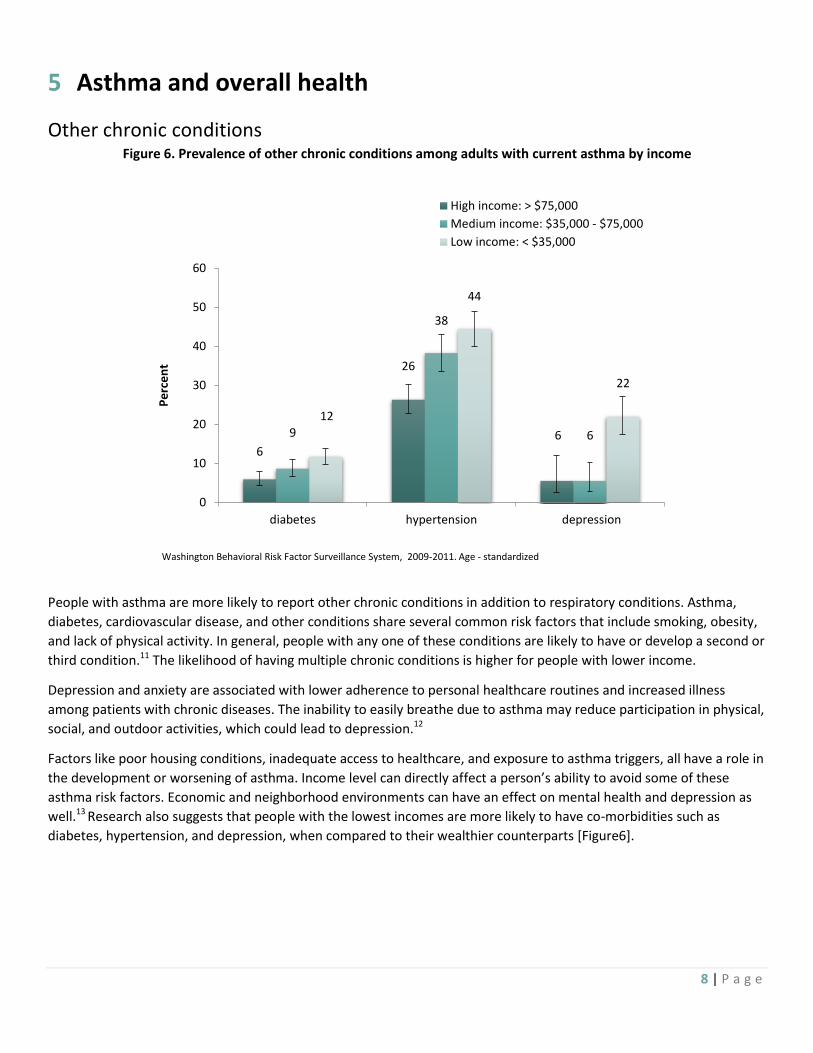
Other chronic conditions Figure 6. Prevalence of other chronic conditions among adults with current asthma by income
People with asthma are more likely to report other chronic conditions in addition to respiratory conditions. Asthma,
diabetes, cardiovascular disease, and other conditions share several common risk factors that include smoking, obesity,
and lack of physical activity. In general, people with any one of these conditions are likely to have or develop a second or
third condition.11 The likelihood of having multiple chronic conditions is higher for people with lower income.
Depression and anxiety are associated with lower adherence to personal healthcare routines and increased illness
among patients with chronic diseases. The inability to easily breathe due to asthma may reduce participation in physical,
social, and outdoor activities, which could lead to depression.12
Factors like poor housing conditions, inadequate access to healthcare, and exposure to asthma triggers, all have a role in
the development or worsening of asthma. Income level can directly affect a person’s ability to avoid some of these
asthma risk factors. Economic and neighborhood environments can have an effect on mental health and depression as
well.13 Research also suggests that people with the lowest incomes are more likely to have co-morbidities such as
diabetes, hypertension, and depression, when compared to their wealthier counterparts [Figure6].
6
26
6 9
38
6
12
44
22
0
10
20
30
40
50
60
diabetes hypertension depression
Pe
rce
nt
High income: > $75,000
Medium income: $35,000 - $75,000
Low income: < $35,000
Washington Behavioral Risk Factor Surveillance System, 2009-2011. Age - standardized

9 | P a g e
Health status indicators Many aspects of the built environment where we
live, work, and play, can affect both physical and
mental health outcomes. Poor housing conditions
are associated with:14
exposure to lead,
asthma triggers such as mold, moisture,
dust mites, and rodents
mental health stressors like violence and
social isolation
Poor mental health indicators including stress,
depression, and emotional problems are
associated with low-income. Recent studies
suggest a possible link between mental health
problems and asthma.15 It is well-documented
that people with lower income engage in less
physical activity and suffer from poorer health
outcomes than the general population.16 People from households with low-income are much more likely to report
having poor health than people with medium or high-incomes [Figure 7]. Those living in low-income households are also
more likely to be at risk for health problems related to lack of exercise. People who are in the low-income category are
almost twice as likely to have perceived poor mental health when compared to their wealthier counterparts [Figure 7].
Barriers to physical activity for low-income people vary depending on whether they live in urban, suburban, or rural
areas, or in places that are predominantly low-income.16
Sleep disturbance Allergens like pollen or mold that cause allergic
reactions, and dust mites that trigger nighttime
asthma symptoms, can play a role in sleep
problems.17 Sleep disturbances can impact
alertness of the affected persons on the
following day.18 Figure 8 suggests that as income
levels increase, the likelihood of disturbed sleep
due to asthma decreases. Low-income people
are more than three times as likely to report
having interrupted sleep everyday due to asthma
symptoms when compared to people in the
high-income category.
71
23
5 1
65
22
9 5
53
21 16
10
0
10
20
30
40
50
60
70
80
90
0 days 1-9 days 10-29 days Everyday
Pe
rce
nt
High income: > $75,000
Medium income: $35,000 - $75,000
Low income: < $35,000
Washington Behavioral Risk Factor Surveillance System, Asthma Call Back Surveys, 2006-2010. Age-standardized
13 15
19 19
24 21
39 45 46
0
10
20
30
40
50
60
Poor Health Poor mental health Limited activitiesP
erc
en
t
High income: > $75,000Medium income: $35,000 - $75,000Low income: < $35,000
Washington Behavioral Risk Factor Surveillance System, 2009-2011. Age-standardized
Figure 8. Sleep disturbance among adults due to current
asthma in the past 30 days by income
Figure 7. Prevalence of Health Status Indicators among
adults with current asthma by income

10 | P a g e
6 Risk Factors
Smoking and secondhand smoke Figure 9. Prevalence of smoking related risk factors among adults with current asthma by income
Research suggests that lower socioeconomic status (SES) is associated with smoking. More than 25 percent of low-income Washingtonians with asthma are current smokers, compared to just 6 percent of their high-income counterparts [Figure 9]. In addition to socioeconomic factors, smoking can add an increased risk of having poor asthma-related health and quality of life.19 Exposure to second-hand smoke can increase the frequency of asthma attacks and the severity of asthma. Exposure to second-hand smoke at home is more than three times higher among low-income adults with asthma than those in the high-income category [Figure 9]. Tobacco smoke is not the only factor that can affect asthma episodes. Asthma outcomes are socially patterned. Low SES populations are especially burdened by asthma due to higher exposures to indoor and outdoor asthma triggers such as cockroaches and urban pollution.19 Low-income communities are more likely to be located in areas with greater exposure to air pollution from traffic, industrial pollution, and other sources.20
6
4
17
10
26
15
0
5
10
15
20
25
30
35
40
Active Smoking Exposed to secondhand smoke
Pe
rce
nt
High income: > $75,000
Medium income: $35,000 - $75,000
Low income: < $35,000
Washington Behavioral Risk Factor Surveillance System, 2009-2011. Age-standardized

11 | P a g e
Indoor risk factors Figure 10. Presence of environmental triggers in households of adults with current asthma
On average, Americans spend up to 90 percent of their time indoors.21 Many indoor allergens and irritants can play a
significant role in worsening asthma symptoms.21 Studies show that 92 percent of homes contain high concentrations of
at least one allergen and 46 percent contain three or more allergens.22 Most people with asthma live in an indoor
environment where they have carpets or rugs in the bedroom and have pets inside the house [Figure 10]. Many people
also report using a wood stove or fireplace, and have smelled or seen mold in their home. All of these asthma triggers
are consistently present across all income categories. Mold is more common in low-income households. Exposure to
indoor allergens from dust mites, cockroaches, dogs, cats, rodents, mold, and fungi are among the most harmful asthma
triggers.23 Substandard housing can often worsen asthma symptoms because of the higher presence of moisture and
dampness, pest infestations, poorly maintained heating and ventilation systems, and dirty or deteriorated carpeting.22
Even if residents are conscientious about keeping their homes clean, triggers will reappear unless underlying factors like
fixing the source of water leaks and infestation are addressed.
77
70
10 6
31
83
70
16
4
29
79
69
20
8
23
0
10
20
30
40
50
60
70
80
90
Have carpet/rugs inbedroom
Have indoor pets Smelled or seenmold in home
Seen pests in home Use wood stove orfireplace
Pe
rce
nt
High income: > $75,000
Medium income: $35,000 - $75,000
Low income: < $35,000
Washington Behavioral Risk Factor Surveillance System, Asthma Call Back Surveys, 2006-2010. Age-standardized
12 | P a g e
7 Health Management
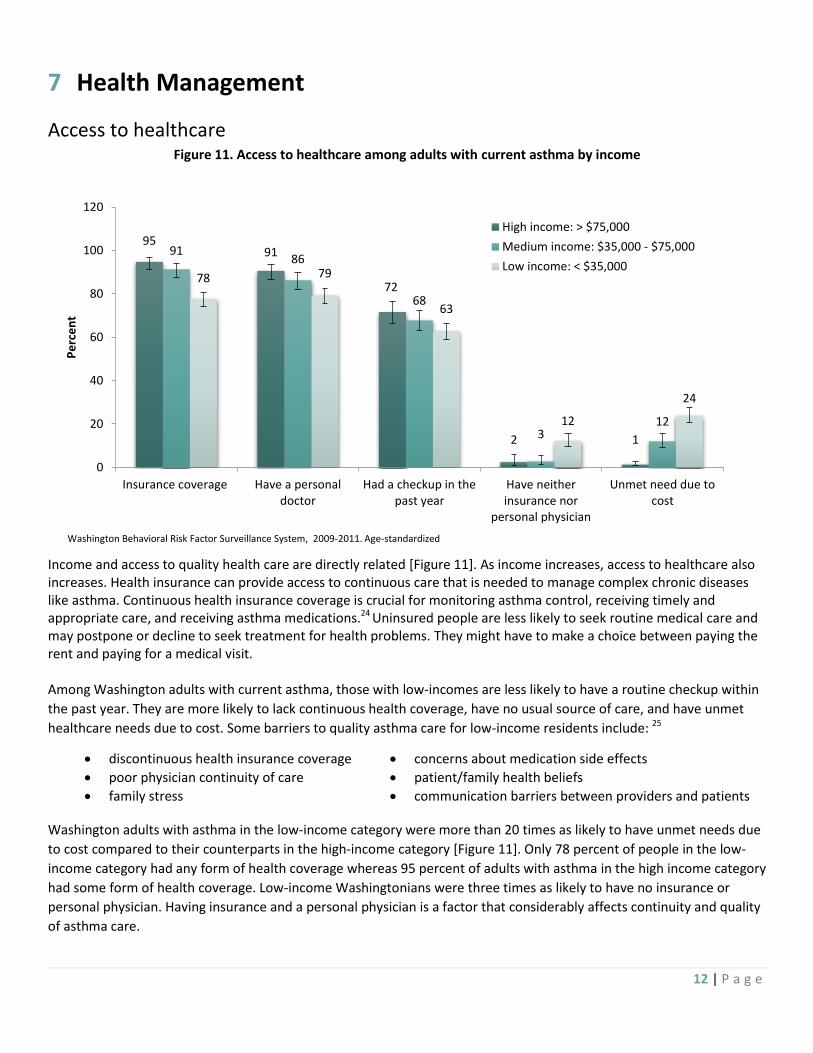
Access to healthcare Income and access to quality health care are directly related [Figure 11]. As income increases, access to healthcare also increases. Health insurance can provide access to continuous care that is needed to manage complex chronic diseases like asthma. Continuous health insurance coverage is crucial for monitoring asthma control, receiving timely and appropriate care, and receiving asthma medications.24 Uninsured people are less likely to seek routine medical care and may postpone or decline to seek treatment for health problems. They might have to make a choice between paying the rent and paying for a medical visit. Among Washington adults with current asthma, those with low-incomes are less likely to have a routine checkup within
the past year. They are more likely to lack continuous health coverage, have no usual source of care, and have unmet
healthcare needs due to cost. Some barriers to quality asthma care for low-income residents include: 25
discontinuous health insurance coverage concerns about medication side effects
poor physician continuity of care patient/family health beliefs
family stress communication barriers between providers and patients
Washington adults with asthma in the low-income category were more than 20 times as likely to have unmet needs due
to cost compared to their counterparts in the high-income category [Figure 11]. Only 78 percent of people in the low-
income category had any form of health coverage whereas 95 percent of adults with asthma in the high income category
had some form of health coverage. Low-income Washingtonians were three times as likely to have no insurance or
personal physician. Having insurance and a personal physician is a factor that considerably affects continuity and quality
of asthma care.
Figure 11. Access to healthcare among adults with current asthma by income
95 91
72
2 1
91 86
68
3 12
78 79
63
12
24
0
20
40
60
80
100
120
Insurance coverage Have a personaldoctor
Had a checkup in thepast year
Have neitherinsurance nor
personal physician
Unmet need due tocost
Pe
rce
nt
High income: > $75,000
Medium income: $35,000 - $75,000
Low income: < $35,000
Washington Behavioral Risk Factor Surveillance System, 2009-2011. Age-standardized

13 | P a g e
8 Preventive health
Pneumococcal vaccines Figure 12 suggests that there is no clear trend
for pneumococcal vaccines among adults who
are less than 65 years of age with asthma in
Washington State. Among seniors (65 or
older) with asthma, it seems like those in the
low-income category are slightly more likely
to receive the recommended pneumonia
vaccine when compared to seniors in the
high-income category. However, there is no
detectable difference between these two
income categories. On an average, nearly
nine out of ten seniors with asthma get the
recommended vaccine in Washington State.
Flu shots High-income adults with asthma are more likely
to get the recommended yearly flu shot than
low-income adults with asthma [Figure 13].
Possible explanations for this finding could be
the cost associated with these shots or low-
income adults having less access to sites or
centers that vaccinate.
People in the high-income category may feel
they have enough money to get the flu shot
every year, while those with a low-income may
see it as an expense they cannot afford.
Children through age 18 are eligible to receive
free vaccines under a federally-funded
entitlement program called Vaccines for
Children (VFC).26 No such program exists for
adults. Gaps in insurance coverage, coupled
with a lack of routine doctor visits have led to
lower immunization rates among low-income
Americans over the age of 18.26
Figure 12. Prevalence of pneumococcal vaccines among adults
with current asthma by income
37
81
32
84
43
90
0
10
20
30
40
50
60
70
80
90
100
Age 18-64 Age 65+
Pe
rce
nt
High income: > $75,000Medium income: $35,000 - $75,000Low income: < $35,000
Washington Behavioral Risk Factor Surveillance System, 2009-2011
54
49
44
0
10
20
30
40
50
60
70
Flu shot
Pe
rce
nt
High income: > $75,000
Medium income: $35,000 - $75,000
Low income: < $35,000
Washington Behavioral Risk Factor Surveillance System, 2009-2011. Age-standardized
Figure 13. Prevalence of flu vaccine among adults with current
asthma by income
14 | P a g e
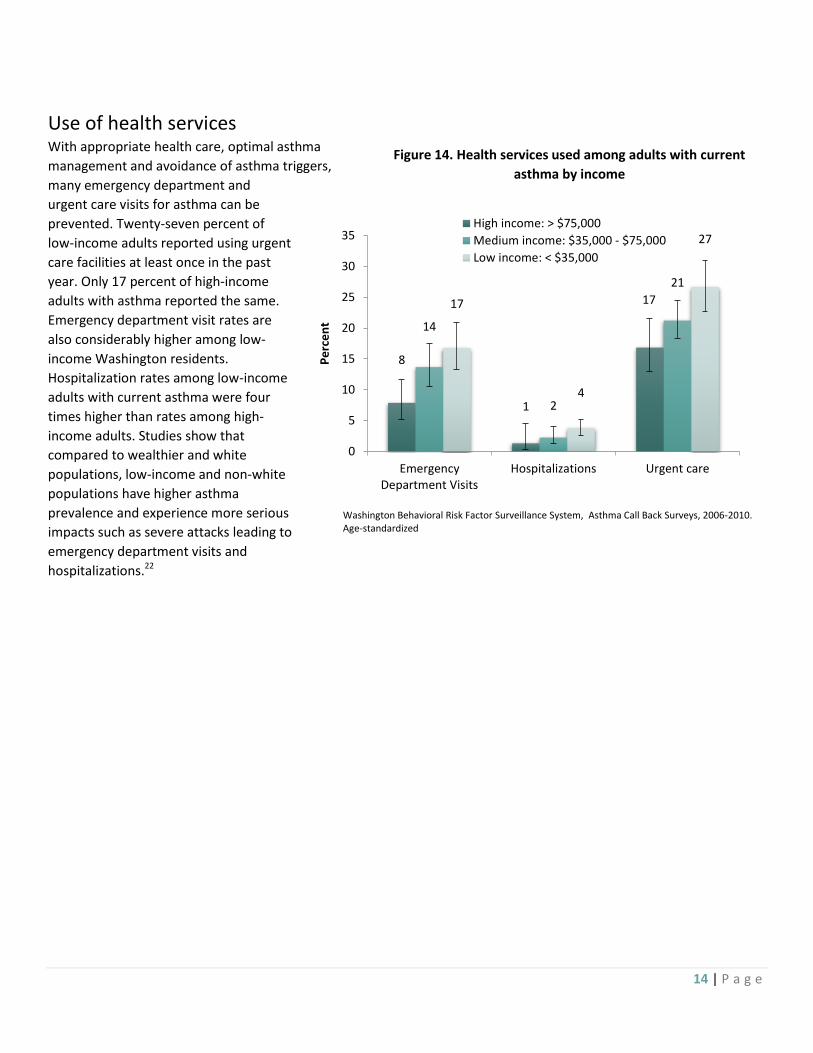
Use of health services With appropriate health care, optimal asthma
management and avoidance of asthma triggers,
many emergency department and
urgent care visits for asthma can be
prevented. Twenty-seven percent of
low-income adults reported using urgent
care facilities at least once in the past
year. Only 17 percent of high-income
adults with asthma reported the same.
Emergency department visit rates are
also considerably higher among low-
income Washington residents.
Hospitalization rates among low-income
adults with current asthma were four
times higher than rates among high-
income adults. Studies show that
compared to wealthier and white
populations, low-income and non-white
populations have higher asthma
prevalence and experience more serious
impacts such as severe attacks leading to
emergency department visits and
hospitalizations.22
8
1
17
14
2
21
17
4
27
0
5
10
15
20
25
30
35
EmergencyDepartment Visits
Hospitalizations Urgent care
Pe
rce
nt
High income: > $75,000
Medium income: $35,000 - $75,000
Low income: < $35,000
Washington Behavioral Risk Factor Surveillance System, Asthma Call Back Surveys, 2006-2010. Age-standardized
Figure 14. Health services used among adults with current
asthma by income
15 | P a g e
9 Work-related asthma
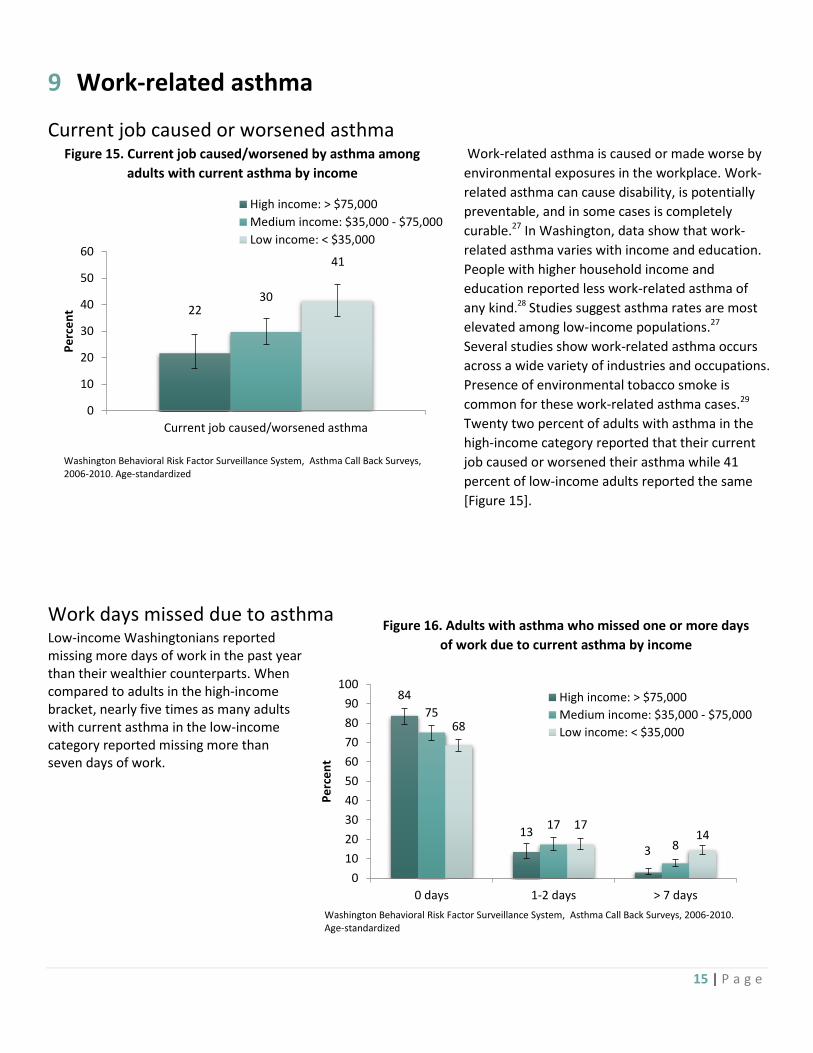
Current job caused or worsened asthma Work-related asthma is caused or made worse by
environmental exposures in the workplace. Work-
related asthma can cause disability, is potentially
preventable, and in some cases is completely
curable.27 In Washington, data show that work-
related asthma varies with income and education.
People with higher household income and
education reported less work-related asthma of
any kind.28
Studies suggest asthma rates are most
elevated among low-income populations.27
Several studies show work-related asthma occurs
across a wide variety of industries and occupations.
Presence of environmental tobacco smoke is
common for these work-related asthma cases.29
Twenty two percent of adults with asthma in the
high-income category reported that their current
job caused or worsened their asthma while 41
percent of low-income adults reported the same
[Figure 15].
Work days missed due to asthma Low-income Washingtonians reported missing more days of work in the past year than their wealthier counterparts. When compared to adults in the high-income bracket, nearly five times as many adults with current asthma in the low-income category reported missing more than seven days of work.
22 30
41
0
10
20
30
40
50
60
Current job caused/worsened asthma
Pe
rce
nt
High income: > $75,000
Medium income: $35,000 - $75,000
Low income: < $35,000
Washington Behavioral Risk Factor Surveillance System, Asthma Call Back Surveys, 2006-2010. Age-standardized
84
13
3
75
17
8
68
17 14
0
10
20
30
40
50
60
70
80
90
100
0 days 1-2 days > 7 days
Pe
rce
nt
High income: > $75,000
Medium income: $35,000 - $75,000
Low income: < $35,000
Washington Behavioral Risk Factor Surveillance System, Asthma Call Back Surveys, 2006-2010. Age-standardized
Figure 15. Current job caused/worsened by asthma among
adults with current asthma by income
Figure 16. Adults with asthma who missed one or more days
of work due to current asthma by income

16 | P a g e
10 Self-management
Asthma education
Individualized, written asthma action plans play a crucial role in helping people with asthma identify and respond to
worsening asthma symptoms, reduce exposure to environmental triggers, and use medications properly to control
asthma. Since asthma action plans are created for the patient in partnership with the healthcare provider, they can be
the foundation for patients to control their asthma. Asthma action plans have been shown to improve patient outcomes
by reducing emergency department visits and improving control of asthma symptoms. These individualized plans are a
recommended component of quality asthma care. The majority of people in all income categories who have asthma
report that they have received training in recognizing early signs of an asthma episode and have received information
about what to do during an asthma attack [Figure 17]. However, fewer people report having a written asthma plan. Less
than 10 percent of adults with asthma in all income categories reported taking an asthma management class which
indicates that asthma education among Washingtonians could be fairly low [Figure 17].
61
77
40
21
49
6
65
79
37
23
42
8
60
70
43
24
41
9
0
10
20
30
40
50
60
70
80
90
Receivedexplanation on
how to recognizeearly signs of
asthma episode
Receivedinformation on
what to do duringan attack
Taught how to usea peak flow meter
Given a writtenasthma action plan
Advised to changeenvironment toimprove asthma
Taken an asthmamanagement class
Pe
rce
nta
ge r
ece
ivin
g In
form
atio
n
High income: > $75,000
Medium income: $35,000 - $75,000
Low income: < $35,000
Washington Behavioral Risk Factor Surveillance System, Asthma Call Back Surveys, 2006-2010. Age-standardized
Figure 17. Distribution of asthma self-management and education among adults with
current asthma by income

17 | P a g e
11 Cost of inequity
Asthma inequities by income in Washington State create an unnecessary health burden, both in quality of life, and
monetary cost. If the high-income group represents the level of health that should be achieved by all, then an estimated
74,000 excess cases of asthma can be attributed to inequity by income [Table 1]. Similarly, disparities in asthma control
and severity account for around 28,000 excess emergency room visits, 32,000 excess urgent care visits, and 7,000 excess
hospitalizations per year. These estimates are probably lower than the actual number, because they do not account for
multiple visits in a year by the same patient.
Lack of available data in Washington State makes it difficult to precisely estimate actual costs. However, by examining
hospital charges in Washington, and emergency department data from Florida30 where hospital charges are comparable
to Washington State, we can make a reasonable estimate of the extent of the financial inequity. In Washington State,
the average charge for each hospitalization with asthma listed as the primary diagnosis is $17,322. Total charges for
excess asthma hospitalizations are around $118 million per year. The average charge per emergency room visit with
asthma listed as the primary diagnosis in Florida was $1,618. If emergency room charges in Washington State are
comparable, the total charge for excess emergency department visits is $46 million per year.
Table 1. Excess burden of asthma created by disparities in asthma by income in Washington State
Income Percent of adults with Asthma
2011 WA State Population age 18+ (OFM, ACS)
Estimated Number of Adults with
Asthma
Projected Number of
Adults affected*
Excess Cases
< $35,000 13.4 857,333 162,029 93,301 68,728
$35,000 to $74,999
8.0 2,554,620 131,442 125,930 5,512
$75,000 + 7.7 2,345,758 180,605 180,605 0
Total 5,757,712 474,076 399,836 74,240
*Projected number of adults with asthma is based on all adults reporting 7.7 percent regardless of income level. This is the current rate for high-
income adults.

18 | P a g e
12 Recommendations and Interventions
Life disruptions caused by asthma can be avoided if asthma is effectively controlled. Asthma exacerbations and attacks
can be prevented through appropriate medical care and disease management. However, low-income Washington adults
are less likely to achieve optimal control and management of asthma. They are more likely to miss work, suffer from
frequent symptoms, visit the emergency department and/or be hospitalized. These health inequities can be addressed
by increasing access to and coordination of care and reducing exposure to asthma triggers. To do this, focus should be
on creating or changing policies, environments, and systems of care to better support people with asthma, especially
those who are at most risk.20
Recommendations:20, 31 Improve living environments for Washington residents with asthma
All people with asthma in Washington should live in healthy homes and communities that support effective self-management and reduce exposure to asthma triggers. People in low-income communities are often exposed to environmental asthma triggers. Poor housing conditions and proximity to roadways lead to higher exposure to pollutants that can worsen asthma. Exposure to wood smoke and fine particulate matter is also a threat to many low socioeconomic populations living in Washington. Community-based strategies should focus on changing built environments for those who are most at risk.
Expand health care coverage for low-income Washington residents
All people with asthma deserve quality care that meets national standards. People who have gaps in insurance coverage, or who are unable to pay for asthma medications or care are significantly more likely to have poorly controlled asthma. In addition, ongoing, planned assessment and monitoring, appropriate prescription of medications, control of environmental triggers, and asthma education should be the standard of care for all Washington residents. The implementation of the Affordable Care Act is a step towards achieving this goal.
Assure quality of care for low-income Washington residents
All people with asthma in Washington should have access to, and receive, affordable, high-quality care. Good asthma care is proactive, coordinated, and culturally competent. Providers should work in partnership with patients to help them understand their asthma and learn skills to manage it. Efforts should be made to include a ‘health home’ approach to primary care. Health homes provide better ways to integrate clinical care with community resources. Patient-centered care in a health home responds to the unique needs, culture, preferences, and values of the patient.
Intervention Strategies:31 Policy and environmental changes are needed to support equal access to high-quality care for people with asthma in
Washington State, regardless of their income.
Community-based interventions The community plays an important role in supporting people with asthma by creating and maintaining healthy environments. Healthy communities include healthy worksites, schools and homes, as well as clean outdoor air.
Clinical Care The 2007 National Asthma Education and Prevention Program (NAEPP) guidelines for the diagnosis and management of asthma identifies four key components of evidence-based asthma care. These include:
1. Assessing and monitoring asthma severity and control 2. Education for partnership in care 3. Use of appropriate medications 4. Control of environmental triggers
19 | P a g e
13 Conclusion
This report reinforces the reality that asthma disparities exist in asthma prevalence among different racial ethnic groups,
level of education, and level of income. The report also highlights the social gradient of health inequalities, where
people with lower income have poorer health. Health inequalities arise from a complex interaction of many factors like
housing, income, education, and disability. Overall health for low-income Washington residents with asthma is much
worse than for high-income residents. This disadvantaged population has poorer mental health, smokes more, is
exposed to more secondhand smoke, and lives in communities that are exposed to greater air pollution. Many of the
low-income residents with asthma also do not have access to quality health care, and some have neither insurance nor a
primary care provider. This segment of the population invariably has a high need to use health services because of
limited to no routine healthcare. The cost of health inequality results in productivity losses. The direct cost to the
healthcare system increases significantly as well. These asthma inequalities are mostly preventable, and there is a strong
economic benefit for addressing them.
Some of the recommendations included in the report are:
Ongoing, planned assessment and monitoring, appropriate prescriptions of medications, control of
environmental triggers, and asthma education should be the standard of care for all Washington residents.
Providers should work in partnership with patients to help them understand their asthma and learn skills to
manage it. Efforts should be made to include a ‘Patient Centered Medical/Health Home’ approach to primary
care.
Community-based strategies should focus on changing built environments for those who are most at risk.
Asthma treatment will be more successful when Washington residents live in environments that make it easier to
breathe and live healthy, active lives.32 Together, public and private organizations can make changes to help people
where they live, learn, work, and play.

20 | P a g e
14 Appendix
Methods The Washington State Department of Health gathers data on Washington residents’ health and risk behaviors through multiple sources. The Asthma Program compiled data on asthma-related indicators and this report summarizes the surveillance findings using the most recent data available. We generally report the prevalence of asthma, defined as the percentage of people who have the condition at a single point in time. An in-depth discussion of methods used to determine statistical significance is described in The Burden of Asthma in Washington State: 2013 Update (Technical Notes, Appendix C-1).6
Adult asthma prevalence is monitored primarily by using the Behavioral Risk Factor Surveillance System (BRFSS), a national state-based survey sponsored by the Centers for Disease Control and Prevention (CDC). To understand the scope of the disease, two survey questions are used to define lifetime asthma and current asthma.
Lifetime asthma is when the adult or youth has ever been told by a doctor, nurse, or other health professional they have asthma.
Current asthma is when the adult or youth has ever been told they have asthma AND they still have asthma at the time they took the survey.
For most of the analysis presented here, current asthma is used to describe the burden of the disease. There are many overlapping individual and environmental influences that contribute to asthma. Any reference to differences between groups implies that the differences are statistically detectable unless otherwise stated. We used the following conventions to describe population subgroups:
All Adults – defined as non-institutionalized adults who reside in Washington State and do not live in group quarters (i.e., nursing homes, military barracks, hospitals, correctional facilities, etc.).
Adults– adults are age 18 or older.
Small population sizes and limited resources for data gathering make it difficult to accurately identify asthma rates and related indicators among American Indian/Alaska Native (AI/AN). In general, there are gaps in information for some racial and ethnic minorities living in Washington. Gaps can relate to insufficient data to produce reliable estimates or, when estimates are possible, inadequate power to detect differences between groups. This can limit our ability to identify the current state of disparities for some groups. To provide sufficient sample size for analysis we combined 2009-2011 BRFSS and 2006-2010 BRFSS Asthma Callback Survey data for the adult population.
Charges are the total undiscounted amount that a facility bills for all care and services provided. Charges differ both from costs, and from the amount received by a hospital for services provided. Determination of costs requires additional special analyses of resource consumption and likely varies by hospital. In addition, hospital costs and payments received may reflect provider price shifting and other factors (such as negotiated discounts, bad debt, and charitable care) and are often lower than charges.
American Indian/Alaska Native (AI/AN) populations encompass numerous tribal nations. Grouping all AI/AN into a single category may mask differences among subgroups. The data describes asthma for the overall AI/AN population in Washington and may not reflect differences among diverse subgroups in this population.
Data Sources Behavioral Risk Factor Surveillance System The Behavioral Risk Factor Surveillance System (BRFSS) is a statewide random-digit-dialing telephone survey coordinated by the Centers for Disease Control & Prevention (CDC) and conducted in all 50 states. Interviews were conducted on a monthly basis throughout the year. For this report, responses were combined by calendar year, and weighted to be representative of the adult population of Washington. Adult asthma prevalence was based on whether a respondent reported current asthma.
BRFSS, Asthma Callback Surveys (ACBS) The ACBS is an in-depth asthma survey conducted approximately two weeks after the Behavioral Risk Factor Surveillance Survey (BRFSS). BRFSS respondents who report ever being diagnosed with asthma are eligible for the asthma callback. The ACBS addresses critical questions surrounding the health and experiences of persons with asthma. Through the callback, the Washington Asthma Program collects detailed information on topics such as healthcare utilization, knowledge of asthma, asthma management, asthma medications, environmental factors, costs, co-morbid conditions, work related asthma, and complementary and alternative medicines. Learn more at: www.cdc.gov/asthma/ACBS.htm
Asthma Hospitalization (Charges) Asthma hospitalization charges were obtained through the DOH Comprehensive Hospital Abstract Reporting System (CHARS). CHARS include data from all inpatient stays for all patients treated in state-licensed acute care hospitals in Washington. CHARS does not include

21 | P a g e
hospitalizations in U.S. military hospitals, U.S. veterans’’ administration hospitals, or Washington State psychiatric hospitals. The first diagnosis field is considered to be the principal reason the patient was admitted to the hospital. For further information on CHARS, please refer to: Washington State Department of Health, Center for Health Statistics, Hospital Data: http://www.doh.wa.gov/ehsphl/hospdata/
Technical Notes
BRFSS 2009-2011
Beginning in 2011, BRFSS adopted a new weighting methodology, and began including data from cell phone respondents. The changes should result in estimates of health and health behaviors that more accurately represent the Washington State population. Due to these changes, health estimates from 2011 and beyond cannot be compared directly to those from 2010 and earlier. In anticipation of the change, Washington State collected a limited sample of cell phone data in 2009 and 2010. Washington State Center for Health Statistics created weights for 2009 and 2010 BRFSS using the new methodology. This enables the Department combine 2009, 2010, and 2011 BRFSS for analysis of health disparities. For more information, refer to this document.
Hospitalization charges Hospital charge data are from the DOH Comprehensive Hospital Abstract Reporting System (CHARS). Charges are the total undiscounted amount that a facility bills for all care and services provided. Charges differ both from costs, and from the amount received by a hospital for services provided. Determination of costs requires additional special analyses of resource consumption and likely varies by hospital. In addition, hospital costs and payments received may reflect provider price shifting and other factors (such as negotiated discounts, bad debt, and charitable care) and are often lower than charges.
Issues related to reported race/ethnicity The determination of race when more than one race is reported follows decision rules established by the National Center for Health Statistics. In most cases, the first race given is assigned as the person’s race
Reporting of race/Hispanic origin on death certificates is sometimes based on observing the decedent rather than questioning the next of kin. This procedure causes an underestimate of deaths for certain groups, particularly Native Americans, some of the Asian subgroups, and Hispanics. Thus, death rates based on death certificate data are lower than true death rates for these groups. Learn more at: http://www.doh.wa.gov/DataandStatisticalReports/VitalStatisticsData/DeathData.aspx
22 | P a g e
Glossary Health disparity: Differences in health status among distinct segments of the population including differences that occur by gender, race or
ethnicity, education or income, disability, or living in various geographic localities.
Health inequity: Disparities in health (or health care) that are systemic and avoidable and, therefore, considered unfair or unjust.
Age-adjustment – A method to standardize populations with different age distributions and allows for comparisons over time; also known
as age-standardization. This is particularly important for age-related diseases. Unless otherwise indicated, all age-adjusted rates in this
document have been adjusted to the 2000 U.S. standard population.
Confidence interval (CI) – An indication of a measurement’s precision with a narrow confidence interval indicating high precision and a
wide confidence interval indicating low precision. This is sometimes called the “margin of error.”
Current asthma – When a survey respondent reports that they have ever been told they have asthma AND they still have asthma at the
time they took the survey.
Federal Poverty Level (FPL) – A general term which refers to the federal poverty guidelines, an income level based on the number of
people in a family unit. The poverty threshold is calculated annually by the Health and Human Services for administrative purposes, such as
determining financial eligibility for federal programs. In this report FPL is defined as people who are above 200 percent FPL, 100-200
percent FPL (near poor), or below FPL (poor).
Lifetime asthma – When survey respondents report they have ever been told by a doctor, nurse, or other health professional they have
asthma.
Prevalence – The percentage of a defined population with a disease at a given time.
Risk factor – A personal habit or characteristic, clinical condition, or environmental exposure that is associated with an increased
probability or severity of disease.
Secondhand smoke exposure – Inhalation of air containing tobacco smoke from someone else smoking. Also known as environmental
tobacco smoke.
Adult – smoking occurring in the home in the past 30 days.
Adult Call back –smoking inside the home in the past 7 days.
Statistically detectable – An observed difference between two populations is determined to be statistically detectable (significant) if it is
unlikely to have occurred randomly or by chance. If there is more than a 5 percent probability that the differences we see are due to
chance, we say that there is no statistically detectable (or significant) difference.
Surveillance – The ongoing systematic collection, analysis, and interpretation of health data. Surveillance is essential to the planning,
implementation, and evaluation of public health practice.
Tobacco use – Adults that ever smoked at least 100 cigarettes in their lifetime and currently smoke every day or someday; Youth that
smoked a cigarette in the past 30 days
Trigger – A risk factor that causes exacerbations of asthma. Triggers are secondhand smoke, exercise, mold, pet dander, etc.

23 | P a g e
15 References 1Corvalan, C., Amigo, H., Bustos, P., & Rona, R. (2005). Socioeconomic risk factors for Asthma in Chilean Young Adults. American Journal of Public Health, 95(8), 1375-81. Available online at: http://www.ncbi.nlm.nih.gov/pmc/articles/PMC1449369/ 2Berman, B., Wong, G., Bastani, R., & Hoang, T. (2003). Household smoking behavior and ETS exposure among children with asthma in low-income minority households. Addictive Behaviors, 28(1), 111-18. Available online at: http://www.ncbi.nlm.nih.gov/pubmed/12507531 3Data Source: Washington State Department of Health, Center for Health Statistics, Behavioral Risk Factor Surveillance System, supported in part by Centers for Disease Control and Prevention, Cooperative Agreement U58/CCU022819 and DP001996-1 4 Akinbami L, Moorman J, Liu X, et al. 2011. Asthma prevalence, health care use, and mortality: United States, 2005-2009. Natl Health Stat Report. 12;(32): 1-14. Available online at: http://www.ncbi.nlm.nih.gov/pubmed/21355352 5 Kynyk JA, Mastronarde JG, and McCallister JW. Asthma, the sex difference. Curr Opin Pulm Med. 2011;17(1):6-11. 6 Melgert BN, Ray A, Hylkema MN, Timens W, and Postma DS. Are there reasons why adult asthma is more common in females? Curr Allergy Asthma Rep. 2007;7(2):143-50. 7Milet M, Lutzker L, Flattery J. Asthma in California: A Surveillance Report. Richmond, CA: California Department of Public Health, Environmental Health Investigations Branch, May 2013. 8Tran N, Aldrich L and McDermot D. The Burden of Asthma in Washington State: 2013 Update. Washington State Department of Health, Feb 2013. 9 O’Donnell, O, E van Doorslaer, A Wagstaff, and M Lindelow. Analyzing Health Equity Using Household Survey Data: A Guide to Techniques and Their Implementation. Washington D.C: World Bank Institute, Web. Available online at: http://siteresources.worldbank.org/INTPAH/Resources/Publications/459843-1195594469249/HealthEquityFINAL.pdf 10 Choi, W. J., Um, I. Y., & Hong, S., et. al (2012). Association between household income and asthma symptoms among elementary school children in Seoul. Environmental Health and Toxicology, 27. Available online at: http://www.ncbi.nlm.nih.gov/pmc/articles/PMC3524452/pdf/eht-27-e2012020.pdf 11 Traore EA. “Chapter 3: Asthma Risk Factors and Co-Morbidities”. Asthma Burden Report - New Hampshire 2010. New Hampshire Department of Health and Human Services, Division of Public Health Services, Asthma Control Program. June, 2010. Available online at: http://www.dhhs.nh.gov/dphs/cdpc/asthma/documents/chapter3.pdf 12 Kewalramani, A., Bollinger, M., & Postolache, T. (2008). Asthma and mood disorders. International Journal of Child Health and Human Development, 1(2), 115–123. Available online at: http://www.ncbi.nlm.nih.gov/pmc/articles/PMC2631932/pdf/nihms85346.pdf 13 Bandiera, F., Pereira, D., & Arif, A. (2008). Race/ethnicity, income, chronic asthma, and mental health. Psychosomatic Medicine: Journal of Bio-behavioral Medicine, 77, 77-84. Retrieved from: http://www.psychosomaticmedicine.org/content/70/1/77.full.pdf%20html 14 Hood, E. (2005). Dwelling disparities: How poor housing leads to poor health. Environmental Health Perspectives, 113(5), A310–A317. Available online at: http://www.ncbi.nlm.nih.gov/pmc/articles/PMC1257572/ 15 Chun, T., Weitzen, S., & Fritz, G. (2008. The asthma/mental health nexus in a population-based sample of the United States. Chest, 134(6), 1176-1182. Available online at: http://journal.publications.chestnet.org/article.aspx?articleid=1086154 16Low-income Populations and Physical Activity: An overview of issues related to active living. Active Living by Design -The Robert Wood Johnson Foundation. UNC School of Public Health. Available online at: http://www.bms.com/Documents/together_on_diabetes/2012-Summit-Atlanta/Physical-Activity-for-Low-Income-Populations-The-Health-Trust.pdf 17 Phillips, B. Asthma and sleep. National Sleep Foundation. Available online at: http://www.sleepfoundation.org/article/sleep-topics/asthma-and-sleep

24 | P a g e
18 Sleep matters: Getting a good night’s sleep with asthma and allergies. (2009, February 4). Allergy & Asthma Network: Mothers of Asthmatics Available online at: http://www.aanma.org/2009/02/sleep-matters-getting-a-good-night’s-sleep-with-asthma-and-allergies/ 19 Jackson, T., Roberts, C., & Pearlman, D. Rhode Island Department of Health. Adults with asthma who smoke – a neglected population? Available online at: http://www.rimed.org/medhealthri/2011-10/2011-10-306.pdf 20 Wolstein, J., Meng, Y., & Babey, S. UCLA Center for Health Policy Research, December, 2010. Income disparities in asthma burden and care in California. 21 Adams, M. "Allergens prevalent in low-income housing can trigger childhood asthma." Natural News, 6 Mar 2005. Web. Available online at: http://www.naturalnews.com/005269.html 22 Krieger, J. (2010). Home is where the triggers are: Increasing asthma control by improving the home environment. Pediatric Allergy, Immunology, and Pulmonology, 23(2), 139–145. Available online at: http://www.ncbi.nlm.nih.gov/pmc/articles/PMC3281289/ 23 US Department of Health and Human Services, National Institute of Environmental Health Sciences. (2006). Asthma and its environmental triggers. Available online at: http://www.niehs.nih.gov/health/assets/docs_a_e/asthma_and_its_environmental_triggers_.pdf 24 Disparities in Risk. Alliance for healthy homes: Working for Affordable healthy housing for All. Available online at: http://www.afhh.org/chil_ar/chil_ar_disparities.htm 25 Randall, B., Bratton, S., Cabana, M., Kaciroti, N., & Clark, N. (2004). Physician asthma education program improves outcomes for children of low-income families. Chest, 126(2), 369-374. Available online at: http://journal.publications.chestnet.org/article.aspx?articleid=1082706 26 GSK offers free vaccines for low-income adults without insurance coverage. (2010, March 29). Medical News. Available online at: http://www.news-medical.net/news/20100329/GSK-offers-free-vaccines-for-low-income-adults-without-insurance-coverage.aspx 27 Friedman-Jimenez, G. (2013, July). Occupation and asthma in an urban low-income population. Available online at: http://clinicaltrials.gov/show/NCT00014820 28 Anderson, N., Reeb-Whitaker, C., & Bonauto, D. Washington State Department of Labor and Industries, (2010). Work-related Asthma in Washington state: A summary of SHARP’s asthma surveillance data from 2001-2008 (64-13-2010) 29 Krantz, A. Stroger Hospital of Cook County. December, 2010. Work Exposures and Work-related Asthma in Low-Income Asthma Patients. Available online at: http://www.chicagoasthma.org/site/files/410/107080/368163/515491/4_Krantz_Work-Related_Asthma_in_a_Low_Income_Asthm 30 Forrest, J., Dudley, J., & Blackmore, C. Florida Department of Health, Florida Asthma Prevention and Control Program (2012). Exploring the financial burden of asthma in Florida: Charges associated with asthma emergency department visits and hospitalizations. Available online at: http://www.doh.state.fl.us/Environment/medicine/Asthma/FinancialBurdenReport.pdf
31 Washington State Department of Health. Health of Washington State – Asthma chapter. Updated June,2012. Available online at
http://www.doh.wa.gov/Portals/1/Documents/5500/CD-AST2012.pdf
32 Washington State Asthma Plan 2011-2015 by the WA State Department of Health and the WA Asthma Initiative, May 2011. Available online at: http://www.doh.wa.gov/cfh/asthma/data/state-plan/default.htm
For people with disabilities, this document is available in other formats. To submit a request,
please call 1-800-525-0127 (TDD/TTY call 711).