associations between maternal body composition and...
TRANSCRIPT
nutrients
Article
Associations between Maternal Body Compositionand Appetite Hormones and Macronutrients inHuman Milk
Sambavi Kugananthan 1,2,†, Zoya Gridneva 2,*,†, Ching T. Lai 2, Anna R. Hepworth 2,Peter J. Mark 1, Foteini Kakulas 2 and Donna T. Geddes 2
1 School of Human Sciences, The University of Western Australia, Crawley WA 6009, Australia;[email protected] (S.K.); [email protected] (P.J.M.)
2 School of Molecular Sciences, The University of Western Australia, Crawley WA 6009, Australia;[email protected] (C.T.L.); [email protected] (A.R.H.); [email protected] (F.K.);[email protected] (D.T.G.)
* Correspondence: [email protected]; Tel.: +61-8-6488-4427† These authors contribute equally to this work.
Received: 25 January 2017; Accepted: 7 March 2017; Published: 9 March 2017
Abstract: Human milk (HM) appetite hormones and macronutrients may mediate satiety in breastfedinfants. This study investigated associations between maternal adiposity and concentrations ofHM leptin, adiponectin, protein and lactose, and whether these concentrations and the relationshipbetween body mass index and percentage fat mass (%FM) in a breastfeeding population change overthe first year of lactation. Lactating women (n = 59) provided milk samples (n = 283) at the 2nd, 5th,9th and/or 12th month of lactation. Concentrations of leptin, adiponectin, total protein and lactosewere measured. Maternal %FM was measured using bioimpedance spectroscopy. Higher maternal%FM was associated with higher leptin concentrations in both whole (0.006 ± 0.002 ng/mL, p = 0.008)and skim HM (0.005 ± 0.002 ng/mL, p = 0.007), and protein (0.16 ± 0.07 g/L, p = 0.028) concentrations.Adiponectin and lactose concentrations were not associated with %FM (0.01 ± 0.06 ng/mL, p = 0.81;0.08 ± 0.11 g/L, p = 0.48, respectively). Whole milk concentrations of adiponectin and leptin did notdiffer significantly over the first year of lactation. These findings suggest that the level of maternaladiposity during lactation may influence the early appetite programming of breastfed infants bymodulating concentrations of HM components.
Keywords: leptin; adiponectin; maternal body composition; percentage fat mass; lactation; humanmilk; breastfeeding; appetite hormones; macronutrients; protein; lactose
1. Introduction
Human milk (HM) is the optimal nutrition for term infants as it contains a uniquely balancedprofile of macronutrients along with micronutrients, hormones, antibodies, bioactive molecules [1] andcells [2,3], which adequately support the nutritional needs, appropriate growth, immunoprotection andphysiological development of the infant [4,5]. It is well documented that prolonged breastfeeding isassociated with decreased prevalence of overweight and obesity across the life course [6,7]. Enhancedappetite control in adults who have been breastfed as infants has been partly attributed to regulatoryappetite hormones present in HM [8–10], which include leptin and adiponectin [8,11]. In rat pups,acute or chronic administration of leptin by intraperitoneal injection has been shown not to reducefood consumption but to modulate the expression of neuropeptides and receptors involved in theregulation of feeding behaviour (neuropeptide Y (NPY) and proopiomelanocortin (POMC)) [12], whilein mice pups leptin deficiency caused profound disruptions in the development of the projections of
Nutrients 2017, 9, 252; doi:10.3390/nu9030252 www.mdpi.com/journal/nutrients
Nutrients 2017, 9, 252 2 of 18
the arcuate nucleus of the hypothalamus [13]. These findings indicate that leptin plays a neurotrophicrole and contributes to the developmental programming of the hypothalamic appetite circuitry duringthe neonatal period, preceding leptin’s acute regulation of food intake in adults. Adiponectin hasanti-inflammatory properties and improves both fatty acid metabolism and sensitivity to insulin [14].In mice, adiponectin inhibits tension-sensitive gastric vagal afferent mechanosensitivity, modulatingsatiety signals in both lean and obese animals, while simultaneously increasing the mechanosensitivityof mucosal gastric vagal afferent in an obesity-induced model [15].
Additionally, the concentration of macronutrients in HM, namely protein, fat and lactose, mayalso be involved in regulation of the infant appetite control [9,16]. Differences in the concentrationsof these factors may partly explain the variability in breastfeeding patterns observed in infants whofeed on demand [17]. As such, an understanding of the factors that affect concentrations of appetitehormones and macronutrients in HM is critical, as it presents a unique opportunity for the preventionof unfavourable early developmental programming and subsequent obesity.
Leptin is secreted into the maternal circulation by white adipocytes and is subsequentlytransferred into the mammary ductal system via diffusion or a receptor-mediated transportmechanism [18]. Leptin is also contributed by lactocytes [19,20]. Previous studies have identifieda positive correlation between maternal body mass index (BMI) and both maternal serum [21,22]and skim HM leptin [21–24], despite differing methodologies in leptin measurement [25]. However,no consistent relationship between maternal adiposity and HM leptin concentrations has been shownacross lactation, with Miralles et al. (2006) reporting only moderate correlations between maternal BMIand HM leptin during the first 6 months of lactation (R = 0.387; p < 0.01) [8], while Bronsky et al. (2011)saw no consistent relationship over the first 12 months of lactation [11], despite utilizing a similarleptin measurement methodology.
There are a number of factors that may contribute to these conflicting findings. BMI is a poormeasure of adiposity, as it fails to adequately differentiate between adipose tissue and lean bodymass [26,27]. Investigations between the relationship of maternal BMI and leptin have been conductedpredominantly in skim HM, which excludes the fat and cellular components of HM [21,24]. Further,leptin concentrations have been shown to be higher in whole HM compared to skim HM [20,23,28].
In contrast, maternal serum concentrations of adiponectin are lower if weight and BMIare higher [29,30]. Results associating maternal BMI and adiponectin concentrations in HMare conflicting [25], with several studies showing no associations [11,31,32] and two studiescounter-intuitively reporting a positive association [33,34]. As with leptin, use of BMI as a measureof maternal adiposity may contribute to these conflicting findings. Also, both increasing [11,35]and decreasing [30,33,36] trends in adiponectin concentrations across the lactation period havebeen reported.
Similar to its effects on appetite hormones, it is postulated that maternal adiposity influencesmacronutrient concentrations in HM. Again, results are conflicting. Excessive adipose tissue storage hasbeen shown to impair amino acid and monosaccharide metabolism and transport [37,38], yet increasedserum amino acid levels were found in mothers with more adipose tissue [39]. In lactating women,higher concentrations of HM protein were associated with lower BMI in one study [40], yet withhigher BMI [41] and higher adiposity [42] in others. BMI also was found to associate positively withconcentration of HM galactose [41]. There is a possibility that the effect of maternal body composition(BC) only becomes evident in late but not early lactation, when the fat accumulated during pregnancyis depleted [42]. More precise measurements of maternal adiposity across the lactation period areneeded to elucidate effects on HM composition.
This study investigated relationships between maternal adiposity and HM leptin, adiponectin,total protein and lactose. Further, it investigated the relationship between percentage fat mass (%FM)and BMI, and the change in maternal adiposity and component concentrations over the first yearof lactation.
Nutrients 2017, 9, 252 3 of 18
2. Materials and Methods
2.1. Study Participants
Fifty-nine predominantly Caucasian, English-speaking, breastfeeding mothers were recruited viathe Australian Breastfeeding Association (ABA) and through external networking. Inclusion criteriawere: healthy singletons, gestational age ≥37 weeks, fully breastfed at 2 and/or 5 months [43] andmaternal intention to breastfeed until 12 months. The exclusion criterion was: maternal smoking.Participants were recruited during their 2nd, 5th, 9th and 12th month of lactation and invited to comeback at any subsequent time points. Twenty-one participants contributed samples at two or more timepoints. All participants provided informed written consent and answered a secure online questionnairethat was administered and securely stored at the university. This study was approved by the HumanResearch Ethics Committee of The University of Western Australia (RA/4/1/4253) and registered withthe Australian New Zealand Clinical Trials Registry (ACTRN12616000368437).
2.2. Human Milk Sample Collection
HM samples were collected on site at our research laboratory at King Edward Memorial Hospitalfor Women (Subiaco, Perth, Australia). Pre-feed and post-feed milk samples (~5 mL each) wereobtained from the breast(s) the infant fed from by hand expression or with a breast pump and wereanalysed separately. Samples were collected between 9:30 and 11:30 a.m. to minimise possible circadianinfluences on the milk composition. Samples were stored at −20 ◦C for later biochemical analysis.
2.3. Anthropometry and Body Composition
Maternal weight was measured using an electronic scale (±0.1 kg; Seca, Chino, CA, USA). Heightwas self-reported by participants or measured against a calibrated marked wall (accuracy ± 0.1 cm).BMI was calculated as kg/m2.
Percentage fat mass (%FM) was measured with whole body bioimpedance (wrist to ankle) usingan ImpediMed SFB7 tetra-polar bioelectrical impedance analyser (Impedimed, Brisbane, Australia)with the participant in a supine position on a non-conductive surface according to the manufacturer’sinstructions. Before each session, the external calibration of the bioelectrical impendence analyser wastested with a calibration Test Cell (ImpediMed, Brisbane, Australia). Ten consecutive measurements of%FM were taken within 1–2 min and averaged. Within-participant coefficient of variation for maternal%FM was 0.21%. All measurements were made after the breastfeeding session.
2.4. Leptin and Adiponectin Measurements
Leptin concentrations in whole and skim HM were measured using the DuoSet Human Leptinenzyme-linked immunosorbent assay (ELISA) (R&D Systems, Minneapolis, MN, USA) as describedpreviously [28]. The detection limit was 0.05 ng/mL with a recovery of 96.3% ± 1.2% (n = 10) for skimmilk and 97.1% ± 9.1% (n = 10) for whole milk leptin and an inter-assay coefficient of variation (CV)of <7.2%.
Adiponectin was measured in whole HM using the Biovendor Human Adiponectin SandwichELISA kit, (Life Technologies, Asheville, NC, USA). The detection limit was 1 ng/mL, with a recoveryof 96.2% ± 3.2% (n = 10) and an inter-assay CV of <2.5%.
2.5. Protein and Lactose Measurements
Protein content was measured using the Bradford assay according to the methods ofMitoulas et al. [44]. The detection limit was 1.03 g/L, with a recovery of 97.2% ± 1.4% (n = 10)and an inter-assay CV of <1.9%.
Lactose concentration was measured using the enzymatic–spectrophotometric method outlinedby Kuhn et al. [45] according to the methods of Mitoulas et al. [44]. The detection limit was 30 mM,with a recovery of 98.2% ± 4.1% (n = 10) and an inter-assay CV of <3.5%.
Nutrients 2017, 9, 252 4 of 18
2.6. Statistical Analyses
Statistical analyses were performed using R 2.15.1 for Windows [46]. The packages nlme [47] andlattice [48], and RColorBrewer [49] were used for linear mixed effects modeling and data representationrespectively. Descriptive statistics are reported as mean ± standard deviation (SD) and range unlessotherwise stated; model parameters are presented as estimate ± standard error (SE).
In order to collect systematic information over time and at fixed moments in time and to makebetter use of the collected data, a combined data approach that considers individual-level randomeffects to account for participants measured at two or more study sessions was adopted. We furthercontrasted the results from the combined data and from the longitudinal subset to confirm our findings.
During this study, infants were measured at least at one of the four time points (2, 5, 9 and12 months postpartum). An approximate sample size was calculated using the ‘Linear multipleregression: fixed model: r2 increase’ option in G*Power [50] as if this was a cross-sectional study withequal numbers at each time. Allowing four predictors (one main effect, three group contrasts), α = 0.05and 22 participants at each time point (88 sample points = 22 participants × 4 time points) gave thestudy power of 0.80 to detect an effect size of 0.15. This approach was selected as there is no closedform expression suitable for the calculation of sample sizes for this research design [51], with theconsideration that longitudinal study design is more powerful. To maintain predicted power and toaddress issues relating to missed visits, such as inability to attend due to illness and unwillingness ofmothers approached at 2 months (n = 8) to commit to a study that requires breastfeeding to 12 months,the recruitment of participants continued past 22, resulting in 111 sessions for 59 (21 longitudinal,38 cross-sectional) participants.
BC data at 9 months of lactation is missing for two longitudinal participants. Missing data alsooccurred for all milk components due to insufficient milk sample volumes. Missing data was dealtwith using complete case (regression models) or available case (descriptive statistics) approaches.Milk samples were not pooled for biochemical analysis; thus, measures were not averaged. Samplesizes are presented in Table 1.
Table 1. Sample sizes used in statistical analyses.
Month of Lactation 2 5 9 12 Total
Participants *Cross-sectional - - - - 38Longitudinal - - - - 21
Total - - - - 59Sessions
Cross-sectional 8 8 13 9 38Longitudinal 15 21 19 18 73
Total 23 29 32 27 111Samples (complete cases)
Cross-sectional 19 21 33 27 100Longitudinal 41 55 47 40 183
Total 60 76 80 67 283Samples (available cases) **
Whole milk adiponectin 66 79 86 72 303Whole milk leptin 66 79 86 72 303Skim milk leptin 62 77 85 71 295
Total protein 64 78 87 69 298Lactose 65 78 86 67 296
* The number of participants at each time point is the same as the number of sessions, thus not specified in the table;** The number of samples (including pre-feed and post-feed) analysed; this differs by component.
Linear models were used to investigate associations between maternal BMI or %FM (predictors)and each of the composition variables (responses), with and without controlling for month of lactation
Nutrients 2017, 9, 252 5 of 18
(four-level factor or linear predictor). Associations with month of lactation were assessed usingomnibus F-tests and specific post-hoc tests comparing each of the subsequent time points with2 months. Appropriate random effects were selected by comparing four models for each analysisusing a likelihood ratio test. Models were (a) linear regression, and linear mixed effects models withrandom effects of one of: (b) effect of general inter-individual variation present in the study population;(c) effect of the month of lactation samples were collected at, in addition to inter-individual variation;and (d) the effect of pre- and post-feed samples along with inter-individual variation. Whether theoverall effect of maternal adiposity on HM component concentrations differs by month of lactation wasalso investigated by including interactions between BMI/%FM and the month of lactation (factor only).To allow for realistic interpretation of the intercept values in the model outputs, maternal BMI and%FM have been centred at the upper bounds of the ‘healthy’ range (25 kg/m2 for BMI, and 33% for%FM) [52,53]. Where significant outlier values were identified from a kernel density plot, models wererun with and without these values to determine how they might be influencing the findings.
An intercept-only linear mixed effects model was used to calculate the coefficient of variation formaternal %FM measurements (n = 10, 10 measurements each).
3. Results
3.1. Participants
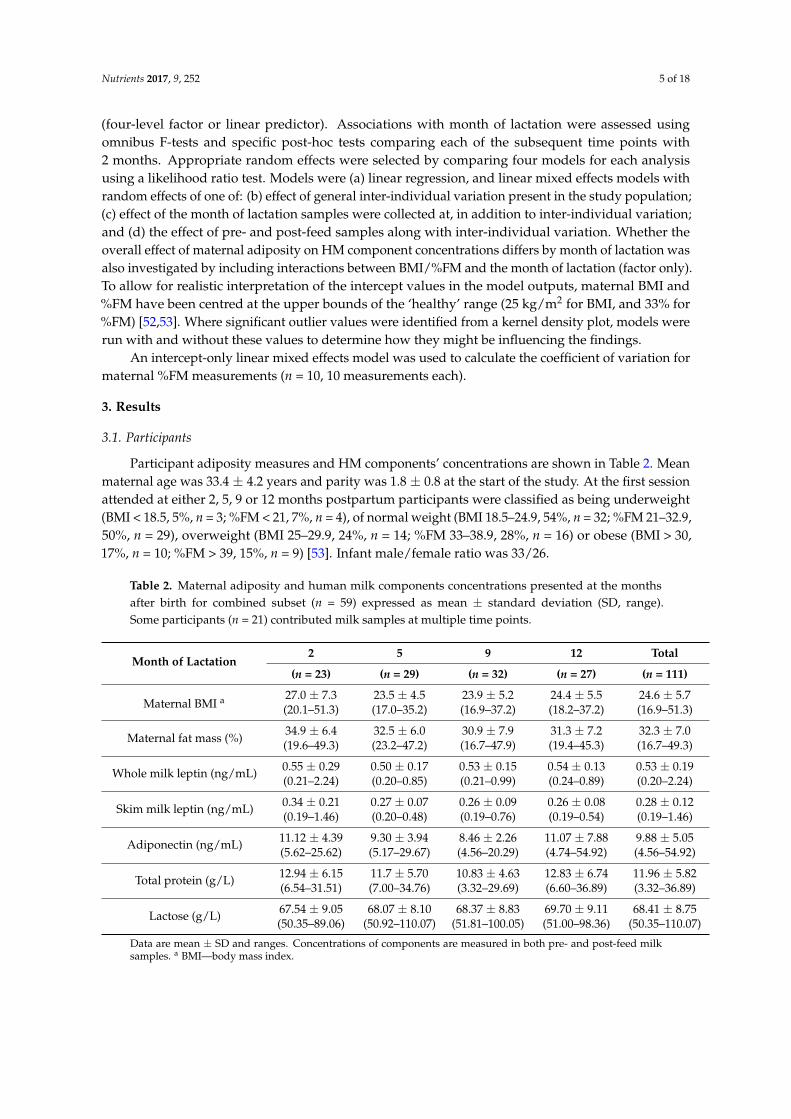
Participant adiposity measures and HM components’ concentrations are shown in Table 2. Meanmaternal age was 33.4 ± 4.2 years and parity was 1.8 ± 0.8 at the start of the study. At the first sessionattended at either 2, 5, 9 or 12 months postpartum participants were classified as being underweight(BMI < 18.5, 5%, n = 3; %FM < 21, 7%, n = 4), of normal weight (BMI 18.5–24.9, 54%, n = 32; %FM 21–32.9,50%, n = 29), overweight (BMI 25–29.9, 24%, n = 14; %FM 33–38.9, 28%, n = 16) or obese (BMI > 30,17%, n = 10; %FM > 39, 15%, n = 9) [53]. Infant male/female ratio was 33/26.
Table 2. Maternal adiposity and human milk components concentrations presented at the monthsafter birth for combined subset (n = 59) expressed as mean ± standard deviation (SD, range).Some participants (n = 21) contributed milk samples at multiple time points.
Month of Lactation2 5 9 12 Total
(n = 23) (n = 29) (n = 32) (n = 27) (n = 111)
Maternal BMI a 27.0 ± 7.3 23.5 ± 4.5 23.9 ± 5.2 24.4 ± 5.5 24.6 ± 5.7(20.1–51.3) (17.0–35.2) (16.9–37.2) (18.2–37.2) (16.9–51.3)
Maternal fat mass (%)34.9 ± 6.4 32.5 ± 6.0 30.9 ± 7.9 31.3 ± 7.2 32.3 ± 7.0(19.6–49.3) (23.2–47.2) (16.7–47.9) (19.4–45.3) (16.7–49.3)
Whole milk leptin (ng/mL) 0.55 ± 0.29 0.50 ± 0.17 0.53 ± 0.15 0.54 ± 0.13 0.53 ± 0.19(0.21–2.24) (0.20–0.85) (0.21–0.99) (0.24–0.89) (0.20–2.24)
Skim milk leptin (ng/mL) 0.34 ± 0.21 0.27 ± 0.07 0.26 ± 0.09 0.26 ± 0.08 0.28 ± 0.12(0.19–1.46) (0.20–0.48) (0.19–0.76) (0.19–0.54) (0.19–1.46)
Adiponectin (ng/mL) 11.12 ± 4.39 9.30 ± 3.94 8.46 ± 2.26 11.07 ± 7.88 9.88 ± 5.05(5.62–25.62) (5.17–29.67) (4.56–20.29) (4.74–54.92) (4.56–54.92)
Total protein (g/L) 12.94 ± 6.15 11.7 ± 5.70 10.83 ± 4.63 12.83 ± 6.74 11.96 ± 5.82(6.54–31.51) (7.00–34.76) (3.32–29.69) (6.60–36.89) (3.32–36.89)
Lactose (g/L) 67.54 ± 9.05 68.07 ± 8.10 68.37 ± 8.83 69.70 ± 9.11 68.41 ± 8.75(50.35–89.06) (50.92–110.07) (51.81–100.05) (51.00–98.36) (50.35–110.07)
Data are mean ± SD and ranges. Concentrations of components are measured in both pre- and post-feed milksamples. a BMI—body mass index.
Nutrients 2017, 9, 252 6 of 18
3.2. Changes in Components’ Concentration with Feeding (Pre- and Post-Feed)
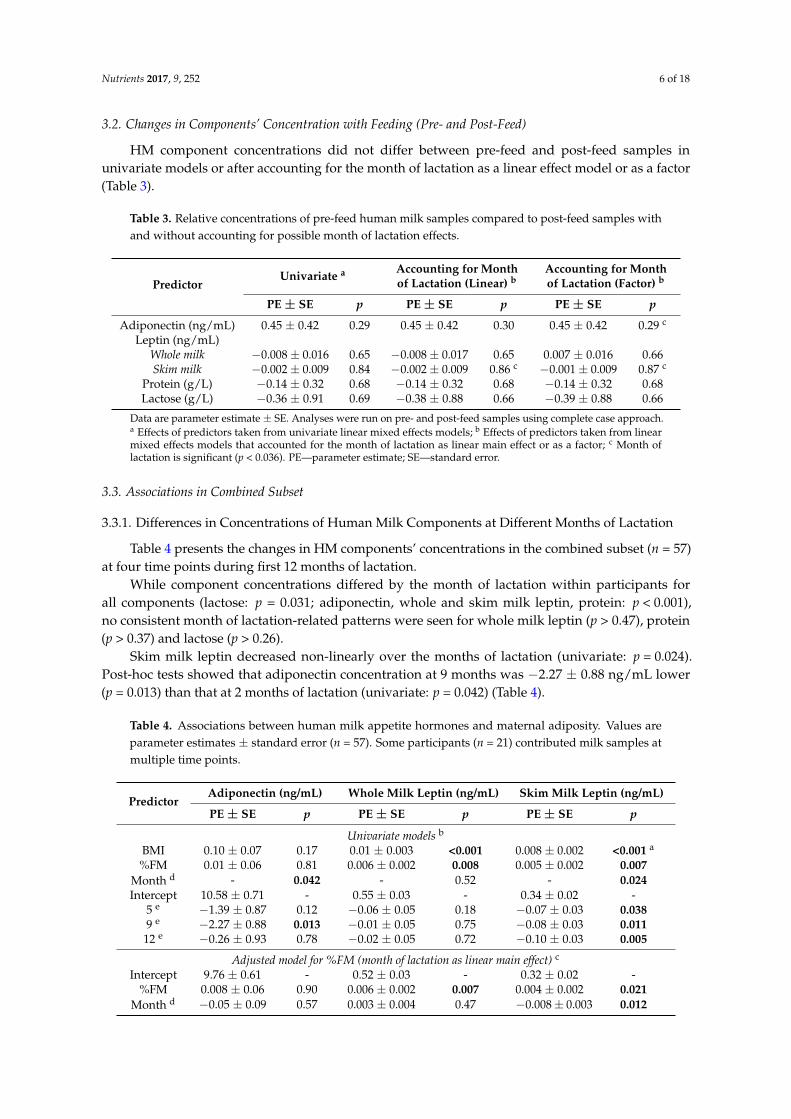
HM component concentrations did not differ between pre-feed and post-feed samples inunivariate models or after accounting for the month of lactation as a linear effect model or as a factor(Table 3).
Table 3. Relative concentrations of pre-feed human milk samples compared to post-feed samples withand without accounting for possible month of lactation effects.
PredictorUnivariate a Accounting for Month
of Lactation (Linear) bAccounting for Monthof Lactation (Factor) b
PE ± SE p PE ± SE p PE ± SE p
Adiponectin (ng/mL) 0.45 ± 0.42 0.29 0.45 ± 0.42 0.30 0.45 ± 0.42 0.29 c
Leptin (ng/mL)Whole milk −0.008 ± 0.016 0.65 −0.008 ± 0.017 0.65 0.007 ± 0.016 0.66Skim milk −0.002 ± 0.009 0.84 −0.002 ± 0.009 0.86 c −0.001 ± 0.009 0.87 c
Protein (g/L) −0.14 ± 0.32 0.68 −0.14 ± 0.32 0.68 −0.14 ± 0.32 0.68Lactose (g/L) −0.36 ± 0.91 0.69 −0.38 ± 0.88 0.66 −0.39 ± 0.88 0.66
Data are parameter estimate ± SE. Analyses were run on pre- and post-feed samples using complete case approach.a Effects of predictors taken from univariate linear mixed effects models; b Effects of predictors taken from linearmixed effects models that accounted for the month of lactation as linear main effect or as a factor; c Month oflactation is significant (p < 0.036). PE—parameter estimate; SE—standard error.
3.3. Associations in Combined Subset
3.3.1. Differences in Concentrations of Human Milk Components at Different Months of Lactation
Table 4 presents the changes in HM components’ concentrations in the combined subset (n = 57)at four time points during first 12 months of lactation.
While component concentrations differed by the month of lactation within participants forall components (lactose: p = 0.031; adiponectin, whole and skim milk leptin, protein: p < 0.001),no consistent month of lactation-related patterns were seen for whole milk leptin (p > 0.47), protein(p > 0.37) and lactose (p > 0.26).
Skim milk leptin decreased non-linearly over the months of lactation (univariate: p = 0.024).Post-hoc tests showed that adiponectin concentration at 9 months was −2.27 ± 0.88 ng/mL lower(p = 0.013) than that at 2 months of lactation (univariate: p = 0.042) (Table 4).
Table 4. Associations between human milk appetite hormones and maternal adiposity. Values areparameter estimates ± standard error (n = 57). Some participants (n = 21) contributed milk samples atmultiple time points.
PredictorAdiponectin (ng/mL) Whole Milk Leptin (ng/mL) Skim Milk Leptin (ng/mL)
PE ± SE p PE ± SE p PE ± SE p
Univariate models b
BMI 0.10 ± 0.07 0.17 0.01 ± 0.003 <0.001 0.008 ± 0.002 <0.001 a
%FM 0.01 ± 0.06 0.81 0.006 ± 0.002 0.008 0.005 ± 0.002 0.007Month d - 0.042 - 0.52 - 0.024Intercept 10.58 ± 0.71 - 0.55 ± 0.03 - 0.34 ± 0.02 -
5 e −1.39 ± 0.87 0.12 −0.06 ± 0.05 0.18 −0.07 ± 0.03 0.0389 e −2.27 ± 0.88 0.013 −0.01 ± 0.05 0.75 −0.08 ± 0.03 0.011
12 e −0.26 ± 0.93 0.78 −0.02 ± 0.05 0.72 −0.10 ± 0.03 0.005
Adjusted model for %FM (month of lactation as linear main effect) c
Intercept 9.76 ± 0.61 - 0.52 ± 0.03 - 0.32 ± 0.02 -%FM 0.008 ± 0.06 0.90 0.006 ± 0.002 0.007 0.004 ± 0.002 0.021
Month d −0.05 ± 0.09 0.57 0.003 ± 0.004 0.47 −0.008 ± 0.003 0.012
Nutrients 2017, 9, 252 7 of 18
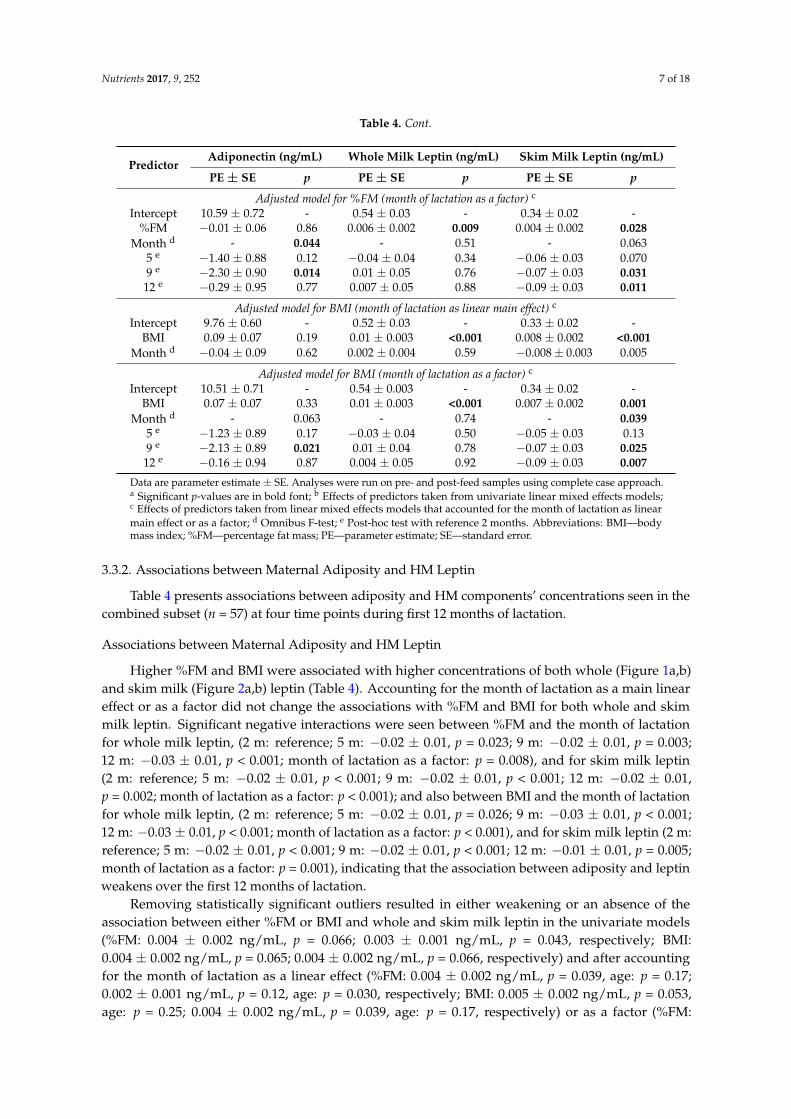
Table 4. Cont.
PredictorAdiponectin (ng/mL) Whole Milk Leptin (ng/mL) Skim Milk Leptin (ng/mL)
PE ± SE p PE ± SE p PE ± SE p
Adjusted model for %FM (month of lactation as a factor) c
Intercept 10.59 ± 0.72 - 0.54 ± 0.03 - 0.34 ± 0.02 -%FM −0.01 ± 0.06 0.86 0.006 ± 0.002 0.009 0.004 ± 0.002 0.028
Month d - 0.044 - 0.51 - 0.0635 e −1.40 ± 0.88 0.12 −0.04 ± 0.04 0.34 −0.06 ± 0.03 0.0709 e −2.30 ± 0.90 0.014 0.01 ± 0.05 0.76 −0.07 ± 0.03 0.031
12 e −0.29 ± 0.95 0.77 0.007 ± 0.05 0.88 −0.09 ± 0.03 0.011
Adjusted model for BMI (month of lactation as linear main effect) c
Intercept 9.76 ± 0.60 - 0.52 ± 0.03 - 0.33 ± 0.02 -BMI 0.09 ± 0.07 0.19 0.01 ± 0.003 <0.001 0.008 ± 0.002 <0.001
Month d −0.04 ± 0.09 0.62 0.002 ± 0.004 0.59 −0.008 ± 0.003 0.005
Adjusted model for BMI (month of lactation as a factor) c
Intercept 10.51 ± 0.71 - 0.54 ± 0.003 - 0.34 ± 0.02 -BMI 0.07 ± 0.07 0.33 0.01 ± 0.003 <0.001 0.007 ± 0.002 0.001
Month d - 0.063 - 0.74 - 0.0395 e −1.23 ± 0.89 0.17 −0.03 ± 0.04 0.50 −0.05 ± 0.03 0.139 e −2.13 ± 0.89 0.021 0.01 ± 0.04 0.78 −0.07 ± 0.03 0.025
12 e −0.16 ± 0.94 0.87 0.004 ± 0.05 0.92 −0.09 ± 0.03 0.007
Data are parameter estimate ± SE. Analyses were run on pre- and post-feed samples using complete case approach.a Significant p-values are in bold font; b Effects of predictors taken from univariate linear mixed effects models;c Effects of predictors taken from linear mixed effects models that accounted for the month of lactation as linearmain effect or as a factor; d Omnibus F-test; e Post-hoc test with reference 2 months. Abbreviations: BMI—bodymass index; %FM—percentage fat mass; PE—parameter estimate; SE—standard error.
3.3.2. Associations between Maternal Adiposity and HM Leptin
Table 4 presents associations between adiposity and HM components’ concentrations seen in thecombined subset (n = 57) at four time points during first 12 months of lactation.
Associations between Maternal Adiposity and HM Leptin
Higher %FM and BMI were associated with higher concentrations of both whole (Figure 1a,b)and skim milk (Figure 2a,b) leptin (Table 4). Accounting for the month of lactation as a main lineareffect or as a factor did not change the associations with %FM and BMI for both whole and skimmilk leptin. Significant negative interactions were seen between %FM and the month of lactationfor whole milk leptin, (2 m: reference; 5 m: −0.02 ± 0.01, p = 0.023; 9 m: −0.02 ± 0.01, p = 0.003;12 m: −0.03 ± 0.01, p < 0.001; month of lactation as a factor: p = 0.008), and for skim milk leptin(2 m: reference; 5 m: −0.02 ± 0.01, p < 0.001; 9 m: −0.02 ± 0.01, p < 0.001; 12 m: −0.02 ± 0.01,p = 0.002; month of lactation as a factor: p < 0.001); and also between BMI and the month of lactationfor whole milk leptin, (2 m: reference; 5 m: −0.02 ± 0.01, p = 0.026; 9 m: −0.03 ± 0.01, p < 0.001;12 m: −0.03 ± 0.01, p < 0.001; month of lactation as a factor: p < 0.001), and for skim milk leptin (2 m:reference; 5 m: −0.02 ± 0.01, p < 0.001; 9 m: −0.02 ± 0.01, p < 0.001; 12 m: −0.01 ± 0.01, p = 0.005;month of lactation as a factor: p = 0.001), indicating that the association between adiposity and leptinweakens over the first 12 months of lactation.
Removing statistically significant outliers resulted in either weakening or an absence of theassociation between either %FM or BMI and whole and skim milk leptin in the univariate models(%FM: 0.004 ± 0.002 ng/mL, p = 0.066; 0.003 ± 0.001 ng/mL, p = 0.043, respectively; BMI:0.004 ± 0.002 ng/mL, p = 0.065; 0.004 ± 0.002 ng/mL, p = 0.066, respectively) and after accountingfor the month of lactation as a linear effect (%FM: 0.004 ± 0.002 ng/mL, p = 0.039, age: p = 0.17;0.002 ± 0.001 ng/mL, p = 0.12, age: p = 0.030, respectively; BMI: 0.005 ± 0.002 ng/mL, p = 0.053,age: p = 0.25; 0.004 ± 0.002 ng/mL, p = 0.039, age: p = 0.17, respectively) or as a factor (%FM:

Nutrients 2017, 9, 252 8 of 18
0.004 ± 0.002 ng/mL, p = 0.044, age: p = 0.37; 0.002 ± 0.001 ng/mL, p = 0.14, age: p = 0.15, respectively;BMI: 0.004 ± 0.002 ng/mL, p = 0.072, age: p = 0.53; 0.004 ± 0.002 ng/mL, p = 0.044, age: p = 0.37,respectively). No interaction between either %FM or BMI and the month of lactation as a factor wasseen (%FM: whole milk leptin: p = 0.37; skim milk leptin: p = 0.13; BMI: whole milk leptin: p = 0.24;skim milk leptin: p = 0.18).
Nutrients 2017, 9, 252 8 of 18
%FM or BMI and the month of lactation as a factor was seen (%FM: whole milk leptin: p = 0.37; skim
milk leptin: p = 0.13; BMI: whole milk leptin: p = 0.24; skim milk leptin: p = 0.18).
Figure 1. Associations between whole human milk (HM) leptin and (a) maternal percentage fat mass;
and (b) maternal BMI. Combined subset data points (measured in pre‐ and post‐feed samples) are
shown as cross‐sectional (pale blue) and longitudinal (dark blue). Lines are fixed effects from
univariate linear mixed effect models: pale blue dotted line—combined cohort (Table 4); medium
blue dashed line—combined cohort with outliers removed (Section 3.3.2); solid dark blue
line—longitudinal cohort (Table S1).
Figure 2. Associations between skim human milk (HM) leptin and (a) maternal percentage fat mass;
and (b) maternal BMI. Combined subset data points are shown as cross‐sectional (pale purple) and
longitudinal (dark purple). Lines are fixed effects from univariate linear mixed effect models: pale
purple dotted line—combined cohort (Table 4); medium purple dashed line—combined cohort with
outliers removed (Section 3.3.2); solid dark purple line—longitudinal cohort (Table S1).
3.3.3. Associations between Maternal Adiposity and HM Adiponectin
HM adiponectin was not significantly associated with either %FM or BMI in the univariate
models (Table 4) or after accounting for the month of lactation. No interactions were seen between
the month of lactation as a factor and either %FM (p = 0.51) or BMI (p = 0.62).
Fat mass (%)
Wh
ole
milk
lept
in (
ng/m
L)
0.5
0.0
0.5
1.0
1.5
2.0
2020 30 40 50
Body mass index (kg/m2)
Who
le m
ilk le
ptin
(n
g/m
L)
0.5
0.0
0.5
1.0
1.5
2.0
2020 30 40 50
a b
Fat mass (%)
Ski
m m
ilk le
ptin
(ng
/mL
)
0.5
0.0
0.5
1.0
1.5
2020 30 40 50
Body mass index (kg/m2)
Ski
m m
ilk le
ptin
(n
g/m
L)
0.5
0.0
0.5
1.0
1.5
2020 30 40 50
a b
Figure 1. Associations between whole human milk (HM) leptin and (a) maternal percentage fat mass;and (b) maternal BMI. Combined subset data points (measured in pre- and post-feed samples) areshown as cross-sectional (pale blue) and longitudinal (dark blue). Lines are fixed effects from univariatelinear mixed effect models: pale blue dotted line—combined cohort (Table 4); medium blue dashedline—combined cohort with outliers removed (Section 3.3.2); solid dark blue line—longitudinal cohort(Table S1).
Nutrients 2017, 9, 252 8 of 18
%FM or BMI and the month of lactation as a factor was seen (%FM: whole milk leptin: p = 0.37; skim
milk leptin: p = 0.13; BMI: whole milk leptin: p = 0.24; skim milk leptin: p = 0.18).
Figure 1. Associations between whole human milk (HM) leptin and (a) maternal percentage fat mass;
and (b) maternal BMI. Combined subset data points (measured in pre‐ and post‐feed samples) are
shown as cross‐sectional (pale blue) and longitudinal (dark blue). Lines are fixed effects from
univariate linear mixed effect models: pale blue dotted line—combined cohort (Table 4); medium
blue dashed line—combined cohort with outliers removed (Section 3.3.2); solid dark blue
line—longitudinal cohort (Table S1).
Figure 2. Associations between skim human milk (HM) leptin and (a) maternal percentage fat mass;
and (b) maternal BMI. Combined subset data points are shown as cross‐sectional (pale purple) and
longitudinal (dark purple). Lines are fixed effects from univariate linear mixed effect models: pale
purple dotted line—combined cohort (Table 4); medium purple dashed line—combined cohort with
outliers removed (Section 3.3.2); solid dark purple line—longitudinal cohort (Table S1).
3.3.3. Associations between Maternal Adiposity and HM Adiponectin
HM adiponectin was not significantly associated with either %FM or BMI in the univariate
models (Table 4) or after accounting for the month of lactation. No interactions were seen between
the month of lactation as a factor and either %FM (p = 0.51) or BMI (p = 0.62).
Fat mass (%)
Wh
ole
milk
lept
in (
ng/m
L)
0.5
0.0
0.5
1.0
1.5
2.0
2020 30 40 50
Body mass index (kg/m2)
Who
le m
ilk le
ptin
(n
g/m
L)
0.5
0.0
0.5
1.0
1.5
2.0
2020 30 40 50
a b
Fat mass (%)
Ski
m m
ilk le
ptin
(ng
/mL
)
0.5
0.0
0.5
1.0
1.5
2020 30 40 50
Body mass index (kg/m2)
Ski
m m
ilk le
ptin
(n
g/m
L)
0.5
0.0
0.5
1.0
1.5
2020 30 40 50
a b
Figure 2. Associations between skim human milk (HM) leptin and (a) maternal percentage fat mass;and (b) maternal BMI. Combined subset data points are shown as cross-sectional (pale purple) andlongitudinal (dark purple). Lines are fixed effects from univariate linear mixed effect models: palepurple dotted line—combined cohort (Table 4); medium purple dashed line—combined cohort withoutliers removed (Section 3.3.2); solid dark purple line—longitudinal cohort (Table S1).

Nutrients 2017, 9, 252 9 of 18
3.3.3. Associations between Maternal Adiposity and HM Adiponectin
HM adiponectin was not significantly associated with either %FM or BMI in the univariate models(Table 4) or after accounting for the month of lactation. No interactions were seen between the monthof lactation as a factor and either %FM (p = 0.51) or BMI (p = 0.62).
Removing a statistically significant outlier did not change the conclusion (%FM: p ≥ 0.50; BMI:p ≥ 0.083) and no interaction between the month of lactation and either %FM (p = 0.54) or BMI(p = 0.081) was seen.
3.3.4. Associations between Maternal Adiposity and HM Protein
Higher %FM was associated with higher concentrations of protein in HM in univariate model(Table 5; Figure 3a). Accounting for the month of lactation made the association between %FM andprotein concentrations weaker but still significant. BMI was not associated with concentrations ofprotein in HM in the univariate model (Figure 3b) or after accounting for the month of lactation.No interaction with the month of lactation as a factor was seen for both %FM (p = 0.21) and BMI(p = 0.16).
Table 5. Associations between human milk macronutrients and maternal adiposity. Values areparameter estimates ± standard error (n = 57). Some participants (n = 21) contributed milk samples atmultiple time points.
Predictor Lactose (g/L) Protein (g/L)
PE ± SE p PE ± SE p
Univariate models b
BMI 0.06 ± 0.14 0.66 0.14 ± 0.09 0.14%FM 0.08 ± 0.11 0.48 0.16 ± 0.07 0.028 a
Month d - 0.65 - 0.37Intercept 67.32 ± 1.43 - 12.90 ± 1.11 -
5 e 0.56 ± 1.89 0.77 −1.39 ± 1.48 0.359 e 1.31 ± 1.88 0.49 −2.47 ± 1.47 0.10
12 e 2.35 ± 1.97 0.24 −0.63 ± 1.55 0.69
Adjusted model for %FM (month of lactation as linear main effect) c
Intercept 68.89 ± 1.13 - 11.93 ± 0.87 -%FM 0.09 ± 0.11 0.43 0.16 ± 0.07 0.036
Month d 0.08 ± 0.15 0.59 −0.03 ± 0.14 0.84
Adjusted model for %FM (month of lactation as a factor) c
Intercept 67.58 ± 1.44 - 12.54 ± 1.11 -%FM 0.06 ± 0.11 0.55 0.15 ± 0.07 0.054
Month d - 0.67 - 0.565 e 0.60 ± 1.85 0.75 −0.94 ± 1.47 0.539 e 1.37 ± 1.87 0.50 −1.78 ± 1.49 0.24
12 e 2.27 ± 1.96 0.25 −0.02 ± 1.56 0.99
Adjusted model for BMI (month of lactation as linear main effect) c
Intercept 67.71 ± 2.92 - 12.10 ± 0.88 -BMI 0.06 ± 0.13 0.63 0.13 ± 0.09 0.16
Month d 0.20 ± 0.17 0.26 −0.07 ± 0.14 0.61
Adjusted model for BMI (month of lactation as a factor) c
Intercept 67.55 ± 1.44 - 12.69 ± 1.12 -BMI 0.06 ± 0.13 0.66 0.12 ± 0.09 0.21
Month d - 0.69 - 0.485 e 0.63 ± 1.88 0.74 −1.01 ± 1.50 0.509 e 1.29 ± 1.87 0.49 −2.14 ± 1.49 0.16
12 e 2.22 ± 1.95 0.26 −0.36 ± 1.56 0.82
Data are parameter estimate ± SE. Analyses were run on pre- and post-feed samples using complete case approach.a Significant p-values are in bold font; b Effects of predictors taken from univariate linear mixed effects models;c Effects of predictors taken from linear mixed effects models that accounted for the month of lactation as linearmain effect or as a factor; d Omnibus F-test; e Post-hoc test with reference 2 months. Abbreviations: BMI—bodymass index; %FM—percentage fat mass; PE—parameter estimate; SE—standard error.

Nutrients 2017, 9, 252 10 of 18Nutrients 2017, 9, 252 10 of 18
Figure 3. Associations between protein concentration and (a) maternal percentage fat mass; and (b)
maternal BMI. Combined subset data points are shown as cross‐sectional (pale orange) and
longitudinal (dark orange). Lines are fixed effects from univariate linear mixed effect models: pale
orange dotted line—combined cohort (Table 5); solid dark red line—longitudinal cohort (Table S1).
3.3.5. Associations between Maternal Adiposity and HM Lactose
Neither %FM or BMI were associated with concentrations of lactose in HM in univariate model
(Table 5) or after accounting for the month of lactation. No interaction with the month of lactation as
a factor was seen for BMI (p = 0.19), but a significant positive interaction was seen between %FM and
the month of lactation (2 m: reference; 5 m: 0.12 ± 0.33, p = 0.71; 9 m: −0.14 ± 0.30, p = 0.63; 12 m: 0.58 ±
0.31, p = 0.068; month of lactation as a factor: p = 0.029), indicating that association between %FM and
lactose strengthens over the first 12 months of lactation.
3.4. Associations in the Longitudinal Subset
3.4.1. Participants
Longitudinal (n = 21) participants’ characteristics and HM components’ concentrations are
shown in Table S2. Participants in longitudinal subset were generally leaner than in the combined
subset, but none were underweight. At the first session they were classified as: normal weight (BMI
18.5–24.9, 67%, n = 14; %FM 21–32.9, 57%, n = 12), overweight (BMI 25–29.9, 19%, n = 4; %FM 33–38.9,
29%, n = 6) or obese (BMI > 30, 14%, n = 3; %FM > 39,14%, n = 3) [53]. Infant male:female ratio was
10:11.
3.4.2. Longitudinal Changes in Concentrations of Human Milk Components
Table S1 presents the changes in HM component concentrations in the longitudinal subset (n =
21 participants, 73 sessions). While component concentrations differed by the month of lactation
within participants for all components (lactose: p = 0.020; adiponectin, whole and skim milk leptin,
protein: p < 0.001), no consistent month of lactation‐related patterns were seen for adiponectin (p >
0.32), whole milk leptin (p > 0.11) or lactose (p > 0.46). Although the overall pattern for protein was
not significant (p > 0.10), post‐hoc tests showed that protein concentration at 9 months was 3.80 ± 1.65
g/L lower than that at 2 months of lactation (univariate, p = 0.027). Skim milk leptin decreased
non‐linearly over the months of lactation (univariate: p = 0.007).
Fat mass (%)
Pro
tein
(g/
L)
00
10
20
30
2020 30 40 50
Body mass index (kg/m2)
Pro
tein
(g
/L)
00
10
20
30
2020 30 40 50
a b
Figure 3. Associations between protein concentration and (a) maternal percentage fat mass;and (b) maternal BMI. Combined subset data points are shown as cross-sectional (pale orange) andlongitudinal (dark orange). Lines are fixed effects from univariate linear mixed effect models: paleorange dotted line—combined cohort (Table 5); solid dark red line—longitudinal cohort (Table S1).
3.3.5. Associations between Maternal Adiposity and HM Lactose
Neither %FM or BMI were associated with concentrations of lactose in HM in univariate model(Table 5) or after accounting for the month of lactation. No interaction with the month of lactation asa factor was seen for BMI (p = 0.19), but a significant positive interaction was seen between %FM andthe month of lactation (2 m: reference; 5 m: 0.12 ± 0.33, p = 0.71; 9 m: −0.14 ± 0.30, p = 0.63; 12 m:0.58 ± 0.31, p = 0.068; month of lactation as a factor: p = 0.029), indicating that association between%FM and lactose strengthens over the first 12 months of lactation.
3.4. Associations in the Longitudinal Subset
3.4.1. Participants
Longitudinal (n = 21) participants’ characteristics and HM components’ concentrations are shownin Table S2. Participants in longitudinal subset were generally leaner than in the combined subset,but none were underweight. At the first session they were classified as: normal weight (BMI 18.5–24.9,67%, n = 14; %FM 21–32.9, 57%, n = 12), overweight (BMI 25–29.9, 19%, n = 4; %FM 33–38.9, 29%, n = 6)or obese (BMI > 30, 14%, n = 3; %FM > 39,14%, n = 3) [53]. Infant male:female ratio was 10:11.
3.4.2. Longitudinal Changes in Concentrations of Human Milk Components
Table S1 presents the changes in HM component concentrations in the longitudinal subset (n = 21participants, 73 sessions). While component concentrations differed by the month of lactation withinparticipants for all components (lactose: p = 0.020; adiponectin, whole and skim milk leptin, protein:p < 0.001), no consistent month of lactation-related patterns were seen for adiponectin (p > 0.32), wholemilk leptin (p > 0.11) or lactose (p > 0.46). Although the overall pattern for protein was not significant(p > 0.10), post-hoc tests showed that protein concentration at 9 months was 3.80 ± 1.65 g/L lowerthan that at 2 months of lactation (univariate, p = 0.027). Skim milk leptin decreased non-linearly overthe months of lactation (univariate: p = 0.007).
3.4.3. Associations between Maternal Body Mass Index and Percentage Fat Mass
A strong relationship (p < 0.001) was observed between maternal BMI and %FM in thelongitudinal subset, with a one-unit increase in BMI associated with a 1.07% ± 0.17% increase in

Nutrients 2017, 9, 252 11 of 18
%FM. After accounting for the month of lactation there was a significant overall difference in %FMwith the month of lactation (p = 0.008) and the association between maternal BMI and %FM remainedsignificant (1.01 ± 0.17, p < 0.001).
Over the first year of lactation, maternal %FM decreased in non-linear fashion (largest dropbetween 9 and 12 months) by more than 2% after accounting for the month of lactation as a factor(−2.26% ± 0.67%, p = 0.002; age: p < 0.001) or by 0.23% per month after accounting for the month oflactation as a linear effect (−0.23% ± 0.06 %, p < 0.001) (Figure 4a).
Over the first year of lactation, maternal BMI decreased in an almost linear fashion; decreasing by−1.05 ± 0.24 kg/m2 (p < 0.001; month of lactation: p < 0.001) over the ten months of the study whenaccounting for the month of lactation as a factor, or by −0.10 ± 0.02 kg/m2 (p < 0.001) per month whenaccounting for the month of lactation as a linear effect (Figure 4b).
Nutrients 2017, 9, 252 11 of 18
3.4.3. Associations between Maternal Body Mass Index and Percentage Fat Mass
A strong relationship (p < 0.001) was observed between maternal BMI and %FM in the
longitudinal subset, with a one‐unit increase in BMI associated with a 1.07% ± 0.17% increase in
%FM. After accounting for the month of lactation there was a significant overall difference in %FM
with the month of lactation (p = 0.008) and the association between maternal BMI and %FM
remained significant (1.01 ± 0.17, p < 0.001).
Over the first year of lactation, maternal %FM decreased in non‐linear fashion (largest drop
between 9 and 12 months) by more than 2% after accounting for the month of lactation as a factor
(−2.26% ± 0.67%, p = 0.002; age: p < 0.001) or by 0.23% per month after accounting for the month of
lactation as a linear effect (−0.23% ± 0.06 %, p < 0.001) (Figure 4a).
Over the first year of lactation, maternal BMI decreased in an almost linear fashion; decreasing
by −1.05 ± 0.24 kg/m2 (p < 0.001; month of lactation: p < 0.001) over the ten months of the study when
accounting for the month of lactation as a factor, or by −0.10 ± 0.02 kg/m2 (p < 0.001) per month when
accounting for the month of lactation as a linear effect (Figure 4b).
Figure 4. Longitudinal changes in (a) maternal percentage fat mass and (b) maternal BMI from 2 to
12 months of lactation. Lines are colour‐coordinated for the individual participants (e.g., dark orange
in panel (a) is a same dark orange in panel (b)) for illustrative purposes only (n = 21).
3.4.4. Associations between Maternal Adiposity and Human Milk Components in Longitudinal
Subset
No associations were seen between measures of maternal adiposity and adiponectin (%FM: p >
0.36; BMI: p > 0.39), whole (%FM: p > 0.051; BMI: p > 0.082) and skim milk leptin (%FM: p > 0.51; BMI:
p > 0.78) and lactose concentrations (%FM: p > 0.56; BMI: p > 0.68) in either univariate models or after
accounting for the month of lactation (Table S1).
Higher %FM was associated with higher protein concentration in the univariate model (0.19 ±
0.09 g/L, p = 0.035); when the month of lactation was accounted for, this association was no longer
seen (0.14 ± 0.09 g/L, p = 0.12).
No interaction with the month of lactation as a factor was seen for adiponectin (%FM: p = 0.87;
BMI: p = 0.52), whole milk leptin (%FM: p = 0.62; BMI: p = 0.36), skim milk leptin (%FM: p = 0.37),
protein (%FM: p = 0.78; BMI: p = 0.25) and lactose (%FM: p = 0.22; BMI: p = 0.30).
Significant negative interactions were seen between BMI and the month of lactation for skim
milk leptin, (2 m: reference; 5 m: −0.02 ± 0.01, p = 0.005; 9 m: −0.01 ± 0.01, p = 0.059; 12 m: −0.01 ± 0.01, p
= 0.059; month of lactation as a factor: p = 0.043), indicating that association between BMI and skim
milk leptin weakens over the first 12 months of lactation.
Month of lactation
Fa
t ma
ss (
%)
2020
30
40
50
22 5 9 12
Month of lactation
Bod
y m
ass
inde
x (k
g/m
2)
2020
30
40
22 5 9 12
a b
Figure 4. Longitudinal changes in (a) maternal percentage fat mass and (b) maternal BMI from 2 to12 months of lactation. Lines are colour-coordinated for the individual participants (e.g., dark orangein panel (a) is a same dark orange in panel (b)) for illustrative purposes only (n = 21).
3.4.4. Associations between Maternal Adiposity and Human Milk Components in Longitudinal Subset
No associations were seen between measures of maternal adiposity and adiponectin (%FM:p > 0.36; BMI: p > 0.39), whole (%FM: p > 0.051; BMI: p > 0.082) and skim milk leptin (%FM: p > 0.51;BMI: p > 0.78) and lactose concentrations (%FM: p > 0.56; BMI: p > 0.68) in either univariate models orafter accounting for the month of lactation (Table S1).
Higher %FM was associated with higher protein concentration in the univariate model(0.19 ± 0.09 g/L, p = 0.035); when the month of lactation was accounted for, this association was nolonger seen (0.14 ± 0.09 g/L, p = 0.12).
No interaction with the month of lactation as a factor was seen for adiponectin (%FM: p = 0.87;BMI: p = 0.52), whole milk leptin (%FM: p = 0.62; BMI: p = 0.36), skim milk leptin (%FM: p = 0.37),protein (%FM: p = 0.78; BMI: p = 0.25) and lactose (%FM: p = 0.22; BMI: p = 0.30).
Significant negative interactions were seen between BMI and the month of lactation for skim milkleptin, (2 m: reference; 5 m: −0.02 ± 0.01, p = 0.005; 9 m: −0.01 ± 0.01, p = 0.059; 12 m: −0.01 ± 0.01,p = 0.059; month of lactation as a factor: p = 0.043), indicating that association between BMI and skimmilk leptin weakens over the first 12 months of lactation.
4. Discussion
The hormonal regulation of appetite plays a central role in infant developmental programmingfacilitating a lifelong healthy balance between energy intake and expenditure [9]. Concentrations

Nutrients 2017, 9, 252 12 of 18
of appetite hormones and macronutrients present in HM influence regulation of appetite, energyexpenditure pathways and growth trajectory in the developing infant [8,54,55]. Maternal adipositymay play a critical role in regulation of concentrations of HM leptin, adiponectin, protein andlactose, and thus of the ingested dose of these components by the infant. This study found someassociations of higher maternal adiposity with higher concentrations of HM leptin and protein, but noassociations with adiponectin or lactose. Concentrations of whole milk leptin, adiponectin, proteinand lactose did not systematically change with milk removal during a breastfeed, or over the firstyear of lactation—a period which includes both exclusive breastfeeding and the introduction ofcomplementary foods.
This study has shown that the greater the maternal %FM or BMI, the higher the concentrations ofHM leptin. This is logical in that a greater amount of adipose tissue results in more leptin secretedinto the circulation and thus increased amounts are transferred into the milk. In young infants,HM is believed to be a major source of leptin, due to immature endogenous leptin-synthesisingmechanisms [56]. Leptin may provide both short and long term appetite control acting asa neurotrophic molecule targeting the hypothalamus to stimulate neural connections with otherkey appetite nuclei [57]. Higher HM leptin concentrations are associated with lower infant weight,weight gain and adiposity [8,58] while higher concentrations in infant serum are associated withgreater lean body mass (total body water) [59,60], suggesting a pivotal role in regulating infant growthand BC.
One might speculate that increased amounts of HM leptin supplied to an infant may bedetrimental to the development of infant appetite control and growth. However, concentrationsof leptin do not reflect the 24-h dose received by the infant and indeed 24-h milk intakes are variablebetween dyads [61]. In particular, obese mothers are more likely to have reduced milk production dueto incomplete differentiation of mammary epithelial cells [62]. Conversely, lean mothers with verylow plasma leptin concentrations may produce milk with low leptin levels, thus signalling marginalenvironment and promoting rapid infant growth while supported by maternal metabolism [63].Lower infant serum leptin levels would thus reduce the neurotrophic effects on the hypothalamicappetite circuitry and lower satiety stimulation [8,13]. Accordingly, maintenance of healthy maternaladiposity during pregnancy and lactation may ensure appropriate levels of leptin supply to the infant,supporting the optimal programming of appetite control in infancy.
Whilst the lack of relationship between maternal %FM/BMI and HM leptin in the longitudinalsubset (Figures 1 and 2) may seem counter-intuitive, there is a marked reduction in the variability ofboth the maternal BC and HM leptin levels, restricting applicability of the results (Tables S1 and S2).However, HM leptin concentrations have not been shown to differ between obese and non-obesemothers [64]. Furthermore, the contribution by the lactocytes to leptin levels in HM [19,20] is notknown. These limitations may explain why some studies (n = 11) find an association and others do not(n = 4) [25]. Moreover, the majority of previous studies analysed leptin in skim HM in cross-sectionalcohorts and are restricted to the first and third months postpartum [25], limiting their ability todetermine leptin profiles during lactation in women of varying BC. Only three studies have analysed%FM using dual-energy X-ray absorptiometry (DXA) [24], skinfold measures [63] and bioelectricalimpedance analysis [65] and they found a strong association between %FM and skim milk leptin,consistent with the results from our study. Interestingly, Khodabakhshi et al. (2015) [65] foundassociation between HM leptin and both %FM and BMI only in the subset of mothers of obese infantsbut not in the subset of mothers of normal infants, although these two groups did not differ by BMI orleptin concentration.
Concentrations of adiponectin in HM were not related to maternal %FM and BMI in either thecombined or longitudinal subsets in this study. This is not consistent with the physiological inverserelationship between the number of white adipocytes and serum adiponectin levels in humans [29],however it is in agreement with a recent meta-analysis by Andreas et al. [25] who reported the absenceof a consistent relationship, either positive or negative, between maternal BMI and colostrum or skim

Nutrients 2017, 9, 252 13 of 18
HM adiponectin. We have now expanded the absence of a relationship to maternal %FM and wholeHM adiponectin. Thus, it is unlikely that maternal adiposity plays a major role in influencing HMadiponectin levels and it suggests the majority of HM adiponectin may be synthesized and controlledby the mammary gland [66] highlighting the importance of this HM hormone for the infant. Indeed,it appears that HM adiponectin levels regulate infant growth with higher levels of HM adiponectinbeing associated with lower weight for age (WAZ) and weight for length (WLZ) z-scores at 6 monthsof age [34] and higher WAZ and WLZ scores over the first 2 years of life [54]. These results were alsosupported by Brunner et al. [32], who found that higher concentrations of HM adiponectin at 6 weekswere associated with lower infant fat-free mass and weight at 4 months as well as greater weight andfat mass at 1 and 2 years of age. The follow up at 3, 4 and 5 years of age has not shown any relationshipwith the exception of the positive association between HM adiponectin levels at 4 months postpartumand fat mass at 4 years [67]. This reversal of the initial trend in early life is speculated to be related tothe timing of cessation of breastfeeding [54]. High HM adiponectin levels may initially down-regulateinfant growth, and later promote adipogenesis and adipocyte hypertrophy [68]. Conversely leanpopulations with lower concentrations of HM adiponectin demonstrate a positive association with theinfant WAZ scores. This suggests that the association between HM adiponectin and infant growth mayin fact be parabolic, further highlighting the pleiotropic effects of adiponectin during developmentand the adaptive mechanisms that humans display in the marginal environments [66]. Our recentstudy of gastric emptying and breastfeeding patterns in fully breastfed term infants has establishedthat higher concentrations and doses of HM adiponectin are associated with longer times betweenbreastfeeds (gastric emptying time) [69], which may partially explain the growth-regulating effect ofadiponectin in some populations. As such, investigations into other factors that may affect adiponectinconcentrations in HM and its effect on infant growth and BC development are warranted.
The few studies investigating relationships between HM protein composition and maternaladiposity are contradictory, with some reporting a positive association between protein and maternaladiposity (BMI or percentage ideal weight) [41,42] and one a negative association between protein andBMI [40]. Increased serum amino acid concentrations are present in mothers with more adiposetissue [39], leading to more amino acids transferred to the breast and HM [70], explaining thepositive relationship between maternal adiposity and HM protein concentrations [42]. This studyhas found that higher %FM but not BMI was associated with higher protein concentrations, which issimilar to Quinn et al. [63] who reported %FM to be more precise measure of adiposity reportingstronger correlation with HM leptin, thus the more precise measure of maternal BC is desirable inmechanistic research.
The measured concentrations of lactose in our cohort were consistent with the normal rangein HM [71] and were not related to maternal adiposity profiles. HM provides a constant sourceof carbohydrates to the infant during early life, ensuring adequate nourishment, maturation anddevelopment of their relatively immature physiological systems [41,72,73]. Given the fact that lactoseis important for maintaining a constant osmotic pressure in HM [74], maternal adiposity is not expectedto have a significant impact on lactose concentration.
Despite significant changes in maternal %FM and BMI over the 12 months of lactation, andthe introduction of complimentary foods, the measured HM components have remained relativelystable (Tables 4 and 5 and Table S2). However, adiponectin concentration decreased significantlyin the combined subset as well as in the concentration of protein in the longitudinal subset, both at9 months only. The temporary drop in protein concentration was consistent with differences describedby Nommsen et al. [42]. Whereas some studies have reported a decrease in concentrations of leptin [75]and adiponectin [30,33,36,66] (measured predominantly in skim HM), others found the opposite trendfor adiponectin [11,35], no change [76] or significant fluctuations [11,21] for leptin. More research isrequired to clarify these relationships.
In this study we have measured leptin in both skim and whole milk. Interestingly, longitudinalchanges observed in concentrations of skim milk leptin in this study were not confirmed in whole
Nutrients 2017, 9, 252 14 of 18
HM. Caution in the interpretation of leptin concentrations measured in skim HM should be exercised,as whole milk measures are more indicative of the level of hormone consumed by the infant [28].The consistent concentrations of adiponectin and leptin in whole HM over the first 12 months of lifemay be indicative of a continuing roles of appetite programming, priming neural connections involvedin the appetite circuitry, thereby contributing to long-lasting enhanced appetite control and BC ofbreastfed infants throughout life.
Sampling protocols are of prime importance when investigating relationships between HMcomponents and BC. In this study we confirmed no systematic change between pre- and post-feedsamples for concentrations of protein, lactose and whole and skim HM leptin throughout the first12 months of lactation (Table 3), and report for the first time that whole milk adiponectin concentrationsalso do not differ significantly pre- to post-feed. Care however should still be taken as fat content [77],ghrelin [75] and glucagon-like peptide 1 (GLP-1) [24] change between pre- and post-feed, furtherhighlighting the importance of prudent sampling.
The limitations of this study are the modest number of longitudinal participants, resultingfrom time constraints associated with multiple measurement time points. Further, our populationwas predominantly Caucasian and of high social-economic status; therefore, the results may not beapplicable to participants from other backgrounds.
5. Conclusions
This study found that elevated maternal adiposity was associated with higher concentrations ofleptin and protein of HM in a cross-sectional cohort however; these findings were not confirmed ina smaller longitudinal cohort. Clarification of the relationships between maternal body compositionand human milk appetite regulators will identify periods of lactation where interventions mayinfluence programming of early appetite control and body composition of breastfed infants.
Supplementary Materials: The following are available online at http://www.mdpi.com/2072-6643/9/3/252/s1,Table S1: Longitudinal changes and associations between human milk components and maternal adiposity. Valuesare parameter estimates ± standard error (n = 21), Table S2: Maternal adiposity and human milk componentsconcentrations presented at the months after birth for longitudinal subset (n = 21 participants, 73 sessions). Valuesare mean ± standard deviation (range).
Acknowledgments: All authors read and approved the final manuscript. This study was supported byan unrestricted research grant from Medela AG (Switzerland). Sambavi Kugananthan was supported bya Margaret Lomann–Hall Scholarship from the School of Anatomy, Physiology and Human Biology, The Universityof Western Australia. Zoya Gridneva was supported by an Australian Postgraduate Award from The Universityof Western Australia (Australia). Many thanks are extended to all mothers who participated in this study.
Author Contributions: Sambavi Kugananthan designed the study, conducted experiments and data analysisand interpretation, and wrote the manuscript; Zoya Gridneva designed the study, collected the data, conducteddata analysis and interpretation, and wrote the manuscript; Ching T. Lai conducted experiments and criticallyreviewed the manuscript; Anna R. Hepworth provided consultation for research design, conducted data analysisand interpretation, and critically reviewed the manuscript; Peter J. Mark designed the study, interpreted results,and critically reviewed the manuscript; Donna T. Geddes designed the study, collected the data, interpreted results,and critically reviewed the manuscript; Foteini Kakulas designed the study, interpreted results and criticallyreviewed the manuscript.
Conflicts of Interest: The authors declare that Medela AG (Switzerland) provides an unrestricted researchgrant to Donna T. Geddes from which salaries to Donna T. Geddes, Anna R. Hepworth, and Ching T. Laiare paid. Medela AG provided a Top-up Scholarship for Zoya Gridneva, and has provided speaker’s fees toDonna T. Geddes for educational lectures. The funding sponsors had no role in the design of the study; in thecollection, analyses, or interpretation of data; in the writing of the manuscript, or in the decision to publishthe results.
References
1. Lonnerdal, B. Breast milk: A truly functional food. Nutrition 2000, 16, 509–511. [CrossRef]2. Hartmann, P.E.; Hassiotou, F.; Trengove, N.; Lai, C.T.; Filgueira, L. Does mature breastmilk contain immune
cells? FASEB J. 2011, 25. [CrossRef]
Nutrients 2017, 9, 252 15 of 18
3. Hassiotou, F.; Filgueira, L.; Trengove, N.; Lai, C.T.; Hartmann, P.E. Breastmilk contains primitive stem cellsfrom the lactating breast with multi-lineage differentiation potential. FASEB J. 2012, 26. [CrossRef]
4. Fichter, M.; Klotz, M.; Hirschberg, D.L.; Waldura, B.; Schofer, O.; Ehnert, S.; Schwarz, L.K.; Ginneken, C.V.;Schafer, K.H. Breast milk contains relevant neurotrophic factors and cytokines for enteric nervous systemdevelopment. Mol. Nutr. Food Res. 2011, 55, 1592–1596. [CrossRef] [PubMed]
5. Isaacs, E.B.; Fischl, B.R.; Quinn, B.T.; Chong, W.K.; Gadian, D.G.; Lucas, A. Impact of breast milk onintelligence quotient, brain size, and white matter development. Pediatr. Res. 2010, 67, 357–362. [CrossRef][PubMed]
6. Thompson, A.L. Developmental origins of obesity: Early feeding environments, infant growth, and theintestinal microbiome. Am. J. Hum. Biol. 2012, 24, 350–360. [CrossRef] [PubMed]
7. Weng, S.F.; Redsell, S.A.; Swift, J.A.; Yang, M.; Glazebrook, C.P. Systematic review and meta-analyses ofrisk factors for childhood overweight identifiable during infancy. Arch. Dis. Child. 2012, 97, 1019–1026.[CrossRef] [PubMed]
8. Miralles, O.; Sanchez, J.; Palou, A.; Pico, C. A physiological role of breast milk leptin in body weight controlin developing infants. Obesity 2006, 14, 1371–1377. [CrossRef] [PubMed]
9. Hassiotou, F.; Geddes, D.T. Programming of appetite control during breastfeeding as a preventative strategyagainst the obesity epidemic. J. Hum. Lact. 2014, 30, 136–142. [CrossRef] [PubMed]
10. Savino, F.; Benetti, S.; Liguori, S.; Sorrenti, M.; Cordero Di Montezemolo, L. Advances of human milkhormones and protection against obesity. Cell. Mol. Biol. 2013, 59, 89–98. [PubMed]
11. Bronsky, J.; Mitrova, K.; Karpisek, M.; Mazoch, J.; Durilova, M.; Fisarkova, B.; Stechova, K.; Prusa, R.;Nevoral, J. Adiponectin, AFABP, and leptin in human breast milk during 12 months of lactation. J. Pediatr.Gastroenterol. Nutr. 2011, 52, 474–477. [CrossRef] [PubMed]
12. Proulx, K.; Richard, D.; Walker, C.D. Leptin regulates appetite-related neuropeptides in the hypothalamus ofdeveloping rats without affecting food intake. Endocrinology 2002, 143, 4683–4692. [CrossRef] [PubMed]
13. Bouret, S.G.; Draper, S.J.; Simerly, R.B. Trophic action of leptin on hypothalamic neurons that regulate feeding.Science 2004, 304, 108–110. [CrossRef] [PubMed]
14. Newburg, D.; Woo, J.; Morrow, A. Characteristics and potential functions of human milk adiponectin.J. Pediatr. 2010, 156, S41–S46. [CrossRef] [PubMed]
15. Kentish, S.J.; Ratcliff, K.; Li, H.; Wittert, G.A.; Page, A.J. High fat diet induced changes in gastric vagalafferent response to adiponectin. Physiol. Behav. 2015, 152, 354–362. [CrossRef] [PubMed]
16. Geddes, D.; Prescott, S. Developmental origins of health and disease: The role of human milk in preventingdisease in the 21(st) century. J. Hum. Lact. 2013, 29, 123–127. [CrossRef] [PubMed]
17. Kent, J.C.; Mitoulas, L.R.; Cregan, M.D.; Ramsay, D.T.; Doherty, D.A.; Hartmann, P.E. Volume and frequencyof breastfeedings and fat content of breast milk throughout the day. Pediatrics 2006, 117, e387–e395. [CrossRef][PubMed]
18. Weyermann, M.; Beermann, C.; Brenner, H.; Dietrich, R. Adiponectin and leptin in maternal serum, cordblood, and breast milk. Clin. Chem. 2006, 2, 2095–2102. [CrossRef] [PubMed]
19. Hassiotou, F.; Savigni, D.; Hartmann, P.E.; Geddes, D.T. Mammary cells synthesize appetite hormones thatmay contribute to breastmilk (38.8). FASEB J. 2014, 28. [CrossRef]
20. Smith-Kirwin, S.M.; O’Connor, D.M.; Johnston, J.; de Lancey, E.; Hassink, S.G.; Funanage, V.L. Leptinexpression in human mammary epithelial cells and breast milk. J. Clin. Endocrinol. Metab. 1998, 83,1810–1813. [CrossRef] [PubMed]
21. Schuster, S.; Hechler, C.; Gebauer, C.; Kiess, W.; Kratzsch, J. Leptin in maternal serum and breast milk:Association with infants’ body weight gain in a longitudinal study over 6 months of lactation. Pediatr. Res.2011, 70, 633–637. [CrossRef] [PubMed]
22. Savino, F.; Sardo, A.; Rossi, L.; Benetti, S.; Savino, A.; Silvestro, L. Mother and infant body mass index, breastmilk leptin and their serum leptin values. Nutrients 2016, 8, 383. [CrossRef] [PubMed]
23. Houseknecht, K.L.; McGuire, M.K.; Portocarrero, C.P.; McGuire, M.A.; Beerman, K. Leptin is presentin human milk and is related to maternal plasma leptin concentration and adiposity. Biochem. Biophys.Res. Commun. 1997, 240, 742–747. [CrossRef] [PubMed]
24. Schueler, J.; Alexander, B.; Hart, A.M.; Austin, K.; Larson-Meyer, D.E. Presence and dynamics of leptin,GLP-1, and PYY in human breast milk at early postpartum. Obesity 2013, 21, 1451–1458. [CrossRef] [PubMed]

Nutrients 2017, 9, 252 16 of 18
25. Andreas, N.J.; Hyde, M.J.; Gale, C.; Parkinson, J.R.C.; Jeffries, S.; Holmes, E.; Modi, N. Effect of maternalbody mass index on hormones in breast milk: A systematic review. PLoS ONE 2014, 9, e115043. [CrossRef][PubMed]
26. Prentice, A.M.; Jebb, S.A. Beyond body mass index. Obes. Rev. 2001, 2, 141–147. [CrossRef] [PubMed]27. Shah, N.R.; Braverman, E.R. Measuring adiposity in patients: The utility of body mass index (BMI), percent
body fat, and leptin. PLoS ONE 2012, 7, 1–8. [CrossRef] [PubMed]28. Kugananthan, S.; Lai, C.T.; Gridneva, Z.; Mark, P.J.; Geddes, D.T.; Kakulas, F. Leptin levels are higher in
whole compared to skim human milk, supporting a cellular contribution. Nutrients 2016, 8, 711. [CrossRef][PubMed]
29. Arita, Y.; Kihara, S.; Ouchi, N.; Takahashi, M.; Maeda, K.; Miyagawa, S.; Hotta, K.; Shimomura, I.;Nakamura, T.; Miyaoka, K.; et al. Paradoxical decrease of an adipose-specific protein, adiponectin, inobesity. Biochem. Biophys. Res. Commun. 1999, 257, 79–83. [CrossRef] [PubMed]
30. Savino, F.; Lupica, M.; Benetti, S.; Petrucci, E.; Liguori, S.; Cordero Di Montezemolo, L. Adiponectin in breastmilk: Relation to serum adiponectin concentration in lactating mothers and their infants. Acta Pediatr. 2012,101, 1058–1062. [CrossRef] [PubMed]
31. Weyermann, M.; Brenner, H.; Rothenbacher, D. Adipokines in human milk and risk of overweight in earlychildhood: A prospective cohort study. Epidemiology 2007, 18, 722–729. [CrossRef] [PubMed]
32. Brunner, S.; Schmid, D.; Zang, K.; Much, D.; Knoeferl, B.; Kratzsch, J.; Amann-Gassner, U.; Bader, B.L.;Hauner, H. Breast milk leptin and adiponectin in relation to infant body composition up to 2 years.Pediatr. Obes. 2014, 10, 67–73. [CrossRef] [PubMed]
33. Martin, L.J.; Woo, J.G.; Geraghty, S.R.; Altaye, M.; Davidson, B.S.; Banach, W.; Dolan, L.M.;Ruiz-Palacios, G.M.; Morrow, A.L. Adiponectin is present in human milk and is associated with maternalfactors. Am. J. Clin. Nutr. 2006, 83, 1106–1111. [PubMed]
34. Woo, J.; Guerrero, M.; Altaye, M.; Ruiz-Palacios, G.; Martin, L.; Dubert-Ferrandon, A.; Newburg, D.;Morrow, A. Human milk adiponectin is associated with growth in two independent cohorts. Breastfeed. Med.2009, 4, 101–109. [CrossRef] [PubMed]
35. Ozarda, Y.; Gunes, Y.; Tuncer, G.O. The concentration of adiponectin in breast milk is related to maternalhormonal and inflammatory status during 6 months of lactation. Clin. Chem. Lab. Med. 2012, 31, 911–917.[CrossRef] [PubMed]
36. Wang, Y.Y.; Zhang, Z.J.; Yao, W.; Morrow, A.; Peng, Y.M. Variation of maternal milk adiponectin and itscorrelation with infant growth. Zhonghua Er Ke Za Zhi 2011, 49, 338–343. (In Chinese) [PubMed]
37. Mihalik, S.J.; Michaliszyn, S.F.; de las Heras, J.; Bacha, F.; Lee, S.; Chace, D.H.; de Jesus, V.R.; Vockley, J.;Arslanian, S.A. Metabolomic profiling of fatty acid and amino acid metabolism in youth with obesity andtype 2 diabetes: Evidence for enhanced mitochondrial oxidation. Diabetes Care 2012, 35, 605–611. [CrossRef][PubMed]
38. Kelley, D.E.; Mintun, M.A.; Watkins, S.C.; Simoneuau, J.A.; Jadali, F.; Fredrikson, A.; Beattie, J.; Theriault, R.The effect of non-insulin-dependent diabetes mellitus and obesity on glucose transport and phosphorylationin skeletal muscle. J. Clin. Investig. 1996, 97, 2705–2713. [CrossRef] [PubMed]
39. Xie, G.; Ma, X.; Zhao, A.; Wang, C.; Zhang, Y.; Nieman, D.; Nicholson, J.K.; Jia, W.; Bao, Y.; Jia, W. Themetabolite profiles of the obese population are gender-dependent. J. Proteome Res. 2014, 13, 4062–4073.[CrossRef] [PubMed]
40. Bachour, P.; Yafawi, R.; Jaber, F.; Choueiri, E.; Abdel-Razzak, Z. Effects of smoking, mother's age, body massindex, and parity number on lipid, protein, and secretory immunoglobulin a concentrations of human milk.Breastfeed. Med. 2012, 7, 179–188. [CrossRef] [PubMed]
41. Grote, V.; Verduci, E.; Scaglioni, S.; Vecchi, F.; Contarini, G.; Giovannini, M.; Koletzko, B.; Agostoni, C. Breastmilk composition and infant nutrient intakes during the first 12 months of life. Eur. J. Clin. Nutr. 2016, 70,250–256. [CrossRef] [PubMed]
42. Nommsen, L.A.; Lovelady, C.A.; Heinig, M.; Lonnerdal, B.; Dewey, K.G. Determinants of energy, protein,lipid, and lactose concentrations in human milk during the first 12 mo of lactation: The DARLING study.Amer. J. Clin. Nutr. 1991, 53, 457–465. [PubMed]
43. World Health Organization. Planning Guide for National Implementation of the Global Strategy for Infant andYoung Child Feeding; World Health Organization: Geneva, Switzerland, 2007.

Nutrients 2017, 9, 252 17 of 18
44. Mitoulas, L.R.; Kent, J.C.; Cox, D.B.; Owens, R.A.; Sherriff, J.L.; Hartmann, P.E. Variation in fat, lactose andprotein in human milk over 24 h and throughout the first year of lactation. Br. J. Nutr. 2002, 88, 29–37.[CrossRef] [PubMed]
45. Kuhn, N.; Lowenstein, J. Lactogenesis in the rat. Changes in metabolic parameters at parturition. Biochem. J.1967, 105, 995–1002. [CrossRef] [PubMed]
46. R Core Team. A Language and Environment for Statistical Computing; R Foundation for Statistical Computing:Vienna, Austria, 2014.
47. Pinheiro, J.B.; Bates, D.; DebRoy, S.; Sarkar, D.; R Development Core Team. nlme: Linear and NonlinearMixed Effects Models. R Package Version 3.1-12. 2016. Available online: http://CRAN.R-project.org/package=nlme (accessed on 20 May 2016).
48. Sarkar, D. Lattice: Multivariate Data Visualization With R; Springer: New York, NY, USA, 2008.49. Neuwirth, E. Rcolorbrewer: Colorbrewer Palettes. Version 1.1-2. Available online: https://CRAN.R-project.
org/package=RColorBrewer (accessed on 6 January 2017).50. Faul, F.; Erdfelder, E.; Buchner, A.; Lang, A.-G. Statistical power analyses using g*power 3.1: Tests for
correlation and regression analyses. Behav. Res. Methods 2009, 41, 1149–1160. [CrossRef] [PubMed]51. Diggle, P.J.; Heagerty, P.J.; Liang, K.-Y.; Zeger, S.L. Analysis of Longitudinal Data; Oxford University Press Inc.:
New York, NY, USA, 2002.52. World Health Organization. Obesity: Preventing and Managing the Global Epidemic. Report of a WHO
Consultation; WHO Technical Report Series 894; WHO: Geneva, Switzerland, 2000.53. Gallagher, D.; Heymsfield, S.B.; Heo, M.; Jebb, S.A.; Murgatroyd, P.R.; Sakamoto, Y. Healthy percentage body
fat ranges: An approach for developing guidelines based on body mass index. Am. J. Clin. Nutr. 2000, 72,694–701. [PubMed]
54. Woo, J.; Guerrero, M.; Guo, F.; Martin, L.; Davidson, B.; Ortega, H.; Ruiz-Palacios, G.; Morrow, A. Humanmilk adiponectin affects infant weight trajectory during the second year of life. J. Pediatr. Gastroenterol. Nutr.2012, 54, 532–539. [CrossRef] [PubMed]
55. Luque, V.; Closa-Monasterolo, R.; Escribano, J.; Ferre, N. Early programming by protein intake: The effect ofprotein on adiposity development and the growth and functionality of vital organs. Nutr. Metab. Insights2015, 8, 49–56. [CrossRef] [PubMed]
56. Oliver, P.; Pico, C.; de Matteis, R.; Cinti, S.; Palou, A. Perinatal expression of leptin in rat stomach. Dev. Dyn.Off. Publ. Am. Assoc. Anat. 2002, 223, 148–154. [CrossRef] [PubMed]
57. Bouret, S.G.; Draper, S.J.; Simerly, R.B. Formation of projection pathways from the arcuate nucleus ofthe hypothalamus to hypothalamic regions implicated in the neural control of feeding behavior in mice.J. Neurosci. Off. J. Soc. Neurosci. 2004, 24, 2797–2805. [CrossRef] [PubMed]
58. Fields, D.; Demerath, E. Relationship of insulin, glucose, leptin, IL-6 and TNF-a in human breast milk withinfant growth and body composition. Pediatr. Obes. 2012, 7, 304–312. [CrossRef] [PubMed]
59. Savino, F.; Costamagna, M.; Prino, A.; Oggero, R.; Silvestro, L. Leptin levels in breast-fed and formula-fedinfants. Acta Pediatr. 2002, 91, 897–902. [CrossRef]
60. Savino, F.; Liguori, S.; Fissore, M.; Palumeri, E.; Calabrese, R.; Oggero, R.; Silvestro, L.; Miniero, R. Lookingfor a relation between serum leptin concentration and body composition parameters in healthy term infantsin the first 6 months of life. J. Pediatr. Gastroenterol. Nutr. 2008, 46, 348–351. [CrossRef] [PubMed]
61. Kent, J.; Hepworth, A.; Sherriff, J.; Cox, D.; Mitoulas, L.; Hartmann, P. Longitudinal changes in breastfeedingpatterns from 1 to 6 months of lactation. Breastfeed. Med. 2013, 8, 401–407. [CrossRef] [PubMed]
62. Twigger, A.J.; Hepworth, A.R.; Lai, C.T.; Chetwynd, E.; Stuebe, A.M.; Blancafort, P.; Hartmann, P.E.;Geddes, D.T.; Kakulas, F. Gene expression in breastmilk cells is associated with maternal and infantcharacteristics. Sci. Rep. 2015, 5, 12933. [CrossRef] [PubMed]
63. Quinn, E.A.; Largado, F.; Borja, J.B.; Kuzawa, C.W. Maternal characteristics associated with milk leptincontent in a sample of filipino women and associations with infant weight for age. J. Hum. Lact. 2015, 31,273–281. [CrossRef] [PubMed]
64. Uysal, F.; Onal, E.; Aral, Y.; Adam, B.; Dilmen, U.; Ardicolu, Y. Breast milk leptin: Its relationship to maternaland infant adiposity. Clin. Nutr. 2002, 21, 157–160. [CrossRef] [PubMed]
Nutrients 2017, 9, 252 18 of 18
65. Khodabakhshi, A.; Ghayour-Mobarhan, M.; Rooki, H.; Vakili, R.; Hashemy, S.-I.; Mirhafez, S.R.;Shakeri, M.-T.; Kashanifar, R.; Pourbafarani, R.; Mirzaei, H.; et al. Comparative measurement of ghrelin,leptin, adiponectin, EGF and IGF-1 in breast milk of mothers with overweight/obese and normal-weightinfants. Eur. J. Clin. Nutr. 2015, 69, 614–618. [CrossRef] [PubMed]
66. Anderson, J.; McKinley, K.; Onugha, J.; Duazo, P.; Chernoff, M.; Quinn, E.A. Lower levels of human milkadiponectin predict offspring weight for age: A study in a lean population of Filipinos. Matern. Child Nutr.2016, 12, 790–800. [CrossRef] [PubMed]
67. Meyer, D.M.; Brei, C.; Stecher, L.; Much, D.; Brunner, S.; Hauner, H. The relationship between breast milkleptin and adiponectin with child body composition from 3 to 5 years: A follow-up study. Pediatr. Obes. 2016,1–5. [CrossRef] [PubMed]
68. Bieswal, F.; Ahn, M.T.; Reusens, B.; Holvoet, P.; Raes, M.; Rees, W.D.; Remacle, C. The importance of catch-upgrowth after early malnutrition for the programming of obesity in male rat. Obesity 2006, 14, 1330–1343.[CrossRef] [PubMed]
69. Gridneva, Z.; Kugananthan, S.; Hepworth, A.R.; Tie, W.J.; Lai, C.T.; Ward, L.C.; Hartmann, P.E.; Geddes, D.T.Effect of human milk appetite hormones, macronutrients, and infant characteristics on gastric emptying andbreastfeeding patterns of term fully breastfed infants. Nutrients 2017, 9, 15. [CrossRef] [PubMed]
70. De Luca, A.; Hankard, R.; Alexandre-Gouabau, M.C.; Ferchaud-Roucher, V.; Darmaun, D.; Boquien, C.Y.Higher concentrations of branched-chain amino acids in breast milk of obese mothers. Nutrition 2016, 32,1295–1298. [CrossRef] [PubMed]
71. Ballard, O.; Morrow, A.L. Human milk composition: Nutrients and bioactive factors. Pediatr. Clin. North Am.2013, 60, 49–74. [CrossRef] [PubMed]
72. Michaelsen, K.F.; Larsen, P.S.; Thomsen, B.L.; Samuelson, G. The Copenhagen cohort study on infantnutrition and growth: Breast-milk intake, human milk macronutrient content, and influencing factors. Am. J.Clin. Nutr. 1994, 59, 600–611. [PubMed]
73. Makinde, A.O.; Kantor, P.; Lopaschuk, G. Maturation of Fatty Acid and Carbohydrate Metabolism in theNewborn Heart. In Molecular and Cellular Effects of Nutrition on Disease Processes; Pierce, G., Izumi, T.,Rupp, H., Grynberg, A., Eds.; Springer: New York, NY, USA, 1998; Volume 26, pp. 49–56.
74. Martin, C.R.; Ling, P.R.; Blackburn, G.L. Review of infant feeding: Key features of breast milk and infantformula. Nutrients 2016, 8, 279. [CrossRef] [PubMed]
75. Karatas, Z.; Aydogdu, S.D.; Dinleyici, E.C.; Colak, O.; Dogruel, N. Breastmilk ghrelin, leptin, and fat levelschanging foremilk to hindmilk: Is that important for self-control of feeding? Eur. J. Pediatr. 2011, 170,1273–1280. [CrossRef] [PubMed]
76. Andreas, N.J.; Hyde, M.J.; Herbert, B.R.; Jeffries, S.; Santhakumaran, S.; Mandalia, S.; Holmes, E.; Modi, N.Impact of maternal BMI and sampling strategy on the concentration of leptin, insulin, ghrelin and resistinin breast milk across a single feed: A longitudinal cohort study. BMJ Open 2016, 6, e010778. [CrossRef][PubMed]
77. Kent, J.C. How breastfeeding works. J. Midwifery Womens Health 2007, 52, 564–570. [CrossRef] [PubMed]
© 2017 by the authors. Licensee MDPI, Basel, Switzerland. This article is an open accessarticle distributed under the terms and conditions of the Creative Commons Attribution(CC BY) license (http://creativecommons.org/licenses/by/4.0/).