associations among 25-year trends in diet, cholesterol and ... · cholesterol and body mass index...
TRANSCRIPT
Johansson et al. Nutrition Journal 2012, 11:40http://www.nutritionj.com/content/11/1/40
RESEARCH Open Access
Associations among 25-year trends in diet,cholesterol and BMI from 140,000 observations inmen and women in Northern SwedenIngegerd Johansson1*, Lena Maria Nilsson2, Birgitta Stegmayr3, Kurt Boman2,4, Göran Hallmans2
and Anna Winkvist5
Abstract
Background: In the 1970s, men in northern Sweden had among the highest prevalences of cardiovascular diseases(CVD) worldwide. An intervention program combining population- and individual-oriented activities was initiated in1985. Concurrently, collection of information on medical risk factors, lifestyle and anthropometry started. Today,these data make up one of the largest databases in the world on diet intake in a population-based sample, both interms of sample size and follow-up period. The study examines trends in food and nutrient intake, serumcholesterol and body mass index (BMI) from 1986 to 2010 in northern Sweden.
Methods: Cross-sectional information on self-reported food and nutrient intake and measured body weight, height,and serum cholesterol were compiled for over 140,000 observations. Trends and trend breaks over the 25-yearperiod were evaluated for energy-providing nutrients, foods contributing to fat intake, serum cholesterol and BMI.
Results: Reported intake of fat exhibited two significant trend breaks in both sexes: a decrease between 1986 and1992 and an increase from 2002 (women) or 2004 (men). A reverse trend was noted for carbohydrates, whereasprotein intake remained unchanged during the 25-year period. Significant trend breaks in intake of foodscontributing to total fat intake were seen. Reported intake of wine increased sharply for both sexes (more so forwomen) and export beer increased for men. BMI increased continuously for both sexes, whereas serum cholesterollevels decreased during 1986 - 2004, remained unchanged until 2007 and then began to rise. The increase in serumcholesterol coincided with the increase in fat intake, especially with intake of saturated fat and fats for spreading onbread and cooking.
Conclusions: Men and women in northern Sweden decreased their reported fat intake in the first 7 years (1986–1992) of an intervention program. After 2004 fat intake increased sharply for both genders, which coincided withintroduction of a positive media support for low carbohydrate-high-fat (LCHF) diet. The decrease and followingincrease in cholesterol levels occurred simultaneously with the time trends in food selection, whereas a constantincrease in BMI remained unaltered. These changes in risk factors may have important effects on primary andsecondary prevention of cardiovascular disease (CVD).
Keywords: Diet, Fat, Alcohol, Cholesterol, BMI, Tme trend, Sweden
* Correspondence: [email protected] of Odontology, Umeå University, 901 87, Umeå, SwedenFull list of author information is available at the end of the article
© 2012 Johansson et al.; licensee BioMed Central Ltd. This is an Open Access article distributed under the terms of theCreative Commons Attribution License (http://creativecommons.org/licenses/by/2.0), which permits unrestricted use,distribution, and reproduction in any medium, provided the original work is properly cited.
Johansson et al. Nutrition Journal 2012, 11:40 Page 2 of 13http://www.nutritionj.com/content/11/1/40
IntroductionIn the 1970s it was noted that the prevalence of cardio-vascular diseases (CVD) was higher in the Västerbottenarea in northern Sweden than elsewhere in the country[1]. In fact, it was among the highest among men in theworld [2]. Therefore, in 1985 a community-based pre-vention programme was initiated in the municipality ofNorsjö, Västerbotten county. The program was laterextended to the entire county [3]. The VästerbottenIntervention Programme (VIP), which still runs, thencombined population-oriented activities, such as a foodlabelling system, health information meetings, cookingdemonstrations, and individual-oriented activities, suchas offering health examinations and counselling to inha-bitants when they turned 30, 40, 50 and 60 years of age[4,5]. Intervention on diet was a central componentthroughout the program. Concurrently, Västerbottenand Norrbotten, the two northern-most counties ofSweden, joined the WHO MONICA Project (Multi-national Monitoring of Trends and Determinants in Car-diovascular Diseases) [6]. Data collection within VIP andMONICA was harmonized to allow for comparisons andcollaborative evaluations.Changes in lifestyle factors during 1986 – 1999 have
been reported from the MONICA surveys [7-9]. It wasnoted that the use of butter and high-fat milk declinedin favour of low-fat margarine and low-fat milk pro-ducts. Among both men and women, the intake of alco-holic beverages increased. No change in leisure-timephysical activity was noted. Smoking declined, but use ofsnuff increased. During the same period, decreasingnumbers of fatal and non-fatal strokes and myocardialinfarctions were reported for the region as monitored bythe Northern Sweden MONICA study [10,11]. The asso-ciation between nutrition and health is complex. Itinvolves specific food components, interactions amongthose food components, and interactions with geneticfactors and individual needs. Early on, the ecologicalSeven Countries’ Study claimed that a substantial pro-portion of the regional variation in CVD mortality wasexplained by differences in intake of saturated andmonounsaturated fatty acids, and they pointed out thatmean levels of total cholesterol correlated with meanintakes of saturated fatty acids [12,13]. However, a recentreview on the role of fats and fatty acids on humanhealth concluded that the relationship is more complex[14]. Trans fatty acids increase the risk, fish or n-3 long-chain polyunsaturated fats decrease the risk, but the dataare conflicting or insufficient to convict or free total fatintake or other fat fractions with respect to CVD risk.Thus, further research is needed, especially focusing onlong-term dietary intake.Data from the Västerbotten Intervention Programme
and the Northern Sweden MONICA study together form
one of the largest diet databases in the world with thelongest follow up time on diet intake in a population-based sample. It has been used for several nested casereferent and cohort studies (e.g. [15-17]), ecological stud-ies in the European Prospective Investigation into Cancerand Nutrition (EPIC) and other consortia (e.g. [18-20]),and nutrient-gene interaction studies [20]. Here, we evalu-ate trends in food intake, serum cholesterol and BMI inpeople living in northern Sweden over the 25-year periodcovered by the database. This evaluation thus encom-passes periods of active intervention on diet and lifestyleand a period of increasing popularity and mass mediareports on the benefits of very-low-carbohydrate, high-fatdiets (LCHF) [21]. A main focus of this explorative studywas to evaluate if food selections, fat, carbohydrate andprotein intakes had stabilized at the improved levels seenduring the 1990s [7], and adhere to the recommendationsgiven by the Nordic Nutrition Recommendations or to theincreasing media support for high-fat, low-carbohydratediets that have received much coverage in recent years.
MethodsStudy cohortThe present study is based on the Northern Sweden Dietdatabase, which is formed by information from the parti-cipants in two population-based studies in NorthernSweden, i.e., the Västerbotten Intervention Programme(VIP) and the Northern Sweden MONICA study. Bothstudies had their first survey in 1986, and highly similarhealth survey procedures are used. At present, datathrough 2010 are included. All participants providedwritten informed consent, and the Regional Ethical Re-view Board of Northern Sweden approved both basicstudies and the present study.
The Västerbotten intervention programme (VIP)In VIP residents in the county of Västerbotten areinvited to participate in a health survey at their local pri-mary health care centre when they turn 40, 50 or 60years [5,22]. Prior to 1994, residents 30 years of age werealso invited, and some primary health care centres con-tinue to invite this age group.Participants were asked to fast for at least four hours
prior to the health survey visit. At the visit a diet and life-style questionnaire was answered, body measures weretaken, including weight and height, and blood was drawn.Participation rate has varied; it was 48–57% from 1991 to1995 and thereafter increased to around 70% from 2005and onwards. The lower participation rates in the earlieryears mainly reflect low rates among 30-year olds, who pri-marily were invited in the early years. Differences in socialcharacteristics and CVD risk factors between VIP partici-pants and regional population samples from a Population
Johansson et al. Nutrition Journal 2012, 11:40 Page 3 of 13http://www.nutritionj.com/content/11/1/40
and Housing Census screening [23] and the randomlyselected MONICA participants were marginal [24].
The Northern Sweden MONICA projectIn the MONICA project independent, cross-sectionalsamples are randomly selected from updated populationregisters for inhabitants in the counties of Västerbottenand Norrbotten every 4th to 5th year [6]. Sampling isstratified to include equal numbers by gender and10-year age groups (25–65 year olds in the 1986 and1990 surveys, thereafter the age range was 25–75 years).The present study involves survey data from 1986, 1990,1994, 1999, 2004 and 2009, and recall visits in 1999 ofparticipants from 1986, 1990 and 1994. Participationrates have varied between 69% and 81% by survey occa-sion. Survey procedures were as described for VIP, ex-cept for 1990 when a shortened diet questionnaire wasused. Minimal evidence of systematic differences insocio-demographic characteristics for participants overtime, or between participants and non-participants, hasbeen found [25,26].
Food intake measurementA semi-quantitative food frequency questionnaire (theNorthern Sweden Food Frequency Questionnaire (FFQ)was used to estimate dietary intake in both the VIP andMONICA projects [27]. In 1996, the originally 84-questionquestionnaire was reduced to a 64-question version in VIPfor financial reasons. However, intake frequencies werereported on an identical nine-level scale, and most ques-tions in the 64 FFQ-version were kept identical to that ofthe longer version. From 1992 the FFQ became opticallyreadable. In the present study only sections of foods, wherethe questions were identical in the two different versions,were studied. Four photos with increasing amounts ofmeat, vegetables and potato/rice/pasta were used to indi-cate portion sizes of these types of foods. For other foodseither gender and age-specific portion sizes or fixed sizes,such as for an apple or an egg, were used [27].Reported intake frequencies were transformed into
number of intakes per day, and energy and nutrient in-take was estimated by weighting reported intake fre-quencies with portion sizes and nutrient content fromthe database at the National Food Administration, Swe-den (www.slv.se) as described earlier [27].The Northern Sweden FFQ has been validated for sev-
eral nutrients, including energy, fat, protein, carbohydrate,fatty acids, phytosterols, vitamin and mineral estimates,against repeated 24-hour dietary records (24HR) and/orbiological markers [27-31]. The FFQ had high reproduci-bility, and in comparison with 24HR, acceptable rankingcapacity for energy and several nutrients, i.e. correlationcoefficients above 0.50 and intake ratios close to 1. Likeother dietary recording methods, underreporting in
relation to estimated basal metabolism was frequent [31].Further, gender and age group stratified ranking of indivi-duals into quintiles has been found similar when based onthe distributions of energy and nutrient intake estimatedby the longer and shorter FFQ version [29].
Alcohol intakeFor the present study three FFQ questions that wereidentical over the entire study period were used, i.e. in-take frequency of 3.5% alcohol (export) bear, wine andspirits.
Exclusion criteria for diet records, handling of missingvalues, and final study cohort for diet estimatesIn August 2010, the VIP cohort included food intake in-formation from 126,757 observations and the MONICAcohort information from 14,631 observations rendering141,388 observations in the Northern Sweden Diet data-base for the period 1986 to 2010 (Figure 1). Of these25% had participated twice and <0.1% three times. Thepresent study employed data from all observations, afterexclusion of 2,946 observations for participants olderthan 65 years, as being beyond the original inclusion agespan (Figure 1). The longer FFQ version had been usedin 35% and the shorter version in 65% of the employedobservations.Observations that had 10% or more unanswered FFQ
questions were excluded from all analyses on diet intake(n = 3,133). Observations where any of the three portion-size questions was unanswered and observations withextreme ratios between reported caloric intake and esti-mated basal metabolic rate (food intake level, FIL; [32]were also excluded (n = 8,719). Thus, observations withFIL values below the 1st or above the 99th percentilevalues, and subjects lacking information on body weightneeded for FIL calculation were excluded. This left afinal study cohort for analysis of trends in nutrient in-take of 126,590 observations (60,770 men and 65,820women), and in foods/food aggregates of 135,309 obser-vations (65,290 men and 70,019 women), and in medicaldata of 138,442 observations (66,977 men and 71,465women) (Figure 1).
Body mass index and cholesterol measuresBody weight and height were measured when the par-ticipant wore light clothes, but no shoes. Measurementswere done by trained nurses by use of standardizedweight and measuring scales. BMI was calculated asweight in kg/height in m2. A BMI could not be calcu-lated for 0.6% of the observations due to missing heightor weight. BMI values below 10 (23 observations) andabove 100 (3 observations), and one recording of aheight of 270 cm were excluded. In the final group the1st to 99th percentile values for BMI ranged from 18.8 to
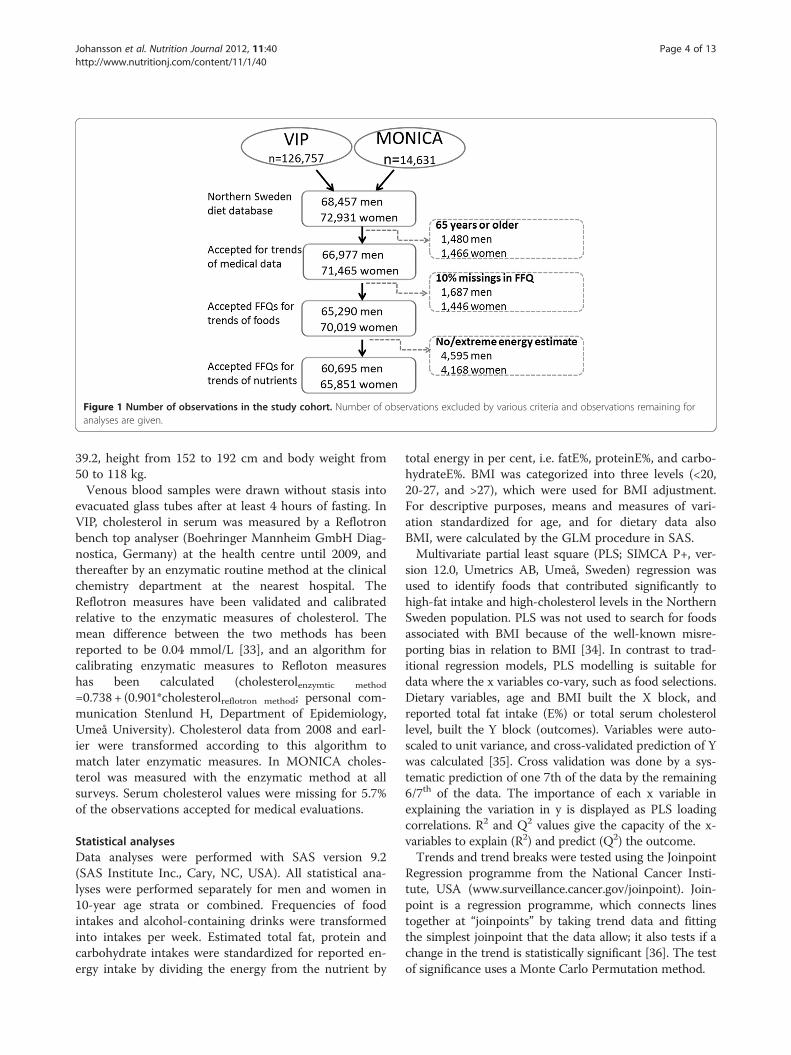
Figure 1 Number of observations in the study cohort. Number of observations excluded by various criteria and observations remaining foranalyses are given.
Johansson et al. Nutrition Journal 2012, 11:40 Page 4 of 13http://www.nutritionj.com/content/11/1/40
39.2, height from 152 to 192 cm and body weight from50 to 118 kg.Venous blood samples were drawn without stasis into
evacuated glass tubes after at least 4 hours of fasting. InVIP, cholesterol in serum was measured by a Reflotronbench top analyser (Boehringer Mannheim GmbH Diag-nostica, Germany) at the health centre until 2009, andthereafter by an enzymatic routine method at the clinicalchemistry department at the nearest hospital. TheReflotron measures have been validated and calibratedrelative to the enzymatic measures of cholesterol. Themean difference between the two methods has beenreported to be 0.04 mmol/L [33], and an algorithm forcalibrating enzymatic measures to Refloton measureshas been calculated (cholesterolenzymtic method
=0.738 + (0.901*cholesterolreflotron method; personal com-munication Stenlund H, Department of Epidemiology,Umeå University). Cholesterol data from 2008 and earl-ier were transformed according to this algorithm tomatch later enzymatic measures. In MONICA choles-terol was measured with the enzymatic method at allsurveys. Serum cholesterol values were missing for 5.7%of the observations accepted for medical evaluations.
Statistical analysesData analyses were performed with SAS version 9.2(SAS Institute Inc., Cary, NC, USA). All statistical ana-lyses were performed separately for men and women in10-year age strata or combined. Frequencies of foodintakes and alcohol-containing drinks were transformedinto intakes per week. Estimated total fat, protein andcarbohydrate intakes were standardized for reported en-ergy intake by dividing the energy from the nutrient by
total energy in per cent, i.e. fatE%, proteinE%, and carbo-hydrateE%. BMI was categorized into three levels (<20,20-27, and >27), which were used for BMI adjustment.For descriptive purposes, means and measures of vari-ation standardized for age, and for dietary data alsoBMI, were calculated by the GLM procedure in SAS.Multivariate partial least square (PLS; SIMCA P+, ver-
sion 12.0, Umetrics AB, Umeå, Sweden) regression wasused to identify foods that contributed significantly tohigh-fat intake and high-cholesterol levels in the NorthernSweden population. PLS was not used to search for foodsassociated with BMI because of the well-known misre-porting bias in relation to BMI [34]. In contrast to trad-itional regression models, PLS modelling is suitable fordata where the x variables co-vary, such as food selections.Dietary variables, age and BMI built the X block, andreported total fat intake (E%) or total serum cholesterollevel, built the Y block (outcomes). Variables were auto-scaled to unit variance, and cross-validated prediction of Ywas calculated [35]. Cross validation was done by a sys-tematic prediction of one 7th of the data by the remaining6/7th of the data. The importance of each x variable inexplaining the variation in y is displayed as PLS loadingcorrelations. R2 and Q2 values give the capacity of the x-variables to explain (R2) and predict (Q2) the outcome.Trends and trend breaks were tested using the Joinpoint
Regression programme from the National Cancer Insti-tute, USA (www.surveillance.cancer.gov/joinpoint). Join-point is a regression programme, which connects linestogether at “joinpoints” by taking trend data and fittingthe simplest joinpoint that the data allow; it also tests if achange in the trend is statistically significant [36]. The testof significance uses a Monte Carlo Permutation method.
Johansson et al. Nutrition Journal 2012, 11:40 Page 5 of 13http://www.nutritionj.com/content/11/1/40
Statistical tests were two-sided and p-values <0.05 wereconsidered statistically significant.
ResultsThe number of observations per year that were accept-able for analysis of trends in food intake ranged from3,292 to 9,883, except for 1986 and 1990 when only1,515 and 1,549 observations, respectively, were avail-able. The proportion of women ranged between 49.4%and 53.7% in the various study years. Due to the removalof a mandatory invitation to 30-year olds in VIP, thenumbers for 30-year-olds in 2000, 2001, 2003, 2006,2007, 2008 and 2010 ranged between 38 and 70 observa-tions, but in other years the numbers ranged from 310to 1,861. The 30-year-olds were kept in the data analysesas they were within the original inclusion age range.Filled symbols (means) in figures indicate years wherethe numbers exceed or are equal to 310. The numbersof observations per year used for nutrient intake evalua-tions were slightly fewer than those for food items ineach year for both genders and all 10-year age groups.
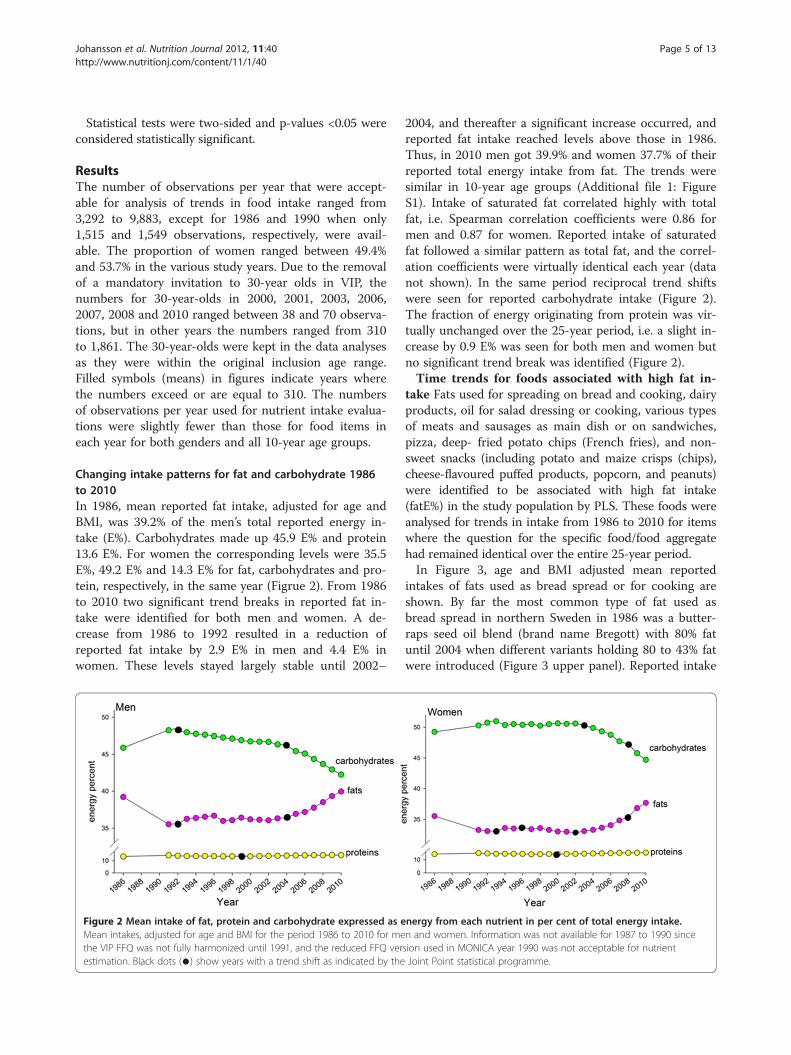
Changing intake patterns for fat and carbohydrate 1986to 2010In 1986, mean reported fat intake, adjusted for age andBMI, was 39.2% of the men’s total reported energy in-take (E%). Carbohydrates made up 45.9 E% and protein13.6 E%. For women the corresponding levels were 35.5E%, 49.2 E% and 14.3 E% for fat, carbohydrates and pro-tein, respectively, in the same year (Figrue 2). From 1986to 2010 two significant trend breaks in reported fat in-take were identified for both men and women. A de-crease from 1986 to 1992 resulted in a reduction ofreported fat intake by 2.9 E% in men and 4.4 E% inwomen. These levels stayed largely stable until 2002–
Figure 2 Mean intake of fat, protein and carbohydrate expressed as eMean intakes, adjusted for age and BMI for the period 1986 to 2010 for methe VIP FFQ was not fully harmonized until 1991, and the reduced FFQ verestimation. Black dots (●) show years with a trend shift as indicated by the
2004, and thereafter a significant increase occurred, andreported fat intake reached levels above those in 1986.Thus, in 2010 men got 39.9% and women 37.7% of theirreported total energy intake from fat. The trends weresimilar in 10-year age groups (Additional file 1: FigureS1). Intake of saturated fat correlated highly with totalfat, i.e. Spearman correlation coefficients were 0.86 formen and 0.87 for women. Reported intake of saturatedfat followed a similar pattern as total fat, and the correl-ation coefficients were virtually identical each year (datanot shown). In the same period reciprocal trend shiftswere seen for reported carbohydrate intake (Figure 2).The fraction of energy originating from protein was vir-tually unchanged over the 25-year period, i.e. a slight in-crease by 0.9 E% was seen for both men and women butno significant trend break was identified (Figure 2).Time trends for foods associated with high fat in-
take Fats used for spreading on bread and cooking, dairyproducts, oil for salad dressing or cooking, various typesof meats and sausages as main dish or on sandwiches,pizza, deep- fried potato chips (French fries), and non-sweet snacks (including potato and maize crisps (chips),cheese-flavoured puffed products, popcorn, and peanuts)were identified to be associated with high fat intake(fatE%) in the study population by PLS. These foods wereanalysed for trends in intake from 1986 to 2010 for itemswhere the question for the specific food/food aggregatehad remained identical over the entire 25-year period.In Figure 3, age and BMI adjusted mean reported
intakes of fats used as bread spread or for cooking areshown. By far the most common type of fat used asbread spread in northern Sweden in 1986 was a butter-raps seed oil blend (brand name Bregott) with 80% fatuntil 2004 when different variants holding 80 to 43% fatwere introduced (Figure 3 upper panel). Reported intake
nergy from each nutrient in per cent of total energy intake.n and women. Information was not available for 1987 to 1990 sincesion used in MONICA year 1990 was not acceptable for nutrientJoint Point statistical programme.
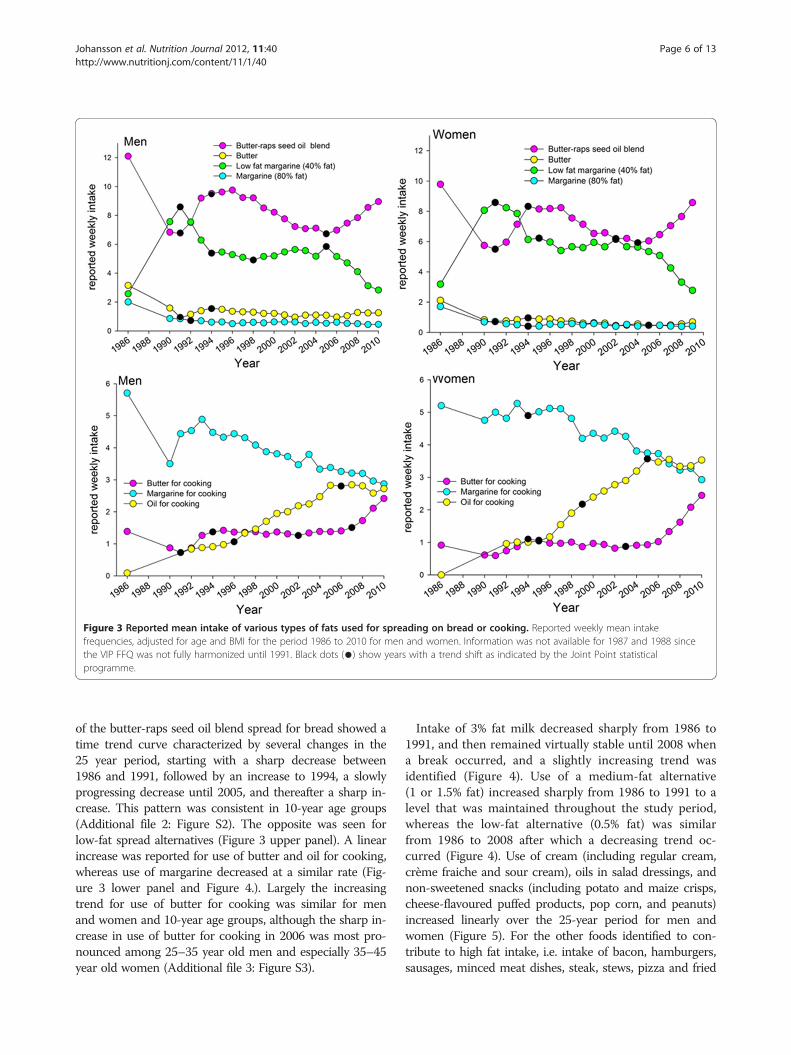
Figure 3 Reported mean intake of various types of fats used for spreading on bread or cooking. Reported weekly mean intakefrequencies, adjusted for age and BMI for the period 1986 to 2010 for men and women. Information was not available for 1987 and 1988 sincethe VIP FFQ was not fully harmonized until 1991. Black dots (●) show years with a trend shift as indicated by the Joint Point statisticalprogramme.
Johansson et al. Nutrition Journal 2012, 11:40 Page 6 of 13http://www.nutritionj.com/content/11/1/40
of the butter-raps seed oil blend spread for bread showed atime trend curve characterized by several changes in the25 year period, starting with a sharp decrease between1986 and 1991, followed by an increase to 1994, a slowlyprogressing decrease until 2005, and thereafter a sharp in-crease. This pattern was consistent in 10-year age groups(Additional file 2: Figure S2). The opposite was seen forlow-fat spread alternatives (Figure 3 upper panel). A linearincrease was reported for use of butter and oil for cooking,whereas use of margarine decreased at a similar rate (Fig-ure 3 lower panel and Figure 4.). Largely the increasingtrend for use of butter for cooking was similar for menand women and 10-year age groups, although the sharp in-crease in use of butter for cooking in 2006 was most pro-nounced among 25–35 year old men and especially 35–45year old women (Additional file 3: Figure S3).
Intake of 3% fat milk decreased sharply from 1986 to1991, and then remained virtually stable until 2008 whena break occurred, and a slightly increasing trend wasidentified (Figure 4). Use of a medium-fat alternative(1 or 1.5% fat) increased sharply from 1986 to 1991 to alevel that was maintained throughout the study period,whereas the low-fat alternative (0.5% fat) was similarfrom 1986 to 2008 after which a decreasing trend oc-curred (Figure 4). Use of cream (including regular cream,crème fraiche and sour cream), oils in salad dressings, andnon-sweetened snacks (including potato and maize crisps,cheese-flavoured puffed products, pop corn, and peanuts)increased linearly over the 25-year period for men andwomen (Figure 5). For the other foods identified to con-tribute to high fat intake, i.e. intake of bacon, hamburgers,sausages, minced meat dishes, steak, stews, pizza and fried
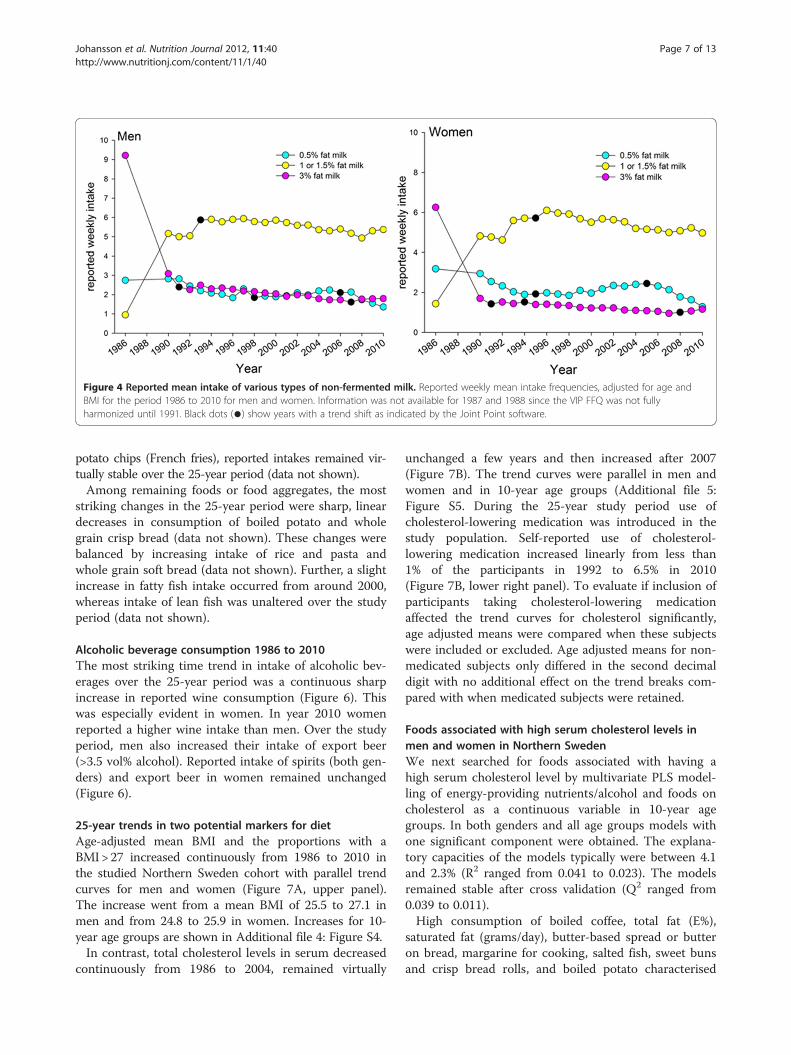
Figure 4 Reported mean intake of various types of non-fermented milk. Reported weekly mean intake frequencies, adjusted for age andBMI for the period 1986 to 2010 for men and women. Information was not available for 1987 and 1988 since the VIP FFQ was not fullyharmonized until 1991. Black dots (●) show years with a trend shift as indicated by the Joint Point software.
Johansson et al. Nutrition Journal 2012, 11:40 Page 7 of 13http://www.nutritionj.com/content/11/1/40
potato chips (French fries), reported intakes remained vir-tually stable over the 25-year period (data not shown).Among remaining foods or food aggregates, the most
striking changes in the 25-year period were sharp, lineardecreases in consumption of boiled potato and wholegrain crisp bread (data not shown). These changes werebalanced by increasing intake of rice and pasta andwhole grain soft bread (data not shown). Further, a slightincrease in fatty fish intake occurred from around 2000,whereas intake of lean fish was unaltered over the studyperiod (data not shown).
Alcoholic beverage consumption 1986 to 2010The most striking time trend in intake of alcoholic bev-erages over the 25-year period was a continuous sharpincrease in reported wine consumption (Figure 6). Thiswas especially evident in women. In year 2010 womenreported a higher wine intake than men. Over the studyperiod, men also increased their intake of export beer(>3.5 vol% alcohol). Reported intake of spirits (both gen-ders) and export beer in women remained unchanged(Figure 6).
25-year trends in two potential markers for dietAge-adjusted mean BMI and the proportions with aBMI> 27 increased continuously from 1986 to 2010 inthe studied Northern Sweden cohort with parallel trendcurves for men and women (Figure 7A, upper panel).The increase went from a mean BMI of 25.5 to 27.1 inmen and from 24.8 to 25.9 in women. Increases for 10-year age groups are shown in Additional file 4: Figure S4.In contrast, total cholesterol levels in serum decreased
continuously from 1986 to 2004, remained virtually
unchanged a few years and then increased after 2007(Figure 7B). The trend curves were parallel in men andwomen and in 10-year age groups (Additional file 5:Figure S5. During the 25-year study period use ofcholesterol-lowering medication was introduced in thestudy population. Self-reported use of cholesterol-lowering medication increased linearly from less than1% of the participants in 1992 to 6.5% in 2010(Figure 7B, lower right panel). To evaluate if inclusion ofparticipants taking cholesterol-lowering medicationaffected the trend curves for cholesterol significantly,age adjusted means were compared when these subjectswere included or excluded. Age adjusted means for non-medicated subjects only differed in the second decimaldigit with no additional effect on the trend breaks com-pared with when medicated subjects were retained.
Foods associated with high serum cholesterol levels inmen and women in Northern SwedenWe next searched for foods associated with having ahigh serum cholesterol level by multivariate PLS model-ling of energy-providing nutrients/alcohol and foods oncholesterol as a continuous variable in 10-year agegroups. In both genders and all age groups models withone significant component were obtained. The explana-tory capacities of the models typically were between 4.1and 2.3% (R2 ranged from 0.041 to 0.023). The modelsremained stable after cross validation (Q2 ranged from0.039 to 0.011).High consumption of boiled coffee, total fat (E%),
saturated fat (grams/day), butter-based spread or butteron bread, margarine for cooking, salted fish, sweet bunsand crisp bread rolls, and boiled potato characterised
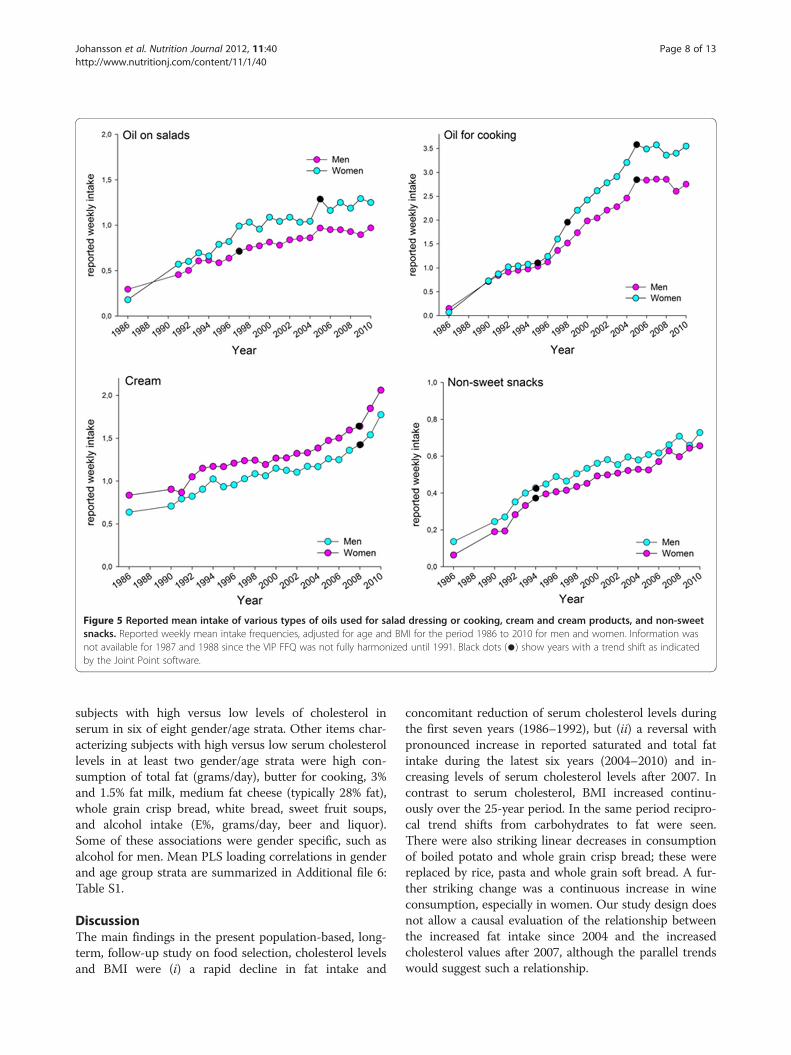
Figure 5 Reported mean intake of various types of oils used for salad dressing or cooking, cream and cream products, and non-sweetsnacks. Reported weekly mean intake frequencies, adjusted for age and BMI for the period 1986 to 2010 for men and women. Information wasnot available for 1987 and 1988 since the VIP FFQ was not fully harmonized until 1991. Black dots (●) show years with a trend shift as indicatedby the Joint Point software.
Johansson et al. Nutrition Journal 2012, 11:40 Page 8 of 13http://www.nutritionj.com/content/11/1/40
subjects with high versus low levels of cholesterol inserum in six of eight gender/age strata. Other items char-acterizing subjects with high versus low serum cholesterollevels in at least two gender/age strata were high con-sumption of total fat (grams/day), butter for cooking, 3%and 1.5% fat milk, medium fat cheese (typically 28% fat),whole grain crisp bread, white bread, sweet fruit soups,and alcohol intake (E%, grams/day, beer and liquor).Some of these associations were gender specific, such asalcohol for men. Mean PLS loading correlations in genderand age group strata are summarized in Additional file 6:Table S1.
DiscussionThe main findings in the present population-based, long-term, follow-up study on food selection, cholesterol levelsand BMI were (i) a rapid decline in fat intake and
concomitant reduction of serum cholesterol levels duringthe first seven years (1986–1992), but (ii) a reversal withpronounced increase in reported saturated and total fatintake during the latest six years (2004–2010) and in-creasing levels of serum cholesterol levels after 2007. Incontrast to serum cholesterol, BMI increased continu-ously over the 25-year period. In the same period recipro-cal trend shifts from carbohydrates to fat were seen.There were also striking linear decreases in consumptionof boiled potato and whole grain crisp bread; these werereplaced by rice, pasta and whole grain soft bread. A fur-ther striking change was a continuous increase in wineconsumption, especially in women. Our study design doesnot allow a causal evaluation of the relationship betweenthe increased fat intake since 2004 and the increasedcholesterol values after 2007, although the parallel trendswould suggest such a relationship.
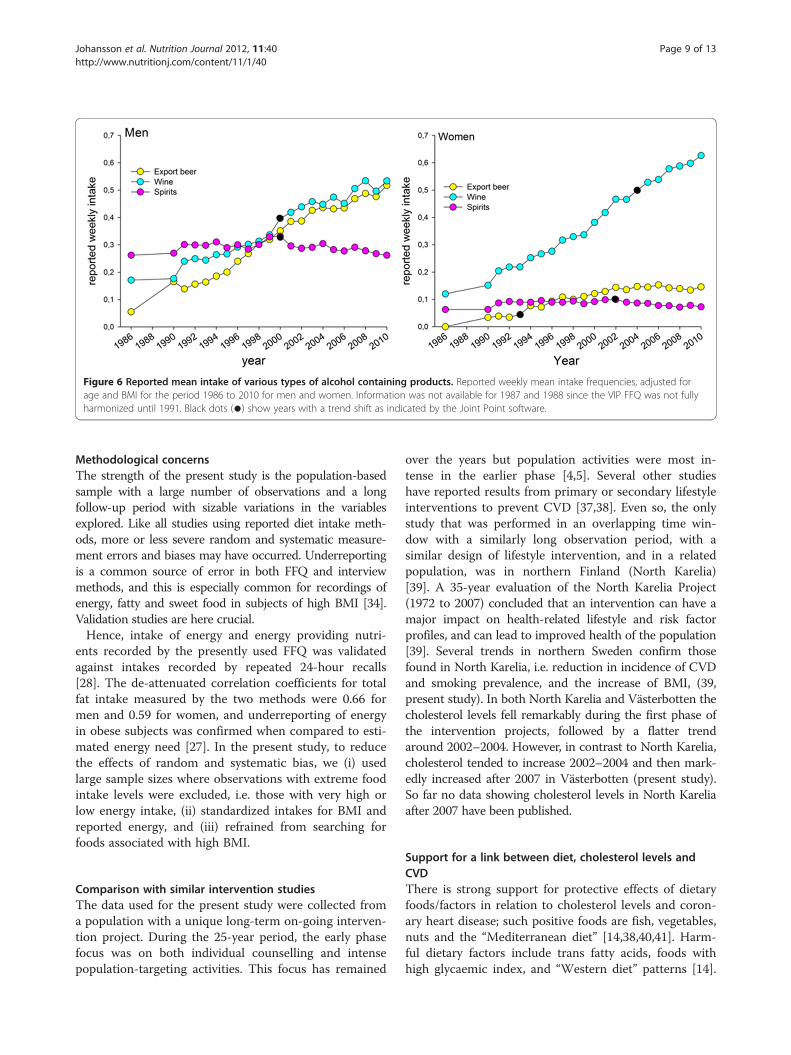
Figure 6 Reported mean intake of various types of alcohol containing products. Reported weekly mean intake frequencies, adjusted forage and BMI for the period 1986 to 2010 for men and women. Information was not available for 1987 and 1988 since the VIP FFQ was not fullyharmonized until 1991. Black dots (●) show years with a trend shift as indicated by the Joint Point software.
Johansson et al. Nutrition Journal 2012, 11:40 Page 9 of 13http://www.nutritionj.com/content/11/1/40
Methodological concernsThe strength of the present study is the population-basedsample with a large number of observations and a longfollow-up period with sizable variations in the variablesexplored. Like all studies using reported diet intake meth-ods, more or less severe random and systematic measure-ment errors and biases may have occurred. Underreportingis a common source of error in both FFQ and interviewmethods, and this is especially common for recordings ofenergy, fatty and sweet food in subjects of high BMI [34].Validation studies are here crucial.Hence, intake of energy and energy providing nutri-
ents recorded by the presently used FFQ was validatedagainst intakes recorded by repeated 24-hour recalls[28]. The de-attenuated correlation coefficients for totalfat intake measured by the two methods were 0.66 formen and 0.59 for women, and underreporting of energyin obese subjects was confirmed when compared to esti-mated energy need [27]. In the present study, to reducethe effects of random and systematic bias, we (i) usedlarge sample sizes where observations with extreme foodintake levels were excluded, i.e. those with very high orlow energy intake, (ii) standardized intakes for BMI andreported energy, and (iii) refrained from searching forfoods associated with high BMI.
Comparison with similar intervention studiesThe data used for the present study were collected froma population with a unique long-term on-going interven-tion project. During the 25-year period, the early phasefocus was on both individual counselling and intensepopulation-targeting activities. This focus has remained
over the years but population activities were most in-tense in the earlier phase [4,5]. Several other studieshave reported results from primary or secondary lifestyleinterventions to prevent CVD [37,38]. Even so, the onlystudy that was performed in an overlapping time win-dow with a similarly long observation period, with asimilar design of lifestyle intervention, and in a relatedpopulation, was in northern Finland (North Karelia)[39]. A 35-year evaluation of the North Karelia Project(1972 to 2007) concluded that an intervention can have amajor impact on health-related lifestyle and risk factorprofiles, and can lead to improved health of the population[39]. Several trends in northern Sweden confirm thosefound in North Karelia, i.e. reduction in incidence of CVDand smoking prevalence, and the increase of BMI, (39,present study). In both North Karelia and Västerbotten thecholesterol levels fell remarkably during the first phase ofthe intervention projects, followed by a flatter trendaround 2002–2004. However, in contrast to North Karelia,cholesterol tended to increase 2002–2004 and then mark-edly increased after 2007 in Västerbotten (present study).So far no data showing cholesterol levels in North Kareliaafter 2007 have been published.
Support for a link between diet, cholesterol levels andCVDThere is strong support for protective effects of dietaryfoods/factors in relation to cholesterol levels and coron-ary heart disease; such positive foods are fish, vegetables,nuts and the “Mediterranean diet” [14,38,40,41]. Harm-ful dietary factors include trans fatty acids, foods withhigh glycaemic index, and “Western diet” patterns [14].
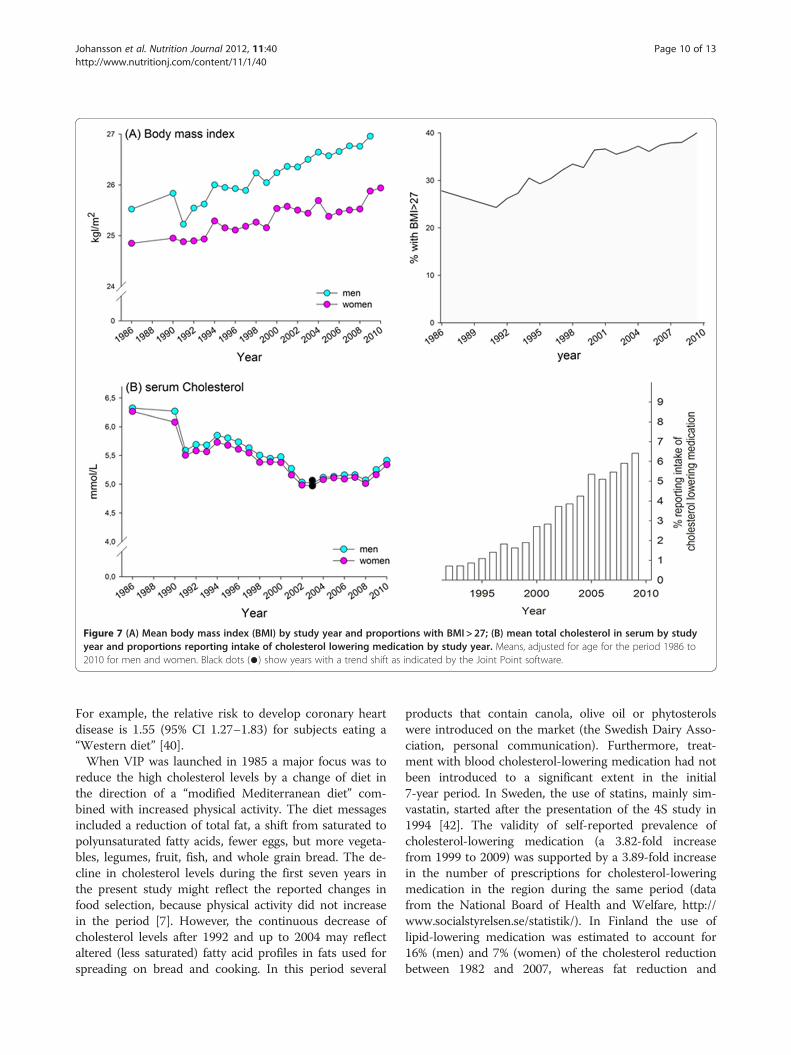
Figure 7 (A) Mean body mass index (BMI) by study year and proportions with BMI > 27; (B) mean total cholesterol in serum by studyyear and proportions reporting intake of cholesterol lowering medication by study year. Means, adjusted for age for the period 1986 to2010 for men and women. Black dots (●) show years with a trend shift as indicated by the Joint Point software.
Johansson et al. Nutrition Journal 2012, 11:40 Page 10 of 13http://www.nutritionj.com/content/11/1/40
For example, the relative risk to develop coronary heartdisease is 1.55 (95% CI 1.27–1.83) for subjects eating a“Western diet” [40].When VIP was launched in 1985 a major focus was to
reduce the high cholesterol levels by a change of diet inthe direction of a “modified Mediterranean diet” com-bined with increased physical activity. The diet messagesincluded a reduction of total fat, a shift from saturated topolyunsaturated fatty acids, fewer eggs, but more vegeta-bles, legumes, fruit, fish, and whole grain bread. The de-cline in cholesterol levels during the first seven years inthe present study might reflect the reported changes infood selection, because physical activity did not increasein the period [7]. However, the continuous decrease ofcholesterol levels after 1992 and up to 2004 may reflectaltered (less saturated) fatty acid profiles in fats used forspreading on bread and cooking. In this period several
products that contain canola, olive oil or phytosterolswere introduced on the market (the Swedish Dairy Asso-ciation, personal communication). Furthermore, treat-ment with blood cholesterol-lowering medication had notbeen introduced to a significant extent in the initial7-year period. In Sweden, the use of statins, mainly sim-vastatin, started after the presentation of the 4S study in1994 [42]. The validity of self-reported prevalence ofcholesterol-lowering medication (a 3.82-fold increasefrom 1999 to 2009) was supported by a 3.89-fold increasein the number of prescriptions for cholesterol-loweringmedication in the region during the same period (datafrom the National Board of Health and Welfare, http://www.socialstyrelsen.se/statistik/). In Finland the use oflipid-lowering medication was estimated to account for16% (men) and 7% (women) of the cholesterol reductionbetween 1982 and 2007, whereas fat reduction and
Johansson et al. Nutrition Journal 2012, 11:40 Page 11 of 13http://www.nutritionj.com/content/11/1/40
altered fatty acid composition was estimated to accountfor 65% and 60% of the reduction for men and women,respectively [43]. Similar evaluations, including CVD riskprediction in light of the changing eating habits, choles-terol levels and BMI, is planned in the Västerbottenpopulation, too.
The unexpected rise of dietary fat intake and cholesterollevels in recent yearsUp to 2004, our hypothesis of a stable low level of diet-ary intake of fats, concurrent with low serum cholesterollevels, compared to initial levels in 1986, was indeedproven correct. Surprisingly, in 2004 a pronounced in-crease in fat intake was noted and after 2007, cholesterollevels began to increase steadily in both sexes. In paral-lel, the very-low-carbohydrate and high-fat diets (LCHF[21], i.e. not the traditional reduction of carbohydratesand fat to reduce overall energy intake) became recog-nized and increasingly popular as a means to lose weightand control blood glucose levels among type-2 diabeticsin Sweden. A transition in food selection is now indi-cated by the present results, local reports of buttershortage in the stores and increased trade of high-fatalternatives (the Swedish Board of Agriculture, www.sjv.se). Notably, the increased fat intake was not associatedwith any reduction or stagnation of the increasing levelsof BMI in the northern Sweden population, even thoughseveral studies indicate positive effects of LCHF, i.e. weightloss in a short-term perspective [44,45]. However, evi-dence for weight loss effects beyond six months is lacking[44,45], and long-term safety is controversial, i.e. somestudies report adverse health effects [41,46-49] and othersdo not [50]. Hence, the dietary guidelines of the NationalFood Administration of Sweden [51], like most other diet-ary guidelines [14,52], do not support diets with a total fatcontent exceeding 30–35 E% for these purposes.Evaluations of 14 randomized trials of statins have con-
cluded that a reduction of LDL cholesterol by 1 mmol/Lleads to a 12% reduction in all-cause mortality and a 19%reduction in CHD mortality [53]. Hence, not surprisingly,the promising decline in CHD mortality over the past 20years has been attributed mainly to healthful changes inblood cholesterol, triglycerides, smoking and hypertension[54]. The decrease in cholesterol alone explained 39% ofthe mortality reduction [54,55]. Thus, the upward ten-dency from 2004 and the marked increase of cholesterolafter 2007 is a deep concern for both primary and second-ary CHD prevention. The long-term deleterious effects ofa high blood cholesterol level seem to be neglected in thepopulation and media, and the interest is centred on dietsthat promise rapid weight loss [44,49]. For the individualstanding on the bathroom scale an increase in blood chol-esterol may be overlooked, because it will only be detectedby measurements at a medical centre.
In conclusion, men and women in northern Swedendecreased their reported intake of total and saturated fatin the first years following the introduction of an inter-vention programme, but after 2004 fat intake increased,especially saturated fat and butter-based spread forbread and butter for cooking. Supportive opinions inmedia for high-fat diets seem to have had an impact onconsumer behaviour. Initially beneficial and thereafterdeleterious changes in blood cholesterol paralleled thesetrends in food selection, whereas a claimed weight re-duction by high-fat diets was not seen in the most re-cent years. In contrast, BMI increased continuously overthe 25-year period. These changes in risk factors mayhave important effects on primary and secondary pre-vention of CVD.
Additional files
Additional file 1: Figure S1. Mean intake of fat expressed as energyfrom fat in per cent of total energy intake in age groups by study year.Means, adjusted for BMI for each 10-year age group for men and womenfor the period 1986 to 2010. Information was not available for 1987 to1989 since the VIP FFQ was not fully harmonized until 1991, and thereduced FFQ version used in MONICA year 1990 was not acceptable fornutrient estimation. Black dots (●) show years with a trend shift asindicated by the Joint Point software. Unfilled circles indicate 30-year oldswith low number in the age group, i.e. <310 subjects.
Additional file 2: Figure S2. Use of the butter-raps seed oil blend forspreading on bread in age groups by study year. Reported weekly meanintakes, adjusted for BMI for each 10-year age group for men andwomen for the period 1986 to 2010. Information was not available for1987 to 1989 since the VIP FFQ was not fully harmonized until 1991.Black dots (●) show years with a trend shift as indicated by the JointPoint software. Unfilled circles indicate 30-year olds with low number inthe age group, i.e. <310 subjects.
Additional file 3: Figure S3. Use of butter for cooking in age groupsby study year. Reported weekly mean intakes, adjusted for BMI for each10-year age group for men and women for the period 1986 to 2010.Information was not available for 1987 to 1989 since the VIP FFQ was notfully harmonized until 1991. Black dots (●) show years with a trend shiftas indicated by the Joint Point software. Unfilled circles indicate 30-yearolds with low number in the age group, i.e. <310 subjects.
Additional file 4: Figure S4. Mean BMI in 10-year age groups by studyyear.
Additional file 5: Figure S5. Mean serum cholesterol in 10-year agegroups by study year. Unfilled circles indicate 30-year olds with lownumber in the age group, i.e. <310 subjects.
Additional file 6: Table S1. Foods and energy-providing nutrientssignificantly associated with having high cholesterol levels. PLS loadings(w*c[1]) for variables in the x-block (see statistics section) where 95% CIsfor mean loading plot correlations do not include 0 (zero) in PLS modelswith cholesterol as a continuous variable. Foods that were significantlyassociated in at least two age groups per gender are shown.
Competing interestsThe authors declare that they have no competing interests.
Authors’ contributionsIJ and AW designed the project. IJ was responsible for data processing andmanuscript drafting. BS, KB and GH supported data supply from VIP andMONICA. All authors contributed to manuscript writing, and read andapproved the final manuscript.
Johansson et al. Nutrition Journal 2012, 11:40 Page 12 of 13http://www.nutritionj.com/content/11/1/40
Author details1Department of Odontology, Umeå University, 901 87, Umeå, Sweden.2Department of Public Health and Clinical Medicine section of nutrition,Umeå University, Umeå, Sweden. 3The National Board of Welfare, Stockholm,Sweden. 4Department of Medicine, Skellefteå County Hospital, Skellefteå,Sweden. 5Department of Internal Medicine and Clinical Nutrition, TheSahlgrenska Academy, University of Gothenburg, Göteborg, Sweden.
Received: 28 January 2012 Accepted: 1 May 2012Published: 11 June 2012
References1. Wall S, Rosén M, Nyström L: The Swedish mortality pattern: a basis for
health planning? Int J Epidemiol 1985, 14:285–292.2. Tuomilehto J, Kuulasmaa K, Torppa J: WHO MONICA Project: geographic
variation in mortality from cardiovascular diseases. Baseline data onselected population characteristics and cardiovascular mortality. WorldHealth Stat Q 1987, 40:171–184.
3. Weinehall L, Hellsten G, Boman K, Hallmans G: Prevention ofcardiovascular disease in Sweden: the Norsjö community interventionprogramme - motives, methods and intervention components. Scand JPublic Health Suppl 2001, 56:13–20.
4. Brännström I, Weinehall L, Persson LÅ, Wester PO, Wall S: Changing socialpatterns of risk factors for cardiovascular disease in a Swedishcommunity intervention project. Int J Epidemiol 1993, 22:1026–1037.
5. Weinehall L: Partnership for health. On the role of primary health care in acommunity intervention programme. Umeå University Medical DissertationsNew Series No. 531. Umeå: Umeå University, Department of Epidemiologyand Public Health, and Department of Family Medicine; 1997.
6. Stegmayr B, Lundberg V, Asplund K: The events registration and surveyprocedures in the Northern Sweden MONICA Project. Scand J PublicHealth 2003, 31(Suppl 61):9–17.
7. Lindahl B, Stegmayr B, Johansson I, Weinehall L, Hallmans G: Trendsin lifestyle 1986-99 in a 25- to 64-year-old population of theNorthern Sweden MONICA project. Scand J Public Health 2003, 31(Suppl. 61):31–37.
8. Stegmayr B, Eliasson M, Rodu B: The decline of smoking in northernSweden. Scand J Public Health 2005, 33:321–324. discussion 243.
9. Eliasson M, Janlert U, Jansson JH, Stegmayr B: Time trends in populationcholesterol levels 1986–2004: influence of lipid-lowering drugs, obesity,smoking and educational level. The northern Sweden MONICA study.J Intern Med 2006, 260:551–559.
10. Stegmayr B, Asplund K, Wester PO: Trends in incidence, case-fatality rate,and severity of stroke in northern Sweden, 1985–1991. Stroke 1994,25:1738–1745.
11. Peltonen M, Lundberg V, Huhtasaari F, Asplund K: Marked improvement insurvival after acute myocardial infarction in middle-aged men but not inwomen. The Northern Sweden MONICA study 1985–94. J Intern Med2000, 247:579–587.
12. Keys A, Mienotti A, Karvonen MJ, Aravanis C, Blackburn H, Djordjevic BRBS,Dontas AS, Fidanza F, Keys MH, Kromhout D, Nedeljkovic S, Punsar S,Seccareccia F, Toshima H: The diet and 15-year death rate in the SevenCountries Study. Am J Epidemiol 1986, 124:903–915.
13. Keys A (Ed): Seven Countries: a multivariate analysis of death and coronaryheart disease. Cambridge: Harvard University Press; 1980.
14. Food and Agriculture Organization of the United Nations (FAO): Fats andfatty acids in human nutrition. Report of an expert consultation. Rome: FAOFood and nutrition paper 91; 2010. ISBN ISBN 978-92-5-106733-8.
15. Van Guelpen B, Hultdin J, Johansson I, Hallmans G, Stenling R, Riboli E,Winkvist A, Palmqvist R: Low folate levels may protect against colorectalcancer. Gut 2006, 55:1461–1466.
16. Nilsson LM, Johansson I, Lenner P, Lindahl B, Van Guelpen B: Consumptionof filtered and boiled coffee and the risk of incident cancer: aprospective cohort study. Cancer Causes Control 2010, 21:1533–1544.
17. Engström KS, Wennberg M, Strömberg U, Bergdahl IA, Hallmans G, JanssonJH, Lundh T, Norberg M, Rentschler G, Vessby B, Skerfving S, Broberg K:Evaluation of the impact of genetic polymorphisms in glutathione-related genes on the association between methylmercury or n-3polyunsaturated long chain fatty acids and risk of myocardial infarction:a case-control study. Environ Health 2011, 10:33.
18. Riboli E, Kaaks R: The EPIC project: rationale and study design. Europeanprospective investigation into cancer and nutrition. Int J Epidemiol 1997,26(Suppl 1):S6–S14.
19. Bingham SA, Day NE, Luben R, Ferrari P, Slimani N, Norat T, Clavel-ChapelonF, Kesse E, Nieters A, Boeing H, Tjønneland A, Overvad K, Martinez C,Dorronsoro M, Gonzalez CA, Key TJ, Trichopoulou A, Naska A, Vineis P,Tumino R, Krogh V, Bueno-de-Mesquita HB, Peeters PH, Berglund G,Hallmans G, Lund E, Skeie G, Kaaks R, Riboli E: European ProspectiveInvestigation into Cancer and Nutrition: dietary fibre in food andprotection against colorectal cancer in the European ProspectiveInvestigation into Cancer and Nutrition (EPIC): an observational study.Lancet 2003, 361:1496–1501.
20. Nettleton JA, McKeown NM, Kanoni S, Lemaitre RN, Hivert MF, Ngwa J, vanRooij FJ, Sonestedt E, Wojczynski MK, Ye Z, Tanaka T, Garcia M, Anderson JS,Follis JL, Djousse L, Mukamal K, Papoutsakis C, Mozaffarian D, Zillikens MC,Bandinelli S, Bennett AJ, Borecki IB, Feitosa MF, Ferrucci L, Forouhi NG,Groves CJ, Hallmans G, Harris T, Hofman A, Houston DK, Hu FB, Johansson I,Kritchevsky SB, Langenberg C, Launer L, Liu Y, Loos RJ, Nalls M, Orho-Melander M, Renstrom F, Rice K, Riserus U, Rolandsson O, Rotter JI, Saylor G,Sijbrands EJ, Sjogren P, Smith A, Steingrímsdóttir L, Uitterlinden AG,Wareham NJ, Prokopenko I, Pankow JS, van Duijn CM, Florez JC, WittemanJC, Witteman JC, Dupuis J, Dedoussis GV, Ordovas JM, Ingelsson E, CupplesLA, Siscovick DS, Franks PW, Meigs JB, MAGIC Investigators: Interactions ofdietary whole-grain intake with fasting glucose- and insulin-relatedgenetic loci in individuals of European descent: a meta-analysis of 14cohort studies. Diabetes Care 2010, 33:2684–2691.
21. Malik VS, Hu FB: Popular weight-loss diets: from evidence to practice. NatClin Pract Cardiovasc Med 2007, 4:34–41.
22. Hallmans G, Agren A, Johansson G, Johansson A, Stegmayr B, Jansson JH,Lindahl B, Rolandsson O, Söderberg S, Nilsson M, Johansson I, Weinehall L:Cardiovascular disease and diabetes in the Northern Sweden Health andDisease Study Cohort - evaluation of risk factors and their interactions.Scand J Public Health Suppl 2003, 61:18–24.
23. Statistics Sweden: Population and Housing Census 1990. Part 7. The planningand processing of the Population and Housing Census. Stockholm: StatisticsSweden; 1989.
24. Weinehall L, Hallgren CG, Westman G, Janlert U, Wall S: Reduction ofselection bias in primary prevention of cardiovascular disease throughinvolvement of primary health care. Scand J Prim Health Care 1998,16:171–176.
25. Eriksson M, Stegmayr B, Lundberg V: MONICA quality assessments. Scand JPublic Health Suppl 2003, 61:25–30.
26. Eriksson M, Holmgren L, Janlert U, Jansson JH, Lundblad D, Stegmayr B,Söderberg S, Eliasson M: Large improvements in major cardiovascular riskfactors in the population of northern Sweden: the MONICA study 1986–2009. J Intern Med 2011, 269:219–231.
27. Johansson I, Hallmans G, Wikman Å, Biessy C, Riboli E, Kaaks R: Validationand calibration of food frequency questionnaire measurements in theNorthern Sweden Health and Disease cohort. Public Health Nutr 2002,5:487–496.
28. Wennberg M, Vessby B, Johansson I: Evaluation of relative intake offatty acids according to the Northern Sweden FFQ with fatty acidlevels in erythrocyte membranes as biomarkers. Public Health Nutr2009, 5:1–8.
29. Johansson I, Van Guelpen B, Hultdin J, Johansson M, Hallmans G, Stattin P:Validity of food frequency questionnaire estimated intakes of folate andother B vitamins in a region without folic acid fortification. Eur J Clin Nutr2010, 64:905–913.
30. Klingberg S, Winkvist A, Hallmans G, Ellegård L, Johansson I: Evaluation ofplant sterol intake estimated with the Northern Sweden Food FrequencyQuestionnaire. Public Health Nutr, . in press.
31. Johansson G, Wikman Å, Åhrén A-M, Hallmans G, Johansson I:Underreporting of energy intake in repeated 24-hour recalls related togender, age, weight status, day of interview, educational level, reportedfood intake, smoking habits and area of living. Public Health Nutr 2001,4:919–927.
32. Schofield W: Predicting basal metabolic rate, new standards and reviewof previous work. Hum Nutr Clin Nutr 1985, 39(Suppl 1):5–41.
33. Weinehall L, Johnson O, Jansson JH, Boman K, Huhtasaari F, Hallmans G,Dahlen G, Wall S: Perceived health modifies the effect of biomedical riskfactors in the prediction of acute myocardial infarction. An incident
Johansson et al. Nutrition Journal 2012, 11:40 Page 13 of 13http://www.nutritionj.com/content/11/1/40
case-control study from northern Sweden. J Intern Med 1998,243:99–107.
34. Heitmann BL, Lissner L: Dietary underreporting by obese individuals—is itspecific or non-specific? BMJ 1995, 311:986–989.
35. Ståhle L, Wold S: Multivariate data analysis and experimental design inbiomedical research. Prog Med Chem 1988, 25:291–338.
36. Kim HJ, Fay MP, Feuer EJ: Permutation tests for joinpoint regression withapplications to cancer rates. Stat Med 2000, 19:335–351.
37. Sandvei MS, Lindekleiv H, Romundstad PR, Müller TB, Vatten LJ, IngebrigtsenT, Njølstad I, Mathiesen EB, Vik A: Risk factors for aneurysmal subarachnoidhemorrhage - BMI and serum lipids: 11-year follow-up of the HUNT andthe Tromsø Study in Norway. Acta Neurol Scand 2012, 125:382–388.
38. de Lorgeril M, Salen P, Martin JL: Mediterranean diet, traditional riskfactors and the rate of cardiovascular complications after myocardialinfarction. Final report of the Lyon Diet Heart Study. Circulation 1999,99:779–785.
39. Vartiainen E, Laatikainen T, Peltonen M, Juolevi A, Männistö S, Sundvall J,Jousilahti P, Salomaa V, Valsta L, Puska P: Thirty-five-year trends incardiovascular risk factors in Finland. Int J Epidemiol 2010, 39:504–518.
40. Mente A, de Koning L, Shannon HS, Anand SS: A Systematic review of theevidence supporting a causal link between dietary factors and coronaryheart disease. Arch Intern Med 2009, 7:659–669.
41. Sjögren P, Becker W, Warensjö E, Olsson E, Byberg L, Gustafsson IB,Karlström B, Cederholm T: Mediterranean and carbohydrate-restricteddiets and mortality among elderly men: a cohort study in Sweden. Am JClin Nutr 2010, 92:967–974.
42. No author listed: Randomised trial of cholesterol lowering in 4444patients with coronary heart disease: the Scandinavian SimvastatinSurvival Study (4S). Lancet 1994, 344:1383–1389.
43. Valsta LM, Tapanainen H, Sundvall J, Laatikainen T, Männistö S, Pietinen P,Vartiainen E: Explaining the 25-year decline of serum cholesterol bydietary changes and use of lipid-lowering medication in Finland. PublicHealth Nutr 2010, 13:932–938.
44. Nordmann AJ, Nordmann A, Briel M, Keller U, Yancy WS Jr, Brehm BJ,Bucher HC: Effects of low-carbohydrate vs low-fat diets on weight lossand cardiovascular risk factors: a meta-analysis of randomized controlledtrials. Arch Intern Med 2006, 166:285–293.
45. Sacks FM, Bray GA, Carey VJ, Smith SR, Ryan DH, Anton SD, McManus K,Champagne CM, Bishop LM, Laranjo N, Leboff MS, Rood JC, de Jonge L,Greenway FL, Loria CM, Obarzanek E, Williamson DA: Comparison ofweight-loss diets with different compositions of fat, protein, andcarbohydrates. N Engl J Med 2009, 360:859–873.
46. Fung TT, van Dam RM, Hankinson SE, Stampfer M, Willett WC, Hu FB: Low-carbohydrate diets and all-cause and cause-specific mortality: twocohort studies. Ann Intern Med 2010, 153:289–298.
47. Lagiou P, Sandin S, Weiderpass E, Lagiou A, Mucci L, Trichopoulos D, AdamiHO: Low carbohydrate-high protein diet and mortality in a cohort ofSwedish women. J Intern Med 2007, 261:366–374.
48. Trichopoulou A, Psaltopoulou T, Orfanos P, Hsieh CC, Trichopoulos D: Low-carbohydrate-high-protein diet and long-term survival in a generalpopulation cohort. Eur J Clin Nutr 2007, 61:575–581.
49. Shai I, Schwarzfuchs D, Henkin Y, Shahar DR, Witkow S, Greenberg I, GolanR, Fraser D, Bolotin A, Vardi H, Tangi-Rozental O, Zuk-Ramot R, Sarusi B,Brickner D, Schwartz Z, Sheiner E, Marko R, Katorza E, Thiery J, Fiedler GM,Blüher M, Stumvoll M, Stampfer MJ, Dietary Intervention RandomizedControlled Trial (DIRECT) Group: Weight loss with a low-carbohydrate,Mediterranean, or low-fat diet. N Engl J Med 2008, 359:229–241.
50. Halton TL, Willett WC, Liu S, Manson JE, Albert CM, Rexrode K, Hu FB, et al:Low-carbohydrate-diet score and the risk of coronary heart disease inwomen. N Engl J Med 2006, 355:1991–2002.
51. NNR, Nordic Nutrition Recommendations: Integrating nutrition and physicalactivity. Copenhagen: Nordic Council of Ministers; 2004.
52. WHO: Diet, nutrition and the prevention of chronic diseases: report of a jointWHO/FAO Expert Consultation. WHO Technical Report Series 916. Geneva:WHO; 2003.
53. Baigent C, Keech A, Kearney PM, Blackwell L, Buck G, Pollicino C, Kirby A,Sourjina T, Peto R, Collins R, Simes R: Cholesterol Treatment Trialists' (CTT)Collaborators. Efficacy and safety of cholesterol-lowering treatment:prospective meta-analysis of data from 90,056 participants in 14randomised trials of statins. Lancet 2005, 366:1267–1278.
54. Kuulasmaa K, Tunstall-Pedoe H, Dobson A, Fortmann S, Sans S, Tolonen H,Evans A, Ferrario M, Tuomilehto J: Estimation of contribution of changesin classic risk factors to trends in coronary-event rates across the WHOMONICA Project populations. Lancet 2000, 355:675–687.
55. Björck L, Rosengren A, Bennett K, Lappas G, Capewell S: Modelling thedecreasing coronary heart disease mortality in Sweden between 1986and 2002. Eur Heart J 2009, 30:1046–1056.
doi:10.1186/1475-2891-11-40Cite this article as: Johansson et al.: Associations among 25-year trendsin diet, cholesterol and BMI from 140,000 observations in men andwomen in Northern Sweden. Nutrition Journal 2012 11:40.
Submit your next manuscript to BioMed Centraland take full advantage of:
• Convenient online submission
• Thorough peer review
• No space constraints or color figure charges
• Immediate publication on acceptance
• Inclusion in PubMed, CAS, Scopus and Google Scholar
• Research which is freely available for redistribution
Submit your manuscript at www.biomedcentral.com/submit