association for public policy analysis and management
TRANSCRIPT

Association for Public Policy Analysis and Management
How Well Is the United States Competing? A Comment on PapadakisAuthor(s): Louis D. Johnston and Menzie D. ChinnReviewed work(s):Source: Journal of Policy Analysis and Management, Vol. 15, No. 1 (Winter, 1996), pp. 68-81Published by: John Wiley & Sons on behalf of Association for Public Policy Analysis and ManagementStable URL: http://www.jstor.org/stable/3325195 .Accessed: 29/01/2012 12:05
Your use of the JSTOR archive indicates your acceptance of the Terms & Conditions of Use, available at .http://www.jstor.org/page/info/about/policies/terms.jsp
JSTOR is a not-for-profit service that helps scholars, researchers, and students discover, use, and build upon a wide range ofcontent in a trusted digital archive. We use information technology and tools to increase productivity and facilitate new formsof scholarship. For more information about JSTOR, please contact [email protected].
John Wiley & Sons and Association for Public Policy Analysis and Management are collaborating with JSTORto digitize, preserve and extend access to Journal of Policy Analysis and Management.
http://www.jstor.org
How Well is the United States Competing? A Comment on Papadakis
Louis D. Johnston Menzie D. Chinn
Abstract We contend that Papadakis's inferences regarding past and future competitive- ness crises cannot be made on the basis of the evidence she has presented.
We support this assertion in three ways. First, we argue that the import penetration ratio is not a reasonable measure of national competitiveness in international markets. Second, we show that conventional macroeconomic models can explain the deterioration in the trade balance during the 1980s. Third, we present data demonstrating that, as of 1990, the United States had very low unit labor costs relative to other developed countries, and had the highest level of aggregate productivity in the world.
INTRODUCTION
In a recent article in this journal, Maria Papadakis concludes that the United States experienced a "competitiveness crisis" in selected industries during the 1982-1984 period. Although she admits that macroeconomic factors played a role in the deterioration of the trade balance, she maintains that we must distinguish between "systemic effects [i.e. macroeconomic factors]
S. . and declining microeconomic competitive abilities" [1994, p. 7]. We argue that she has misread the data, and confused cause with effect.
Productivity levels have been converging both in the aggregate and across sectors. This phenomenon, combined with exchange rate movements, means that foreign producers have become more competitive in U.S. markets than they previously were, leading to a rise in import penetration ratios. A competi- tiveness problem, separate from these macroeconomic effects, is difficult to find.
We support this assertion in three ways. First, we argue that market share, or relatedly, the import penetration ratio, is not in and of itself a reasonable measure of national competitiveness in international markets. Second, we
Journal of Policy Analysis and Management, Vol. 15, No. 1, 68-81 (1996) C 1996 by the Association for Public Policy Analysis and Management Published by John Wiley & Sons, Inc. CCC 0276-8739/96/010068-14
How Well Is the United States Competing? / 69
show that conventional macroeconomic models are able to explain the deteri- oration in the trade balance during the 1980s. This casts into doubt the view that a "competitiveness crisis" made the trade deficit worse than it "should have been." Third, we present data on two alternative measures of competi- tiveness: relative costs of production, expressed in a common currency; and productivity levels. In both cases, these indicators provide evidence at vari- ance with Papadakis's thesis. Not only have U.S. unit labor costs declined since the mid-1980s, but as of 1990, the United States had the highest level of aggregate productivity in the world. Thus, although she may be correct that the United States will experience competitiveness problems in certain industries during the 1990s, that conclusion cannot be made on the basis of the evidence she has presented.
WHAT IS COMPETITIVENESS?
"Did (or does) the United States have a competitiveness crisis?" Papadakis answers this question by utilizing a definition of competitiveness based on the idea that a nation is, to quote President Clinton, "like a big corporation competing in the global marketplace" [Krugman, 1994, p. 29]. This is not the only way in which competitiveness may be defined, nor is it clear that competitiveness is, in itself, an issue that should be addressed by public policy. In this section, we examine Papadakis's definition of competitiveness and compare it with the ones used by macroeconomists.
Papadakis builds her definition of national competitiveness on the notion of firm-level competitiveness. She writes, "In the classic business and micro- economic sense, competition is a state of rivalry [among firms] and competi- tiveness the ability of one competitor to prevail against another" [1994, p. 3]. According to Papadakis, this implies that measures such as "productiv- ity, economic growth, and comparative advantage" cannot be used to mea- sure competitiveness because "competitiveness . . . is a relative, and not absolute condition" [1994, p. 2].
Papadakis's preferred definition of competitiveness is built around the idea that "competitiveness is reflected by the final consumer 'choice' between two or more goods vying for the consumer's dollar" [1994, p. 3]. "For firms, the single most important measure of competitiveness is market share: Given total consumption of a particular good or class of goods (the market), what proportion (share) is accounted for by sales of an individual firm?" [1994, p. 3].
She defines national competitiveness and measures of national competitive- ness in the following paragraph:
If, as Chesnais [1986] suggests, we can think of a nation's competitiveness as the cumulation of the competitiveness of firms that operate within its boundaries, then the single most important criterion of national competitiveness is the strength of these firms compared to foreign firms within domestic markets, a strength reflected by domestic market share.' [Papadakis, 1994, p. 3]
1 Papadakis also uses other measures of competitiveness that are all related to domestic market share, specifically, the balance of trade for an industry, the import penetration rate for that industry, and the revealed comparative advantage of that industry.

70 / How Well Is the United States Competing?
There are a number of problems with this definition of competitiveness, and with the measures Papadakis uses to measure competitiveness.
First, we believe that Papadakis' has misinterpreted Chesnais's work and, in doing so, has missed an important dimension of competitiveness. Chesnais writes that the international competitiveness of a national economy is built on the competitiveness of the firms which operate within its boundaries. But at the same time, the overall economy will also affect the performance of those firms [Chesnais, 1986, p. 91]. National competitiveness is not simply "the cumulation of the competitiveness of firms that operate within its bound- aries." It is a broader concept which involves interaction between a nation's individual firms and the macroeconomic environment in which those firms operate.
Second, it is not clear that market share is a firm's "single most important measure of competitiveness." Firms choose levels of output and output prices that maximize the present discounted value of their future profit stream. This implies that the firm will have a particular share of the market in which it operates, but the firm does not choose this market share explicitly, nor does it use market share as its best measure of competitiveness.2 Rather, a firm's owners and managers ask whether or not their rate of return on assets is as high as that of other firms in their industry and in similar industries. If it is, then it makes sense to stay in their current line of business; if it is not, then they should leave the industry and invest their resources where the rate of return is higher.
The conditions that directly determine a firm's relative profitability are relative costs and relative prices. Relative costs are primarily determined by the firm's productivity as compared to other firms in the market. For example, the cost of production for a Toyota versus a Chevrolet is determined primarily by the labor productivity and wages of Toyota workers and Chevrolet workers.
The price that a firm charges depends upon market conditions, including macroeconomic variables such as aggregate demand and microeconomic parameters such as the elasticity of market demand. For example, if Toyota is selling the same car in both Japan and the United States, it may charge different prices for the car in Japan and the United States, with the difference in price partly determined by the differing demand elasticities for automo- biles in the two markets, and partly by exchange rates movements. In fact, as long as elasticities differ, prices will react differently to exchange rate move- ments, and increases in import penetration will differ accordingly.
Prices are also affected by the firm's market share, but this share has already been determined by the firm's previous decisions regarding prices and costs, and their future market share is an outcome based on today's decisions regarding prices and costs.3 Competitiveness, as measured by market share or penetration ratios, is thus an outcome that is determined by relative costs and relative prices across countries.'
2 There are a number of models in which current market share, or production levels, may be
positively related to future competitiveness. This relation may obtain if there are significant learning-by-doing effects.
3 We have avoided writing out the models that underlie these ideas in order to concentrate on their economic content. Dornbusch [1987] presents a clear survey of reasons for the endogeneity of prices, and Klemperer and Froot [1989] and Hooper and Mann [1989] contain formal models and discussions which embody these ideas.
4 These factors are, in turn, determined primarily by productivity and exchange rates. Papadakis herself asserts, however, that "Industrial competitiveness is best pursued for its contribution
How Well Is the United States Competing? / 71
WHAT DO THE MACRO-FUNDAMENTALS IMPLY ABOUT THE TRADE DEFICIT?
Concerns about a "competitiveness crisis" during the mid-1980s stemmed in part from the failure of conventional models of trade balance determination to track the movements of the U.S. trade deficit. The post-1985 trade deficit was particularly troublesome, and fostered an entirely new literature focusing on the microeconomic aspects of trade flows.5
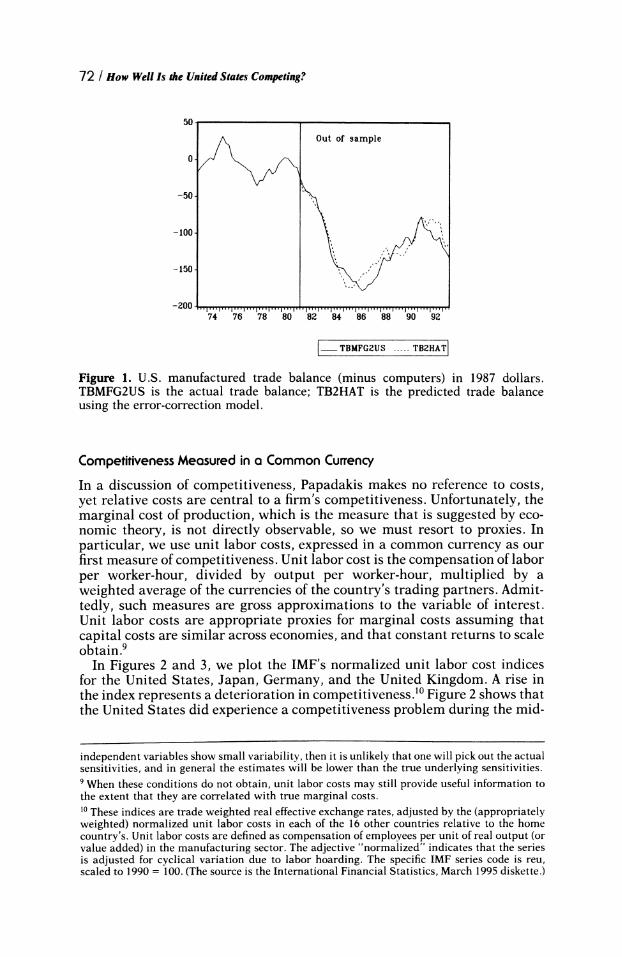
Recent re-evaluations of the 1980s experience have concluded that the misgivings about the adequacy of our theoretical models have been mis- placed.6 To illustrate this point, we estimated trade flow equations for the United States via linear regression for the period 1973.2 to 1981.2, and then used the fitted equations to predict the trade balance for the 1981.3 to 1993.3 period (assuming the levels of income and the exchange rate are given). This choice of sample periods thus naturally weights the experiment in favor of finding larger errors in the post-1981 period because information from this period is not used in estimating the trade flow relationships.' The actual and predicted series are illustrated in Figure 1 (seasonally adjusted, at annual rates). Notice that in the 1982-1984 period, there is only a very small error in prediction: a $4.2 billion underprediction of the merchandise trade deficit in 1982 and a $3.1 and $4.9 overprediction in 1983 and 1984, respectively. By 1993, the model overestimates the trade deficit by $11.7 billion, so that in a sense the United States is doing better than would be expected according to conventional macroeconomic fundamentals.8
ALTERNATIVE MEASURES OF COMPETITIVENESS
Macroeconomic factors cannot account entirely for movements in the trade balance. Factors such as wage rates and productivity levels are also import- ant, and we examine these measures in the following subsections.
to long-term growth and welfare rather than a significant reduction in the trade deficit per se" [1994, p. 15]. Yet, as Krugman [1994] and other economists have pointed out, the central determinants of U.S. living standards are the terms of trade (which are influenced by exchange rates) and the level of productivity. Hence, despite Papadakis's assertion, if we want to examine the competitiveness of nations because of concerns about domestic living standards, we must examine the very factors which macroeconomists use when they study competitiveness and which Papadakis rejects: relative levels and growth rates of productivity and movements in real exchange rates.
5 The older literature often incorporated ad hoc partial adjustment mechanisms, the economic rationale for which was seldom explicitly specified. For examples of the newer literature, see for instance Krugman and Baldwin [1987], Baldwin [1988], and Rose and Yellen [1989] on the stability of trade flow equations. The resultant theoretical literature on hysteresis includes Klemperer and Froot [1989], and Dixit [1989], among others. A brief review is contained in Chinn [1991]. 6 See Krugman [1991] and Rangan and Lawrence [1993].
7 Merchandise export and nonpetroleum merchandise import equations were estimated sepa- rately. Each equation included a relative price (the real exchange rate) and an economic activity variable (GDP) as explanatory variables. Then the estimated trade balance was calculated from the respective predicted values. Details of the estimation procedure are presented in the Ap- pendix. 8 One cannot make too much of the exact predictions because of uncertainty surrounding parame- ter estimates. However, we have estimated the model so as to provide the most conservative estimates-in particular, by estimating the model on pre-1982 data, we rely on a period that
experienced relatively small variations in the real exchange rate. When both the dependent and
72 / How Well Is the United States Competing?
50
Out of sample
0
-50
-100
-150
-200 , 74 76 78 80 82 84 86 88 90 92
1- TBMFG2US
__-. TB2HAT
Figure 1. U.S. manufactured trade balance (minus computers) in 1987 dollars. TBMFG2US is the actual trade balance; TB2HAT is the predicted trade balance using the error-correction model.
Competitiveness Measured in a Common Currency
In a discussion of competitiveness, Papadakis makes no reference to costs, yet relative costs are central to a firm's competitiveness. Unfortunately, the marginal cost of production, which is the measure that is suggested by eco- nomic theory, is not directly observable, so we must resort to proxies. In particular, we use unit labor costs, expressed in a common currency as our first measure of competitiveness. Unit labor cost is the compensation of labor per worker-hour, divided by output per worker-hour, multiplied by a weighted average of the currencies of the country's trading partners. Admit- tedly, such measures are gross approximations to the variable of interest. Unit labor costs are appropriate proxies for marginal costs assuming that capital costs are similar across economies, and that constant returns to scale obtain.9
In Figures 2 and 3, we plot the IMF's normalized unit labor cost indices for the United States, Japan, Germany, and the United Kingdom. A rise in the index represents a deterioration in competitiveness.' Figure 2 shows that the United States did experience a competitiveness problem during the mid-
independent variables show small variability, then it is unlikely that one will pick out the actual sensitivities, and in general the estimates will be lower than the true underlying sensitivities.
9 When these conditions do not obtain, unit labor costs may still provide useful information to the extent that they are correlated with true marginal costs. 10 These indices are trade weighted real effective exchange rates, adjusted by the (appropriately weighted) normalized unit labor costs in each of the 16 other countries relative to the home country's. Unit labor costs are defined as compensation of employees per unit of real output (or value added) in the manufacturing sector. The adjective "normalized" indicates that the series is adjusted for cyclical variation due to labor hoarding. The specific IMF series code is reu, scaled to 1990 = 100. (The source is the International Financial Statistics, March 1995 diskette.)

How Well Is the United States Competing? / 73
175
United States
150
125
075-%-0
Japan
76 78 80 82 84 86 88 90 92 94
Figure 2. U.S. and Japanese real effective exchange rates based on normalized unit labor costs.
1980s, as unit labor costs rose relative to those of other countries. However, most of the movement in these indices comes from movements in the nominal exchange rate, which in turn is driven mostly by movements in the macroeco- nomic fundamentals-money stocks, incomes, and interest rates." Since 1986, U.S. competitiveness has improved substantially while Japanese com- petitiveness has deteriorated drastically. Figure 3 provides another example, using data for Germany and the United Kingdom. Again, as in the U.S. case
140
United Kingdom 130
/,,
120
110
•-
,
- Germany 80 0
, 70
76 78 80 82 84 86 88 90 92 94
Figure 3. German and U.K. real effective exchange rates based on normalized unit labor costs.
11 See, for example, Chinn and Meese [1995].
74 / How Well Is the United States Competing?
for the mid-1980s, German competitiveness has deteriorated with the recent appreciation of the deutsche mark, while British competitiveness has im- proved with the relative depreciation of the pound.
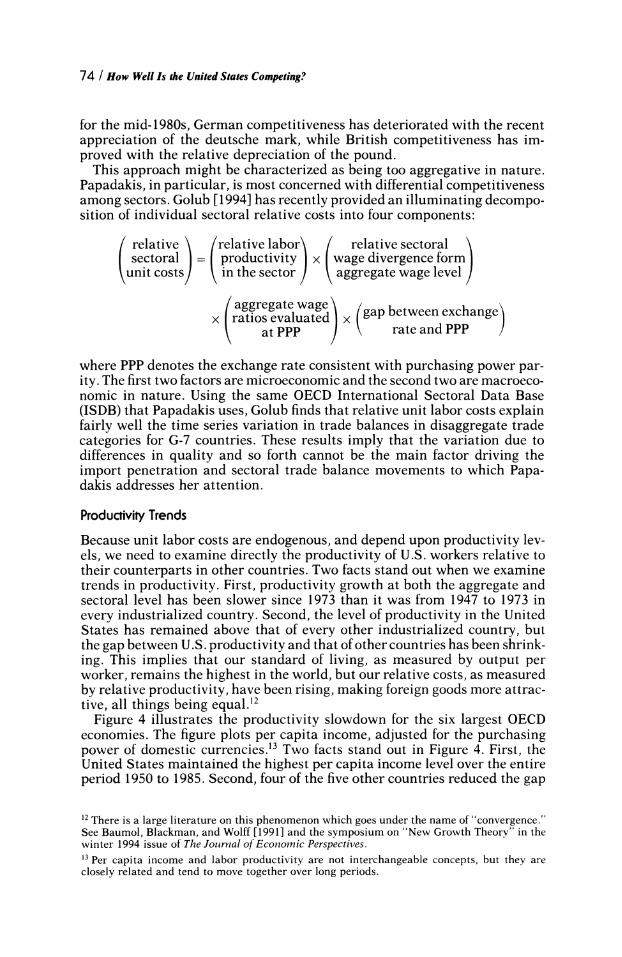
This approach might be characterized as being too aggregative in nature. Papadakis, in particular, is most concerned with differential competitiveness among sectors. Golub [1994] has recently provided an illuminating decompo- sition of individual sectoral relative costs into four components:
relative\ prelative
labor relative sectoral sectoral = productivity x wage divergence form
unit costs in the sector ) aggregate wage level
Saggregate wae gap between exchange
at PPP rate and PPP
where PPP denotes the exchange rate consistent with purchasing power par- ity. The first two factors are microeconomic and the second two are macroeco- nomic in nature. Using the same OECD International Sectoral Data Base (ISDB) that Papadakis uses, Golub finds that relative unit labor costs explain fairly well the time series variation in trade balances in disaggregate trade categories for G-7 countries. These results imply that the variation due to differences in quality and so forth cannot be the main factor driving the import penetration and sectoral trade balance movements to which Papa- dakis addresses her attention.
Productivity Trends
Because unit labor costs are endogenous, and depend upon productivity lev- els, we need to examine directly the productivity of U.S. workers relative to their counterparts in other countries. Two facts stand out when we examine trends in productivity. First, productivity growth at both the aggregate and sectoral level has been slower since 1973 than it was from 1947 to 1973 in every industrialized country. Second, the level of productivity in the United States has remained above that of every other industrialized country, but the gap between U.S. productivity and that of other countries has been shrink- ing. This implies that our standard of living, as measured by output per worker, remains the highest in the world, but our relative costs, as measured by relative productivity, have been rising, making foreign goods more attrac- tive, all things being equal.'2
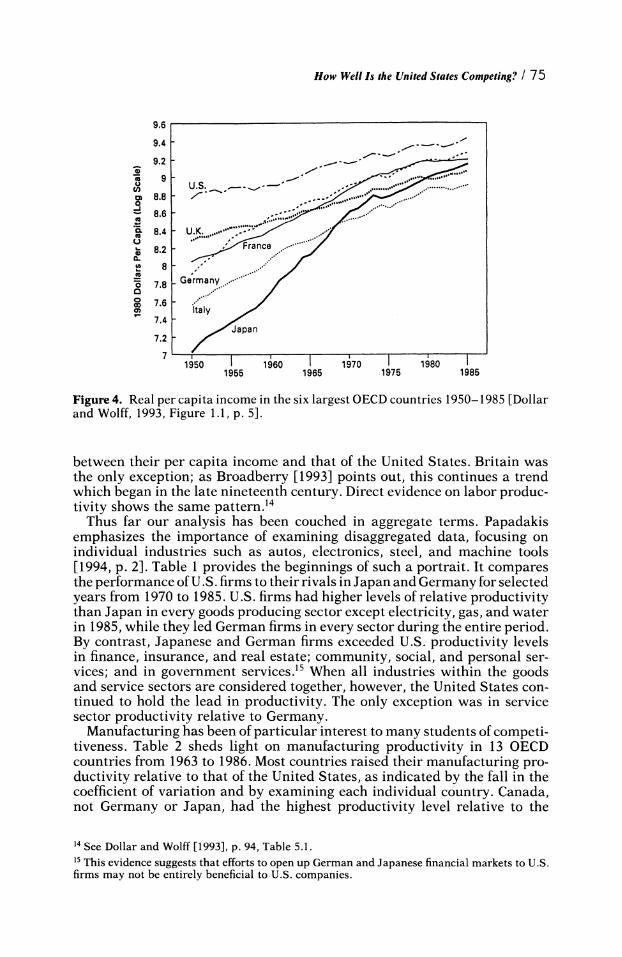
Figure 4 illustrates the productivity slowdown for the six largest OECD economies. The figure plots per capita income, adjusted for the purchasing power of domestic currencies.13 Two facts stand out in Figure 4. First, the United States maintained the highest per capita income level over the entire period 1950 to 1985. Second, four of the five other countries reduced the gap
12 There is a large literature on this phenomenon which goes under the name of "convergence." See Baumol, Blackman, and Wolff [1991] and the symposium on "New Growth Theory" in the winter 1994 issue of The Journal of Economic Perspectives. 13 Per capita income and labor productivity are not interchangeable concepts, but they are closely related and tend to move together over long periods.
How Well Is the United States Competing? / 75
9.6
8.6
8 8.2
7.4 -
7.2- 7
5 -I '
I8o 1
1950 1960 1970 1980 1955 1965 1975 1985
Figure 4. Real per capita income in the six largest OECD countries 1950-1985 [Dollar and Wolff, 1993, Figure 1.1, p. 5].
between their per capita income and that of the United States. Britain was the only exception; as Broadberry [1993] points out, this continues a trend which began in the late nineteenth century. Direct evidence on labor produc- tivity shows the same pattern.14
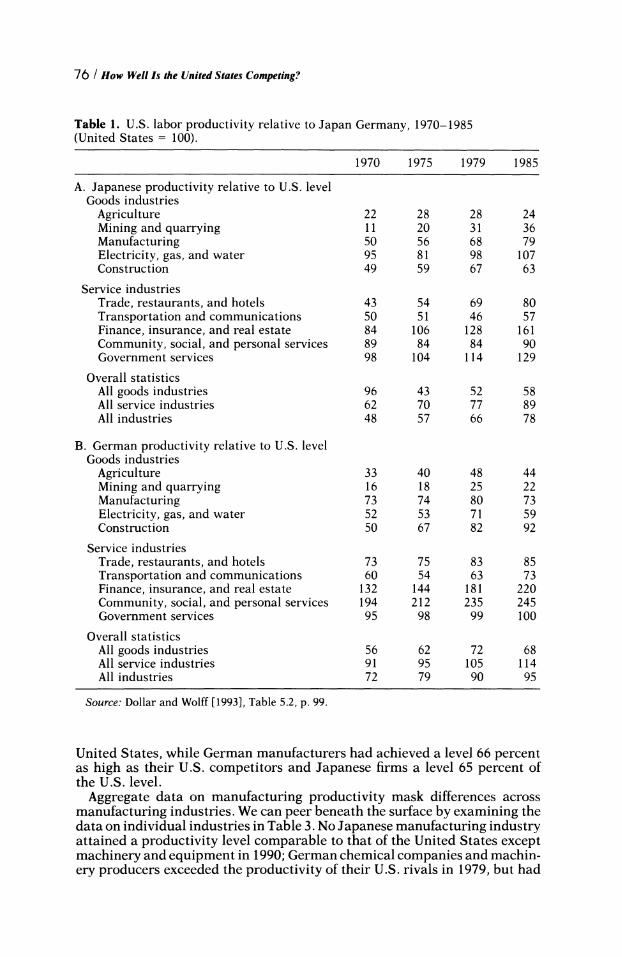
Thus far our analysis has been couched in aggregate terms. Papadakis emphasizes the importance of examining disaggregated data, focusing on individual industries such as autos, electronics, steel, and machine tools [1994, p. 2]. Table 1 provides the beginnings of such a portrait. It compares the performance of U.S. firms to their rivals in Japan and Germany for selected years from 1970 to 1985. U.S. firms had higher levels of relative productivity than Japan in every goods producing sector except electricity, gas, and water in 1985, while they led German firms in every sector during the entire period. By contrast, Japanese and German firms exceeded U.S. productivity levels in finance, insurance, and real estate; community, social, and personal ser- vices; and in government services."5 When all industries within the goods and service sectors are considered together, however, the United States con- tinued to hold the lead in productivity. The only exception was in service sector productivity relative to Germany.
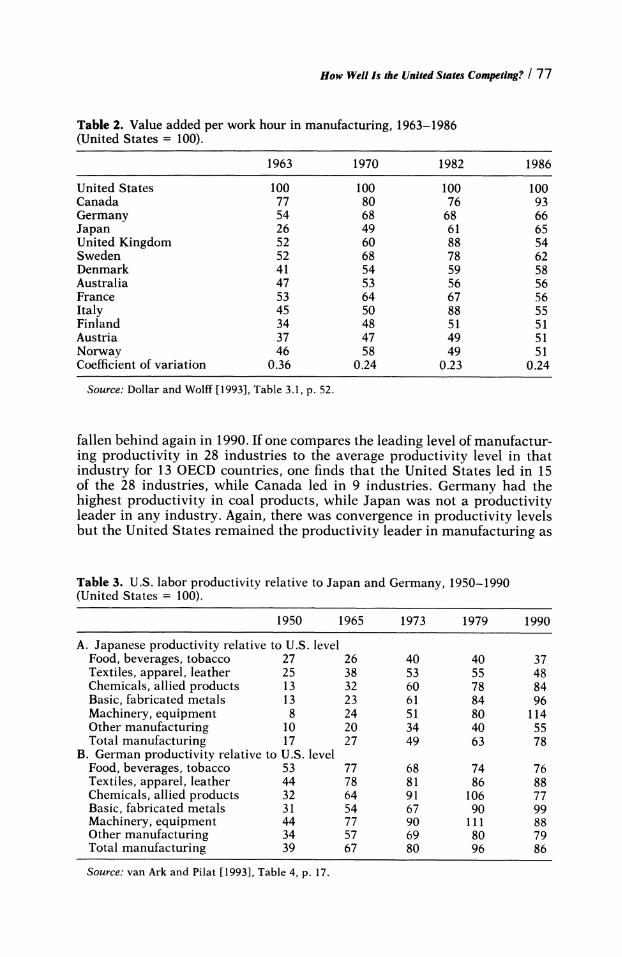
Manufacturing has been of particular interest to many students of competi- tiveness. Table 2 sheds light on manufacturing productivity in 13 OECD countries from 1963 to 1986. Most countries raised their manufacturing pro- ductivity relative to that of the United States, as indicated by the fall in the coefficient of variation and by examining each individual country. Canada, not Germany or Japan, had the highest productivity level relative to the
14 See Dollar and Wolff [1993], p. 94, Table 5.1. '5 This evidence suggests that efforts to open up German and Japanese financial markets to U.S. firms may not be entirely beneficial to U.S. companies.
76 / How Well Is the United States Competing?
Table 1. U.S. labor productivity relative to Japan Germany, 1970-1985 (United States = 100).
1970 1975 1979 1985
A. Japanese productivity relative to U.S. level Goods industries
Agriculture 22 28 28 24 Mining and quarrying 11 20 31 36 Manufacturing 50 56 68 79 Electricity, gas, and water 95 81 98 107 Construction 49 59 67 63
Service industries Trade, restaurants, and hotels 43 54 69 80 Transportation and communications 50 51 46 57 Finance, insurance, and real estate 84 106 128 161 Community, social, and personal services 89 84 84 90 Government services 98 104 114 129
Overall statistics All goods industries 96 43 52 58 All service industries 62 70 77 89 All industries 48 57 66 78
B. German productivity relative to U.S. level Goods industries
Agriculture 33 40 48 44 Mining and quarrying 16 18 25 22 Manufacturing 73 74 80 73 Electricity, gas, and water 52 53 71 59 Construction 50 67 82 92
Service industries Trade, restaurants, and hotels 73 75 83 85 Transportation and communications 60 54 63 73 Finance, insurance, and real estate 132 144 181 220 Community, social, and personal services 194 212 235 245 Government services 95 98 99 100
Overall statistics All goods industries 56 62 72 68 All service industries 91 95 105 114 All industries 72 79 90 95
Source: Dollar and Wolff [1993], Table 5.2, p. 99.
United States, while German manufacturers had achieved a level 66 percent as high as their U.S. competitors and Japanese firms a level 65 percent of the U.S. level.
Aggregate data on manufacturing productivity mask differences across manufacturing industries. We can peer beneath the surface by examining the data on individual industries in Table 3. No Japanese manufacturing industry attained a productivity level comparable to that of the United States except machinery and equipment in 1990; German chemical companies and machin- ery producers exceeded the productivity of their U.S. rivals in 1979, but had
How Well Is the United States Competing? / 77
Table 2. Value added per work hour in manufacturing, 1963-1986 (United States = 100).
1963 1970 1982 1986
United States 100 100 100 100 Canada 77 80 76 93 Germany 54 68 68 66 Japan 26 49 61 65 United Kingdom 52 60 88 54 Sweden 52 68 78 62 Denmark 41 54 59 58 Australia 47 53 56 56 France 53 64 67 56 Italy 45 50 88 55 Finland 34 48 51 51 Austria 37 47 49 51 Norway 46 58 49 51 Coefficient of variation 0.36 0.24 0.23 0.24
Source: Dollar and Wolff [1993], Table 3.1, p. 52.
fallen behind again in 1990. If one compares the leading level of manufactur- ing productivity in 28 industries to the average productivity level in that industry for 13 OECD countries, one finds that the United States led in 15 of the 28 industries, while Canada led in 9 industries. Germany had the highest productivity in coal products, while Japan was not a productivity leader in any industry. Again, there was convergence in productivity levels but the United States remained the productivity leader in manufacturing as
Table 3. U.S. labor productivity relative to Japan and Germany, 1950-1990 (United States = 100).
1950 1965 1973 1979 1990
A. Japanese productivity relative to U.S. level Food, beverages, tobacco 27 26 40 40 37 Textiles, apparel, leather 25 38 53 55 48 Chemicals, allied products 13 32 60 78 84 Basic, fabricated metals 13 23 61 84 96 Machinery, equipment 8 24 51 80 114 Other manufacturing 10 20 34 40 55 Total manufacturing 17 27 49 63 78
B. German productivity relative to U.S. level Food, beverages, tobacco 53 77 68 74 76 Textiles, apparel, leather 44 78 81 86 88 Chemicals, allied products 32 64 91 106 77 Basic, fabricated metals 31 54 67 90 99 Machinery, equipment 44 77 90 111 88 Other manufacturing 34 57 69 80 79 Total manufacturing 39 67 80 96 86
Source: van Ark and Pilat [1993], Table 4, p. 17.

78 / How Well Is the United States Competing?
a whole and in most manufacturing industries as well [Dollar and Wolff, 1993, p. 55].
These data tell a very different story than those presented in Table 5 of Papadakis [1994]. Papadakis argues that because industries such as motor vehicles, textiles, and electronic equipment made large contributions to the trade deficit and had high import penetration ratios even after the dollar had returned to its 1980 level, they are therefore "noncompetitive." We argue that she has misread the data, and confused cause with effect. Productivity levels have been converging both in the aggregate and across sectors, thus reducing differences in relative costs across countries. This, combined with exchange rate movements, means that foreign producers have become more competitive in U.S. markets than they previously were, leading to a rise in import penetration ratios. But, this does not mean that U.S. industries such as motor vehicles are noncompetitive, it simply means that they do not have the overwhelming relative cost advantages that they previously did. U.S. firms must now compete on the basis of initial product quality, quality of service, and other more intangible factors, along with direct price compe- tition.
POLICY IMPLICATIONS
Productivity Matters
Papadakis writes that "Industrial competitiveness is best pursued for its contribution to long-term growth and welfare rather than a significant reduc- tion in the trade deficit per se" [1994, p. 15]. "Growth and welfare" on the national and sectoral levels are primarily determined by a nation's or sector's relative productivity. We have shown that Papadakis's own measure of com- petitiveness, domestic market share, is itself determined by national and sectoral productivity. Thus, despite her statement that "productivity, eco- nomic growth, and comparative advantage" cannot be used to measure com- petitiveness [1994, p. 2], productivity growth and levels of productivity lie at the heart of the matter.
Although the United States is still the productivity leader, its lead has been eroding since at least 1950. Thus, in order to maintain and improve the U.S. standard of living and competitiveness, the United States must focus on maintaining its lead in productivity levels and on increasing its productivity growth rate. What is the role of public policy in this matter? The literature on this question is quite large, but three areas of policy deserve special attention. First, both firms and government must increase their spending on basic science along with generic research and development [Griliches, 1994]. Second, we must improve our educational system and improve our stock of human capital, particularly in primary and secondary education [Easterlin, 1981; Baumol, Blackman, and Wolff, 1991]. Third, in order to boost rates of private investment, national savings must be increased. This will serve to lower the cost of capital and spur private investment in plant and equipment, something we know increases productivity growth.'16 Increased domestic say-
16 A fourth area of policy is improvement of the public capital stock, both through expansion of its size (e.g., building more and better roads, constructing improved sewage treatment plants) and more importantly through more efficient use of the existing stock (e.g., by improving the means by which we pay for roads, by reforming the current system for funding new sewage

How Well Is the United States Competing? / 79
ings will also serve to reduce directly imports through lower domestic aggre- gate demand.
Could Targeted Policies Work?
All of the policies proposed above are broad and are focused at improving aggregate productivity. They differ sharply from Papadakis's recommenda- tions for industry-specific remedies such as selective tax, regulatory, and procurement policies [1994, p. 18].
We do not deny that in certain cases there may exist a strong case for intervention.When significant internal or external economies exist, then there may indeed be a role for strategic trade policy. However, there already exists a large literature which questions the actual advantages that industrial policy could confer. A number of impediments are obvious: Can the strategic sectors be identified? Can appropriate instruments be devised to internalize the exter- nalities (i.e., the "spillovers")? How can we prevent the subsidies from becom- ing merely increased wages for favored workers? How do we insure that resources are not pulled away from other sectors of similar strategic value? If we decide to intervene, how do we avoid retaliation by other governments that shifts all parties to lower levels of profits and welfare? These and many other questions were enumerated as long as a decade ago [Krugman, 1986] and have never been adequately addressed.
CONCLUSIONS
The central question Papadakis addressed was, "Did (or does) the United States have a competitiveness crisis?" Our answer is no, the United States did not, nor does it now have, a competitiveness crisis. Rather, the United States has a productivity problem, both in terms of sectors within the U.S. economy and in relation to its competitors in Europe and Japan. Convergence of productivity levels across countries has meant that our relative cost advan- tages have been disappearing in a wide range of industries. In order to regain the edge, the United States must increase its productivity growth in all sectors relative to productivity growth in other countries. The policies that would help the most in both of these areas would improve the education levels of U.S. workers, encourage basic research and development, and enlarge and improve the stock of private and public capital.
APPENDIX
The data employed in our regression analysis are quarterly, 1973.1-1993.3, for the United States and the rest-of-OECD (ROECD) countries. Income is real GDP for the U.S. Income for the ROECD is aggregate GDP evaluated at pruchasing power parity. The exchange rate is the IMF's multilateral real effective exchange rate series (reu) in units of foreign currency per U.S. dollar. The trade flows are manufactured exports and imports, subtracting off com-
treatment plants versus improving existing ones) [Munnell, 1990]. The effects of these policies are not as certain as improved education, for example, since empirical studies have come to widely different conclusions regarding the returns to public investment.

80 / How Well Is the United States Competing?
puter equipment and peripherals. Computer equipment data are omitted because of the various undesirable properties imparted to the deflated series by newly developed hedonic price indices, as described by Lawrence [1990].
The source of the exchange rate data is the IMF's International Financial Statistics. The trade flow data are from CITIBASE. All other series are from OECD's Main Economic Indicators.
Separate equations are estimated for each trade flow variable, in loga- rithms, over the 1973.2-1981.2 period. For imports, the general form of the equation is:
p p
Am,= V liAyt-i + Y2iArt-i + y0MECTt_p_1 + ut
i=1 i=l
where m is the logarithm of real imports, r is the logarithm of the real exchange rate, and MECT is an "error correction term."
The error correction term is the gap between the actual level of imports and the level implied by the fundamentals. The relationship that is used to obtain this implied level is obtained by a multivariate regression technique described by Johansen [1988], using data from 1973.1 to 1981.2.
The lag order p is chosen by the criterion of the absence of serial correlation in the residuals, using a 10 percent marginal significance level in a Box-Ljung test.
An analogous equation is run for exports:
Ax,= 68,AYl
+ 821 Ar-1 + OXECTt-2 + v
x is the logarithm of real exports and XECT is the corresponding export error correction term.
These equations are then used to predict the values of the logarithms of imports and exports in the 1982.3-1993.3 period. The predicted logarithmic values are then converted back into levels, from which the predicted level of the trade balance is calculated. Details of the data, estimation techniques, and results are available from the authors upon request.
We thank the editor and two anonymous referees for their helpful comments. This research was partially supported by faculty research funds from Gustavus Adolphus College (Johnston) and the University of California, Santa Cruz (Chinn).
LOUIS D. JOHNSTON is Visiting Assistant Professor ofEconomics and Manage- ment, Gustavus Adolphus College.
MENZIE D. CHINN is Assistant Professor of Economics, University of Califor- nia, Santa Cruz.
REFERENCES
van Ark, Bart and Dirk Pilat (1993), "Productivity Levels in Germany, Japan, and the United States: Differences and Causes," Brookings Papers on Economic Activity: Microeconomics 2, pp. 1-69.
Baldwin, Richard (1988), "Hysteresis in Import Prices: The Beachhead Effect," Ameri- can Economic Review 78, pp. 773-785.
Baumol, William J., Sue Anne Batey Blackman, and Edward N. Wolff (1991), Productiv- ity and American Leadership: The Long View (Cambridge, MA: MIT Press).
How Well Is the United States Competing? / 81
Broadberry, Stephen N. (1993), "Manufacturing and the Convergence Hypothesis: What the Long-Run Data Show," Journal of Economic History 53, pp. 772-795.
Chesnais, Francois (1986), "Science, Technology, and Competitiveness," STI Review l, pp. 85-129.
Chinn, Menzie David (1991), "Beware of Econometricians Bearing Estimates: Policy Analysis in a 'Unit Root' World," Journal of Policy Analysis and Management 10, pp. 546-567.
Chinn, Menzie and Richard Meese (1995), "Banking on Currency Forecasts: How Predictable is the Change in Money?" Journal of International Economics 38, pp. 161-178.
Dixit, Avinash (1989), "Hysteresis, Import Penetration, and Exchange Rate Pass Through," Quarterly Journal of Economics 104, pp. 205-228.
Dollar, David and Edward N. Wolff (1993), Competitiveness, Convergence, and Interna- tional Specialization (Cambridge, MA: MIT Press).
Dornbusch, Rudiger (1987), "Exchange Rates and Prices," American Economic Review 77, pp. 93-106.
Easterlin, Richard A. (1981), "Why Isn't the Whole World Developed?" Journal of Economic History 41, pp. 1-19.
Golub, Stephen (1994), "Comparative Advantage, Exchange Rates and the Sectoral Trade Balances of the Major Industrial Countries," IMF Staff Papers 41, pp. 286-313.
Griliches, Zvi (1994), "Productivity, R&D, and the Data Constraint," American Eco- nomic Review 84, pp. 1-23.
Hooper, Peter and Catherine Mann (1989), "Exchange Rate Pass through in the 1980s: The Case of U.S. Imports of Manufactures," Brookings Papers on Economic Activity 1, pp. 297-329.
Johansen, Soren (1988), "Statistical Analysis of Cointegrating Vectors," Journal of Economic Dynamics and Control 12, pp. 231-254.
Klemperer, Paul and Kenneth Froot (1989), "Exchange Rate Pass Through when Market Share Matters," American Economic Review 79, pp. 637-654.
Krugman, Paul (1986), "Introduction: New Thinking about Trade Policy," in P. Krug- man (ed.), Strategic Trade Policy and the New International Economics (Cambridge, MA: MIT Press).
Krugman, Paul (1991), "Has the Adjustment Process Worked?" in C. Fred Bergsten (ed.), International Adjustment and Financing: 1985-91 (Washington, DC: Institute for International Economics).
Krugman, Paul (1994), "Competitiveness: A Dangerous Obsession," Foreign Affairs 73, pp. 28-44.
Krugman, Paul and Richard E. Baldwin (1987), "The Persistence of the U.S. Trade Deficit," Brookings Papers on Economic Activity 1, pp. 1-43.
Lawrence, Robert Z. (1990), "U.S. Current Account Adjustment: An Appraisal," Brook- ings Papers on Economic Activity 2, pp. 343-382.
Munnell, Alicia H. (ed.) (1990), Is There a Shortfall in Public Capital Investment? (Boston: Federal Reserve Bank of Boston).
Papadakis, Maria (1994), "Did (or Does) the United States Have a Competitiveness Crisis?" Journal of Policy Analysis and Management 13, pp. 1-20.
Rangan, Subramania and Robert Z. Lawrence (1993), "The Response of U.S. Firms to Exchange Rate Fluctuations: Piercing the Corporate Veil," Brookings Papers on Economic Activity 2, pp. 341-379.
Rose, Andrew and Janet Yellen (1989), "Is There a J-Curve?" Journal of Monetary Economics 24, pp. 53-68.