association between some endocrine-disrupting chemicals and childhood obesity in biological samples...
TRANSCRIPT
Accepted Manuscript
Title: Association between some endocrine-disruptingchemicals and childhood obesity in biological samples ofyoung girls: a cross-sectional study
Author: Haemin Choi Jinhee Eom Jiye Kim Sanghouck LeeYunje Kim
PII: S1382-6689(14)00088-XDOI: http://dx.doi.org/doi:10.1016/j.etap.2014.04.004Reference: ENVTOX 1980
To appear in: Environmental Toxicology and Pharmacology
Received date: 12-11-2013Revised date: 29-3-2014Accepted date: 1-4-2014
Please cite this article as: Choi, H., Eom, J., Kim, J., Lee, S., Kim, Y.,Associationbetween some endocrine-disrupting chemicals and childhood obesity in biologicalsamples of young girls: a cross-sectional study, Environmental Toxicology andPharmacology (2014), http://dx.doi.org/10.1016/j.etap.2014.04.004
This is a PDF file of an unedited manuscript that has been accepted for publication.As a service to our customers we are providing this early version of the manuscript.The manuscript will undergo copyediting, typesetting, and review of the resulting proofbefore it is published in its final form. Please note that during the production processerrors may be discovered which could affect the content, and all legal disclaimers thatapply to the journal pertain.
Page 1 of 20
Accep
ted
Man
uscr
ipt
Highlights
- PA and MEP, DBP have a statistical association with the children obesity.
- DHEA has a statistical association with the children obesity.
- DHEA can affect the development of obesity.
*Highlights (for review)
Page 2 of 20
Accep
ted
Man
uscr
ipt
1 2 3 4 5 6 7 8 9 10 11 12 13 14 15 16 17 18 19 20 21 22 23 24 25 26 27 28 29 30 31 32 33 34 35 36 37 38 39 40 41 42 43 44 45 46 47 48 49 50 51 52 53 54 55 56 57 58 59 60 61 62 63 64 65
1
Association between some endocrine-
disrupting chemicals and childhood
obesity in biological samples of young
girls: a cross-sectional study
Haemin Choi1, Jinhee Eom
1, Jiye Kim
1, Sanghouck Lee
2, Yunje Kim
1*
1Korea Institute of Science and Technology, Hwarangno 14-gil 5, Seongbuk-gu, Seoul 136-
791, Republic of Korea
2Department of Health Environment, Hoseo Graduate School of Venture, Seoul, Republic of
Korea
Corresponding author : Yunje Kim
Korea Institute of Science and Technology, Hwarangno 14-gil 5, Seongbuk-gu, Seoul 136-
791, Republic of Korea.
Tel.: +82 2 958 5060
Fax: +82 2 958 5805
E-mail addresses : [email protected]
Page 3 of 20
Accep
ted
Man
uscr
ipt
1 2 3 4 5 6 7 8 9 10 11 12 13 14 15 16 17 18 19 20 21 22 23 24 25 26 27 28 29 30 31 32 33 34 35 36 37 38 39 40 41 42 43 44 45 46 47 48 49 50 51 52 53 54 55 56 57 58 59 60 61 62 63 64 65
2
Abstract
Childhood obesity, a major public health concern, has increased worldwide. Endocrine-
disrupting chemicals (EDCs) have recently received attention as a cause of obesity. A cross-
sectional study using logistic regression was conducted to investigate the association between
some endocrine disrupting chemicals and obesity in young girls. Endogenous steroids
expected to be associated with EDCs were also investigated. The target compounds included
7 phthalates (MEP, DBP, MBP, DEHP, MEHP, PA and MBzP), 2 alkylphenols (4-NP and t-
OP), bisphenol A and 9 endogenous steroids (DHT, epi-T, T, DHEA, A, P, E1, E2 and E3). PA
in urine and MEP, DBP and PA in serum showed statistically significant differences between
the control and obese groups, those compounds were considered to be associated with obesity.
In addition, DHEA in serum showed a statistically significant difference between obese and
control groups. We concluded that these substances can affect the development of obesity.
Keywords: Childhood obesity, endocrine disrupting chemicals, phthalate, alkylphenol,
bisphenol A, endogenous steroids
1. Introduction
Overweight and obesity are defined by the WHO (World Health Organization) as abnormal
or excessive fat accumulation that presents a risk to health. Obesity has dramatically
increased worldwide in recent decades, becoming a major global health concern. Like adults,
the prevalence rate for child and adolescent obesity has increased all over the world.
Childhood obesity increased from 7 % in 1980 to nearly 20 % in 2008 in the United States,
and increased from 5.8 % in 1997 to 9.7 % in 2005 in Korea (Oh et al., 2008). Obesity is a
complex disease for which no single cause or cure exists. Obesity is most likely caused by a
Page 4 of 20
Accep
ted
Man
uscr
ipt
1 2 3 4 5 6 7 8 9 10 11 12 13 14 15 16 17 18 19 20 21 22 23 24 25 26 27 28 29 30 31 32 33 34 35 36 37 38 39 40 41 42 43 44 45 46 47 48 49 50 51 52 53 54 55 56 57 58 59 60 61 62 63 64 65
3
complicated interaction between genetic, behavioral, and environmental factors. However,
the most common causes are overeating, lack of physical activity and genetic susceptibility
(Ogden et al., 2012; Tang-Peronard et al., 2011). One environmental factor that has been
receiving attention recently is the contribution of endocrine-disrupting chemicals (EDCs)
such as phthalates, bisphenol A and alkylphenols to the high prevalence of obesity.
Endocrine-disrupting chemicals (EDCs) interfere by mimicking, blocking, or altering
hormones and endocrine systems. Children are more vulnerable than adults to the effects of
EDCs (Tang-Peronard et al., 2011).
Phthalates are industrial chemicals used in many consumer products, such as children's toys,
baby powder, food packaging, and building materials. Phthalates have anti-androgenic effects
in animal experiments, and some phthalate activities are dependent on PPARs, which are
receptors that regulate the development and maturation of adipogenesis (Hatch et al., 2010).
Animal and human data have detected an association between phthalates-, such as MEP, and
increasing obesity and body size (Hatch et al., 2008). Bisphenol A (BPA) and alkylphenols
(APs) are the industrial chemicals that have received much attention due to their high
production and extensive usage. BPA is used in the production of polycarbonate plastic and
epoxy resins and is also found in baby bottles, microwave ovenware and the inner coating of
cans for food and beverages. BPA acts as an androgen receptor antagonist and, in
combination with insulin, accelerates adipocyte formation (Braun et al., 2009; Shankar et al.,
2012). In rodents, exposure to low doses of BPA leads to obesity and high lipid levels in utero
(Honma et al., 2002). Limited human data have suggested a positive association between
BPA exposure and obesity (Trasande et al., 2012; Wang et al., 2012). Alkylphenols are the
nonionic surfactants widely used in industry. The compound 4-nonlyphenol (4-NP) has been
investigated to determine whether there is an association with adipocytes in vitro, and

Page 5 of 20
Accep
ted
Man
uscr
ipt
1 2 3 4 5 6 7 8 9 10 11 12 13 14 15 16 17 18 19 20 21 22 23 24 25 26 27 28 29 30 31 32 33 34 35 36 37 38 39 40 41 42 43 44 45 46 47 48 49 50 51 52 53 54 55 56 57 58 59 60 61 62 63 64 65
4
perinatal exposure to 4-NP showed an increase in body weight and fat mass. The compound
4-NP also activated PPARγ and its target genes in adipose tissue. A few studies have
suggested that the increase in body weight was associated with developmental exposure to
some estrogenic chemicals (Lopez-Espinosa et al., 2009; Masuno et al., 2003). The
compound 4-tert-octylphenol (t-OP), an alkylphenols, is also a known estrogenic chemical
together with 4-nonylphenol and BPA.
In this study, we examined the association between obesiy classified by BMI and EDCs
which was suspected as one of the causes of obesity in young girls. We also examined the
change in the levels of endogenous steroids which were expected to be associated with EDCs.
Specially, we selected only the young girls in this experiment and examined the effects of
EDCs to estrogen. 7 Phthalates [mono-ethyl (MEP), di-n-butyl (DBP), mono-n-butyl (MBP),
di-2-ethylhexyl (DEHP), mono-2-ethylhexyl (MEHP), mono-benzyl (MBzP) phthalate,
phthalic acid (PA)], bisphenol A, and 2 alkylphenols [4-nonylphenol (4-NP) and 4-tert-
octylphenol (t-OP)], all of which are endocrine-disrupting chemicals, were assayed and
measured in terms of their levels in the urine and serum of a control group and an obese
group. And endogenous steroids were dehydroepiandrosterone (DHEA), androsterone (A),
estrone (E1), dihydrotestosterone (DHT), epitestosterone (epi-T), testosterone (T), estradiol
(E2), progesterone (P) and estriol (E3).
2. Materials and methods
2.1. Instruments and equipments
A GC/MS instrument consisting of a 6890 gas chromatograph (GC) and a 5975 mass
selective detector (MSD) from Agilent Technologies (Palo Alto, CA, USA) was used to detect
the target compounds. The column for the GC was an Ultra-1 (50 m x 0.2 mm i.d., 0.11 µm
Page 6 of 20
Accep
ted
Man
uscr
ipt
1 2 3 4 5 6 7 8 9 10 11 12 13 14 15 16 17 18 19 20 21 22 23 24 25 26 27 28 29 30 31 32 33 34 35 36 37 38 39 40 41 42 43 44 45 46 47 48 49 50 51 52 53 54 55 56 57 58 59 60 61 62 63 64 65
5
film thickness). Distilled water was purified through a Milli Q water system (Millipore;
Billerica, MA, USA). An HS501D shaker from IKA (Staufen, Germany) was used to mix the
samples and the organic solvents. A Varifuge-F system from Heraeus (Hanau, Germany) was
used for centrifugation. A vortex mixer from Scientific Industry (Bohemia, NY, USA) was
used for mixing, and a Turbovap® LV evaporator from Zymark (Hopkinton, MA, USA) and
a WB 2000 evaporator from Hiedolph (Schwabach, Germany) were used for drying. A DTC-
311 device from Daeil Biotech (Gyeonggi, Korea) was used to isolate the organic layer
during the extraction procedure.
.
2.2. Reagents
The following target compounds and internal standards (ISTDs) were purchased from
Sigma Aldrich (Saint Louise, MO, USA) : DEHP, DBP, MBP, PA, MEP, MBzP, 4-NP, t-OP,
BPA, DHEA, A, P, E1, E2, E3, terephthalic acid (t-PA, ISTD), benzyl butyl phthalate (BBP,
ISTD), n-octylphenol (n-OP, ISTD), bisphenol B (BPB, ISTD), d3-testosterone (d3-T, ISTD)
and ethinyl estradiol (EE2, ISTD). MEHP was purchased from AccuStandard (New Haven,
CT, USA). DHT, epi-T and T were purchased from Steraloid (Newport, RI, USA). All organic
solvents were of analytical and high - performance liquid chromatography grade. Each stock
solution of a reference standard was prepared at a concentration of 1000 μg / mL in methanol.
The working solutions were made up in methanol at various concentrations as needed.
Acetonitrile (ACN) was used for deproteinization, and diethyl ether was used for the
extraction process. These chemicals were purchased from J. T. Baker (Phillipsburg, NJ, USA).
The trimethylsilylating reagents, N,O-bis(trimethylsilyl)trifluoroacetamide) (BSTFA) and
trimethylchlorosilane (TMCS) were purchased from Sigma Aldrich.

Page 7 of 20
Accep
ted
Man
uscr
ipt
1 2 3 4 5 6 7 8 9 10 11 12 13 14 15 16 17 18 19 20 21 22 23 24 25 26 27 28 29 30 31 32 33 34 35 36 37 38 39 40 41 42 43 44 45 46 47 48 49 50 51 52 53 54 55 56 57 58 59 60 61 62 63 64 65
6
2.3. Study population and data analysis
2.3.1. Study population
Urine and serum samples were collected from April 2011 to September 2011 from a medical
college located in Seoul. Urine and serum samples were obtained from 58 controls (age 6 ~12,
8.59 ± 1.23, BMI < 85 %), and 69 obese (age 6~14, 8.19 ± 1.53, 85% ≤ BMI) young Korean
girls. They were asked to provide a timed overnight urine sample. The diagnosis of obesity
was performed in a hospital. Overweight and obesity ranges were determined by using weight
and height to calculate - the body mass index (BMI in kg/m2). Height and weight were
respectively measured by nurses. They used stadiometers to measure height and electronic
digital scaled to measure weight. Children were weighted wearing only underpants.
Childhood obesity and overweight were defined as the 85th
and 95th
percentiles and above the
95th percentile of the body mass index based on 2007 child and adolescent physical growth
standards. Ethical approval has been granted by the ethical committee of the Inje University
Paik Hospital. Either participants or guardians provided a written informed consent for study
participation.
2.3.2. Statistics
A cross sectional study using logistic regression was performed to assess the association
between obesity and EDCs. The statistical calculations were performed on a personal
computer using the statistical software SPSS, version 18.0.0. Differences in proportions
between obesity groups and control groups were calculated using t-test. Two tailed values of
P < 0.05 were considered to indicate statistical significance.
2.4. Sample preparation
Page 8 of 20
Accep
ted
Man
uscr
ipt
1 2 3 4 5 6 7 8 9 10 11 12 13 14 15 16 17 18 19 20 21 22 23 24 25 26 27 28 29 30 31 32 33 34 35 36 37 38 39 40 41 42 43 44 45 46 47 48 49 50 51 52 53 54 55 56 57 58 59 60 61 62 63 64 65
7
Urine and serum were stored in glass containers and maintained at 20 until the analyzed
were performed. In total, 30 µL (10 ng/mL) of DPB, t-PA, BBP and n-OP as ISTDs were
spiked into 0.5 mL of serum and 2 mL of urine, respectively. ACN (5 mL) was added to the
serum sample for protein removal, and the mixture was then shaken and centrifuged at
2500rpm for 5 min. The upper part of the liquid was retrieved and evaporated completely
with nitrogen gas. Phosphate buffer (0.01 M, pH 3.0, 1.0 mL) and 25 μL of β-
glucuronidase/arylsulfatase from Helix pomatia (50 μL) were added. The resulting mixture
was incubated at 55°C for 90 min. After enzymatic hydrolysis, the solution was applied to a
C18 extraction column from Waters (Milford, MA, USA). The column cartridge had been
activated and conditioned previously with a methanol-distilled water (DW) solution (3 mL,
9:1 ratio). After application of the sample, the column was washed with DW (2 mL). The
analytes were then eluted twice with methanol (3 mL), and the eluent was evaporated to
dryness under a stream of nitrogen. The residue was reconstituted in a pH 3.0 phosphate
buffer (1 mL). This solution was extracted three times with diethyl ether (4 mL, each time for
10 min.). The organic solvent was evaporated in a N2 evaporator and further dried in a
vacuum desiccator over P2O5-KOH for more than 30 min. Finally, the dried residue was
derivatized with BSTFA/1% TMCS (50 µL) at 65°C for 30 min, and 2 µL of the resulting
solution was injected into the GC-MS.
2.5. GC/MS conditions
GC-MS analysis was carried out using an Agilent 6890 gas chromatograph interfaced with
an Agilent 5975 MSD. The ion source temperature was 230°C, and the resulting solution (2
µL) was injected in split mode (5:1) at an injector temperature of 280°C and separated using
an Ultra-1 capillary column (50 m x 0.2 mm i.d., 0.11 µm film thickness; Agilent
Page 9 of 20
Accep
ted
Man
uscr
ipt
1 2 3 4 5 6 7 8 9 10 11 12 13 14 15 16 17 18 19 20 21 22 23 24 25 26 27 28 29 30 31 32 33 34 35 36 37 38 39 40 41 42 43 44 45 46 47 48 49 50 51 52 53 54 55 56 57 58 59 60 61 62 63 64 65
8
Technologies). The initial oven temperature was 120°C; the temperature was, ramped up to
240°C at 15°C /min, ramp to 250°C at 1.5°C /min, ramp to 260°C at 0.5°C /min, and then to
300°C at 25°C /min, followed by, a final 4 min hold for a total run time of 40.26 min. Helium
(99.9999%) was used as the carrier gas (1.0 mL/min. constant flow at an oven temperature of
150°C). The mass spectrometer was operated at 70 eV in the electron ionization mode with
selected ion monitoring (SIM).
3. Results and discussions
3.1. Validation of analytical assays of the target compounds
The experimental method for analyzing the urine and serum samples was validated in terms
of precision, recovery and reproducibility using GC/MS. For this investigation, 3 different
concentrations were used. (n=5) In the case of the EDCs, DEHP and MBzP were used at a
concentration of 5, 50 and 100 ng/mL., and the others were used at concentrations of 2, 20,
and 100 ng/mL. Endogenous steroids were used at a concentration of 1, 10 and 50 ng/mL.
The recovery rates of the EDCs were 83.18 % (20 ng/mL of MBP) - 123.34 % (20 ng/mL of
DBP) from the urine samples and 90.48 % (100 ng/mL of PA) - 112.07 % (2 ng/mL of MEP)
from the serum samples. The recovery rates of the endogenous steroids were 89.60 % (1
ng/mL of A) - 116.95 % (10 ng/mL of T) from the urine samples and 87.08 % (1 ng/mL of T)
- 119.68 % (10 ng/mL of A) from the serum samples. The precision and accuracy rates of the
measurement of the EDCs were 92.95 % (2 ng/mL of MBzP) – 114.03 % (2 ng/mL of 4-NP)
and 0.40% (100 ng/mL of PA) – 10.56% (2 ng/mL of MBzP), respectively, from the urine
samples and 77.76% (2 ng/mL of DBP) – 119.55 % (2 ng/mL of MBP) and 0.57 % (100
ng/mL of DEHP) – 15.32% (2 ng/mL of DBP), respectively, from the serum samples. The

Page 10 of 20
Accep
ted
Man
uscr
ipt
1 2 3 4 5 6 7 8 9 10 11 12 13 14 15 16 17 18 19 20 21 22 23 24 25 26 27 28 29 30 31 32 33 34 35 36 37 38 39 40 41 42 43 44 45 46 47 48 49 50 51 52 53 54 55 56 57 58 59 60 61 62 63 64 65
9
precision and accuracy rates of the measurements of the endogenous steroids were 82.53 %
(1 ng/mL of E1) – 125.19 % (1 ng/mL of DHT) and 0.65% (1 ng/mL of DHT) – 9.63% (1
ng/mL of T) from the urine samples and 78.98 % (1 ng/mL of T) – 133.70 % (1 ng/mL of epi-
T) and 0.52 % (50 ng/mL of DHEA) – 9.14 % (10 ng/mL of P) in the serum samples. The
calibration curves for each target compound showed usable correlation coefficients (For the
EDCs : r2=0.9958 - 0.9997 for the urine samples and 0.9977 - 0.9998 for the serum samples,
and, for the endogenous steroids, r2=0.9978 - 0.9997 for the urine samples and 0.9987 -
0.9998 for the serum samples). The limit of detection (LOD) and the limit of quantitation
(LOQ) were established at signal to noise ratios of 3 and 10, respectively. The LOD and LOQ
of the EDCs were 0.19 – 1.17 ng/mL and 0.64 – 3.87 ng/mL in urine samples, and 0.11 – 1.46
ng/mL and 0.37 – 4.82 ng/mL in serum samples, respectively. The LOD and LOQ of the
endogenous steroids were 0.08 – 0.27 ng/mL and 0.27 – 0.90 ng/mL in urine samples, and
0.05 – 0.23 ng/mL and 0.18 – 0.75 ng/mL in serum samples, respectively.
3.2. Association between the EDCs and the occurrence of childhood obesity in young girl
We measured the level of endocrine-disrupting chemicals (EDCs) in urine and serum
samples of the control group and the obese group by established analytical methods. The
target EDCs were 7 phthalates (MEP, DBP, MBP, DEHP, MEHP, PA and MBzP), BPA and 2
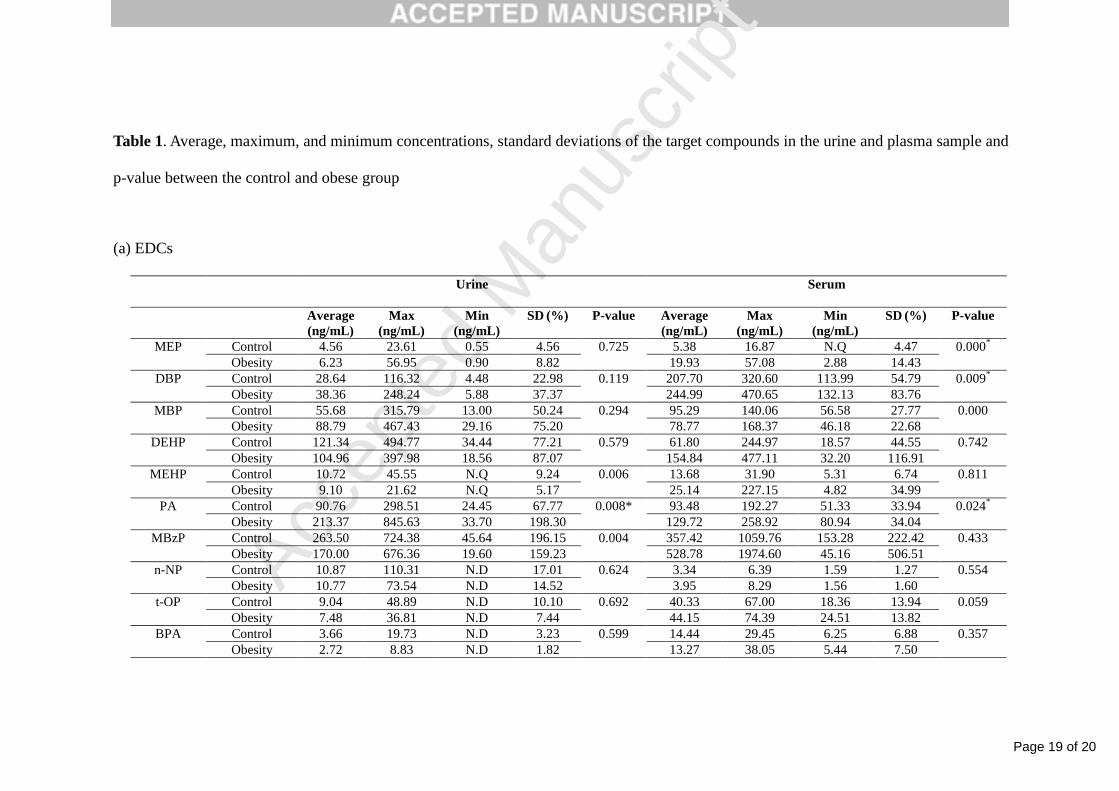
alkylphenols (4-NP and t-OP). Table 1 (a) shows the average, maximum and minimum levels
for EDCs in urine and serum samples of the control and obese groups.
(Table 1)
3.2.1. Phthalates
Previous studies to detect phthalates in urine samples were performed by Teitelbaum et al.
(2012) analyzed the association between nine phthalate metabolites (MEP, MBP, MCPP,
Page 11 of 20
Accep
ted
Man
uscr
ipt
1 2 3 4 5 6 7 8 9 10 11 12 13 14 15 16 17 18 19 20 21 22 23 24 25 26 27 28 29 30 31 32 33 34 35 36 37 38 39 40 41 42 43 44 45 46 47 48 49 50 51 52 53 54 55 56 57 58 59 60 61 62 63 64 65
10
MBzP, MiBP, MEHP, MEOHP, MECPP and MEHHP) and BMI and WC in New York City
children, and Hatch et al. (2008) analyzed the association between six phthalate metabolites
(MEP, MEHP, MBP, MBzP, MEHHP and MEOHP) and BMI and WC in eight age/gender
subgroups. However, MBP showed no clear trends among children and adolescents, and
MBzP showed a no major trends in females. Teitelbaum et al. (2012) found an association
between MEP and low MWP (low molecular weight phthalate metabolites, MEP, MBP and
MiBP) and BMI and WC among overweight children, and Hatch et al. (2008) found a
positive association of MEP (p=0.03) in female adolescents and MBzP, MEOHP, MEHHP,
MEP, and MBP (p=0.0002, for MBzP) in adult males (age 20-59) with BMI and WC.
In the present study, MEP in the urine of the obese group was 1.37 times higher than MEP in
the urine of the control group. Unlike the results of Teitelbaum et al. (2012) and Hatch et al.
(2008), MEP showed no association with childhood obesity. DBP and MBP in the urine of the
obese group were also 1.40 and 1.59 times higher than DBP and MBP in the urine of the
control group; however DBP and MBP showed no association with childhood obesity.
Furthermore, PA in the urine of the obese group was 2.35 times high respectively, than PA in
the urine of the control group. The compounds showed statistically significant relationships
with childhood obesity (PA (p=0.008)).
MEP in the serum of the obese group was 3.70 times higher than MEP in the serum of the
control group. Unlike MEP in the urine, MEP in the serum (p=0.000) showed a statistically
significant association with childhood obesity. DBP in the serum of the obese group was 1.18
times higher than DBP in the serum of the control group and showed a statistically significant
association with childhood obesity (DBP (p = 0.009)). The level of PA in serum of the obese
group was also 1.39 times higher than level of PA in the serum of the control group and
showed a significant association with childhood obesity (p = 0.024).
Page 12 of 20
Accep
ted
Man
uscr
ipt
1 2 3 4 5 6 7 8 9 10 11 12 13 14 15 16 17 18 19 20 21 22 23 24 25 26 27 28 29 30 31 32 33 34 35 36 37 38 39 40 41 42 43 44 45 46 47 48 49 50 51 52 53 54 55 56 57 58 59 60 61 62 63 64 65
11
3.2.2. BPA
We found no associations between urinary BPA concentrations and childhood obesity in
young girls (p = 0.599), which is consistent with the results of Yi et al. (2009) and Galloway
et al. (2010). We examined the previous studies regarding the relationship between urinary
BPA concentrations and childhood obesity, but the previous studies had conflicting results. Yi
et al. (2009) analyzed the BPA levels of obese and normal children in Seoul, Wang et al.
(2012) analyzed the BPA concentrations of 2,921 students in primary and middle schools in
the Changning District of Shanghai City in China, and Trasande et al. (2012) analyzed the
BPA concentrations of a nationally representative subsample of 2,838 participants (age 6~19)
in a cross-sectional analysis. Yi et al. (2009) found no significant association between BPA
levels and childhood obesity, despite showing higher BPA levels in obese children than in
normal children (p = 0.22). In contrast, Wang et al. (2012) found that BPA concentrations and
daily intake estimates of BPA were positively associated with BMI in females and in the 8-11
year age group and Trasande et al. (2012) found that high BPA concentration was associated
with obesity in their cross-sectional study of children and adolescents.
We also examined the previous studies regarding a relationship between urinary BPA
concentrations and adult obesity. Galloway et al. (2010) analyzed daily excretion of BPA
among 715 Italian adults (age 20~74), and Carwile et al. (2011) analyzed the BPA
concentration in 2,747 adults (age 18-74) in the United States. Similar to many studies
dealing with childhood obesity, conflicting results have been obtained. Galloway et al. (2010)
found no association between BPA concentrations and obesity in an overweight group
(p=0.296) and two obese groups (p=0.369, BMI 30.1-34.9 and p=0.738, BMI ≥ 35). In
contrast, Carwile et al. (2011) found association between BPA exposure and obesity.
In this study, we found no association between serum BPA concentrations and childhood
Page 13 of 20
Accep
ted
Man
uscr
ipt
1 2 3 4 5 6 7 8 9 10 11 12 13 14 15 16 17 18 19 20 21 22 23 24 25 26 27 28 29 30 31 32 33 34 35 36 37 38 39 40 41 42 43 44 45 46 47 48 49 50 51 52 53 54 55 56 57 58 59 60 61 62 63 64 65
12
obesity (p = 0.357), which is consistent with the results of Newbold et al. (2007). Takeuchi et
al. (2004) reported a higher serum BPA concentration in obese women than in non-obese
women and found a significant positive association between serum BPA concentrations and
BMI. Masuno et al. (2002) examined the effects on adipose cells treated with BPA in vitro,
showing that BPA in combination with insulin can accelerate the conversion of a adipose
cells. Newbold et al. (2007) observed the weight changes of controls and female mice treated
with BPA. In contrast to the two in vitro studies, these authors found that body weights were
not significantly different between controls and female mice treated with BPA. Many groups
have studied the relationship between BPA and obesity, but the relationship remains unclear.
3.2.3. Alkylphenols
Research involving the relationship between alkylphenols and childhood obesity has been
insufficient until the present studies.
We examined the previous studies regarding the relationships between 4-NP, t-OP and obesity
using in vitro studies and animal studies. Masuno et al. (2002) observed the effect of 4-NP on
cell proliferation and adipocyte formation in cultures of fully differentiated 3T3-L1 cells.
Their results indicated that 4-NP had the ability to stimulate the proliferation of 3T3-L1 cells
but, inhibited the adipocyte formation of 3T3-L1 cells. Hao et al. (2012) tested the dose-
dependent effects of 4-NP on adipocyte differentiation using the 3T3-L1 cell model. In
contrast to the results of Masuno et al. (2002) , Hao et al. (2012) showed that 4-NP induced
adipogenesis and activated PPARγ in adipose tissue. They suggested that perinatal exposure
to 4-NP could increase the incidence of obesity in offspring.
In this study, we found no association between 4-NP and t-OP in urine and serum and
childhood obesity, which is consistent with the results of Masuno. et al. (2002).
Page 14 of 20
Accep
ted
Man
uscr
ipt
1 2 3 4 5 6 7 8 9 10 11 12 13 14 15 16 17 18 19 20 21 22 23 24 25 26 27 28 29 30 31 32 33 34 35 36 37 38 39 40 41 42 43 44 45 46 47 48 49 50 51 52 53 54 55 56 57 58 59 60 61 62 63 64 65
13
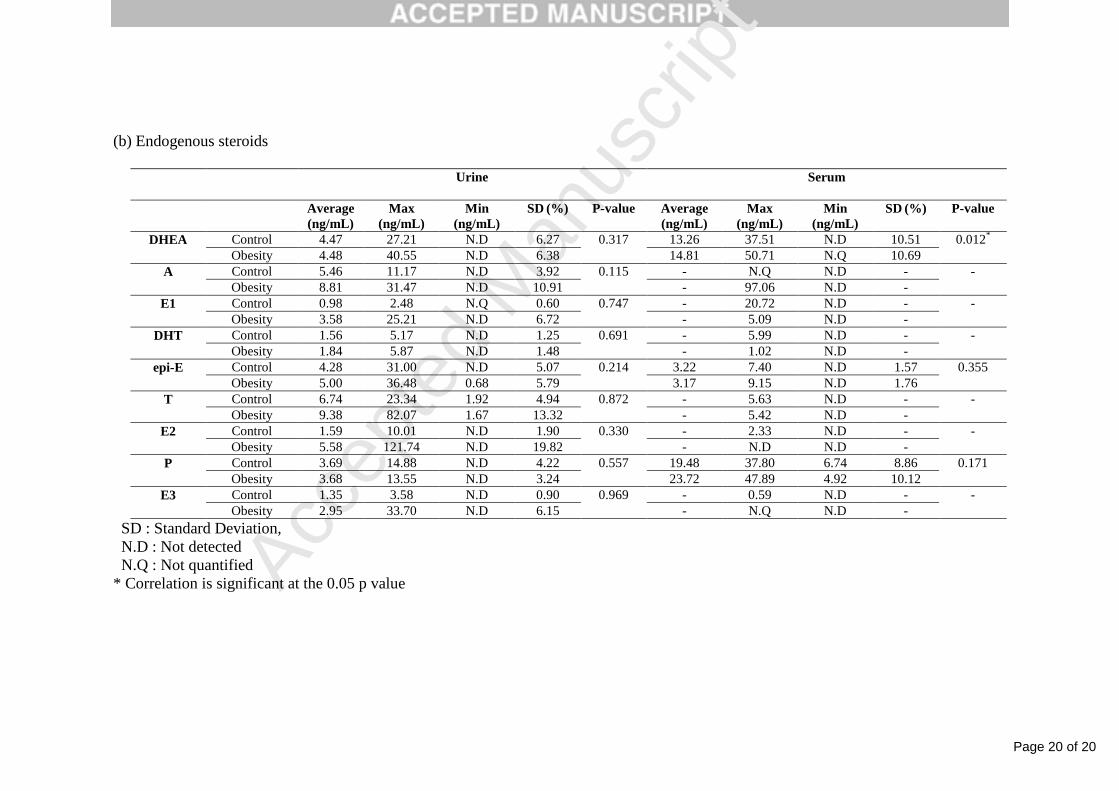
3.3. Association between the EDCs and the levels of endogenous steroids.
We supposed that EDCs is expected to cause a change of the levels of endogenous steroids.
Therefore, we examined the change of the levels of endogenous steroids expected to be
affected by EDCs. The 9 endogenous steroids that were targeted were DHEA, A, E1, DHT,
epi-T, T, E2, P and E3. Table 1 (b) shows the average, maximum and minimum levels for
endogenous steroids in the urine and serum samples of the control and obese groups. In this
study, even though the levels of the endogenous steroids (except P) in the urine of the obese
group ranged from 1.00 (DHEA) to 3.65 (E1) times higher than the levels of the endogenous
steroids (except P) of the control group, we found no significant difference between the
control and the obese groups. Estrogen levels, especially in the urine of the obese group, were,
on average, 3.11 times higher than estrogen levels of the control group. Estrogen is known to
regulate adipose development and deposition in females (Cooke and Naaz, 2004). Previous
studies have examined the association between estrogen and obesity. Dieudonne et al. (2000)
studied the role of sex hormones including estrogens in adipogenesis. Dieudonne et al. (2000)
found that estrogens elicited, in vitro, a mitogenic response in superficial preadipocytes from
female rats and found a more than 2-fold increase in proliferation of superficial preadipocytes
in female rate. Karim et al. (2009) studied the association between two endogenous steroids
(estrone and estradiol) and obesity in postmenopausal women. Serum estrone showed no
association with BMI, but serum total estradiol (p = 0.01) and free estradiol (p = 0.002)
showed an association with BMI. We estimate that EDCs may affect the level of estrogen and
that high levels of estrogen can affect obesity.
DHEA and P levels in the serum of the obese group were 1.12 and 1.22 times higher than
DHEA and P levels of the control group. DHEA showed a statistically significant difference

Page 15 of 20
Accep
ted
Man
uscr
ipt
1 2 3 4 5 6 7 8 9 10 11 12 13 14 15 16 17 18 19 20 21 22 23 24 25 26 27 28 29 30 31 32 33 34 35 36 37 38 39 40 41 42 43 44 45 46 47 48 49 50 51 52 53 54 55 56 57 58 59 60 61 62 63 64 65
14
between the control and the obese group (p = 0.012) in serum. We suggest that EDCs may
have an effect on the elevation of DHEA levels.
4. Conclusion
We studied the association between childhood obesity and endocrine-disrupting chemicals
that were detected in urine and serum. PA in urine showed a statistically significant
relationship to childhood obesity. MEP, DBP and PA in serum showed a statistically
significant relationship to childhood obesity. We concluded that these substances can affect
the development of obesity. In the case of endogenous steroids, DHEA (p=0.012), in
particular, showed a statistically significant difference in serum between the control and the
obese group. We conclude that EDCs may affect the level of estrogens and DHEA that high
levels of estrogens and DHEA may affect the development of obesity.
REFERENCES
Braun, J.M., Yolton, K., Dietrich, K.N., Hornung, R., Ye, X., Calafat, A.M., Lanphear, B.P., 2009.
Prenatal bisphenol A exposure and early childhood behavior. Environ Health Perspect 117, 1945-
1952.
Carwile, J.L., Michels, K.B., 2011. Urinary bisphenol A and obesity: NHANES 2003-2006. Environ
Res 111, 825-830.
Cooke, P.S., Naaz, A., 2004. Role of Estrogens in Adipocyte Development and Function. Exp Biol
Med 229, 1127-1135.
Dieudonne, M.N., Pecquery, R., Leneveu, M.C., Giudicelli, Y., 2000. Opposite Effects of Androgens
and Estrogens on Adipogenesis in Rat Preadipocytes: Evidence for Sex and Site-Related Specificities
and Possible Involvement of Insulin-Like Growth Factor 1 Receptor and Peroxisome Proliferator-
Activated Receptor 2*. Endocrinology 141, 649-656.
Galloway, T., Cipelli, R., Guralnik, J., Ferrucci, L., Bandinelli, S., Corsi, A.M., Money, C., McCormack,
P., Melzer, D., 2010. Daily bisphenol A excretion and associations with sex hormone concentrations:
results from the InCHIANTI adult population study. Environ Health Perspect 118, 1603-1608.
Hao, C.-j., Cheng, X.-j., Xia, H.-f., Ma, X., 2012. The Endocrine Disruptor 4-Nonylphenol Promotes
Adipocyte Differentiation and Induces Obesity in Mice. Cell Physiol Biochem 30, 382-394.
Page 16 of 20
Accep
ted
Man
uscr
ipt
1 2 3 4 5 6 7 8 9 10 11 12 13 14 15 16 17 18 19 20 21 22 23 24 25 26 27 28 29 30 31 32 33 34 35 36 37 38 39 40 41 42 43 44 45 46 47 48 49 50 51 52 53 54 55 56 57 58 59 60 61 62 63 64 65
15
Hatch, E.E., Nelson, J.W., Qureshi, M.M., Weinberg, J., Moore, L.L., Singer, M., Webster, T.F., 2008.
Association of urinary phthalate metabolite concentrations with body mass index and waist
circumference: a cross-sectional study of NHANES data, 1999-2002. Environ Health 7, 27.
Hatch, E.E., Nelson, J.W., Stahlhut, R.W., Webster, T.F., 2010. Association of endocrine disruptors
and obesity: perspectives from epidemiological studies. Int J Androl 33, 324-332.
Honma, S., Suzuki, A., Buchanan, D.L., Katsu, Y., Watanabe, H., Iguchi, T., 2002. Low dose effect of
in utero exposure to bisphenol A and diethylstilbestrol on female mouse reproduction. Reprod Toxicol
16, 117-122.
Karim, R., Mack, W.J., Hodis, H.N., Roy, S., Stanczyk, F.Z., 2009. Influence of age and obesity on
serum estradiol, estrone, and sex hormone binding globulin concentrations following oral estrogen
administration in postmenopausal women. J Clin Endocrinol Metab 94, 4136-4143.
Lopez-Espinosa, M.J., Freire, C., Arrebola, J.P., Navea, N., Taoufiki, J., Fernandez, M.F., Ballesteros,
O., Prada, R., Olea, N., 2009. Nonylphenol and octylphenol in adipose tissue of women in Southern
Spain. Chemosphere 76, 847-852.
Masuno, H., Kidani, T., Sekiya, K., Sakayama, K., Shiosaka, T., Yamamoto, H., Honda, K., 2002.
Bisphenol A in combination with insulin can accelerate the conversion of 3T3-L1 fibroblasts to
adipocytes. J. Lipid. Res 43, 676-684.
Masuno, H., Okamoto, S., Iwanami, J., Honda, K., Shiosaka, T., Kidani, T., Sakayama, K., Yamamoto,
H., 2003. Effect of 4-nonylphenol on cell proliferation and adipocyte formation in cultures of fully
differentiated 3T3-L1 cells. Toxicol Sci 75, 314-320.
Newbold, R.R., Jefferson, W.N., Banks, E.P., 2007. Long-term Adverse Effects of Neonatal Exposure
to Bisphenol A on the Murine Female Reproductive Tract. Reprod Toxicol 24, 253-258.
Ogden, C.L., Carroll, M.D., Kit, B.K., Flegal, K.M., 2012. Prevalence of obesity and trends in body
mass index among US children and adolescents, 1999-2010. JAMA 307, 483-490.
Oh, K., Jang, M.J., Lee, N.Y., Moon, J.S., Lee, C.G., Yoo, M.H., Kim, Y.T., 2008. Prevalence and
trends in obesity among Korean children and adolescents in 1997 and 2005. Korean J Pediatr 51, 950.
Shankar, A., Teppala, S., Sabanayagam, C., 2012. Urinary bisphenol a levels and measures of
obesity: results from the national health and nutrition examination survey 2003-2008. ISRN Endocrinol
2012, 965243.
Takeuchi, T., Tsutsumi, O., Ikezuki, Y., Takai, Y., Taketani, Y., 2004. Positive Relationship between
Androgen and the Endocrine Disruptor, Bisphenol A, in Normal Women and Women with Ovarian
Dysfunction. Endocrine Journal 51, 165-169.
Tang-Peronard, J.L., Andersen, H.R., Jensen, T.K., Heitmann, B.L., 2011. Endocrine-disrupting
chemicals and obesity development in humans: a review. Obes Rev 12, 622-636.
Teitelbaum, S.L., Mervish, N., Moshier, E.L., Vangeepuram, N., Galvez, M.P., Calafat, A.M., Silva,
M.J., Brenner, B.L., Wolff, M.S., 2012. Associations between phthalate metabolite urinary
concentrations and body size measures in New York City children. Environ Res 112, 186-193.
Trasande, L., Attina, T.M., Blustein, J., 2012. Association Between Urinary Bisphenol A Concentration

Page 17 of 20
Accep
ted
Man
uscr
ipt
1 2 3 4 5 6 7 8 9 10 11 12 13 14 15 16 17 18 19 20 21 22 23 24 25 26 27 28 29 30 31 32 33 34 35 36 37 38 39 40 41 42 43 44 45 46 47 48 49 50 51 52 53 54 55 56 57 58 59 60 61 62 63 64 65
16
and Obesity Prevalence in Children and Adolescents. JAMA 308, 1113-1121.
Wang, H.X., Zhou, Y., Tang, C.X., Wu, J.G., Chen, Y., Jiang, Q.W., 2012. Association between
bisphenol a exposure and body mass index in Chinese school children: a cross-sectional study.
Environ Health 11, 79.
Yi, B., Shin, H.J., Na, H., Lee, N.K., Yang, M., 2009. Bisphenol A Exposure and Childhood Obesity. J.
ENVIRON. TOXICOL. 24, 287-292.

Page 18 of 20
Accep
ted
Man
uscr
ipt
Table Legend
Table 1. Average, maximum, and minimum concentrations, standard deviations of the target compounds in the urine and plasma sample and
p-value between the control and obese group
Table
Page 19 of 20
Accep
ted
Man
uscr
ipt
Table 1. Average, maximum, and minimum concentrations, standard deviations of the target compounds in the urine and plasma sample and
p-value between the control and obese group
(a) EDCs
Urine Serum
Average
(ng/mL)
Max
(ng/mL)
Min
(ng/mL)
SD (%) P-value Average
(ng/mL)
Max
(ng/mL)
Min
(ng/mL)
SD (%) P-value
MEP Control 4.56 23.61 0.55 4.56 0.725 5.38 16.87 N.Q 4.47 0.000*
Obesity 6.23 56.95 0.90 8.82 19.93 57.08 2.88 14.43
DBP Control 28.64 116.32 4.48 22.98 0.119 207.70 320.60 113.99 54.79 0.009*
Obesity 38.36 248.24 5.88 37.37 244.99 470.65 132.13 83.76
MBP Control 55.68 315.79 13.00 50.24 0.294 95.29 140.06 56.58 27.77 0.000
Obesity 88.79 467.43 29.16 75.20 78.77 168.37 46.18 22.68
DEHP Control 121.34 494.77 34.44 77.21 0.579 61.80 244.97 18.57 44.55 0.742
Obesity 104.96 397.98 18.56 87.07 154.84 477.11 32.20 116.91
MEHP Control 10.72 45.55 N.Q 9.24 0.006 13.68 31.90 5.31 6.74 0.811
Obesity 9.10 21.62 N.Q 5.17 25.14 227.15 4.82 34.99
PA Control 90.76 298.51 24.45 67.77 0.008* 93.48 192.27 51.33 33.94 0.024*
Obesity 213.37 845.63 33.70 198.30 129.72 258.92 80.94 34.04
MBzP Control 263.50 724.38 45.64 196.15 0.004 357.42 1059.76 153.28 222.42 0.433
Obesity 170.00 676.36 19.60 159.23 528.78 1974.60 45.16 506.51
n-NP Control 10.87 110.31 N.D 17.01 0.624 3.34 6.39 1.59 1.27 0.554
Obesity 10.77 73.54 N.D 14.52 3.95 8.29 1.56 1.60
t-OP Control 9.04 48.89 N.D 10.10 0.692 40.33 67.00 18.36 13.94 0.059
Obesity 7.48 36.81 N.D 7.44 44.15 74.39 24.51 13.82
BPA Control 3.66 19.73 N.D 3.23 0.599 14.44 29.45 6.25 6.88 0.357
Obesity 2.72 8.83 N.D 1.82 13.27 38.05 5.44 7.50
Page 20 of 20
Accep
ted
Man
uscr
ipt
(b) Endogenous steroids
Urine Serum
Average
(ng/mL)
Max
(ng/mL)
Min
(ng/mL)
SD (%) P-value Average
(ng/mL)
Max
(ng/mL)
Min
(ng/mL)
SD (%) P-value
DHEA Control 4.47 27.21 N.D 6.27 0.317 13.26 37.51 N.D 10.51 0.012*
Obesity 4.48 40.55 N.D 6.38 14.81 50.71 N.Q 10.69
A Control 5.46 11.17 N.D 3.92 0.115 - N.Q N.D - -
Obesity 8.81 31.47 N.D 10.91 - 97.06 N.D -
E1 Control 0.98 2.48 N.Q 0.60 0.747 - 20.72 N.D - -
Obesity 3.58 25.21 N.D 6.72 - 5.09 N.D -
DHT Control 1.56 5.17 N.D 1.25 0.691 - 5.99 N.D - -
Obesity 1.84 5.87 N.D 1.48 - 1.02 N.D -
epi-E Control 4.28 31.00 N.D 5.07 0.214 3.22 7.40 N.D 1.57 0.355
Obesity 5.00 36.48 0.68 5.79 3.17 9.15 N.D 1.76
T Control 6.74 23.34 1.92 4.94 0.872 - 5.63 N.D - -
Obesity 9.38 82.07 1.67 13.32 - 5.42 N.D -
E2 Control 1.59 10.01 N.D 1.90 0.330 - 2.33 N.D - -
Obesity 5.58 121.74 N.D 19.82 - N.D N.D -
P Control 3.69 14.88 N.D 4.22 0.557 19.48 37.80 6.74 8.86 0.171
Obesity 3.68 13.55 N.D 3.24 23.72 47.89 4.92 10.12
E3 Control 1.35 3.58 N.D 0.90 0.969 - 0.59 N.D - -
Obesity 2.95 33.70 N.D 6.15 - N.Q N.D -
SD : Standard Deviation,
N.D : Not detected
N.Q : Not quantified
* Correlation is significant at the 0.05 p value