association between plural legal … · maternal and child health: infant mortality, ......
TRANSCRIPT

ASSOCIATION BETWEEN PLURAL LEGAL SYSTEMS AND SEXUAL AND REPRODUCTIVE HEALTH OUTCOMES FOR WOMEN AND GIRLS IN NORTHERN NIGERIA
A Regional and State-level Ecological Study from 1990-2013
Terry McGovern JDHarriet and Robert H Heilbrunn Professor and Chair Population and Family HealthColumbia Mailman School of Public Health
Valentina Parisi MS MPHRachel Fowler MPH Candidate 2018
OVERVIEW
Human Rights amp Plural-legal Systems
Situation in Nigeria
Data Sources
Time-trend analysis
Associations amp Mediators
Conclusions
CONVENTION ON THE ELIMINATION OF ALL FORMS OF DISCRIMINATION AGAINST WOMEN (CEDAW) IMPACT ON SEXUAL amp REPRODUCTIVE HEALTH
In particular Article 10 Access to specific educational information to help ensure the health and
well-being of families including information and advice on family planning Article 12 Ensure appropriate services in connection with pregnancy confinement and
the post-natal period granting free services where necessary Article 14 Ensure the right to have access to adequate health care facilities including
information counselling and services om family planning
Article 16 A womanrsquos right to exercise choice as to whether or not to marry who to marry and when to marry The marriage of a child will have no legal effect
Customs practices and laws that discriminate against women must be abolished
PLURAL LEGAL SYSTEMS
Countries with plural or multiple legal systems allow various sources of law to govern simultaneously Examples include English common law French civil or other law Statutory law Customary law Religious
law Traditionpractice
Customary and religious laws enjoy the status of binding sources of law or practice in the vast majority of countries in the African region and a number of countries in Asia and the Americas
These laws permit cultural and religious customs or practices some of which are discriminatory to persist which have direct implications on adolescent rights and health
CUSTOMARY RELIGIOUS AND TRADITIONAL LAWLEGAL PLURALISM PERMITS RELIGIOUS TRADITIONAL AND CUSTOMARY LAW OR PRACTICE TO TRUMP NATIONAL LEGISLATION THROUGH TWO PRIMARY AVENUES
Reservations to international conventions (ie CEDAW) on grounds based on Islamic law Areas regulating matters of
personal status (marriage etc) Laws of personal status as
determined by various religiousethnic communities
Exceptions to national legal frameworks based on customaryreligioustraditional law Example national legislation sets age
of marriage at 18 but exceptions for religiouscustomary laws exists which have their own rules regarding age of marriage
NIGERIA LEGAL SYSTEM
Nigeria has a tripartite legal system consisting of statutory customary as well as religious law (in the northern states)
These three bodies of law create contradictions and inconsistencies and discriminatory provisions are widespread within each source of law
Nigeria ratified CEDAW without reservation in 1985
Nigerian National Assembly rejected the domestication of the CEDAW and it therefore is not part of Nigeriarsquos national legal framework and is not justiciable or enforceable
NIGERIA LEGAL FRAMEWORK
NIGERIA LAWS AND POLICIES
Family Life and HIVAIDS Education (FLHE) 2002 adopted in 34 of 37 states but poor implementation everywhere
National Gender Policy remains un-implemented
National Policy of Health and Development of Adolescents and Young People (2007) poor implementation availability and accessibility to youth services remains critically low
National Policy on Population for Sustainable Development
CEDAW implementation has stalled
Abuja Declaration Nigeria has not allocated 15 of its annual budget to health
LEGAL SYSTEMS amp GEOGRAPHY
12 Northern States have customary andor religious law exceptionsSince 2000 these states have added criminal law to the jurisdiction of Sharirsquoa courts
Research Question Do states with customary and religious laws and laws that impede access to sexual and reproductive health services have worse SRH outcomes
DATA SOURCES
Nigerian Demographic and Health Survey Reports (1990 1999 2003 2008 2013)
Exposure living in an region or state with customary and religious laws and laws that impede access to sexual and reproductive health services
Regional data for all DHSs
State-level data for 2008 and 2013
Indicators
Fertility total fertility rate median age at firth birth unmet need for family planning total demand for FP percentage demand satisfied
Sexual Health knowledge of contraceptive method current use of contraception heard of family planning on mass media knowledge of HIVAIDS
Maternal and Child Health infant mortality antenatal care provider health facility delivery assistance during delivery
Other education participation in own health decisions median age of marriage
REGIONAL TIME TRENDS (1990-2013)
0
10
20
30
40
50
60
70
80
90
100
1990 1999 2003 2008 2013
Perc
ent
()
Women with any level of education
Northeast
Northwest
Southeast
Southwest
Southsouth
10
12
14
16
18
20
22
24
1990 1999 2003 2008 2013
Age
Median Age at First Marraige (women 25-49)
FERTILITY
3
35
4
45
5
55
6
65
7
75
8
1990 1999 2003 2008 2013
Num
ber
of C
hild
ren
Born
per
Wom
an
Total Fertility Rate
Northeast
Northwest
Southeast
Southwest
Southsouth
15
16
17
18
19
20
21
22
23
24
25
1990 1999 2003 2008 2013
Age
Median Age at First Birth of Women Ages 25-49
FAMILY PLANNING
15
25
35
45
55
65
75
85
95
105
1990 1999 2003 2008 2013
Perc
ent
()
Knowledge of at least one contraceptive method
Northeast
Northwest
Southeast
Southwest
Southsouth
0
5
10
15
20
25
30
35
40
1990 1999 2003 2008 2013
Perc
ent
()
Current use of contraceptive method (married women)
MATERNAL HEALTH
0
10
20
30
40
50
60
70
80
90
1990 1999 2003 2008 2013
Perc
ent
()
Facility Delivery
0
10
20
30
40
50
60
70
80
1990 1999 2003 2008 2013
Perc
ent
()
No Antenatal Care Provision
Northeast
Northwest
Southeast
Southwest
Southsouth
0
10
20
30
40
50
60
2008 2013
Current Use of Contraception (married women - percentage)
FCT - Abuja Benue Kogi Kwara Nasarawa Plateau Adamawa Taraba
Abia Anambra Ebonyi Enugu Imo Akawa Ibom Bayelsa Cross River
Delta Edo Rivers Ekiti Lagos Ogun Ondo Osun
Oyo Niger Bauchi Borno Gombe Yobe Jigawa Kaduna
Kano Katsina Kebbi Sokoto Zamfara
STATE-LEVEL TIME TRENDS (2008-2013)
STATE-LEVEL TIME TRENDS (2008-2013)
0
10
20
30
40
50
60
70
80
90
100
2008 2013
Facility Delivery (Percentage)
FCT - Abuja Benue Kogi Kwara Nasarawa Plateau Adamawa Taraba
Abia Anambra Ebonyi Enugu Imo Akawa Ibom Bayelsa Cross River
Delta Edo Rivers Ekiti Lagos Ogun Ondo Osun
Oyo Niger Bauchi Borno Gombe Yobe Jigawa Kaduna
Kano Katsina Kebbi Sokoto Zamfara
STATUS OF WOMENrsquoS HEALTH 2013
States wo (n=25) States w (n=12) Sig (2-tailed)Determinants of HealthMedian age at first birth women aged 25-49 217 184Education level (none) 208 671 lt00001 who participate in their own health care decisions 611 163 lt00001Fertility Total Fertility Rate 474 671 lt00001 of 15-19 yo who have begun childbearing 122 367 lt00001Family PlanningSRHHeard of any contraception method 939 739 lt00001Current use of any contraception method (married women) 264 37 lt00001Have NOT heard FP message on radio or TV 513 798 lt00001Knoweldge of HIVAIDS 938 891 0102Maternal HealthNo Antenatal Care provider 146 521 lt00001Health facility delivery 621 145 lt00001No assistance during delivery 31 184 lt00001
Sheet1
Percentage of females without any level of education
Northeast19901999200320082013826468655611Northwest1990199920032008201386264599999999999994722675628Southeast19901999200320082013431188178208187Southwest1990199920032008201329722823321517100000000000001Southsouth1990199920032008201320614913Northcentral19901999200320082013414093929999999999999738
Percent of women who did not receive ANC
Northeast1990199920032008201354754147151240799999999999997Northwest19901999200320082013524650999999999999945967099999999999994554Southeast199019992003200820131960000000000000177087442Southwest199019992003200820137735229999999999999985757Southsouth19901999200320082013168188206Northcentral1990199920032008201320225326226
Percent of women who delivered in a facility
Northeast1990199920032008201310411717100000000000001128195Northwest19901999200320082013969999999999999936410484115Southeast199019992003200820134635498417390000000000000678099999999999994Southwest19901999200320082013636672775999999999999947075Southsouth19901999200320082013532481501Northcentral1990199920032008201344345441457
Percent of women delivered without assistance
Northeast199019992003200820135612321981860000000000000196999999999999993Northwest19901999200320082013635255305438278Southeast199019992003200820131592299999999999999804315Southwest1990199920032008201315724093213Southsouth19901999200320082013183118Northcentral199019992003200820134099999999999999691019999999999999965
Percentage of women with any level of education
Northeast19901999200320082013183632345389Northwest1990199920032008201313799999999999997354000000000000062779999999999999732537200000000000003Southeast19901999200320082013569812822792813Southwest19901999200320082013703772767785829Southsouth199019992003200820137940000000000000685187
Percentage ()
Total Fertility Rate
Northeast19901999200320082013653267977263Northwest1990199920032008201366449999999999996645677367Southeast199019992003200820135573000000000000446399999999999997409999999999999964847Southwest199019992003200820135461000000000000345409999999999999964545999999999999996Southsouth19901999200320082013459999999999999964743
Total Fertiliy Rate
Median Age at First Birth of Women Ages 25-49
Northeast19901999200320082013188182178182188Northwest199019992003200820131951860000000000000117818317899999999999999Southeast199019992003200820131960000000000000121227236237Southwest19901999200320082013205211221227227Southsouth19901999200320082013198214218
Age
Percent of women who know at least 1 contraceptive method
Northeast1990199920032008201324354635586732Northwest199019992003200820133034227509999999999999445181099999999999994Southeast1990199920032008201356681599999999999994871855959Southwest19901999200320082013735999999999999948729795964Southsouth19901999200320082013942899977
Percent ()
Current use of contraceptive method amongst married women
Northeast1990199920032008201323142432Northwest199019992003200820131232490000000000000042843Southeast1990199920032008201388000000000000007235225234293Southwest19901999200320082013152623270000000000000331738Southsouth19901999200320082013254262281
Percent ()
Median Age at First Marraige (women 25-49)
Northeast199019992003200820131521515156163Northwest19901999200320082013154146146152153Southeast19901999200320082013183202218228227Southwest19901999200320082013197202213219218Southsouth19901999200320082013192209215
Age
No Antenatal Care Provision
Northeast1990199920032008201354754147151240799999999999997Northwest19901999200320082013524650999999999999945967099999999999994554Southeast199019992003200820131960000000000000177087442Southwest199019992003200820137735229999999999999985757Southsouth19901999200320082013168188206
Percent ()
Total fertility rate
Northeast19901999200320082013653267977263Northwest1990199920032008201366449999999999996645677367Southeast199019992003200820135573000000000000446399999999999997409999999999999964847Southwest199019992003200820135461000000000000345409999999999999964545999999999999996Southsouth19901999200320082013459999999999999964743Northcentral1990199920032008201371449575453
Facility Delivery
Northeast1990199920032008201310411717100000000000001128195Northwest19901999200320082013969999999999999936410484115Southeast199019992003200820134635498417390000000000000678099999999999994Southwest19901999200320082013636672775999999999999947075Southsouth19901999200320082013532481501
Percent()
Neonatal mortality19901999200320082013578251554744Infant mortality1990199920032008201310988261149189Neonatal mortality38637299999999999997345137Infant mortality827743669582
Infant Mortality
Northeast199019992003200820138777940000000000000612510977Northwest1990199920032008201310988261149189Southeast19901999200320082013827743669582Southwest1990199920032008201384669900000000000006695961Southsouth199019992003200820131208458
Percent ()
Median Age at First Birth of Women Ages 25-49
Northeast19901999200320082013188182178182188Northwest199019992003200820131951860000000000000117818317899999999999999Southeast199019992003200820131960000000000000121227236237Southwest19901999200320082013205211221227227Southsouth19901999200320082013198214218Northcentral1990199920032008201319819720206
Percent of women who know about at least 1 contraceptive method
Northeast1990199920032008201324354635586732Northwest199019992003200820133034227509999999999999445181099999999999994Southeast1990199920032008201356681599999999999994871855959Southwest19901999200320082013735999999999999948729795964Southsouth19901999200320082013942899977Northcentral19901999200320082013707740000000000000664378599999999999994
Use of contraceptive method (married women)
Northeast1990199920032008201323142432Northwest199019992003200820131232490000000000000042843Southeast1990199920032008201388000000000000007235225234293Southwest19901999200320082013152623270000000000000331738Southsouth19901999200320082013254262281Northcentral1990199920032008201317813313156
Median Age at First Marraige (women 25-49)
Northeast199019992003200820131521515156163Northwest19901999200320082013154146146152153Southeast19901999200320082013183202218228227Southwest19901999200320082013197202213219218Southsouth19901999200320082013192209215Northcentral199019992003200820131789999999999999917718318899999999999999
Total unmet need for FP
Northeast199019992003200820132091221810000000000000117600000000000001175Northwest1990199920032008201314224411120812Southeast199019992003200820132632091889999999999999918100000000000001125Southwest1990199920032008201323157172197154Southsouth19901999200320082013245259222Northcentral19901999200320082013163218187235
Total demand for FP
Northeast19901999200320082013229153223216207Northwest1990199920032008201315427616100000000000001235163Southeast1990199920032008201335299999999999997444414415418Southwest1990199920032008201338419499513535Southsouth19901999200320082013499522502Northcentral19901999200320082013341351317391
Percentage of FP demand satisfied
Northeast19901999200320082013880000000000000072019187152Northwest1990199920032008201379117308117262Southeast199019992003200820132545354356370Southwest199019992003200820133956256559999999999999461771099999999999994Southsouth19901999200320082013509503559Northcentral1990199920032008201352237941399
Nigeria laws
States 2008
States 2013
States 2013 (2)
State trends
FCT - Abuja2008201328252Benue20082013142165Kogi2008201396999999999999993105Kwara2008201324640200000000000003Nasarawa200820131218100000000000001Plateau20082013111152Adamawa200820132844000000000000004Taraba2008201358Abia20082013239334Anambra2008201334435Ebonyi2008201361157Enugu20082013211314Imo20082013227341Akawa Ibom2008201332700000000000003255Bayelsa20082013101133Cross River2008201320324Delta20082013266287Edo20082013316303Rivers20082013272345Ekiti20082013173345Lagos20082013496483Ogun2008201313926Ondo20082013212311Osun200820133838299999999999997Oyo20082013219374Niger200820134599999999999999666Bauchi200820132722000000000000002Borno200820136518Gombe20082013564Yobe200820131911000000000000001Jigawa200820130209Kaduna2008201396202Kano200820132299999999999999806Katsina200820130813Kebbi200820131913Sokoto200820132111000000000000001Zamfara20082013253
Facility Delivery
FCT - Abuja2008201354269099999999999994Benue20082013509509Kogi2008201377378900000000000006Kwara20082013488767Nasarawa20082013329401Plateau2008201330235799999999999997Adamawa20082013107334Taraba20082013211234Abia2008201374400000000000006728Anambra20082013878846Ebonyi2008201340700000000000003596Enugu20082013536855Imo20082013943909Akawa Ibom20082013369432Bayelsa2008201318399999999999999284Cross River20082013385404Delta20082013572576Edo20082013762747Rivers2008201347949Ekiti20082013752863Lagos2008201376900000000000006772Ogun20082013638747Ondo20082013469562Osun20082013851891Oyo2008201367099999999999994747Niger20082013159253Bauchi200820131316899999999999999Borno2008201311817Gombe20082013172276Yobe200820136176Jigawa200820134567Kaduna2008201318399999999999999324Kano20082013111129Katsina20082013429Kebbi200820134885Sokoto200820134400000000000000447Zamfara20082013655
Percentage receiving no antenatal care
FCT - Abuja200820138959Benue20082013305396Kogi2008201314254Kwara2008201333949000000000000004Nasarawa20082013232305Plateau20082013157339Adamawa2008201337799999999999997134Taraba2008201346337299999999999997Abia200820138300000000000000747Anambra200820130843Ebonyi200820132010000000000000171Enugu2008201310832Imo200820132509Akawa Ibom20082013126225Bayelsa20082013355517Cross River20082013159138Delta200820131917899999999999999Edo2008201354144Rivers2008201326620Ekiti20082013322999999999999998Lagos200820131812Ogun200820135422999999999999998Ondo20082013147146Osun200820130615Oyo20082013105106Niger2008201339200000000000003282Bauchi2008201349133200000000000003Borno20082013648587Gombe20082013405225Yobe2008201362565599999999999994Jigawa20082013787472Kaduna2008201336200000000000003442Kano20082013487354Katsina20082013828658Kebbi20082013847712Sokoto20082013853797Zamfara2008201385573599999999999994
STATUS OF WOMENrsquoS HEALTH 2013
NORTHERN STATES ONLY
States wo (n=8) States w (n=12) Sig (2-tailed)Determinants of Health
Median age at first birth women aged 25-49 208 184Education level (none) 310 671 lt00001 who participate in their own health care decisions 541 163 lt00001Fertility Total Fertility Rate 520 671 0003 of 15-19 yo who have begun childbearing 1738 3673 lt00001
Family PlanningSRHHeard of any contraception method 8734 7388 001Current use of any contraception method (married women) 1726 368 0001Have NOT heard FP message on radio or TV 6414 7982 003Knoweldge of HIVAIDS 8988 8906 043Maternal Health
No Antenatal Care provider 2136 5211 lt00001
Health facility delivery 5104 1447 lt00001
No assistance during delivery 670 1838 002
Sheet1
Percentage of females without any level of education
Northeast19901999200320082013826468655611Northwest1990199920032008201386264599999999999994722675628Southeast19901999200320082013431188178208187Southwest1990199920032008201329722823321517100000000000001Southsouth1990199920032008201320614913Northcentral19901999200320082013414093929999999999999738
Percent of women who did not receive ANC
Northeast1990199920032008201354754147151240799999999999997Northwest19901999200320082013524650999999999999945967099999999999994554Southeast199019992003200820131960000000000000177087442Southwest199019992003200820137735229999999999999985757Southsouth19901999200320082013168188206Northcentral1990199920032008201320225326226
Percent of women who delivered in a facility
Northeast1990199920032008201310411717100000000000001128195Northwest19901999200320082013969999999999999936410484115Southeast199019992003200820134635498417390000000000000678099999999999994Southwest19901999200320082013636672775999999999999947075Southsouth19901999200320082013532481501Northcentral1990199920032008201344345441457
Percent of women delivered without assistance
Northeast199019992003200820135612321981860000000000000196999999999999993Northwest19901999200320082013635255305438278Southeast199019992003200820131592299999999999999804315Southwest1990199920032008201315724093213Southsouth19901999200320082013183118Northcentral199019992003200820134099999999999999691019999999999999965
Percentage of women with any level of education
Northeast19901999200320082013183632345389Northwest1990199920032008201313799999999999997354000000000000062779999999999999732537200000000000003Southeast19901999200320082013569812822792813Southwest19901999200320082013703772767785829Southsouth199019992003200820137940000000000000685187
Percentage ()
Total Fertility Rate
Northeast19901999200320082013653267977263Northwest1990199920032008201366449999999999996645677367Southeast199019992003200820135573000000000000446399999999999997409999999999999964847Southwest199019992003200820135461000000000000345409999999999999964545999999999999996Southsouth19901999200320082013459999999999999964743
Total Fertiliy Rate
Median Age at First Birth of Women Ages 25-49
Northeast19901999200320082013188182178182188Northwest199019992003200820131951860000000000000117818317899999999999999Southeast199019992003200820131960000000000000121227236237Southwest19901999200320082013205211221227227Southsouth19901999200320082013198214218
Age
Percent of women who know at least 1 contraceptive method
Northeast1990199920032008201324354635586732Northwest199019992003200820133034227509999999999999445181099999999999994Southeast1990199920032008201356681599999999999994871855959Southwest19901999200320082013735999999999999948729795964Southsouth19901999200320082013942899977
Percent ()
Current use of contraceptive method amongst married women
Northeast1990199920032008201323142432Northwest199019992003200820131232490000000000000042843Southeast1990199920032008201388000000000000007235225234293Southwest19901999200320082013152623270000000000000331738Southsouth19901999200320082013254262281
Percent ()
Median Age at First Marraige (women 25-49)
Northeast199019992003200820131521515156163Northwest19901999200320082013154146146152153Southeast19901999200320082013183202218228227Southwest19901999200320082013197202213219218Southsouth19901999200320082013192209215
Age
No Antenatal Care Provision
Northeast1990199920032008201354754147151240799999999999997Northwest19901999200320082013524650999999999999945967099999999999994554Southeast199019992003200820131960000000000000177087442Southwest199019992003200820137735229999999999999985757Southsouth19901999200320082013168188206
Percent ()
Total fertility rate
Northeast19901999200320082013653267977263Northwest1990199920032008201366449999999999996645677367Southeast199019992003200820135573000000000000446399999999999997409999999999999964847Southwest199019992003200820135461000000000000345409999999999999964545999999999999996Southsouth19901999200320082013459999999999999964743Northcentral1990199920032008201371449575453
Facility Delivery
Northeast1990199920032008201310411717100000000000001128195Northwest19901999200320082013969999999999999936410484115Southeast199019992003200820134635498417390000000000000678099999999999994Southwest19901999200320082013636672775999999999999947075Southsouth19901999200320082013532481501
Percent()
Neonatal mortality19901999200320082013578251554744Infant mortality1990199920032008201310988261149189Neonatal mortality38637299999999999997345137Infant mortality827743669582
Infant Mortality
Northeast199019992003200820138777940000000000000612510977Northwest1990199920032008201310988261149189Southeast19901999200320082013827743669582Southwest1990199920032008201384669900000000000006695961Southsouth199019992003200820131208458
Percent ()
Median Age at First Birth of Women Ages 25-49
Northeast19901999200320082013188182178182188Northwest199019992003200820131951860000000000000117818317899999999999999Southeast199019992003200820131960000000000000121227236237Southwest19901999200320082013205211221227227Southsouth19901999200320082013198214218Northcentral1990199920032008201319819720206
Percent of women who know about at least 1 contraceptive method
Northeast1990199920032008201324354635586732Northwest199019992003200820133034227509999999999999445181099999999999994Southeast1990199920032008201356681599999999999994871855959Southwest19901999200320082013735999999999999948729795964Southsouth19901999200320082013942899977Northcentral19901999200320082013707740000000000000664378599999999999994
Use of contraceptive method (married women)
Northeast1990199920032008201323142432Northwest199019992003200820131232490000000000000042843Southeast1990199920032008201388000000000000007235225234293Southwest19901999200320082013152623270000000000000331738Southsouth19901999200320082013254262281Northcentral1990199920032008201317813313156
Median Age at First Marraige (women 25-49)
Northeast199019992003200820131521515156163Northwest19901999200320082013154146146152153Southeast19901999200320082013183202218228227Southwest19901999200320082013197202213219218Southsouth19901999200320082013192209215Northcentral199019992003200820131789999999999999917718318899999999999999
Total unmet need for FP
Northeast199019992003200820132091221810000000000000117600000000000001175Northwest1990199920032008201314224411120812Southeast199019992003200820132632091889999999999999918100000000000001125Southwest1990199920032008201323157172197154Southsouth19901999200320082013245259222Northcentral19901999200320082013163218187235
Total demand for FP
Northeast19901999200320082013229153223216207Northwest1990199920032008201315427616100000000000001235163Southeast1990199920032008201335299999999999997444414415418Southwest1990199920032008201338419499513535Southsouth19901999200320082013499522502Northcentral19901999200320082013341351317391
Percentage of FP demand satisfied
Northeast19901999200320082013880000000000000072019187152Northwest1990199920032008201379117308117262Southeast199019992003200820132545354356370Southwest199019992003200820133956256559999999999999461771099999999999994Southsouth19901999200320082013509503559Northcentral1990199920032008201352237941399
Nigeria laws
States 2008
States 2013
States 2013 (2)
State trends
FCT - Abuja2008201328252Benue20082013142165Kogi2008201396999999999999993105Kwara2008201324640200000000000003Nasarawa200820131218100000000000001Plateau20082013111152Adamawa200820132844000000000000004Taraba2008201358Abia20082013239334Anambra2008201334435Ebonyi2008201361157Enugu20082013211314Imo20082013227341Akawa Ibom2008201332700000000000003255Bayelsa20082013101133Cross River2008201320324Delta20082013266287Edo20082013316303Rivers20082013272345Ekiti20082013173345Lagos20082013496483Ogun2008201313926Ondo20082013212311Osun200820133838299999999999997Oyo20082013219374Niger200820134599999999999999666Bauchi200820132722000000000000002Borno200820136518Gombe20082013564Yobe200820131911000000000000001Jigawa200820130209Kaduna2008201396202Kano200820132299999999999999806Katsina200820130813Kebbi200820131913Sokoto200820132111000000000000001Zamfara20082013253
Facility Delivery
FCT - Abuja2008201354269099999999999994Benue20082013509509Kogi2008201377378900000000000006Kwara20082013488767Nasarawa20082013329401Plateau2008201330235799999999999997Adamawa20082013107334Taraba20082013211234Abia2008201374400000000000006728Anambra20082013878846Ebonyi2008201340700000000000003596Enugu20082013536855Imo20082013943909Akawa Ibom20082013369432Bayelsa2008201318399999999999999284Cross River20082013385404Delta20082013572576Edo20082013762747Rivers2008201347949Ekiti20082013752863Lagos2008201376900000000000006772Ogun20082013638747Ondo20082013469562Osun20082013851891Oyo2008201367099999999999994747Niger20082013159253Bauchi200820131316899999999999999Borno2008201311817Gombe20082013172276Yobe200820136176Jigawa200820134567Kaduna2008201318399999999999999324Kano20082013111129Katsina20082013429Kebbi200820134885Sokoto200820134400000000000000447Zamfara20082013655
Percentage receiving no antenatal care
FCT - Abuja200820138959Benue20082013305396Kogi2008201314254Kwara2008201333949000000000000004Nasarawa20082013232305Plateau20082013157339Adamawa2008201337799999999999997134Taraba2008201346337299999999999997Abia200820138300000000000000747Anambra200820130843Ebonyi200820132010000000000000171Enugu2008201310832Imo200820132509Akawa Ibom20082013126225Bayelsa20082013355517Cross River20082013159138Delta200820131917899999999999999Edo2008201354144Rivers2008201326620Ekiti20082013322999999999999998Lagos200820131812Ogun200820135422999999999999998Ondo20082013147146Osun200820130615Oyo20082013105106Niger2008201339200000000000003282Bauchi2008201349133200000000000003Borno20082013648587Gombe20082013405225Yobe2008201362565599999999999994Jigawa20082013787472Kaduna2008201336200000000000003442Kano20082013487354Katsina20082013828658Kebbi20082013847712Sokoto20082013853797Zamfara2008201385573599999999999994
THE ROLE OF EDUCATION
Living in a state with customary and religious laws and laws that impede access to sexual and reproductive health services affect education opportunities for women ndash an example
Child marriage Customary law allows marriage of girls between 12 and
15 years the minimum age of marriage can be as low as nine Under Islamic law age of marriage is defined as ldquoage of pubertyrdquo
Among married girls aged 15 to 19 62 have already given birth
Almost 1 out of 4 gave birth before age 15 Only 2 of 15 to 19-year-old married girls are in school
compared to 69 of unmarried girls
Source ReutersA Akinleye
EDUCATION AS A MEDIATOR
1 Living in a state with living with customary and religious laws and laws that impede access to sexual and reproductive health services is a significant predictor or current contraception use amongst married women
(Pearson Correlation = -747) (Linear regression R2=56 F(1 35)=4423 plt00001 βSTATE=-2271 t=-665 plt00001)
2 Living in a state with living with customary and religious laws and laws that impede access to sexual and reproductive health services is a significant predictor of education level
(Pearson Correlation = 901) (Linear regression R2=81 F(1 35)=15083 plt00001 βEDUCATION=4624 t=1228 plt00001)
3 Living in a state with living with customary and religious laws and laws that impede access to sexual and reproductive health services is a significant predictor of education level
(Linear regression R2 = 72 F(2 34) = 4398 plt00001 βSTATE=274 t=43 p=067 βEDUCATION= -55 t=-445 plt00001)
Current contraception
use
Living in a state w
customary laws
Education Level (None)
a b
crsquo
TO CONCLUDE WHY IS THE LAW IMPORTANT
Nigerian states with customary and religious laws and laws that impede access to sexual and reproductive health services have seen fewer if any improvements in womenrsquos health outcomes across the years
Education mediates the relationship between current contraception use amongst married women and living in a state with customary and religious laws
Progress in achieving development goals have been slow and uneven and wide regional differences exist
Customary religious and traditional laws tend to have particular impacts on women and girls and must be addressed
Domestic legal frameworks are largely inadequate in addressing sexual and reproductive health due to loopholes
Social norms and practices are shifting but others continue as part of deep-rooted value systems that subordinate women and girls
Integrated approaches must be developed with the support and knowledge of women and girls and must involve traditional cultural and religious leaders as well as men and boys
- Association between Plural Legal Systems and Sexual and Reproductive Health Outcomes for Women and Girls in Northern Nigeria
- Overview
- Convention on the Elimination of all Forms of Discrimination Against Women (CEDAW) impact on Sexual amp reproductive health
- Plural Legal Systems
- Customary Religious and Traditional LawLegal pluralism permits religious traditional and customary law or practice to trump national legislation through two primary avenues
- Nigeria Legal System
- Nigeria Legal framework
- NIGeRia Laws and policies
- Legal systems amp geography
- Data Sources
- Regional Time trends (1990-2013)
- Fertility
- Family Planning
- Maternal Health
- State-level Time trends (2008-2013)
- State-level Time trends (2008-2013)
- Slide Number 17
- Slide Number 18
- The role of education
- Education as a mediator
- To Conclude Why is the law important
-
| Current use of any contraception method (married women) | Health facility delivery | rate change contra | rate change facility | No Antenatal Care provider | |||||||||||||||||||||||
| State | 2008 | 2013 | 2008 | 2013 | 2008 | 2013 | rate of change | ||||||||||||||||||||
| North Central | FCT - Abuja | 28 | 252 | 542 | 691 | -28 | 149 | 89 | 59 | -3 | |||||||||||||||||
| North Central | Benue | 142 | 165 | 509 | 509 | 23 | 0 | 305 | 396 | 91 | |||||||||||||||||
| North Central | Kogi | 97 | 105 | 773 | 789 | 08 | 16 | 142 | 54 | -88 | |||||||||||||||||
| North Central | Kwara | 246 | 402 | 488 | 767 | 156 | 279 | 339 | 49 | -29 | |||||||||||||||||
| North Central | Nasarawa | 12 | 181 | 329 | 401 | 61 | 72 | 232 | 305 | 73 | |||||||||||||||||
| North Central | Plateau | 111 | 152 | 302 | 358 | 41 | 56 | 157 | 339 | 182 | |||||||||||||||||
| North East | Adamawa | 28 | 44 | 107 | 334 | 16 | 227 | 378 | 134 | -244 | |||||||||||||||||
| North East | Taraba | 5 | 8 | 211 | 234 | 3 | 23 | 463 | 373 | -9 | |||||||||||||||||
| South East | Abia | 239 | 334 | 744 | 728 | 95 | -16 | 83 | 47 | -36 | |||||||||||||||||
| South East | Anambra | 344 | 35 | 878 | 846 | 06 | -32 | 08 | 43 | 35 | |||||||||||||||||
| South East | Ebonyi | 61 | 157 | 407 | 596 | 96 | 189 | 201 | 71 | -13 | |||||||||||||||||
| South East | Enugu | 211 | 314 | 536 | 855 | 103 | 319 | 108 | 32 | -76 | |||||||||||||||||
| South East | Imo | 227 | 341 | 943 | 909 | 114 | -34 | 25 | 09 | -16 | |||||||||||||||||
| South South | Akawa Ibom | 327 | 255 | 369 | 432 | -72 | 63 | 126 | 225 | 99 | |||||||||||||||||
| South South | Bayelsa | 101 | 133 | 184 | 284 | 32 | 10 | 355 | 517 | 162 | |||||||||||||||||
| South South | Cross River | 203 | 24 | 385 | 404 | 37 | 19 | 159 | 138 | -21 | |||||||||||||||||
| South South | Delta | 266 | 287 | 572 | 576 | 21 | 04 | 19 | 179 | -11 | |||||||||||||||||
| South South | Edo | 316 | 303 | 762 | 747 | -13 | -15 | 54 | 144 | 9 | |||||||||||||||||
| South South | Rivers | 272 | 345 | 479 | 49 | 73 | 11 | 266 | 20 | -66 | |||||||||||||||||
| South West | Ekiti | 173 | 345 | 752 | 863 | 172 | 111 | 3 | 23 | -07 | |||||||||||||||||
| South West | Lagos | 496 | 483 | 769 | 772 | -13 | 03 | 18 | 12 | -06 | |||||||||||||||||
| South West | Ogun | 139 | 26 | 638 | 747 | 121 | 109 | 54 | 23 | -31 | |||||||||||||||||
| South West | Ondo | 212 | 311 | 469 | 562 | 99 | 93 | 147 | 146 | -01 | |||||||||||||||||
| South West | Osun | 38 | 383 | 851 | 891 | 03 | 4 | 06 | 15 | 09 | |||||||||||||||||
| South West | Oyo | 219 | 374 | 671 | 747 | 155 | 76 | 5344 | 7448 | average rate change states without | 105 | 106 | 01 | ||||||||||||||
| North Central | Niger | 46 | 66 | 159 | 253 | 2 | 94 | 392 | 282 | -11 | |||||||||||||||||
| North East | Bauchi | 27 | 22 | 13 | 169 | -05 | 39 | 491 | 332 | -159 | |||||||||||||||||
| North East | Borno | 65 | 18 | 118 | 17 | -47 | 52 | 648 | 587 | -61 | |||||||||||||||||
| North East | Gombe | 56 | 4 | 172 | 276 | -16 | 104 | 405 | 225 | -18 | |||||||||||||||||
| North East | Yobe | 19 | 11 | 61 | 76 | -08 | 15 | 625 | 656 | 31 | |||||||||||||||||
| North West | Jigawa | 02 | 09 | 45 | 67 | 07 | 22 | 787 | 472 | -315 | |||||||||||||||||
| North West | Kaduna | 96 | 202 | 184 | 324 | 106 | 14 | 362 | 442 | 8 | |||||||||||||||||
| North West | Kano | 23 | 06 | 111 | 129 | -17 | 18 | 487 | 354 | -133 | |||||||||||||||||
| North West | Katsina | 08 | 13 | 42 | 9 | 05 | 48 | 828 | 658 | -17 | |||||||||||||||||
| North West | Kebbi | 19 | 13 | 48 | 85 | -06 | 37 | 847 | 712 | -135 | |||||||||||||||||
| North West | Sokoto | 21 | 11 | 44 | 47 | -1 | 03 | 853 | 797 | -56 | |||||||||||||||||
| North West | Zamfara | 25 | 3 | 65 | 5 | 05 | -15 | 02833333333 | 46416666667 | average rate change states with | 855 | 736 | -119 | ||||||||||||||
| 00071049204 | 01702860614 | 00077553648 |
| 2008 | State | Education level female (none) | Education level female (primary) | TFR | Median age at first birth women aged 25-49 | of 15-19 yo who have begun childbearing | Heard of any method | Heard of modern method | Current use of any contraception method (married women) | Have NOT heard FP message on radio or TV | No Antenatal Care provider | Health facility delivery | No assistance during delivery | Knoweldge of AIDS (women) | who participate in their own health care decisions | men who agree that a husband is justified in hitting his wife | State wtraditional law | ||||||||||||||||||
| North Central | FCT - Abuja | 145 | 95 | 45 | 236 | 92 | 927 | 92 | 252 | 387 | 59 | 691 | 4 | 904 | 559 | 18 | 0 | ||||||||||||||||||
| North Central | Benue | 257 | 94 | 52 | 189 | 225 | 964 | 96 | 165 | 745 | 396 | 509 | 6 | 997 | 285 | 57 | 0 | ||||||||||||||||||
| North Central | Kogi | 257 | 118 | 42 | 21 | 178 | 775 | 77 | 105 | 606 | 54 | 789 | 04 | 88 | 617 | 187 | 0 | ||||||||||||||||||
| North Central | Kwara | 266 | 123 | 51 | 221 | 59 | 947 | 946 | 402 | 205 | 49 | 767 | 1 | 925 | 803 | 62 | 0 | ||||||||||||||||||
| North Central | Nasarawa | 413 | 94 | 54 | 206 | 154 | 844 | 836 | 181 | 79 | 305 | 401 | 129 | 825 | 507 | 454 | 0 | ||||||||||||||||||
| North Central | Plateau | 356 | 102 | 54 | 219 | 131 | 824 | 82 | 152 | 826 | 339 | 358 | 135 | 806 | 637 | 317 | 0 | ||||||||||||||||||
| North East | Adamawa | 355 | 87 | 58 | 191 | 287 | 837 | 837 | 44 | 663 | 134 | 334 | 67 | 897 | 349 | 28 | 0 | ||||||||||||||||||
| North East | Taraba | 432 | 96 | 6 | 189 | 264 | 869 | 867 | 8 | 909 | 373 | 234 | 91 | 956 | 568 | 226 | 0 | ||||||||||||||||||
| North Central | Niger | 616 | 6 | 61 | 198 | 273 | 555 | 546 | 66 | 844 | 282 | 253 | 58 | 64 | 187 | 196 | 1 | ||||||||||||||||||
| North East | bauchi | 623 | 73 | 81 | 177 | 481 | 668 | 666 | 22 | 768 | 332 | 169 | 212 | 872 | 29 | 416 | 1 | ||||||||||||||||||
| North East | Borno | 69 | 47 | 47 | 204 | 288 | 643 | 575 | 18 | 802 | 587 | 17 | 24 | 804 | 25 | 401 | 1 | ||||||||||||||||||
| North East | Gombe | 616 | 49 | 7 | 181 | 364 | 64 | 618 | 4 | 844 | 225 | 276 | 152 | 794 | 56 | 337 | 1 | ||||||||||||||||||
| North East | Yobe | 853 | 12 | 66 | 189 | 251 | 805 | 742 | 11 | 873 | 656 | 76 | 02 | 971 | 7 | 345 | 1 | ||||||||||||||||||
| North West | Jigawa | 713 | 64 | 76 | 177 | 517 | 751 | 709 | 09 | 859 | 472 | 67 | 231 | 935 | 133 | 202 | 1 | ||||||||||||||||||
| North West | Kaduna | 403 | 92 | 41 | 194 | 332 | 982 | 937 | 202 | 589 | 442 | 324 | 156 | 958 | 541 | 151 | 1 | ||||||||||||||||||
| North West | Kano | 542 | 83 | 68 | 182 | 232 | 82 | 798 | 06 | 627 | 354 | 129 | 39 | 997 | 14 | 11 | 1 | ||||||||||||||||||
| North West | Katsina | 677 | 73 | 74 | 173 | 533 | 898 | 89 | 13 | 626 | 658 | 9 | 25 | 997 | 337 | 288 | 1 | ||||||||||||||||||
| North West | Kebbi | 758 | 43 | 67 | 179 | 344 | 51 | 47 | 13 | 944 | 712 | 85 | 279 | 759 | 27 | 495 | 1 | ||||||||||||||||||
| North West | Sokoto | 785 | 31 | 7 | 174 | 36 | 753 | 749 | 11 | 971 | 797 | 47 | 01 | 991 | 09 | 332 | 1 | ||||||||||||||||||
| North West | Zamfara | 773 | 37 | 84 | 176 | 432 | 841 | 809 | 3 | 831 | 736 | 5 | 451 | 969 | 39 | 447 | 1 | ||||||||||||||||||
| 00000007362 | 00000392724 | 00028858881 | 00005053265 | 00001462922 | 00108017923 | 00039047205 | 00009920058 | 00341461283 | 00007434824 | 00000263782 | 00230582487 | 04294511369 | 00000429505 | 04012033851 | |||||||||||||||||||||
| South East | Abia | 172 | 138 | 42 | 66 | 954 | 945 | 334 | 522 | 47 | 728 | 03 | 986 | 593 | 354 | 0 | |||||||||||||||||||
| South East | Anambra | 101 | 122 | 42 | 248 | 27 | 971 | 966 | 35 | 716 | 43 | 846 | 0 | 996 | 759 | 211 | 0 | ||||||||||||||||||
| South East | Ebonyi | 278 | 128 | 53 | 214 | 96 | 891 | 888 | 157 | 488 | 71 | 596 | 5 | 983 | 421 | 227 | 0 | ||||||||||||||||||
| South East | Enugu | 231 | 145 | 48 | 229 | 94 | 994 | 992 | 314 | 581 | 32 | 855 | 05 | 995 | 637 | 265 | 0 | ||||||||||||||||||
| South East | Imo | 134 | 123 | 48 | 114 | 997 | 989 | 341 | 487 | 09 | 909 | 05 | 989 | 766 | 273 | 0 | |||||||||||||||||||
| South South | Akawa Ibom | 129 | 156 | 39 | 212 | 179 | 982 | 98 | 255 | 459 | 225 | 432 | 06 | 959 | 459 | 265 | 0 | ||||||||||||||||||
| South South | Bayelsa | 104 | 139 | 45 | 192 | 167 | 996 | 996 | 133 | 42 | 517 | 284 | 01 | 90 | 316 | 251 | 0 | ||||||||||||||||||
| South South | Cross River | 18 | 139 | 54 | 21 | 184 | 96 | 958 | 24 | 415 | 138 | 404 | 22 | 965 | 60 | 37 | 0 | ||||||||||||||||||
| South South | Delta | 143 | 138 | 41 | 22 | 83 | 948 | 944 | 287 | 673 | 179 | 576 | 54 | 924 | 711 | 281 | 0 | ||||||||||||||||||
| South South | Edo | 121 | 131 | 44 | 225 | 39 | 985 | 985 | 303 | 422 | 144 | 747 | 16 | 961 | 715 | 351 | 0 | ||||||||||||||||||
| South South | Rivers | 10 | 137 | 38 | 231 | 139 | 998 | 996 | 345 | 71 | 20 | 49 | 03 | 936 | 779 | 161 | 0 | ||||||||||||||||||
| South West | Ekiti | 152 | 115 | 43 | 228 | 53 | 989 | 989 | 345 | 26 | 23 | 863 | 05 | 994 | 72 | 34 | 0 | ||||||||||||||||||
| South West | Lagos | 9 | 107 | 41 | 245 | 48 | 999 | 999 | 483 | 253 | 12 | 772 | 08 | 981 | 788 | 149 | 0 | ||||||||||||||||||
| South West | Ogun | 241 | 212 | 54 | 216 | 10 | 991 | 991 | 26 | 354 | 23 | 747 | 02 | 971 | 79 | 234 | 0 | ||||||||||||||||||
| South West | Ondo | 141 | 131 | 52 | 219 | 135 | 928 | 913 | 311 | 454 | 146 | 562 | 33 | 881 | 641 | 218 | 0 | ||||||||||||||||||
| South West | Osun | 163 | 97 | 41 | 235 | 11 | 995 | 995 | 383 | 227 | 15 | 891 | 02 | 997 | 53 | 74 | 0 | ||||||||||||||||||
| South West | Oyo | 249 | 119 | 45 | 214 | 124 | 909 | 889 | 374 | 247 | 106 | 747 | 23 | 846 | 734 | 123 | 0 | ||||||||||||||||||
| States wo (n=8) | States w (n=12) | Sig (2-tailed) | |||||||||||||||||||||||||||||||||
| Determinants of Health | |||||||||||||||||||||||||||||||||||
| Median age at first birth women aged 25-49 | 208 | 184 | |||||||||||||||||||||||||||||||||
| Education level (none) | 310 | 671 | lt00001 | ||||||||||||||||||||||||||||||||
| who participate in their own health care decisions | 541 | 163 | lt00001 | ||||||||||||||||||||||||||||||||
| Fertility | |||||||||||||||||||||||||||||||||||
| Total Fertility Rate | 520 | 671 | 0003 | ||||||||||||||||||||||||||||||||
| of 15-19 yo who have begun childbearing | 1738 | 3673 | lt00001 | ||||||||||||||||||||||||||||||||
| Family PlanningSRH | |||||||||||||||||||||||||||||||||||
| Heard of any contraception method | 8734 | 7388 | 001 | ||||||||||||||||||||||||||||||||
| Current use of any contraception method (married women) | 1726 | 368 | 0001 | ||||||||||||||||||||||||||||||||
| Have NOT heard FP message on radio or TV | 6414 | 7982 | 003 | ||||||||||||||||||||||||||||||||
| Knoweldge of HIVAIDS | 8988 | 8906 | 043 | ||||||||||||||||||||||||||||||||
| Maternal Health | |||||||||||||||||||||||||||||||||||
| No Antenatal Care provider | 2136 | 5211 | lt00001 | ||||||||||||||||||||||||||||||||
| Health facility delivery | 5104 | 1447 | lt00001 | ||||||||||||||||||||||||||||||||
| No assistance during delivery | 670 | 1838 | 002 |
| 2008 | State | Education level female (none) | Education level female (primary) | TFR | of 15-19 yo who have begun childbearing | Heard of any method | Heard of modern method | Current use of any contraception method (married women) | Have NOT heard FP message on radio or TV | No Antenatal Care provider | Health facility delivery | No assistance during delivery | Knoweldge of AIDS (women) | who participate in their own health care decisions | men who agree that a husband is justified in hitting his wife | State wtraditional law | |||||||||||||||||
| North Central | FCT - Abuja | 145 | 95 | 45 | 92 | 927 | 92 | 252 | 387 | 59 | 691 | 4 | 904 | 559 | 18 | 0 | |||||||||||||||||
| North Central | Benue | 257 | 94 | 52 | 225 | 964 | 96 | 165 | 745 | 396 | 509 | 6 | 997 | 285 | 57 | 0 | |||||||||||||||||
| North Central | Kogi | 257 | 118 | 42 | 178 | 775 | 77 | 105 | 606 | 54 | 789 | 04 | 88 | 617 | 187 | 0 | |||||||||||||||||
| North Central | Kwara | 266 | 123 | 51 | 59 | 947 | 946 | 402 | 205 | 49 | 767 | 1 | 925 | 803 | 62 | 0 | |||||||||||||||||
| North Central | Nasarawa | 413 | 94 | 54 | 154 | 844 | 836 | 181 | 79 | 305 | 401 | 129 | 825 | 507 | 454 | 0 | |||||||||||||||||
| North Central | Plateau | 356 | 102 | 54 | 131 | 824 | 82 | 152 | 826 | 339 | 358 | 135 | 806 | 637 | 317 | 0 | |||||||||||||||||
| North East | Adamawa | 355 | 87 | 58 | 287 | 837 | 837 | 44 | 663 | 134 | 334 | 67 | 897 | 349 | 28 | 0 | |||||||||||||||||
| North East | Taraba | 432 | 96 | 6 | 264 | 869 | 867 | 8 | 909 | 373 | 234 | 91 | 956 | 568 | 226 | 0 | |||||||||||||||||
| South East | Abia | 172 | 138 | 42 | 66 | 954 | 945 | 334 | 522 | 47 | 728 | 03 | 986 | 593 | 354 | 0 | |||||||||||||||||
| South East | Anambra | 101 | 122 | 42 | 27 | 971 | 966 | 35 | 716 | 43 | 846 | 0 | 996 | 759 | 211 | 0 | |||||||||||||||||
| South East | Ebonyi | 278 | 128 | 53 | 96 | 891 | 888 | 157 | 488 | 71 | 596 | 5 | 983 | 421 | 227 | 0 | |||||||||||||||||
| South East | Enugu | 231 | 145 | 48 | 94 | 994 | 992 | 314 | 581 | 32 | 855 | 05 | 995 | 637 | 265 | 0 | |||||||||||||||||
| South East | Imo | 134 | 123 | 48 | 114 | 997 | 989 | 341 | 487 | 09 | 909 | 05 | 989 | 766 | 273 | 0 | |||||||||||||||||
| South South | Akawa Ibom | 129 | 156 | 39 | 179 | 982 | 98 | 255 | 459 | 225 | 432 | 06 | 959 | 459 | 265 | 0 | |||||||||||||||||
| South South | Bayelsa | 104 | 139 | 45 | 167 | 996 | 996 | 133 | 42 | 517 | 284 | 01 | 90 | 316 | 251 | 0 | |||||||||||||||||
| South South | Cross River | 18 | 139 | 54 | 184 | 96 | 958 | 24 | 415 | 138 | 404 | 22 | 965 | 60 | 37 | 0 | |||||||||||||||||
| South South | Delta | 143 | 138 | 41 | 83 | 948 | 944 | 287 | 673 | 179 | 576 | 54 | 924 | 711 | 281 | 0 | |||||||||||||||||
| South South | Edo | 121 | 131 | 44 | 39 | 985 | 985 | 303 | 422 | 144 | 747 | 16 | 961 | 715 | 351 | 0 | |||||||||||||||||
| South South | Rivers | 10 | 137 | 38 | 139 | 998 | 996 | 345 | 71 | 20 | 49 | 03 | 936 | 779 | 161 | 0 | |||||||||||||||||
| South West | Ekiti | 152 | 115 | 43 | 53 | 989 | 989 | 345 | 26 | 23 | 863 | 05 | 994 | 72 | 34 | 0 | |||||||||||||||||
| South West | Lagos | 9 | 107 | 41 | 48 | 999 | 999 | 483 | 253 | 12 | 772 | 08 | 981 | 788 | 149 | 0 | |||||||||||||||||
| South West | Ogun | 241 | 212 | 54 | 10 | 991 | 991 | 26 | 354 | 23 | 747 | 02 | 971 | 79 | 234 | 0 | |||||||||||||||||
| South West | Ondo | 141 | 131 | 52 | 135 | 928 | 913 | 311 | 454 | 146 | 562 | 33 | 881 | 641 | 218 | 0 | |||||||||||||||||
| South West | Osun | 163 | 97 | 41 | 11 | 995 | 995 | 383 | 227 | 15 | 891 | 02 | 997 | 53 | 74 | 0 | |||||||||||||||||
| South West | Oyo | 249 | 119 | 45 | 124 | 909 | 889 | 374 | 247 | 106 | 747 | 23 | 846 | 734 | 123 | 0 | |||||||||||||||||
| North Central | Niger | 616 | 6 | 61 | 273 | 555 | 546 | 66 | 844 | 282 | 253 | 58 | 64 | 187 | 196 | 1 | |||||||||||||||||
| North East | bauchi | 623 | 73 | 81 | 481 | 668 | 666 | 22 | 768 | 332 | 169 | 212 | 872 | 29 | 416 | 1 | |||||||||||||||||
| North East | Borno | 69 | 47 | 47 | 288 | 643 | 575 | 18 | 802 | 587 | 17 | 24 | 804 | 25 | 401 | 1 | |||||||||||||||||
| North East | Gombe | 616 | 49 | 7 | 364 | 64 | 618 | 4 | 844 | 225 | 276 | 152 | 794 | 56 | 337 | 1 | |||||||||||||||||
| North East | Yobe | 853 | 12 | 66 | 251 | 805 | 742 | 11 | 873 | 656 | 76 | 02 | 971 | 7 | 345 | 1 | |||||||||||||||||
| North West | Jigawa | 713 | 64 | 76 | 517 | 751 | 709 | 09 | 859 | 472 | 67 | 231 | 935 | 133 | 202 | 1 | |||||||||||||||||
| North West | Kaduna | 403 | 92 | 41 | 332 | 982 | 937 | 202 | 589 | 442 | 324 | 156 | 958 | 541 | 151 | 1 | |||||||||||||||||
| North West | Kano | 542 | 83 | 68 | 232 | 82 | 798 | 06 | 627 | 354 | 129 | 39 | 997 | 14 | 11 | 1 | |||||||||||||||||
| North West | Katsina | 677 | 73 | 74 | 533 | 898 | 89 | 13 | 626 | 658 | 9 | 25 | 997 | 337 | 288 | 1 | |||||||||||||||||
| North West | Kebbi | 758 | 43 | 67 | 344 | 51 | 47 | 13 | 944 | 712 | 85 | 279 | 759 | 27 | 495 | 1 | |||||||||||||||||
| North West | Sokoto | 785 | 31 | 7 | 36 | 753 | 749 | 11 | 971 | 797 | 47 | 01 | 991 | 09 | 332 | 1 | |||||||||||||||||
| North West | Zamfara | 773 | 37 | 84 | 432 | 841 | 809 | 3 | 831 | 736 | 5 | 451 | 969 | 39 | 447 | 1 | |||||||||||||||||
| 0 | 00000000031 | 00000001254 | 00000000003 | 00000003864 | 0000000045 | 00000000536 | 00000378873 | 00000000471 | 0000000004 | 0000011062 | 00509577936 | 00000000007 | 01036675858 | ||||||||||||||||||||
| 4744 | 12196 | 93896 | 93484 | 26384 | 51276 | 14556 | 62128 | 3096 | 93816 | 61136 | 24468 | ||||||||||||||||||||||
| 67083333333 | 36725 | 738833333333 | 709083333333 | 3675 | 798166666667 | 521083333333 | 144666666667 | 183833333333 | 890583333333 | 16275 | 30175 | ||||||||||||||||||||||
| States wo (n=25) | States w (n=12) | Sig (2-tailed) | |||||||||||||||||||||||||||||||
| Determinants of Health | |||||||||||||||||||||||||||||||||
| Median age at first birth women aged 25-49 | 217 | 184 | |||||||||||||||||||||||||||||||
| Education level (none) | 208 | 671 | lt00001 | ||||||||||||||||||||||||||||||
| who participate in their own health care decisions | 611 | 163 | lt00001 | ||||||||||||||||||||||||||||||
| Fertility | |||||||||||||||||||||||||||||||||
| Total Fertility Rate | 474 | 671 | lt00001 | ||||||||||||||||||||||||||||||
| of 15-19 yo who have begun childbearing | 122 | 367 | lt00001 | ||||||||||||||||||||||||||||||
| Family PlanningSRH | |||||||||||||||||||||||||||||||||
| Heard of any contraception method | 939 | 739 | lt00001 | ||||||||||||||||||||||||||||||
| Current use of any contraception method (married women) | 264 | 37 | lt00001 | ||||||||||||||||||||||||||||||
| Have NOT heard FP message on radio or TV | 513 | 798 | lt00001 | ||||||||||||||||||||||||||||||
| Knoweldge of HIVAIDS | 938 | 891 | 0102 | ||||||||||||||||||||||||||||||
| Maternal Health | |||||||||||||||||||||||||||||||||
| No Antenatal Care provider | 146 | 521 | lt00001 | ||||||||||||||||||||||||||||||
| Health facility delivery | 621 | 145 | lt00001 | ||||||||||||||||||||||||||||||
| No assistance during delivery | 31 | 184 | lt00001 |
| 2008 | State | Education level female (none) | Education level female (primary) | TFR | Median age at first birth women aged 25-49 | of 15-19 yo who have begun childbearing | Heard of any method | Heard of modern method | Current use of any contraception method (married women) | Have NOT heard FP message on radio or TV | Partner knows about contraception use | No Antenatal Care provider | Health facility delivery | No assistance during delivery | Knoweldge of AIDS (women) | who participate in their own health care decisions | men who agree that a husband is justified in hitting his wife | men agree that thre is no reason for wife to deny sex | men believe they have the right to use force to have sex with wife | State wtraditional law | |||||||||||||||||||||
| North Central | FCT - Abuja | 177 | 10 | 4 | 228 | 66 | 887 | 885 | 28 | 662 | 861 | 89 | 542 | 4 | 883 | 493 | 42 | 18 | 21 | 0 | |||||||||||||||||||||
| North Central | Benue | 343 | 123 | 59 | 187 | 227 | 918 | 913 | 142 | 787 | 899 | 305 | 509 | 22 | 978 | 521 | 48 | 17 | 45 | 0 | |||||||||||||||||||||
| North Central | Kogi | 296 | 134 | 42 | 204 | 152 | 813 | 79 | 97 | 682 | 764 | 142 | 773 | 55 | 882 | 767 | 186 | 146 | 38 | 0 | |||||||||||||||||||||
| North Central | Kwara | 443 | 88 | 45 | 202 | 295 | 616 | 576 | 246 | 76 | 855 | 339 | 488 | 269 | 581 | 355 | 92 | 103 | 12 | 0 | |||||||||||||||||||||
| North Central | Nasarawa | 304 | 94 | 47 | 20 | 197 | 475 | 469 | 12 | 804 | 752 | 232 | 329 | 89 | 718 | 68 | 712 | 05 | 198 | 0 | |||||||||||||||||||||
| North Central | Plateau | 307 | 158 | 53 | 203 | 148 | 71 | 708 | 111 | 861 | 697 | 157 | 302 | 41 | 818 | 62 | 365 | 05 | 64 | 0 | |||||||||||||||||||||
| North East | Adamawa | 498 | 75 | 68 | 192 | 243 | 611 | 602 | 28 | 724 | 571 | 378 | 107 | 183 | 857 | 428 | 464 | 07 | 117 | 0 | |||||||||||||||||||||
| North East | Taraba | 489 | 68 | 59 | 194 | 215 | 794 | 792 | 5 | 899 | 796 | 463 | 211 | 111 | 923 | 344 | 291 | 26 | 8 | 0 | |||||||||||||||||||||
| South East | Abia | 16 | 138 | 44 | 244 | 134 | 963 | 96 | 239 | 342 | 911 | 83 | 744 | 22 | 989 | 515 | 387 | 18 | 57 | 0 | |||||||||||||||||||||
| South East | Anambra | 135 | 128 | 5 | 244 | 62 | 892 | 865 | 344 | 447 | 934 | 08 | 878 | 0 | 995 | 61 | 125 | 11 | 28 | 0 | |||||||||||||||||||||
| South East | Ebonyi | 345 | 137 | 56 | 21 | 82 | 607 | 599 | 61 | 642 | 849 | 201 | 407 | 144 | 916 | 493 | 642 | 49 | 14 | 0 | |||||||||||||||||||||
| South East | Enugu | 308 | 148 | 44 | 23 | 58 | 797 | 788 | 211 | 497 | 806 | 108 | 536 | 12 | 937 | 582 | 692 | 37 | 74 | 0 | |||||||||||||||||||||
| South East | Imo | 156 | 139 | 48 | 243 | 79 | 929 | 923 | 227 | 262 | 935 | 25 | 943 | 05 | 99 | 661 | 296 | 47 | 14 | 0 | |||||||||||||||||||||
| South South | Akawa Ibom | 122 | 193 | 4 | 22 | 151 | 966 | 947 | 327 | 338 | 826 | 126 | 369 | 06 | 983 | 636 | 288 | 43 | 45 | 0 | |||||||||||||||||||||
| South South | Bayelsa | 178 | 127 | 58 | 191 | 211 | 89 | 884 | 101 | 492 | 809 | 355 | 184 | 0 | 904 | 509 | 252 | 26 | 43 | 0 | |||||||||||||||||||||
| South South | Cross River | 183 | 155 | 54 | 198 | 181 | 779 | 77 | 203 | 506 | 827 | 159 | 385 | 36 | 952 | 679 | 538 | 17 | 54 | 0 | |||||||||||||||||||||
| South South | Delta | 144 | 171 | 45 | 218 | 82 | 859 | 818 | 266 | 718 | 858 | 19 | 572 | 33 | 896 | 781 | 405 | 0 | 23 | 0 | |||||||||||||||||||||
| South South | Edo | 159 | 161 | 53 | 218 | 29 | 876 | 872 | 316 | 395 | 792 | 54 | 762 | 23 | 851 | 67 | 321 | 08 | 19 | 0 | |||||||||||||||||||||
| South South | Rivers | 14 | 128 | 43 | 217 | 99 | 972 | 959 | 272 | 446 | 885 | 266 | 479 | 57 | 921 | 532 | 259 | 64 | 23 | 0 | |||||||||||||||||||||
| South West | Ekiti | 187 | 114 | 5 | 227 | 79 | 949 | 949 | 173 | 384 | 819 | 3 | 752 | 34 | 957 | 762 | 158 | 42 | 14 | 0 | |||||||||||||||||||||
| South West | Lagos | 97 | 111 | 4 | 243 | 53 | 988 | 979 | 496 | 176 | 877 | 18 | 769 | 2 | 98 | 689 | 214 | 76 | 05 | 0 | |||||||||||||||||||||
| South West | Ogun | 318 | 179 | 54 | 218 | 12 | 886 | 884 | 139 | 29 | 919 | 54 | 638 | 04 | 852 | 657 | 30 | 27 | 18 | 0 | |||||||||||||||||||||
| South West | Ondo | 236 | 112 | 49 | 221 | 77 | 924 | 912 | 212 | 345 | 837 | 147 | 469 | 6 | 842 | 744 | 94 | 5 | 29 | 0 | |||||||||||||||||||||
| South West | Osun | 33 | 159 | 4 | 224 | 5 | 966 | 961 | 38 | 183 | 873 | 06 | 851 | 18 | 953 | 653 | 325 | 07 | 1 | 0 | |||||||||||||||||||||
| South West | Oyo | 224 | 146 | 5 | 216 | 197 | 937 | 933 | 219 | 338 | 857 | 105 | 671 | 62 | 933 | 677 | 31 | 38 | 1 | 0 | |||||||||||||||||||||
| North Central | Niger | 683 | 44 | 75 | 193 | 414 | 263 | 259 | 46 | 796 | -633 | 392 | 159 | 186 | 414 | 43 | 309 | 35 | 55 | 1 | |||||||||||||||||||||
| North East | bauchi | 722 | 66 | 81 | 175 | 51 | 70 | 672 | 27 | 811 | 758 | 491 | 13 | 343 | 891 | 165 | 32 | 18 | 178 | 1 | |||||||||||||||||||||
| North East | Borno | 798 | 46 | 71 | 179 | 48 | 547 | 54 | 65 | 864 | 837 | 648 | 118 | 8 | 838 | 273 | 623 | 83 | 348 | 1 | |||||||||||||||||||||
| North East | Gombe | 546 | 61 | 74 | 184 | 465 | 487 | 484 | 56 | 757 | 672 | 405 | 172 | 133 | 732 | 441 | 401 | 02 | 75 | 1 | |||||||||||||||||||||
| North East | Yobe | 77 | 36 | 75 | 177 | 417 | 312 | 285 | 19 | 821 | 699 | 625 | 61 | 173 | 521 | 57 | 546 | 11 | 507 | 1 | |||||||||||||||||||||
| North West | Jigawa | 76 | 73 | 71 | 186 | 45 | 431 | 423 | 02 | 819 | 50 | 787 | 45 | 294 | 968 | 137 | 143 | 104 | 33 | 1 | |||||||||||||||||||||
| North West | Kaduna | 419 | 92 | 63 | 19 | 316 | 839 | 829 | 96 | 747 | 634 | 362 | 184 | 64 | 97 | 481 | 151 | 67 | 33 | 1 | |||||||||||||||||||||
| North West | Kano | 595 | 104 | 81 | 179 | 422 | 47 | 466 | 23 | 617 | 68 | 487 | 111 | 579 | 942 | 62 | 57 | 13 | 27 | 1 | |||||||||||||||||||||
| North West | Katsina | 76 | 51 | 72 | 179 | 65 | 257 | 239 | 08 | 53 | 444 | 828 | 42 | 595 | 839 | 238 | 184 | 68 | 115 | 1 | |||||||||||||||||||||
| North West | Kebbi | 778 | 36 | 6 | 185 | 389 | 18 | 135 | 19 | 773 | 529 | 847 | 48 | 53 | 766 | 133 | 808 | 159 | 68 | 1 | |||||||||||||||||||||
| North West | Sokoto | 835 | 34 | 87 | 179 | 467 | 468 | 445 | 21 | 738 | 556 | 853 | 44 | 252 | 784 | 46 | 448 | 25 | 93 | 1 | |||||||||||||||||||||
| North West | Zamfara | 841 | 18 | 75 | 185 | 47 | 475 | 40 | 25 | 819 | 613 | 855 | 65 | 606 | 696 | 264 | 197 | 225 | 62 | 1 | |||||||||||||||||||||
| 0 | 00000000073 | 0 | 00000001142 | 0 | 00000000141 | 0000000012 | 00000029067 | 00004726093 | 00001914403 | 00000000001 | 00000000504 | 00000004739 | 00046873618 | 0000000001 | 03898156073 | 00307981969 | 00034416604 |
| Nigeria | |||
| Marriage amp Sexual Activity | |||
| Law criminalizing child marriage | |||
| Legal Age of Marriage | 9-18 Depends on state and religion | ||
| Age of capacity to consent to sex | Puberty-18 Depends on state and religion | ||
| Access to SRH services | |||
| Age of consent to aceess contraceptives | No information available | ||
| Is spousal consent required to access any SRH services | Not legally but many providers require it | ||
| Abortion legal | Illegal except to save womans life | ||
| Gender-based violence (GBV) | |||
| Is there a law on GBV | Yes Depends on state | ||
| Is marital rape criminalized | No | ||
| Legal Framework | |||
| Is there implementing legislation for international law | Yes | ||
| UN Conventions Ratified | CEDAWCEDAW Optional Protocol | ||
| CRCCRC Optional Protocols | |||
| Customary amp religious law | Yes |
| 1990 | 1999 | 2003 | 2008 | 2013 | ||||||||||||||||||||||||||||||||||||
| Demographics | ||||||||||||||||||||||||||||||||||||||||
| Taken from 1980 NDSS amp NFS census 1991 census 2006 | Population | 847 | 889 | 1404 | ||||||||||||||||||||||||||||||||||||
| Percet urban | 23 | 363 | ||||||||||||||||||||||||||||||||||||||
| Total fertility rate (per 1000) | 63 | 59 | 57 | |||||||||||||||||||||||||||||||||||||
| Infant Mortality Rate (per 1000) | 85 | 93 | 100 | |||||||||||||||||||||||||||||||||||||
| Life expectancy at birth | 48 | 532 | Any education | 1990 | 1999 | 2003 | 2008 | 2013 | ||||||||||||||||||||||||||||||||
| Education level of female hh (none) | Northeast | 82 | 64 | 68 | 655 | 611 | Northeast | 18 | 36 | 32 | 345 | 389 | ||||||||||||||||||||||||||||
| Northwest | 862 | 646 | 722 | 675 | 628 | Northwest | 138 | 354 | 278 | 325 | 372 | |||||||||||||||||||||||||||||
| Southeast | 431 | 188 | 178 | 208 | 187 | Southeast | 569 | 812 | 822 | 792 | 813 | |||||||||||||||||||||||||||||
| Southwest | 297 | 228 | 233 | 215 | 171 | Southwest | 703 | 772 | 767 | 785 | 829 | |||||||||||||||||||||||||||||
| Southsouth | 206 | 149 | 13 | Southsouth | 794 | 851 | 87 | |||||||||||||||||||||||||||||||||
| Northcentral | 41 | 409 | 393 | 38 | Northcentral | 59 | 591 | 607 | 62 | |||||||||||||||||||||||||||||||
| Education level of female hh (primary) | Northeast | 48 | 144 | 171 | 159 | 167 | ||||||||||||||||||||||||||||||||||
| Northwest | 66 | 115 | 136 | 131 | 158 | |||||||||||||||||||||||||||||||||||
| Southeast | 246 | 445 | 251 | 232 | 22 | |||||||||||||||||||||||||||||||||||
| Southwest | 275 | 366 | 199 | 192 | 195 | |||||||||||||||||||||||||||||||||||
| Southsouth | na | na | 275 | 22 | 224 | |||||||||||||||||||||||||||||||||||
| Northcentral | na | 315 | 272 | 238 | 233 | |||||||||||||||||||||||||||||||||||
| Female by age amp education (none) | 5-9 | 544 | 328 | 459 | 439 | 434 | ||||||||||||||||||||||||||||||||||
| 10-14 | 341 | 20 | 268 | 258 | 259 | |||||||||||||||||||||||||||||||||||
| 15-19 | 336 | 221 | 302 | 241 | 271 | |||||||||||||||||||||||||||||||||||
| 20-24 | 42 | 289 | 339 | 298 | 332 | |||||||||||||||||||||||||||||||||||
| 25-29 | 542 | 319 | 397 | 331 | 376 | |||||||||||||||||||||||||||||||||||
| 30-34 | 711 | 395 | 475 | 373 | 38 | |||||||||||||||||||||||||||||||||||
| 35-39 | 704 | 446 | 498 | 372 | 407 | |||||||||||||||||||||||||||||||||||
| 40-44 | 789 | 562 | 604 | 46 | 427 | |||||||||||||||||||||||||||||||||||
| 45-49 | 847 | 58 | 68 | 549 | 51 | |||||||||||||||||||||||||||||||||||
| 50-54 | 909 | 63 | 763 | 621 | 567 | |||||||||||||||||||||||||||||||||||
| 55-59 | 958 | 728 | 809 | 641 | 644 | |||||||||||||||||||||||||||||||||||
| 60-64 | 963 | 766 | 855 | 695 | 696 | |||||||||||||||||||||||||||||||||||
| 65+ | 952 | 836 | 887 | 779 | 782 | |||||||||||||||||||||||||||||||||||
| Female by Residence amp Education (none) | Urban | 363 | 254 | 319 | 22 | 215 | ||||||||||||||||||||||||||||||||||
| Rural | 652 | 433 | 534 | 489 | 535 | |||||||||||||||||||||||||||||||||||
| Fertility | ||||||||||||||||||||||||||||||||||||||||
| TRF | Northeast | 6532 | 679 | 7 | 72 | 63 | ||||||||||||||||||||||||||||||||||
| Northwest | 6645 | 645 | 67 | 73 | 67 | |||||||||||||||||||||||||||||||||||
| Southeast | 5573 | 464 | 41 | 48 | 47 | |||||||||||||||||||||||||||||||||||
| Southwest | 5461 | 45 | 41 | 45 | 46 | |||||||||||||||||||||||||||||||||||
| Southsouth | 46 | 47 | 43 | |||||||||||||||||||||||||||||||||||||
| Northcentral | 71 | 449 | 57 | 54 | 53 | |||||||||||||||||||||||||||||||||||
| TFR Urban | 503 | 45 | 49 | 47 | 47 | |||||||||||||||||||||||||||||||||||
| TFR Rural | 633 | 544 | 61 | 63 | 62 | |||||||||||||||||||||||||||||||||||
| Median age at first birth by region and age 25-49 | Northeast | 188 | 182 | 178 | 182 | 188 | ||||||||||||||||||||||||||||||||||
| Northwest | 195 | 186 | 178 | 183 | 179 | |||||||||||||||||||||||||||||||||||
| Southeast | 196 | 21 | 227 | 236 | 237 | |||||||||||||||||||||||||||||||||||
| Southwest | 205 | 211 | 221 | 227 | 227 | |||||||||||||||||||||||||||||||||||
| Southsouth | 198 | 214 | 218 | |||||||||||||||||||||||||||||||||||||
| Northcentral | 198 | 197 | 20 | 206 | ||||||||||||||||||||||||||||||||||||
| Ages 15-19 | started childbearing by 15 | 131 | 108 | 75 | 63 | 51 | ||||||||||||||||||||||||||||||||||
| started childbearing by 16 | 208 | 94 | 139 | 13 | 134 | |||||||||||||||||||||||||||||||||||
| started childbearing by 17 | 302 | 264 | 311 | 242 | 226 | |||||||||||||||||||||||||||||||||||
| started childbearing by 18 | 393 | 305 | 342 | 357 | 372 | |||||||||||||||||||||||||||||||||||
| started childbearing by 19 | 428 | 343 | 395 | 384 | 413 | |||||||||||||||||||||||||||||||||||
| started childbearing Northeast | 502 | 513 | 445 | 393 | 321 | |||||||||||||||||||||||||||||||||||
| started childbearing Northwest | 462 | 547 | 452 | 446 | 357 | |||||||||||||||||||||||||||||||||||
| started childbearing Southeast | 167 | 83 | 62 | 81 | 82 | |||||||||||||||||||||||||||||||||||
| started childbearing Southwest | 108 | 79 | 47 | 88 | 82 | |||||||||||||||||||||||||||||||||||
| started childbearing Southsouth | na | na | 143 | 119 | 123 | |||||||||||||||||||||||||||||||||||
| started childbearing Northcentral | na | 176 | 164 | 222 | 188 | |||||||||||||||||||||||||||||||||||
| Fertility Regulation | ||||||||||||||||||||||||||||||||||||||||
| Know modern method | Northeast | 219 | 346 | 608 | 572 | 701 | ||||||||||||||||||||||||||||||||||
| Northwest | 277 | 391 | 718 | 431 | 784 | |||||||||||||||||||||||||||||||||||
| Southeast | 539 | 79 | 845 | 843 | 954 | |||||||||||||||||||||||||||||||||||
| Southwest | 714 | 837 | 965 | 944 | 957 | |||||||||||||||||||||||||||||||||||
| Southsouth | na | na | 933 | 882 | 975 | |||||||||||||||||||||||||||||||||||
| Northcentral | na | 677 | 759 | 632 | 78 | |||||||||||||||||||||||||||||||||||
| Know any method | Northeast | 24 | 354 | 635 | 586 | 732 | ||||||||||||||||||||||||||||||||||
| Northwest | 303 | 422 | 751 | 451 | 811 | |||||||||||||||||||||||||||||||||||
| Southeast | 566 | 816 | 871 | 855 | 959 | |||||||||||||||||||||||||||||||||||
| Southwest | 736 | 872 | 97 | 95 | 964 | |||||||||||||||||||||||||||||||||||
| Southsouth | 942 | 899 | 977 | |||||||||||||||||||||||||||||||||||||
| Northcentral | 70 | 774 | 643 | 786 | ||||||||||||||||||||||||||||||||||||
| Current use of any contraception method (married women) | Northeast | 2 | 31 | 42 | 4 | 32 | ||||||||||||||||||||||||||||||||||
| Northwest | 12 | 32 | 49 | 28 | 43 | |||||||||||||||||||||||||||||||||||
| Southeast | 88 | 235 | 225 | 234 | 293 | |||||||||||||||||||||||||||||||||||
| Southwest | 15 | 262 | 327 | 317 | 38 | |||||||||||||||||||||||||||||||||||
| Southsouth | 254 | 262 | 281 | |||||||||||||||||||||||||||||||||||||
| Northcentral | 178 | 133 | 13 | 156 | ||||||||||||||||||||||||||||||||||||
| Have NOT heard FP message on radio or TV | Northeast | 847 | 863 | 766 | 814 | 807 | ||||||||||||||||||||||||||||||||||
| Northwest | 801 | 744 | 604 | 693 | 734 | |||||||||||||||||||||||||||||||||||
| Southeast | 795 | 612 | 414 | 422 | 565 | |||||||||||||||||||||||||||||||||||
| Southwest | 545 | 38 | 301 | 257 | 289 | |||||||||||||||||||||||||||||||||||
| Southsouth | na | na | 447 | 486 | 552 | |||||||||||||||||||||||||||||||||||
| Northcentral | na | 66 | 697 | 776 | 69 | |||||||||||||||||||||||||||||||||||
| Both partners approve FP | Northeast | 39 | 157 | 18 | ||||||||||||||||||||||||||||||||||||
| Northwest | 345 | 173 | 174 | |||||||||||||||||||||||||||||||||||||
| Southeast | 438 | 43 | 507 | |||||||||||||||||||||||||||||||||||||
| Southwest | 496 | 516 | 606 | |||||||||||||||||||||||||||||||||||||
| Southsouth | na | na | 474 | |||||||||||||||||||||||||||||||||||||
| Northcentral | na | 45 | 406 | |||||||||||||||||||||||||||||||||||||
| Husban disapproves FP | Northeast | 109 | 52 | 114 | ||||||||||||||||||||||||||||||||||||
| Northwest | 62 | 26 | 75 | |||||||||||||||||||||||||||||||||||||
| Southeast | 124 | 97 | 91 | |||||||||||||||||||||||||||||||||||||
| Southwest | 175 | 74 | 115 | |||||||||||||||||||||||||||||||||||||
| Southsouth | na | na | 178 | |||||||||||||||||||||||||||||||||||||
| Northcentral | na | 69 | 11 | |||||||||||||||||||||||||||||||||||||
| Proximate determinants of fertility | ||||||||||||||||||||||||||||||||||||||||
| Married by age | 15-19 | 34 | 244 | 309 | 278 | 282 | ||||||||||||||||||||||||||||||||||
| 20-24 | 708 | 576 | 592 | 571 | 613 | |||||||||||||||||||||||||||||||||||
| 25-29 | 815 | 78 | 803 | 788 | 798 | |||||||||||||||||||||||||||||||||||
| 30-34 | 849 | 847 | 867 | 885 | 866 | |||||||||||||||||||||||||||||||||||
| 35-39 | 837 | 849 | 913 | 904 | 894 | |||||||||||||||||||||||||||||||||||
| 40-44 | 777 | 827 | 876 | 885 | 878 | |||||||||||||||||||||||||||||||||||
| 45-49 | 787 | 756 | 847 | 856 | 839 | |||||||||||||||||||||||||||||||||||
| Never married by age | 15-19 | 614 | 725 | 667 | 706 | 704 | ||||||||||||||||||||||||||||||||||
| 20-24 | 217 | 365 | 361 | 384 | 331 | |||||||||||||||||||||||||||||||||||
| 25-29 | 79 | 13 | 122 | 162 | 141 | |||||||||||||||||||||||||||||||||||
| 30-34 | 09 | 51 | 51 | 58 | 67 | |||||||||||||||||||||||||||||||||||
| 35-39 | 12 | 19 | 17 | 26 | 27 | |||||||||||||||||||||||||||||||||||
| 40-44 | 03 | 13 | 07 | 14 | 15 | |||||||||||||||||||||||||||||||||||
| 45-49 | 01 | 11 | 09 | 08 | 07 | |||||||||||||||||||||||||||||||||||
| Median age at first marraige by region and age less than 50 of women in this group had births so could not calculate | 20-49 Northeast | 152 | 151 | 153 | 156 | 164 | ||||||||||||||||||||||||||||||||||
| 20-49 Northwest | 154 | 147 | 148 | 153 | 154 | |||||||||||||||||||||||||||||||||||
| 20-49 Southeast | 185 | |||||||||||||||||||||||||||||||||||||||
| 20-49 Southwest | ||||||||||||||||||||||||||||||||||||||||
| 20-49 Southsouth | na | na | ||||||||||||||||||||||||||||||||||||||
| 20-49 Northcentral | na | 182 | 182 | 187 | 191 | |||||||||||||||||||||||||||||||||||
| Northeast | 152 | 15 | 15 | 156 | 163 | |||||||||||||||||||||||||||||||||||
| Northwest | 154 | 146 | 146 | 152 | 153 | |||||||||||||||||||||||||||||||||||
| Southeast | 183 | 202 | 218 | 228 | 227 | |||||||||||||||||||||||||||||||||||
| Southwest | 197 | 202 | 213 | 219 | 218 | |||||||||||||||||||||||||||||||||||
| Southsouth | 192 | 209 | 215 | |||||||||||||||||||||||||||||||||||||
| Northcentral | 179 | 177 | 183 | 189 | ||||||||||||||||||||||||||||||||||||
| Fertility Preferences married women | ||||||||||||||||||||||||||||||||||||||||
| Total unmet need for family planning by age | 15-19 | 16 | 148 | 146 | 19 | 131 | ||||||||||||||||||||||||||||||||||
| 20-24 | 146 | 227 | 164 | 214 | 166 | |||||||||||||||||||||||||||||||||||
| 25-29 | 161 | 17 | 171 | 204 | 168 | |||||||||||||||||||||||||||||||||||
| 30-34 | 181 | 179 | 191 | 201 | 171 | |||||||||||||||||||||||||||||||||||
| 35-39 | 239 | 181 | 181 | 213 | 176 | |||||||||||||||||||||||||||||||||||
| 40-44 | 297 | 154 | 193 | 214 | 168 | |||||||||||||||||||||||||||||||||||
| 45-49 | 434 | 119 | 114 | 162 | 115 | |||||||||||||||||||||||||||||||||||
| Total unmet need for FP by region | Northeast | 209 | 122 | 181 | 176 | 175 | ||||||||||||||||||||||||||||||||||
| Northwest | 142 | 244 | 111 | 208 | 12 | |||||||||||||||||||||||||||||||||||
| Southeast | 263 | 209 | 189 | 181 | 125 | |||||||||||||||||||||||||||||||||||
| Southwest | 23 | 157 | 172 | 197 | 154 | |||||||||||||||||||||||||||||||||||
| Southsouth | 245 | 259 | 222 | |||||||||||||||||||||||||||||||||||||
| Northcentral | 163 | 218 | 187 | 235 | ||||||||||||||||||||||||||||||||||||
| Total demand for FP | Northeast | 229 | 153 | 223 | 216 | 207 | ||||||||||||||||||||||||||||||||||
| Northwest | 154 | 276 | 161 | 235 | 163 | |||||||||||||||||||||||||||||||||||
| Southeast | 353 | 444 | 414 | 415 | 418 | |||||||||||||||||||||||||||||||||||
| Southwest | 38 | 419 | 499 | 513 | 535 | |||||||||||||||||||||||||||||||||||
| Southsouth | 499 | 522 | 502 | |||||||||||||||||||||||||||||||||||||
| Northcentral | 341 | 351 | 317 | 391 | ||||||||||||||||||||||||||||||||||||
| Percentage of demand staisfied | Northeast | 88 | 20 | 19 | 187 | 152 | ||||||||||||||||||||||||||||||||||
| Northwest | 79 | 117 | 308 | 117 | 262 | |||||||||||||||||||||||||||||||||||
| Southeast | 254 | 53 | 543 | 563 | 70 | |||||||||||||||||||||||||||||||||||
| Southwest | 395 | 625 | 656 | 617 | 711 | |||||||||||||||||||||||||||||||||||
| Southsouth | 509 | 503 | 559 | |||||||||||||||||||||||||||||||||||||
| Northcentral | 522 | 379 | 41 | 399 | ||||||||||||||||||||||||||||||||||||
| Infant amp Child Mortality | ||||||||||||||||||||||||||||||||||||||||
| Northeast | Neonatal mortality | 392 | 445 | 61 | 53 | 42 | ||||||||||||||||||||||||||||||||||
| Postneonatal mortality | 485 | 349 | 65 | 56 | 33 | |||||||||||||||||||||||||||||||||||
| Infant mortality | 877 | 794 | 125 | 109 | 77 | |||||||||||||||||||||||||||||||||||
| Child mortality | 1392 | 1041 | 154 | 126 | 90 | |||||||||||||||||||||||||||||||||||
| Under-five mortality | 2146 | 1752 | 260 | 222 | 160 | |||||||||||||||||||||||||||||||||||
| Northwest | Neonatal mortality | 578 | 251 | 55 | 47 | 44 | ||||||||||||||||||||||||||||||||||
| Postneonatal mortality | 52 | 575 | 59 | 44 | 46 | |||||||||||||||||||||||||||||||||||
| Infant mortality | 1098 | 826 | 114 | 91 | 89 | |||||||||||||||||||||||||||||||||||
| Child mortality | 1512 | 1151 | 176 | 139 | 105 | |||||||||||||||||||||||||||||||||||
| Under-five mortality | 2444 | 1882 | 269 | 217 | 185 | |||||||||||||||||||||||||||||||||||
| Southeast | Neonatal mortality | 386 | 373 | 34 | 51 | 37 | ||||||||||||||||||||||||||||||||||
| Postneonatal mortality | 441 | 371 | 32 | 44 | 45 | |||||||||||||||||||||||||||||||||||
| Infant mortality | 827 | 743 | 66 | 95 | 82 | |||||||||||||||||||||||||||||||||||
| Child mortality | 665 | 656 | 40 | 64 | 54 | |||||||||||||||||||||||||||||||||||
| Under-five mortality | 1437 | 135 | 103 | 153 | 131 | |||||||||||||||||||||||||||||||||||
| Southwest | Neonatal mortality | 463 | 426 | 39 | 37 | 39 | ||||||||||||||||||||||||||||||||||
| Postneonatal mortality | 383 | 273 | 30 | 22 | 21 | |||||||||||||||||||||||||||||||||||
| Infant mortality | 846 | 699 | 69 | 59 | 61 | |||||||||||||||||||||||||||||||||||
| Child mortality | 903 | 339 | 47 | 32 | 31 | |||||||||||||||||||||||||||||||||||
| Under-five mortality | 1672 | 1015 | 113 | 89 | 90 | |||||||||||||||||||||||||||||||||||
| Southsouth | Neonatal mortality | 53 | 48 | 32 | ||||||||||||||||||||||||||||||||||||
| Postneonatal mortality | 68 | 37 | 26 | Northeast | Neonatal mortality | 392 | 445 | 61 | 53 | 42 | ||||||||||||||||||||||||||||||
| Infant mortality | 120 | 84 | 58 | Northwest | Neonatal mortality | 578 | 251 | 55 | 47 | 44 | ||||||||||||||||||||||||||||||
| Child mortality | 63 | 58 | 35 | Southeast | Neonatal mortality | 386 | 373 | 34 | 51 | 37 | ||||||||||||||||||||||||||||||
| Under-five mortality | 176 | 138 | 91 | Southwest | Neonatal mortality | 463 | 426 | 39 | 37 | 39 | ||||||||||||||||||||||||||||||
| Northcentral | Neonatal mortality | 238 | 53 | 41 | 35 | Southsouth | Neonatal mortality | 53 | 48 | 32 | ||||||||||||||||||||||||||||||
| Postneonatal mortality | 269 | 49 | 37 | 31 | Northeast | Postneonatal mortality | 485 | 349 | 65 | 56 | 33 | |||||||||||||||||||||||||||||
| Infant mortality | 507 | 103 | 77 | 66 | Northwest | Postneonatal mortality | 52 | 575 | 59 | 44 | 46 | |||||||||||||||||||||||||||||
| Child mortality | 355 | 70 | 62 | 36 | Southwest | Postneonatal mortality | 383 | 273 | 30 | 22 | 21 | |||||||||||||||||||||||||||||
| Under-five mortality | 844 | 165 | 135 | 100 | Southeast | Postneonatal mortality | 441 | 371 | 32 | 44 | 45 | |||||||||||||||||||||||||||||
| Maternal amp Child Health | Southsouth | Postneonatal mortality | 68 | 37 | 26 | |||||||||||||||||||||||||||||||||||
| No antenatal care provider | Northeast | 547 | 541 | 471 | 512 | 408 | Northeast | Infant mortality | 877 | 794 | 125 | 109 | 77 | |||||||||||||||||||||||||||
| Northwest | 524 | 651 | 59 | 671 | 554 | Northwest | Infant mortality | 1098 | 826 | 114 | 91 | 89 | ||||||||||||||||||||||||||||
| Southeast | 196 | 77 | 08 | 74 | 42 | Southeast | Infant mortality | 827 | 743 | 66 | 95 | 82 | ||||||||||||||||||||||||||||
| Southwest | 77 | 35 | 23 | 57 | 57 | Southwest | Infant mortality | 846 | 699 | 69 | 59 | 61 | ||||||||||||||||||||||||||||
| Southsouth | 168 | 188 | 206 | Southsouth | Infant mortality | 120 | 84 | 58 | ||||||||||||||||||||||||||||||||
| Northcentral | 202 | 253 | 262 | 26 | Northeast | Under-five mortality | 2146 | 1752 | 260 | 222 | 160 | |||||||||||||||||||||||||||||
| Health facility delivery | Northeast | 104 | 117 | 171 | 128 | 195 | Northwest | Under-five mortality | 2444 | 1882 | 269 | 217 | 185 | |||||||||||||||||||||||||||
| Northwest | 97 | 64 | 104 | 84 | 115 | Southeast | Under-five mortality | 1437 | 135 | 103 | 153 | 131 | ||||||||||||||||||||||||||||
| Southeast | 463 | 549 | 841 | 739 | 781 | Southwest | Under-five mortality | 1672 | 1015 | 113 | 89 | 90 | ||||||||||||||||||||||||||||
| Southwest | 636 | 672 | 776 | 70 | 75 | Southsouth | Under-five mortality | 176 | 138 | 91 | ||||||||||||||||||||||||||||||
| Southsouth | 532 | 481 | 501 | Northeast | Child mortality | 1392 | 1041 | 154 | 126 | 90 | ||||||||||||||||||||||||||||||
| Northcentral | 443 | 454 | 41 | 457 | Northwest | Child mortality | 1512 | 1151 | 176 | 139 | 105 | |||||||||||||||||||||||||||||
| No assistance during delivery | Northeast | 561 | 232 | 198 | 186 | 97 | Southeast | Child mortality | 665 | 656 | 40 | 64 | 54 | |||||||||||||||||||||||||||
| Northwest | 635 | 255 | 305 | 438 | 278 | Southwest | Child mortality | 903 | 339 | 47 | 32 | 31 | ||||||||||||||||||||||||||||
| Southeast | 159 | 23 | 04 | 3 | 15 | Southsouth | Child mortality | 63 | 58 | 35 | ||||||||||||||||||||||||||||||
| Southwest | 157 | 24 | 09 | 32 | 13 | |||||||||||||||||||||||||||||||||||
| Southsouth | 18 | 31 | 18 | |||||||||||||||||||||||||||||||||||||
| Northcentral | 41 | 9 | 102 | 65 | ||||||||||||||||||||||||||||||||||||
| STDs FGM others | na | yes | yes | yes | yes |
| Current use of any contraception method (married women) | Health facility delivery | rate change contra | rate change facility | No Antenatal Care provider | |||||||||||||||||||||||
| State | 2008 | 2013 | 2008 | 2013 | 2008 | 2013 | rate of change | ||||||||||||||||||||
| North Central | FCT - Abuja | 28 | 252 | 542 | 691 | -28 | 149 | 89 | 59 | -3 | |||||||||||||||||
| North Central | Benue | 142 | 165 | 509 | 509 | 23 | 0 | 305 | 396 | 91 | |||||||||||||||||
| North Central | Kogi | 97 | 105 | 773 | 789 | 08 | 16 | 142 | 54 | -88 | |||||||||||||||||
| North Central | Kwara | 246 | 402 | 488 | 767 | 156 | 279 | 339 | 49 | -29 | |||||||||||||||||
| North Central | Nasarawa | 12 | 181 | 329 | 401 | 61 | 72 | 232 | 305 | 73 | |||||||||||||||||
| North Central | Plateau | 111 | 152 | 302 | 358 | 41 | 56 | 157 | 339 | 182 | |||||||||||||||||
| North East | Adamawa | 28 | 44 | 107 | 334 | 16 | 227 | 378 | 134 | -244 | |||||||||||||||||
| North East | Taraba | 5 | 8 | 211 | 234 | 3 | 23 | 463 | 373 | -9 | |||||||||||||||||
| South East | Abia | 239 | 334 | 744 | 728 | 95 | -16 | 83 | 47 | -36 | |||||||||||||||||
| South East | Anambra | 344 | 35 | 878 | 846 | 06 | -32 | 08 | 43 | 35 | |||||||||||||||||
| South East | Ebonyi | 61 | 157 | 407 | 596 | 96 | 189 | 201 | 71 | -13 | |||||||||||||||||
| South East | Enugu | 211 | 314 | 536 | 855 | 103 | 319 | 108 | 32 | -76 | |||||||||||||||||
| South East | Imo | 227 | 341 | 943 | 909 | 114 | -34 | 25 | 09 | -16 | |||||||||||||||||
| South South | Akawa Ibom | 327 | 255 | 369 | 432 | -72 | 63 | 126 | 225 | 99 | |||||||||||||||||
| South South | Bayelsa | 101 | 133 | 184 | 284 | 32 | 10 | 355 | 517 | 162 | |||||||||||||||||
| South South | Cross River | 203 | 24 | 385 | 404 | 37 | 19 | 159 | 138 | -21 | |||||||||||||||||
| South South | Delta | 266 | 287 | 572 | 576 | 21 | 04 | 19 | 179 | -11 | |||||||||||||||||
| South South | Edo | 316 | 303 | 762 | 747 | -13 | -15 | 54 | 144 | 9 | |||||||||||||||||
| South South | Rivers | 272 | 345 | 479 | 49 | 73 | 11 | 266 | 20 | -66 | |||||||||||||||||
| South West | Ekiti | 173 | 345 | 752 | 863 | 172 | 111 | 3 | 23 | -07 | |||||||||||||||||
| South West | Lagos | 496 | 483 | 769 | 772 | -13 | 03 | 18 | 12 | -06 | |||||||||||||||||
| South West | Ogun | 139 | 26 | 638 | 747 | 121 | 109 | 54 | 23 | -31 | |||||||||||||||||
| South West | Ondo | 212 | 311 | 469 | 562 | 99 | 93 | 147 | 146 | -01 | |||||||||||||||||
| South West | Osun | 38 | 383 | 851 | 891 | 03 | 4 | 06 | 15 | 09 | |||||||||||||||||
| South West | Oyo | 219 | 374 | 671 | 747 | 155 | 76 | 5344 | 7448 | average rate change states without | 105 | 106 | 01 | ||||||||||||||
| North Central | Niger | 46 | 66 | 159 | 253 | 2 | 94 | 392 | 282 | -11 | |||||||||||||||||
| North East | Bauchi | 27 | 22 | 13 | 169 | -05 | 39 | 491 | 332 | -159 | |||||||||||||||||
| North East | Borno | 65 | 18 | 118 | 17 | -47 | 52 | 648 | 587 | -61 | |||||||||||||||||
| North East | Gombe | 56 | 4 | 172 | 276 | -16 | 104 | 405 | 225 | -18 | |||||||||||||||||
| North East | Yobe | 19 | 11 | 61 | 76 | -08 | 15 | 625 | 656 | 31 | |||||||||||||||||
| North West | Jigawa | 02 | 09 | 45 | 67 | 07 | 22 | 787 | 472 | -315 | |||||||||||||||||
| North West | Kaduna | 96 | 202 | 184 | 324 | 106 | 14 | 362 | 442 | 8 | |||||||||||||||||
| North West | Kano | 23 | 06 | 111 | 129 | -17 | 18 | 487 | 354 | -133 | |||||||||||||||||
| North West | Katsina | 08 | 13 | 42 | 9 | 05 | 48 | 828 | 658 | -17 | |||||||||||||||||
| North West | Kebbi | 19 | 13 | 48 | 85 | -06 | 37 | 847 | 712 | -135 | |||||||||||||||||
| North West | Sokoto | 21 | 11 | 44 | 47 | -1 | 03 | 853 | 797 | -56 | |||||||||||||||||
| North West | Zamfara | 25 | 3 | 65 | 5 | 05 | -15 | 02833333333 | 46416666667 | average rate change states with | 855 | 736 | -119 | ||||||||||||||
| 00071049204 | 01702860614 | 00077553648 |
| 2008 | State | Education level female (none) | Education level female (primary) | TFR | Median age at first birth women aged 25-49 | of 15-19 yo who have begun childbearing | Heard of any method | Heard of modern method | Current use of any contraception method (married women) | Have NOT heard FP message on radio or TV | No Antenatal Care provider | Health facility delivery | No assistance during delivery | Knoweldge of AIDS (women) | who participate in their own health care decisions | men who agree that a husband is justified in hitting his wife | State wtraditional law | ||||||||||||||||||
| North Central | FCT - Abuja | 145 | 95 | 45 | 236 | 92 | 927 | 92 | 252 | 387 | 59 | 691 | 4 | 904 | 559 | 18 | 0 | ||||||||||||||||||
| North Central | Benue | 257 | 94 | 52 | 189 | 225 | 964 | 96 | 165 | 745 | 396 | 509 | 6 | 997 | 285 | 57 | 0 | ||||||||||||||||||
| North Central | Kogi | 257 | 118 | 42 | 21 | 178 | 775 | 77 | 105 | 606 | 54 | 789 | 04 | 88 | 617 | 187 | 0 | ||||||||||||||||||
| North Central | Kwara | 266 | 123 | 51 | 221 | 59 | 947 | 946 | 402 | 205 | 49 | 767 | 1 | 925 | 803 | 62 | 0 | ||||||||||||||||||
| North Central | Nasarawa | 413 | 94 | 54 | 206 | 154 | 844 | 836 | 181 | 79 | 305 | 401 | 129 | 825 | 507 | 454 | 0 | ||||||||||||||||||
| North Central | Plateau | 356 | 102 | 54 | 219 | 131 | 824 | 82 | 152 | 826 | 339 | 358 | 135 | 806 | 637 | 317 | 0 | ||||||||||||||||||
| North East | Adamawa | 355 | 87 | 58 | 191 | 287 | 837 | 837 | 44 | 663 | 134 | 334 | 67 | 897 | 349 | 28 | 0 | ||||||||||||||||||
| North East | Taraba | 432 | 96 | 6 | 189 | 264 | 869 | 867 | 8 | 909 | 373 | 234 | 91 | 956 | 568 | 226 | 0 | ||||||||||||||||||
| North Central | Niger | 616 | 6 | 61 | 198 | 273 | 555 | 546 | 66 | 844 | 282 | 253 | 58 | 64 | 187 | 196 | 1 | ||||||||||||||||||
| North East | bauchi | 623 | 73 | 81 | 177 | 481 | 668 | 666 | 22 | 768 | 332 | 169 | 212 | 872 | 29 | 416 | 1 | ||||||||||||||||||
| North East | Borno | 69 | 47 | 47 | 204 | 288 | 643 | 575 | 18 | 802 | 587 | 17 | 24 | 804 | 25 | 401 | 1 | ||||||||||||||||||
| North East | Gombe | 616 | 49 | 7 | 181 | 364 | 64 | 618 | 4 | 844 | 225 | 276 | 152 | 794 | 56 | 337 | 1 | ||||||||||||||||||
| North East | Yobe | 853 | 12 | 66 | 189 | 251 | 805 | 742 | 11 | 873 | 656 | 76 | 02 | 971 | 7 | 345 | 1 | ||||||||||||||||||
| North West | Jigawa | 713 | 64 | 76 | 177 | 517 | 751 | 709 | 09 | 859 | 472 | 67 | 231 | 935 | 133 | 202 | 1 | ||||||||||||||||||
| North West | Kaduna | 403 | 92 | 41 | 194 | 332 | 982 | 937 | 202 | 589 | 442 | 324 | 156 | 958 | 541 | 151 | 1 | ||||||||||||||||||
| North West | Kano | 542 | 83 | 68 | 182 | 232 | 82 | 798 | 06 | 627 | 354 | 129 | 39 | 997 | 14 | 11 | 1 | ||||||||||||||||||
| North West | Katsina | 677 | 73 | 74 | 173 | 533 | 898 | 89 | 13 | 626 | 658 | 9 | 25 | 997 | 337 | 288 | 1 | ||||||||||||||||||
| North West | Kebbi | 758 | 43 | 67 | 179 | 344 | 51 | 47 | 13 | 944 | 712 | 85 | 279 | 759 | 27 | 495 | 1 | ||||||||||||||||||
| North West | Sokoto | 785 | 31 | 7 | 174 | 36 | 753 | 749 | 11 | 971 | 797 | 47 | 01 | 991 | 09 | 332 | 1 | ||||||||||||||||||
| North West | Zamfara | 773 | 37 | 84 | 176 | 432 | 841 | 809 | 3 | 831 | 736 | 5 | 451 | 969 | 39 | 447 | 1 | ||||||||||||||||||
| 00000007362 | 00000392724 | 00028858881 | 00005053265 | 00001462922 | 00108017923 | 00039047205 | 00009920058 | 00341461283 | 00007434824 | 00000263782 | 00230582487 | 04294511369 | 00000429505 | 04012033851 | |||||||||||||||||||||
| South East | Abia | 172 | 138 | 42 | 66 | 954 | 945 | 334 | 522 | 47 | 728 | 03 | 986 | 593 | 354 | 0 | |||||||||||||||||||
| South East | Anambra | 101 | 122 | 42 | 248 | 27 | 971 | 966 | 35 | 716 | 43 | 846 | 0 | 996 | 759 | 211 | 0 | ||||||||||||||||||
| South East | Ebonyi | 278 | 128 | 53 | 214 | 96 | 891 | 888 | 157 | 488 | 71 | 596 | 5 | 983 | 421 | 227 | 0 | ||||||||||||||||||
| South East | Enugu | 231 | 145 | 48 | 229 | 94 | 994 | 992 | 314 | 581 | 32 | 855 | 05 | 995 | 637 | 265 | 0 | ||||||||||||||||||
| South East | Imo | 134 | 123 | 48 | 114 | 997 | 989 | 341 | 487 | 09 | 909 | 05 | 989 | 766 | 273 | 0 | |||||||||||||||||||
| South South | Akawa Ibom | 129 | 156 | 39 | 212 | 179 | 982 | 98 | 255 | 459 | 225 | 432 | 06 | 959 | 459 | 265 | 0 | ||||||||||||||||||
| South South | Bayelsa | 104 | 139 | 45 | 192 | 167 | 996 | 996 | 133 | 42 | 517 | 284 | 01 | 90 | 316 | 251 | 0 | ||||||||||||||||||
| South South | Cross River | 18 | 139 | 54 | 21 | 184 | 96 | 958 | 24 | 415 | 138 | 404 | 22 | 965 | 60 | 37 | 0 | ||||||||||||||||||
| South South | Delta | 143 | 138 | 41 | 22 | 83 | 948 | 944 | 287 | 673 | 179 | 576 | 54 | 924 | 711 | 281 | 0 | ||||||||||||||||||
| South South | Edo | 121 | 131 | 44 | 225 | 39 | 985 | 985 | 303 | 422 | 144 | 747 | 16 | 961 | 715 | 351 | 0 | ||||||||||||||||||
| South South | Rivers | 10 | 137 | 38 | 231 | 139 | 998 | 996 | 345 | 71 | 20 | 49 | 03 | 936 | 779 | 161 | 0 | ||||||||||||||||||
| South West | Ekiti | 152 | 115 | 43 | 228 | 53 | 989 | 989 | 345 | 26 | 23 | 863 | 05 | 994 | 72 | 34 | 0 | ||||||||||||||||||
| South West | Lagos | 9 | 107 | 41 | 245 | 48 | 999 | 999 | 483 | 253 | 12 | 772 | 08 | 981 | 788 | 149 | 0 | ||||||||||||||||||
| South West | Ogun | 241 | 212 | 54 | 216 | 10 | 991 | 991 | 26 | 354 | 23 | 747 | 02 | 971 | 79 | 234 | 0 | ||||||||||||||||||
| South West | Ondo | 141 | 131 | 52 | 219 | 135 | 928 | 913 | 311 | 454 | 146 | 562 | 33 | 881 | 641 | 218 | 0 | ||||||||||||||||||
| South West | Osun | 163 | 97 | 41 | 235 | 11 | 995 | 995 | 383 | 227 | 15 | 891 | 02 | 997 | 53 | 74 | 0 | ||||||||||||||||||
| South West | Oyo | 249 | 119 | 45 | 214 | 124 | 909 | 889 | 374 | 247 | 106 | 747 | 23 | 846 | 734 | 123 | 0 |
| 2008 | State | Education level female (none) | Education level female (primary) | TFR | of 15-19 yo who have begun childbearing | Heard of any method | Heard of modern method | Current use of any contraception method (married women) | Have NOT heard FP message on radio or TV | No Antenatal Care provider | Health facility delivery | No assistance during delivery | Knoweldge of AIDS (women) | who participate in their own health care decisions | men who agree that a husband is justified in hitting his wife | State wtraditional law | |||||||||||||||||
| North Central | FCT - Abuja | 145 | 95 | 45 | 92 | 927 | 92 | 252 | 387 | 59 | 691 | 4 | 904 | 559 | 18 | 0 | |||||||||||||||||
| North Central | Benue | 257 | 94 | 52 | 225 | 964 | 96 | 165 | 745 | 396 | 509 | 6 | 997 | 285 | 57 | 0 | |||||||||||||||||
| North Central | Kogi | 257 | 118 | 42 | 178 | 775 | 77 | 105 | 606 | 54 | 789 | 04 | 88 | 617 | 187 | 0 | |||||||||||||||||
| North Central | Kwara | 266 | 123 | 51 | 59 | 947 | 946 | 402 | 205 | 49 | 767 | 1 | 925 | 803 | 62 | 0 | |||||||||||||||||
| North Central | Nasarawa | 413 | 94 | 54 | 154 | 844 | 836 | 181 | 79 | 305 | 401 | 129 | 825 | 507 | 454 | 0 | |||||||||||||||||
| North Central | Plateau | 356 | 102 | 54 | 131 | 824 | 82 | 152 | 826 | 339 | 358 | 135 | 806 | 637 | 317 | 0 | |||||||||||||||||
| North East | Adamawa | 355 | 87 | 58 | 287 | 837 | 837 | 44 | 663 | 134 | 334 | 67 | 897 | 349 | 28 | 0 | |||||||||||||||||
| North East | Taraba | 432 | 96 | 6 | 264 | 869 | 867 | 8 | 909 | 373 | 234 | 91 | 956 | 568 | 226 | 0 | |||||||||||||||||
| South East | Abia | 172 | 138 | 42 | 66 | 954 | 945 | 334 | 522 | 47 | 728 | 03 | 986 | 593 | 354 | 0 | |||||||||||||||||
| South East | Anambra | 101 | 122 | 42 | 27 | 971 | 966 | 35 | 716 | 43 | 846 | 0 | 996 | 759 | 211 | 0 | |||||||||||||||||
| South East | Ebonyi | 278 | 128 | 53 | 96 | 891 | 888 | 157 | 488 | 71 | 596 | 5 | 983 | 421 | 227 | 0 | |||||||||||||||||
| South East | Enugu | 231 | 145 | 48 | 94 | 994 | 992 | 314 | 581 | 32 | 855 | 05 | 995 | 637 | 265 | 0 | |||||||||||||||||
| South East | Imo | 134 | 123 | 48 | 114 | 997 | 989 | 341 | 487 | 09 | 909 | 05 | 989 | 766 | 273 | 0 | |||||||||||||||||
| South South | Akawa Ibom | 129 | 156 | 39 | 179 | 982 | 98 | 255 | 459 | 225 | 432 | 06 | 959 | 459 | 265 | 0 | |||||||||||||||||
| South South | Bayelsa | 104 | 139 | 45 | 167 | 996 | 996 | 133 | 42 | 517 | 284 | 01 | 90 | 316 | 251 | 0 | |||||||||||||||||
| South South | Cross River | 18 | 139 | 54 | 184 | 96 | 958 | 24 | 415 | 138 | 404 | 22 | 965 | 60 | 37 | 0 | |||||||||||||||||
| South South | Delta | 143 | 138 | 41 | 83 | 948 | 944 | 287 | 673 | 179 | 576 | 54 | 924 | 711 | 281 | 0 | |||||||||||||||||
| South South | Edo | 121 | 131 | 44 | 39 | 985 | 985 | 303 | 422 | 144 | 747 | 16 | 961 | 715 | 351 | 0 | |||||||||||||||||
| South South | Rivers | 10 | 137 | 38 | 139 | 998 | 996 | 345 | 71 | 20 | 49 | 03 | 936 | 779 | 161 | 0 | |||||||||||||||||
| South West | Ekiti | 152 | 115 | 43 | 53 | 989 | 989 | 345 | 26 | 23 | 863 | 05 | 994 | 72 | 34 | 0 | |||||||||||||||||
| South West | Lagos | 9 | 107 | 41 | 48 | 999 | 999 | 483 | 253 | 12 | 772 | 08 | 981 | 788 | 149 | 0 | |||||||||||||||||
| South West | Ogun | 241 | 212 | 54 | 10 | 991 | 991 | 26 | 354 | 23 | 747 | 02 | 971 | 79 | 234 | 0 | |||||||||||||||||
| South West | Ondo | 141 | 131 | 52 | 135 | 928 | 913 | 311 | 454 | 146 | 562 | 33 | 881 | 641 | 218 | 0 | |||||||||||||||||
| South West | Osun | 163 | 97 | 41 | 11 | 995 | 995 | 383 | 227 | 15 | 891 | 02 | 997 | 53 | 74 | 0 | |||||||||||||||||
| South West | Oyo | 249 | 119 | 45 | 124 | 909 | 889 | 374 | 247 | 106 | 747 | 23 | 846 | 734 | 123 | 0 | |||||||||||||||||
| North Central | Niger | 616 | 6 | 61 | 273 | 555 | 546 | 66 | 844 | 282 | 253 | 58 | 64 | 187 | 196 | 1 | |||||||||||||||||
| North East | bauchi | 623 | 73 | 81 | 481 | 668 | 666 | 22 | 768 | 332 | 169 | 212 | 872 | 29 | 416 | 1 | |||||||||||||||||
| North East | Borno | 69 | 47 | 47 | 288 | 643 | 575 | 18 | 802 | 587 | 17 | 24 | 804 | 25 | 401 | 1 | |||||||||||||||||
| North East | Gombe | 616 | 49 | 7 | 364 | 64 | 618 | 4 | 844 | 225 | 276 | 152 | 794 | 56 | 337 | 1 | |||||||||||||||||
| North East | Yobe | 853 | 12 | 66 | 251 | 805 | 742 | 11 | 873 | 656 | 76 | 02 | 971 | 7 | 345 | 1 | |||||||||||||||||
| North West | Jigawa | 713 | 64 | 76 | 517 | 751 | 709 | 09 | 859 | 472 | 67 | 231 | 935 | 133 | 202 | 1 | |||||||||||||||||
| North West | Kaduna | 403 | 92 | 41 | 332 | 982 | 937 | 202 | 589 | 442 | 324 | 156 | 958 | 541 | 151 | 1 | |||||||||||||||||
| North West | Kano | 542 | 83 | 68 | 232 | 82 | 798 | 06 | 627 | 354 | 129 | 39 | 997 | 14 | 11 | 1 | |||||||||||||||||
| North West | Katsina | 677 | 73 | 74 | 533 | 898 | 89 | 13 | 626 | 658 | 9 | 25 | 997 | 337 | 288 | 1 | |||||||||||||||||
| North West | Kebbi | 758 | 43 | 67 | 344 | 51 | 47 | 13 | 944 | 712 | 85 | 279 | 759 | 27 | 495 | 1 | |||||||||||||||||
| North West | Sokoto | 785 | 31 | 7 | 36 | 753 | 749 | 11 | 971 | 797 | 47 | 01 | 991 | 09 | 332 | 1 | |||||||||||||||||
| North West | Zamfara | 773 | 37 | 84 | 432 | 841 | 809 | 3 | 831 | 736 | 5 | 451 | 969 | 39 | 447 | 1 | |||||||||||||||||
| 0 | 00000000031 | 00000001254 | 00000000003 | 00000003864 | 0000000045 | 00000000536 | 00000378873 | 00000000471 | 0000000004 | 0000011062 | 00509577936 | 00000000007 | 01036675858 | ||||||||||||||||||||
| 4744 | 12196 | 93896 | 93484 | 26384 | 51276 | 14556 | 62128 | 3096 | 93816 | 61136 | 24468 | ||||||||||||||||||||||
| 67083333333 | 36725 | 738833333333 | 709083333333 | 3675 | 798166666667 | 521083333333 | 144666666667 | 183833333333 | 890583333333 | 16275 | 30175 | ||||||||||||||||||||||
| States wo (n=25) | States w (n=12) | Sig (2-tailed) | |||||||||||||||||||||||||||||||
| Determinants of Health | |||||||||||||||||||||||||||||||||
| Median age at first birth women aged 25-49 | 217 | 184 | |||||||||||||||||||||||||||||||
| Education level (none) | 208 | 671 | lt00001 | ||||||||||||||||||||||||||||||
| who participate in their own health care decisions | 611 | 163 | lt00001 | ||||||||||||||||||||||||||||||
| Fertility | |||||||||||||||||||||||||||||||||
| Total Fertility Rate | 474 | 671 | lt00001 | ||||||||||||||||||||||||||||||
| of 15-19 yo who have begun childbearing | 122 | 367 | lt00001 | ||||||||||||||||||||||||||||||
| Family PlanningSRH | |||||||||||||||||||||||||||||||||
| Heard of any contraception method | 939 | 739 | lt00001 | ||||||||||||||||||||||||||||||
| Current use of any contraception method (married women) | 264 | 37 | lt00001 | ||||||||||||||||||||||||||||||
| Have NOT heard FP message on radio or TV | 513 | 798 | lt00001 | ||||||||||||||||||||||||||||||
| Knoweldge of HIVAIDS | 938 | 891 | 0102 | ||||||||||||||||||||||||||||||
| Maternal Health | |||||||||||||||||||||||||||||||||
| No Antenatal Care provider | 146 | 521 | lt00001 | ||||||||||||||||||||||||||||||
| Health facility delivery | 621 | 145 | lt00001 | ||||||||||||||||||||||||||||||
| No assistance during delivery | 31 | 184 | lt00001 |
| 2008 | State | Education level female (none) | Education level female (primary) | TFR | Median age at first birth women aged 25-49 | of 15-19 yo who have begun childbearing | Heard of any method | Heard of modern method | Current use of any contraception method (married women) | Have NOT heard FP message on radio or TV | Partner knows about contraception use | No Antenatal Care provider | Health facility delivery | No assistance during delivery | Knoweldge of AIDS (women) | who participate in their own health care decisions | men who agree that a husband is justified in hitting his wife | men agree that thre is no reason for wife to deny sex | men believe they have the right to use force to have sex with wife | State wtraditional law | |||||||||||||||||||||
| North Central | FCT - Abuja | 177 | 10 | 4 | 228 | 66 | 887 | 885 | 28 | 662 | 861 | 89 | 542 | 4 | 883 | 493 | 42 | 18 | 21 | 0 | |||||||||||||||||||||
| North Central | Benue | 343 | 123 | 59 | 187 | 227 | 918 | 913 | 142 | 787 | 899 | 305 | 509 | 22 | 978 | 521 | 48 | 17 | 45 | 0 | |||||||||||||||||||||
| North Central | Kogi | 296 | 134 | 42 | 204 | 152 | 813 | 79 | 97 | 682 | 764 | 142 | 773 | 55 | 882 | 767 | 186 | 146 | 38 | 0 | |||||||||||||||||||||
| North Central | Kwara | 443 | 88 | 45 | 202 | 295 | 616 | 576 | 246 | 76 | 855 | 339 | 488 | 269 | 581 | 355 | 92 | 103 | 12 | 0 | |||||||||||||||||||||
| North Central | Nasarawa | 304 | 94 | 47 | 20 | 197 | 475 | 469 | 12 | 804 | 752 | 232 | 329 | 89 | 718 | 68 | 712 | 05 | 198 | 0 | |||||||||||||||||||||
| North Central | Plateau | 307 | 158 | 53 | 203 | 148 | 71 | 708 | 111 | 861 | 697 | 157 | 302 | 41 | 818 | 62 | 365 | 05 | 64 | 0 | |||||||||||||||||||||
| North East | Adamawa | 498 | 75 | 68 | 192 | 243 | 611 | 602 | 28 | 724 | 571 | 378 | 107 | 183 | 857 | 428 | 464 | 07 | 117 | 0 | |||||||||||||||||||||
| North East | Taraba | 489 | 68 | 59 | 194 | 215 | 794 | 792 | 5 | 899 | 796 | 463 | 211 | 111 | 923 | 344 | 291 | 26 | 8 | 0 | |||||||||||||||||||||
| South East | Abia | 16 | 138 | 44 | 244 | 134 | 963 | 96 | 239 | 342 | 911 | 83 | 744 | 22 | 989 | 515 | 387 | 18 | 57 | 0 | |||||||||||||||||||||
| South East | Anambra | 135 | 128 | 5 | 244 | 62 | 892 | 865 | 344 | 447 | 934 | 08 | 878 | 0 | 995 | 61 | 125 | 11 | 28 | 0 | |||||||||||||||||||||
| South East | Ebonyi | 345 | 137 | 56 | 21 | 82 | 607 | 599 | 61 | 642 | 849 | 201 | 407 | 144 | 916 | 493 | 642 | 49 | 14 | 0 | |||||||||||||||||||||
| South East | Enugu | 308 | 148 | 44 | 23 | 58 | 797 | 788 | 211 | 497 | 806 | 108 | 536 | 12 | 937 | 582 | 692 | 37 | 74 | 0 | |||||||||||||||||||||
| South East | Imo | 156 | 139 | 48 | 243 | 79 | 929 | 923 | 227 | 262 | 935 | 25 | 943 | 05 | 99 | 661 | 296 | 47 | 14 | 0 | |||||||||||||||||||||
| South South | Akawa Ibom | 122 | 193 | 4 | 22 | 151 | 966 | 947 | 327 | 338 | 826 | 126 | 369 | 06 | 983 | 636 | 288 | 43 | 45 | 0 | |||||||||||||||||||||
| South South | Bayelsa | 178 | 127 | 58 | 191 | 211 | 89 | 884 | 101 | 492 | 809 | 355 | 184 | 0 | 904 | 509 | 252 | 26 | 43 | 0 | |||||||||||||||||||||
| South South | Cross River | 183 | 155 | 54 | 198 | 181 | 779 | 77 | 203 | 506 | 827 | 159 | 385 | 36 | 952 | 679 | 538 | 17 | 54 | 0 | |||||||||||||||||||||
| South South | Delta | 144 | 171 | 45 | 218 | 82 | 859 | 818 | 266 | 718 | 858 | 19 | 572 | 33 | 896 | 781 | 405 | 0 | 23 | 0 | |||||||||||||||||||||
| South South | Edo | 159 | 161 | 53 | 218 | 29 | 876 | 872 | 316 | 395 | 792 | 54 | 762 | 23 | 851 | 67 | 321 | 08 | 19 | 0 | |||||||||||||||||||||
| South South | Rivers | 14 | 128 | 43 | 217 | 99 | 972 | 959 | 272 | 446 | 885 | 266 | 479 | 57 | 921 | 532 | 259 | 64 | 23 | 0 | |||||||||||||||||||||
| South West | Ekiti | 187 | 114 | 5 | 227 | 79 | 949 | 949 | 173 | 384 | 819 | 3 | 752 | 34 | 957 | 762 | 158 | 42 | 14 | 0 | |||||||||||||||||||||
| South West | Lagos | 97 | 111 | 4 | 243 | 53 | 988 | 979 | 496 | 176 | 877 | 18 | 769 | 2 | 98 | 689 | 214 | 76 | 05 | 0 | |||||||||||||||||||||
| South West | Ogun | 318 | 179 | 54 | 218 | 12 | 886 | 884 | 139 | 29 | 919 | 54 | 638 | 04 | 852 | 657 | 30 | 27 | 18 | 0 | |||||||||||||||||||||
| South West | Ondo | 236 | 112 | 49 | 221 | 77 | 924 | 912 | 212 | 345 | 837 | 147 | 469 | 6 | 842 | 744 | 94 | 5 | 29 | 0 | |||||||||||||||||||||
| South West | Osun | 33 | 159 | 4 | 224 | 5 | 966 | 961 | 38 | 183 | 873 | 06 | 851 | 18 | 953 | 653 | 325 | 07 | 1 | 0 | |||||||||||||||||||||
| South West | Oyo | 224 | 146 | 5 | 216 | 197 | 937 | 933 | 219 | 338 | 857 | 105 | 671 | 62 | 933 | 677 | 31 | 38 | 1 | 0 | |||||||||||||||||||||
| North Central | Niger | 683 | 44 | 75 | 193 | 414 | 263 | 259 | 46 | 796 | -633 | 392 | 159 | 186 | 414 | 43 | 309 | 35 | 55 | 1 | |||||||||||||||||||||
| North East | bauchi | 722 | 66 | 81 | 175 | 51 | 70 | 672 | 27 | 811 | 758 | 491 | 13 | 343 | 891 | 165 | 32 | 18 | 178 | 1 | |||||||||||||||||||||
| North East | Borno | 798 | 46 | 71 | 179 | 48 | 547 | 54 | 65 | 864 | 837 | 648 | 118 | 8 | 838 | 273 | 623 | 83 | 348 | 1 | |||||||||||||||||||||
| North East | Gombe | 546 | 61 | 74 | 184 | 465 | 487 | 484 | 56 | 757 | 672 | 405 | 172 | 133 | 732 | 441 | 401 | 02 | 75 | 1 | |||||||||||||||||||||
| North East | Yobe | 77 | 36 | 75 | 177 | 417 | 312 | 285 | 19 | 821 | 699 | 625 | 61 | 173 | 521 | 57 | 546 | 11 | 507 | 1 | |||||||||||||||||||||
| North West | Jigawa | 76 | 73 | 71 | 186 | 45 | 431 | 423 | 02 | 819 | 50 | 787 | 45 | 294 | 968 | 137 | 143 | 104 | 33 | 1 | |||||||||||||||||||||
| North West | Kaduna | 419 | 92 | 63 | 19 | 316 | 839 | 829 | 96 | 747 | 634 | 362 | 184 | 64 | 97 | 481 | 151 | 67 | 33 | 1 | |||||||||||||||||||||
| North West | Kano | 595 | 104 | 81 | 179 | 422 | 47 | 466 | 23 | 617 | 68 | 487 | 111 | 579 | 942 | 62 | 57 | 13 | 27 | 1 | |||||||||||||||||||||
| North West | Katsina | 76 | 51 | 72 | 179 | 65 | 257 | 239 | 08 | 53 | 444 | 828 | 42 | 595 | 839 | 238 | 184 | 68 | 115 | 1 | |||||||||||||||||||||
| North West | Kebbi | 778 | 36 | 6 | 185 | 389 | 18 | 135 | 19 | 773 | 529 | 847 | 48 | 53 | 766 | 133 | 808 | 159 | 68 | 1 | |||||||||||||||||||||
| North West | Sokoto | 835 | 34 | 87 | 179 | 467 | 468 | 445 | 21 | 738 | 556 | 853 | 44 | 252 | 784 | 46 | 448 | 25 | 93 | 1 | |||||||||||||||||||||
| North West | Zamfara | 841 | 18 | 75 | 185 | 47 | 475 | 40 | 25 | 819 | 613 | 855 | 65 | 606 | 696 | 264 | 197 | 225 | 62 | 1 | |||||||||||||||||||||
| 0 | 00000000073 | 0 | 00000001142 | 0 | 00000000141 | 0000000012 | 00000029067 | 00004726093 | 00001914403 | 00000000001 | 00000000504 | 00000004739 | 00046873618 | 0000000001 | 03898156073 | 00307981969 | 00034416604 |
| Nigeria | |||
| Marriage amp Sexual Activity | |||
| Law criminalizing child marriage | |||
| Legal Age of Marriage | 9-18 Depends on state and religion | ||
| Age of capacity to consent to sex | Puberty-18 Depends on state and religion | ||
| Access to SRH services | |||
| Age of consent to aceess contraceptives | No information available | ||
| Is spousal consent required to access any SRH services | Not legally but many providers require it | ||
| Abortion legal | Illegal except to save womans life | ||
| Gender-based violence (GBV) | |||
| Is there a law on GBV | Yes Depends on state | ||
| Is marital rape criminalized | No | ||
| Legal Framework | |||
| Is there implementing legislation for international law | Yes | ||
| UN Conventions Ratified | CEDAWCEDAW Optional Protocol | ||
| CRCCRC Optional Protocols | |||
| Customary amp religious law | Yes |
| 1990 | 1999 | 2003 | 2008 | 2013 | ||||||||||||||||||||||||||||||||||||
| Demographics | ||||||||||||||||||||||||||||||||||||||||
| Taken from 1980 NDSS amp NFS census 1991 census 2006 | Population | 847 | 889 | 1404 | ||||||||||||||||||||||||||||||||||||
| Percet urban | 23 | 363 | ||||||||||||||||||||||||||||||||||||||
| Total fertility rate (per 1000) | 63 | 59 | 57 | |||||||||||||||||||||||||||||||||||||
| Infant Mortality Rate (per 1000) | 85 | 93 | 100 | |||||||||||||||||||||||||||||||||||||
| Life expectancy at birth | 48 | 532 | Any education | 1990 | 1999 | 2003 | 2008 | 2013 | ||||||||||||||||||||||||||||||||
| Education level of female hh (none) | Northeast | 82 | 64 | 68 | 655 | 611 | Northeast | 18 | 36 | 32 | 345 | 389 | ||||||||||||||||||||||||||||
| Northwest | 862 | 646 | 722 | 675 | 628 | Northwest | 138 | 354 | 278 | 325 | 372 | |||||||||||||||||||||||||||||
| Southeast | 431 | 188 | 178 | 208 | 187 | Southeast | 569 | 812 | 822 | 792 | 813 | |||||||||||||||||||||||||||||
| Southwest | 297 | 228 | 233 | 215 | 171 | Southwest | 703 | 772 | 767 | 785 | 829 | |||||||||||||||||||||||||||||
| Southsouth | 206 | 149 | 13 | Southsouth | 794 | 851 | 87 | |||||||||||||||||||||||||||||||||
| Northcentral | 41 | 409 | 393 | 38 | Northcentral | 59 | 591 | 607 | 62 | |||||||||||||||||||||||||||||||
| Education level of female hh (primary) | Northeast | 48 | 144 | 171 | 159 | 167 | ||||||||||||||||||||||||||||||||||
| Northwest | 66 | 115 | 136 | 131 | 158 | |||||||||||||||||||||||||||||||||||
| Southeast | 246 | 445 | 251 | 232 | 22 | |||||||||||||||||||||||||||||||||||
| Southwest | 275 | 366 | 199 | 192 | 195 | |||||||||||||||||||||||||||||||||||
| Southsouth | na | na | 275 | 22 | 224 | |||||||||||||||||||||||||||||||||||
| Northcentral | na | 315 | 272 | 238 | 233 | |||||||||||||||||||||||||||||||||||
| Female by age amp education (none) | 5-9 | 544 | 328 | 459 | 439 | 434 | ||||||||||||||||||||||||||||||||||
| 10-14 | 341 | 20 | 268 | 258 | 259 | |||||||||||||||||||||||||||||||||||
| 15-19 | 336 | 221 | 302 | 241 | 271 | |||||||||||||||||||||||||||||||||||
| 20-24 | 42 | 289 | 339 | 298 | 332 | |||||||||||||||||||||||||||||||||||
| 25-29 | 542 | 319 | 397 | 331 | 376 | |||||||||||||||||||||||||||||||||||
| 30-34 | 711 | 395 | 475 | 373 | 38 | |||||||||||||||||||||||||||||||||||
| 35-39 | 704 | 446 | 498 | 372 | 407 | |||||||||||||||||||||||||||||||||||
| 40-44 | 789 | 562 | 604 | 46 | 427 | |||||||||||||||||||||||||||||||||||
| 45-49 | 847 | 58 | 68 | 549 | 51 | |||||||||||||||||||||||||||||||||||
| 50-54 | 909 | 63 | 763 | 621 | 567 | |||||||||||||||||||||||||||||||||||
| 55-59 | 958 | 728 | 809 | 641 | 644 | |||||||||||||||||||||||||||||||||||
| 60-64 | 963 | 766 | 855 | 695 | 696 | |||||||||||||||||||||||||||||||||||
| 65+ | 952 | 836 | 887 | 779 | 782 | |||||||||||||||||||||||||||||||||||
| Female by Residence amp Education (none) | Urban | 363 | 254 | 319 | 22 | 215 | ||||||||||||||||||||||||||||||||||
| Rural | 652 | 433 | 534 | 489 | 535 | |||||||||||||||||||||||||||||||||||
| Fertility | ||||||||||||||||||||||||||||||||||||||||
| TRF | Northeast | 6532 | 679 | 7 | 72 | 63 | ||||||||||||||||||||||||||||||||||
| Northwest | 6645 | 645 | 67 | 73 | 67 | |||||||||||||||||||||||||||||||||||
| Southeast | 5573 | 464 | 41 | 48 | 47 | |||||||||||||||||||||||||||||||||||
| Southwest | 5461 | 45 | 41 | 45 | 46 | |||||||||||||||||||||||||||||||||||
| Southsouth | 46 | 47 | 43 | |||||||||||||||||||||||||||||||||||||
| Northcentral | 71 | 449 | 57 | 54 | 53 | |||||||||||||||||||||||||||||||||||
| TFR Urban | 503 | 45 | 49 | 47 | 47 | |||||||||||||||||||||||||||||||||||
| TFR Rural | 633 | 544 | 61 | 63 | 62 | |||||||||||||||||||||||||||||||||||
| Median age at first birth by region and age 25-49 | Northeast | 188 | 182 | 178 | 182 | 188 | ||||||||||||||||||||||||||||||||||
| Northwest | 195 | 186 | 178 | 183 | 179 | |||||||||||||||||||||||||||||||||||
| Southeast | 196 | 21 | 227 | 236 | 237 | |||||||||||||||||||||||||||||||||||
| Southwest | 205 | 211 | 221 | 227 | 227 | |||||||||||||||||||||||||||||||||||
| Southsouth | 198 | 214 | 218 | |||||||||||||||||||||||||||||||||||||
| Northcentral | 198 | 197 | 20 | 206 | ||||||||||||||||||||||||||||||||||||
| Ages 15-19 | started childbearing by 15 | 131 | 108 | 75 | 63 | 51 | ||||||||||||||||||||||||||||||||||
| started childbearing by 16 | 208 | 94 | 139 | 13 | 134 | |||||||||||||||||||||||||||||||||||
| started childbearing by 17 | 302 | 264 | 311 | 242 | 226 | |||||||||||||||||||||||||||||||||||
| started childbearing by 18 | 393 | 305 | 342 | 357 | 372 | |||||||||||||||||||||||||||||||||||
| started childbearing by 19 | 428 | 343 | 395 | 384 | 413 | |||||||||||||||||||||||||||||||||||
| started childbearing Northeast | 502 | 513 | 445 | 393 | 321 | |||||||||||||||||||||||||||||||||||
| started childbearing Northwest | 462 | 547 | 452 | 446 | 357 | |||||||||||||||||||||||||||||||||||
| started childbearing Southeast | 167 | 83 | 62 | 81 | 82 | |||||||||||||||||||||||||||||||||||
| started childbearing Southwest | 108 | 79 | 47 | 88 | 82 | |||||||||||||||||||||||||||||||||||
| started childbearing Southsouth | na | na | 143 | 119 | 123 | |||||||||||||||||||||||||||||||||||
| started childbearing Northcentral | na | 176 | 164 | 222 | 188 | |||||||||||||||||||||||||||||||||||
| Fertility Regulation | ||||||||||||||||||||||||||||||||||||||||
| Know modern method | Northeast | 219 | 346 | 608 | 572 | 701 | ||||||||||||||||||||||||||||||||||
| Northwest | 277 | 391 | 718 | 431 | 784 | |||||||||||||||||||||||||||||||||||
| Southeast | 539 | 79 | 845 | 843 | 954 | |||||||||||||||||||||||||||||||||||
| Southwest | 714 | 837 | 965 | 944 | 957 | |||||||||||||||||||||||||||||||||||
| Southsouth | na | na | 933 | 882 | 975 | |||||||||||||||||||||||||||||||||||
| Northcentral | na | 677 | 759 | 632 | 78 | |||||||||||||||||||||||||||||||||||
| Know any method | Northeast | 24 | 354 | 635 | 586 | 732 | ||||||||||||||||||||||||||||||||||
| Northwest | 303 | 422 | 751 | 451 | 811 | |||||||||||||||||||||||||||||||||||
| Southeast | 566 | 816 | 871 | 855 | 959 | |||||||||||||||||||||||||||||||||||
| Southwest | 736 | 872 | 97 | 95 | 964 | |||||||||||||||||||||||||||||||||||
| Southsouth | 942 | 899 | 977 | |||||||||||||||||||||||||||||||||||||
| Northcentral | 70 | 774 | 643 | 786 | ||||||||||||||||||||||||||||||||||||
| Current use of any contraception method (married women) | Northeast | 2 | 31 | 42 | 4 | 32 | ||||||||||||||||||||||||||||||||||
| Northwest | 12 | 32 | 49 | 28 | 43 | |||||||||||||||||||||||||||||||||||
| Southeast | 88 | 235 | 225 | 234 | 293 | |||||||||||||||||||||||||||||||||||
| Southwest | 15 | 262 | 327 | 317 | 38 | |||||||||||||||||||||||||||||||||||
| Southsouth | 254 | 262 | 281 | |||||||||||||||||||||||||||||||||||||
| Northcentral | 178 | 133 | 13 | 156 | ||||||||||||||||||||||||||||||||||||
| Have NOT heard FP message on radio or TV | Northeast | 847 | 863 | 766 | 814 | 807 | ||||||||||||||||||||||||||||||||||
| Northwest | 801 | 744 | 604 | 693 | 734 | |||||||||||||||||||||||||||||||||||
| Southeast | 795 | 612 | 414 | 422 | 565 | |||||||||||||||||||||||||||||||||||
| Southwest | 545 | 38 | 301 | 257 | 289 | |||||||||||||||||||||||||||||||||||
| Southsouth | na | na | 447 | 486 | 552 | |||||||||||||||||||||||||||||||||||
| Northcentral | na | 66 | 697 | 776 | 69 | |||||||||||||||||||||||||||||||||||
| Both partners approve FP | Northeast | 39 | 157 | 18 | ||||||||||||||||||||||||||||||||||||
| Northwest | 345 | 173 | 174 | |||||||||||||||||||||||||||||||||||||
| Southeast | 438 | 43 | 507 | |||||||||||||||||||||||||||||||||||||
| Southwest | 496 | 516 | 606 | |||||||||||||||||||||||||||||||||||||
| Southsouth | na | na | 474 | |||||||||||||||||||||||||||||||||||||
| Northcentral | na | 45 | 406 | |||||||||||||||||||||||||||||||||||||
| Husban disapproves FP | Northeast | 109 | 52 | 114 | ||||||||||||||||||||||||||||||||||||
| Northwest | 62 | 26 | 75 | |||||||||||||||||||||||||||||||||||||
| Southeast | 124 | 97 | 91 | |||||||||||||||||||||||||||||||||||||
| Southwest | 175 | 74 | 115 | |||||||||||||||||||||||||||||||||||||
| Southsouth | na | na | 178 | |||||||||||||||||||||||||||||||||||||
| Northcentral | na | 69 | 11 | |||||||||||||||||||||||||||||||||||||
| Proximate determinants of fertility | ||||||||||||||||||||||||||||||||||||||||
| Married by age | 15-19 | 34 | 244 | 309 | 278 | 282 | ||||||||||||||||||||||||||||||||||
| 20-24 | 708 | 576 | 592 | 571 | 613 | |||||||||||||||||||||||||||||||||||
| 25-29 | 815 | 78 | 803 | 788 | 798 | |||||||||||||||||||||||||||||||||||
| 30-34 | 849 | 847 | 867 | 885 | 866 | |||||||||||||||||||||||||||||||||||
| 35-39 | 837 | 849 | 913 | 904 | 894 | |||||||||||||||||||||||||||||||||||
| 40-44 | 777 | 827 | 876 | 885 | 878 | |||||||||||||||||||||||||||||||||||
| 45-49 | 787 | 756 | 847 | 856 | 839 | |||||||||||||||||||||||||||||||||||
| Never married by age | 15-19 | 614 | 725 | 667 | 706 | 704 | ||||||||||||||||||||||||||||||||||
| 20-24 | 217 | 365 | 361 | 384 | 331 | |||||||||||||||||||||||||||||||||||
| 25-29 | 79 | 13 | 122 | 162 | 141 | |||||||||||||||||||||||||||||||||||
| 30-34 | 09 | 51 | 51 | 58 | 67 | |||||||||||||||||||||||||||||||||||
| 35-39 | 12 | 19 | 17 | 26 | 27 | |||||||||||||||||||||||||||||||||||
| 40-44 | 03 | 13 | 07 | 14 | 15 | |||||||||||||||||||||||||||||||||||
| 45-49 | 01 | 11 | 09 | 08 | 07 | |||||||||||||||||||||||||||||||||||
| Median age at first marraige by region and age less than 50 of women in this group had births so could not calculate | 20-49 Northeast | 152 | 151 | 153 | 156 | 164 | ||||||||||||||||||||||||||||||||||
| 20-49 Northwest | 154 | 147 | 148 | 153 | 154 | |||||||||||||||||||||||||||||||||||
| 20-49 Southeast | 185 | |||||||||||||||||||||||||||||||||||||||
| 20-49 Southwest | ||||||||||||||||||||||||||||||||||||||||
| 20-49 Southsouth | na | na | ||||||||||||||||||||||||||||||||||||||
| 20-49 Northcentral | na | 182 | 182 | 187 | 191 | |||||||||||||||||||||||||||||||||||
| Northeast | 152 | 15 | 15 | 156 | 163 | |||||||||||||||||||||||||||||||||||
| Northwest | 154 | 146 | 146 | 152 | 153 | |||||||||||||||||||||||||||||||||||
| Southeast | 183 | 202 | 218 | 228 | 227 | |||||||||||||||||||||||||||||||||||
| Southwest | 197 | 202 | 213 | 219 | 218 | |||||||||||||||||||||||||||||||||||
| Southsouth | 192 | 209 | 215 | |||||||||||||||||||||||||||||||||||||
| Northcentral | 179 | 177 | 183 | 189 | ||||||||||||||||||||||||||||||||||||
| Fertility Preferences married women | ||||||||||||||||||||||||||||||||||||||||
| Total unmet need for family planning by age | 15-19 | 16 | 148 | 146 | 19 | 131 | ||||||||||||||||||||||||||||||||||
| 20-24 | 146 | 227 | 164 | 214 | 166 | |||||||||||||||||||||||||||||||||||
| 25-29 | 161 | 17 | 171 | 204 | 168 | |||||||||||||||||||||||||||||||||||
| 30-34 | 181 | 179 | 191 | 201 | 171 | |||||||||||||||||||||||||||||||||||
| 35-39 | 239 | 181 | 181 | 213 | 176 | |||||||||||||||||||||||||||||||||||
| 40-44 | 297 | 154 | 193 | 214 | 168 | |||||||||||||||||||||||||||||||||||
| 45-49 | 434 | 119 | 114 | 162 | 115 | |||||||||||||||||||||||||||||||||||
| Total unmet need for FP by region | Northeast | 209 | 122 | 181 | 176 | 175 | ||||||||||||||||||||||||||||||||||
| Northwest | 142 | 244 | 111 | 208 | 12 | |||||||||||||||||||||||||||||||||||
| Southeast | 263 | 209 | 189 | 181 | 125 | |||||||||||||||||||||||||||||||||||
| Southwest | 23 | 157 | 172 | 197 | 154 | |||||||||||||||||||||||||||||||||||
| Southsouth | 245 | 259 | 222 | |||||||||||||||||||||||||||||||||||||
| Northcentral | 163 | 218 | 187 | 235 | ||||||||||||||||||||||||||||||||||||
| Total demand for FP | Northeast | 229 | 153 | 223 | 216 | 207 | ||||||||||||||||||||||||||||||||||
| Northwest | 154 | 276 | 161 | 235 | 163 | |||||||||||||||||||||||||||||||||||
| Southeast | 353 | 444 | 414 | 415 | 418 | |||||||||||||||||||||||||||||||||||
| Southwest | 38 | 419 | 499 | 513 | 535 | |||||||||||||||||||||||||||||||||||
| Southsouth | 499 | 522 | 502 | |||||||||||||||||||||||||||||||||||||
| Northcentral | 341 | 351 | 317 | 391 | ||||||||||||||||||||||||||||||||||||
| Percentage of demand staisfied | Northeast | 88 | 20 | 19 | 187 | 152 | ||||||||||||||||||||||||||||||||||
| Northwest | 79 | 117 | 308 | 117 | 262 | |||||||||||||||||||||||||||||||||||
| Southeast | 254 | 53 | 543 | 563 | 70 | |||||||||||||||||||||||||||||||||||
| Southwest | 395 | 625 | 656 | 617 | 711 | |||||||||||||||||||||||||||||||||||
| Southsouth | 509 | 503 | 559 | |||||||||||||||||||||||||||||||||||||
| Northcentral | 522 | 379 | 41 | 399 | ||||||||||||||||||||||||||||||||||||
| Infant amp Child Mortality | ||||||||||||||||||||||||||||||||||||||||
| Northeast | Neonatal mortality | 392 | 445 | 61 | 53 | 42 | ||||||||||||||||||||||||||||||||||
| Postneonatal mortality | 485 | 349 | 65 | 56 | 33 | |||||||||||||||||||||||||||||||||||
| Infant mortality | 877 | 794 | 125 | 109 | 77 | |||||||||||||||||||||||||||||||||||
| Child mortality | 1392 | 1041 | 154 | 126 | 90 | |||||||||||||||||||||||||||||||||||
| Under-five mortality | 2146 | 1752 | 260 | 222 | 160 | |||||||||||||||||||||||||||||||||||
| Northwest | Neonatal mortality | 578 | 251 | 55 | 47 | 44 | ||||||||||||||||||||||||||||||||||
| Postneonatal mortality | 52 | 575 | 59 | 44 | 46 | |||||||||||||||||||||||||||||||||||
| Infant mortality | 1098 | 826 | 114 | 91 | 89 | |||||||||||||||||||||||||||||||||||
| Child mortality | 1512 | 1151 | 176 | 139 | 105 | |||||||||||||||||||||||||||||||||||
| Under-five mortality | 2444 | 1882 | 269 | 217 | 185 | |||||||||||||||||||||||||||||||||||
| Southeast | Neonatal mortality | 386 | 373 | 34 | 51 | 37 | ||||||||||||||||||||||||||||||||||
| Postneonatal mortality | 441 | 371 | 32 | 44 | 45 | |||||||||||||||||||||||||||||||||||
| Infant mortality | 827 | 743 | 66 | 95 | 82 | |||||||||||||||||||||||||||||||||||
| Child mortality | 665 | 656 | 40 | 64 | 54 | |||||||||||||||||||||||||||||||||||
| Under-five mortality | 1437 | 135 | 103 | 153 | 131 | |||||||||||||||||||||||||||||||||||
| Southwest | Neonatal mortality | 463 | 426 | 39 | 37 | 39 | ||||||||||||||||||||||||||||||||||
| Postneonatal mortality | 383 | 273 | 30 | 22 | 21 | |||||||||||||||||||||||||||||||||||
| Infant mortality | 846 | 699 | 69 | 59 | 61 | |||||||||||||||||||||||||||||||||||
| Child mortality | 903 | 339 | 47 | 32 | 31 | |||||||||||||||||||||||||||||||||||
| Under-five mortality | 1672 | 1015 | 113 | 89 | 90 | |||||||||||||||||||||||||||||||||||
| Southsouth | Neonatal mortality | 53 | 48 | 32 | ||||||||||||||||||||||||||||||||||||
| Postneonatal mortality | 68 | 37 | 26 | Northeast | Neonatal mortality | 392 | 445 | 61 | 53 | 42 | ||||||||||||||||||||||||||||||
| Infant mortality | 120 | 84 | 58 | Northwest | Neonatal mortality | 578 | 251 | 55 | 47 | 44 | ||||||||||||||||||||||||||||||
| Child mortality | 63 | 58 | 35 | Southeast | Neonatal mortality | 386 | 373 | 34 | 51 | 37 | ||||||||||||||||||||||||||||||
| Under-five mortality | 176 | 138 | 91 | Southwest | Neonatal mortality | 463 | 426 | 39 | 37 | 39 | ||||||||||||||||||||||||||||||
| Northcentral | Neonatal mortality | 238 | 53 | 41 | 35 | Southsouth | Neonatal mortality | 53 | 48 | 32 | ||||||||||||||||||||||||||||||
| Postneonatal mortality | 269 | 49 | 37 | 31 | Northeast | Postneonatal mortality | 485 | 349 | 65 | 56 | 33 | |||||||||||||||||||||||||||||
| Infant mortality | 507 | 103 | 77 | 66 | Northwest | Postneonatal mortality | 52 | 575 | 59 | 44 | 46 | |||||||||||||||||||||||||||||
| Child mortality | 355 | 70 | 62 | 36 | Southwest | Postneonatal mortality | 383 | 273 | 30 | 22 | 21 | |||||||||||||||||||||||||||||
| Under-five mortality | 844 | 165 | 135 | 100 | Southeast | Postneonatal mortality | 441 | 371 | 32 | 44 | 45 | |||||||||||||||||||||||||||||
| Maternal amp Child Health | Southsouth | Postneonatal mortality | 68 | 37 | 26 | |||||||||||||||||||||||||||||||||||
| No antenatal care provider | Northeast | 547 | 541 | 471 | 512 | 408 | Northeast | Infant mortality | 877 | 794 | 125 | 109 | 77 | |||||||||||||||||||||||||||
| Northwest | 524 | 651 | 59 | 671 | 554 | Northwest | Infant mortality | 1098 | 826 | 114 | 91 | 89 | ||||||||||||||||||||||||||||
| Southeast | 196 | 77 | 08 | 74 | 42 | Southeast | Infant mortality | 827 | 743 | 66 | 95 | 82 | ||||||||||||||||||||||||||||
| Southwest | 77 | 35 | 23 | 57 | 57 | Southwest | Infant mortality | 846 | 699 | 69 | 59 | 61 | ||||||||||||||||||||||||||||
| Southsouth | 168 | 188 | 206 | Southsouth | Infant mortality | 120 | 84 | 58 | ||||||||||||||||||||||||||||||||
| Northcentral | 202 | 253 | 262 | 26 | Northeast | Under-five mortality | 2146 | 1752 | 260 | 222 | 160 | |||||||||||||||||||||||||||||
| Health facility delivery | Northeast | 104 | 117 | 171 | 128 | 195 | Northwest | Under-five mortality | 2444 | 1882 | 269 | 217 | 185 | |||||||||||||||||||||||||||
| Northwest | 97 | 64 | 104 | 84 | 115 | Southeast | Under-five mortality | 1437 | 135 | 103 | 153 | 131 | ||||||||||||||||||||||||||||
| Southeast | 463 | 549 | 841 | 739 | 781 | Southwest | Under-five mortality | 1672 | 1015 | 113 | 89 | 90 | ||||||||||||||||||||||||||||
| Southwest | 636 | 672 | 776 | 70 | 75 | Southsouth | Under-five mortality | 176 | 138 | 91 | ||||||||||||||||||||||||||||||
| Southsouth | 532 | 481 | 501 | Northeast | Child mortality | 1392 | 1041 | 154 | 126 | 90 | ||||||||||||||||||||||||||||||
| Northcentral | 443 | 454 | 41 | 457 | Northwest | Child mortality | 1512 | 1151 | 176 | 139 | 105 | |||||||||||||||||||||||||||||
| No assistance during delivery | Northeast | 561 | 232 | 198 | 186 | 97 | Southeast | Child mortality | 665 | 656 | 40 | 64 | 54 | |||||||||||||||||||||||||||
| Northwest | 635 | 255 | 305 | 438 | 278 | Southwest | Child mortality | 903 | 339 | 47 | 32 | 31 | ||||||||||||||||||||||||||||
| Southeast | 159 | 23 | 04 | 3 | 15 | Southsouth | Child mortality | 63 | 58 | 35 | ||||||||||||||||||||||||||||||
| Southwest | 157 | 24 | 09 | 32 | 13 | |||||||||||||||||||||||||||||||||||
| Southsouth | 18 | 31 | 18 | |||||||||||||||||||||||||||||||||||||
| Northcentral | 41 | 9 | 102 | 65 | ||||||||||||||||||||||||||||||||||||
| STDs FGM others | na | yes | yes | yes | yes |
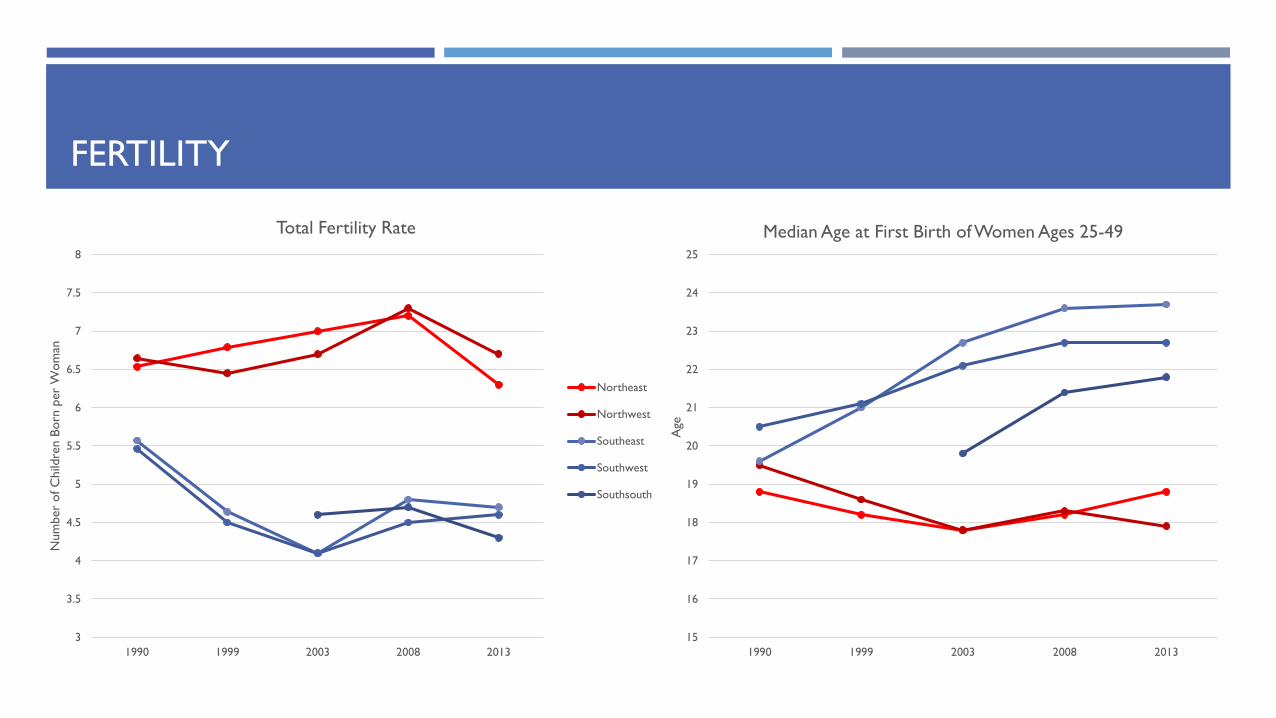

0
10
20
30
40
50
60
2008 2013
Current Use of Contraception (married women - percentage)
FCT - Abuja Benue Kogi Kwara Nasarawa Plateau Adamawa Taraba
Abia Anambra Ebonyi Enugu Imo Akawa Ibom Bayelsa Cross River
Delta Edo Rivers Ekiti Lagos Ogun Ondo Osun
Oyo Niger Bauchi Borno Gombe Yobe Jigawa Kaduna
Kano Katsina Kebbi Sokoto Zamfara
STATE-LEVEL TIME TRENDS (2008-2013)
STATE-LEVEL TIME TRENDS (2008-2013)
0
10
20
30
40
50
60
70
80
90
100
2008 2013
Facility Delivery (Percentage)
FCT - Abuja Benue Kogi Kwara Nasarawa Plateau Adamawa Taraba
Abia Anambra Ebonyi Enugu Imo Akawa Ibom Bayelsa Cross River
Delta Edo Rivers Ekiti Lagos Ogun Ondo Osun
Oyo Niger Bauchi Borno Gombe Yobe Jigawa Kaduna
Kano Katsina Kebbi Sokoto Zamfara
STATUS OF WOMENrsquoS HEALTH 2013
States wo (n=25) States w (n=12) Sig (2-tailed)Determinants of HealthMedian age at first birth women aged 25-49 217 184Education level (none) 208 671 lt00001 who participate in their own health care decisions 611 163 lt00001Fertility Total Fertility Rate 474 671 lt00001 of 15-19 yo who have begun childbearing 122 367 lt00001Family PlanningSRHHeard of any contraception method 939 739 lt00001Current use of any contraception method (married women) 264 37 lt00001Have NOT heard FP message on radio or TV 513 798 lt00001Knoweldge of HIVAIDS 938 891 0102Maternal HealthNo Antenatal Care provider 146 521 lt00001Health facility delivery 621 145 lt00001No assistance during delivery 31 184 lt00001
Sheet1
Percentage of females without any level of education
Northeast19901999200320082013826468655611Northwest1990199920032008201386264599999999999994722675628Southeast19901999200320082013431188178208187Southwest1990199920032008201329722823321517100000000000001Southsouth1990199920032008201320614913Northcentral19901999200320082013414093929999999999999738
Percent of women who did not receive ANC
Northeast1990199920032008201354754147151240799999999999997Northwest19901999200320082013524650999999999999945967099999999999994554Southeast199019992003200820131960000000000000177087442Southwest199019992003200820137735229999999999999985757Southsouth19901999200320082013168188206Northcentral1990199920032008201320225326226
Percent of women who delivered in a facility
Northeast1990199920032008201310411717100000000000001128195Northwest19901999200320082013969999999999999936410484115Southeast199019992003200820134635498417390000000000000678099999999999994Southwest19901999200320082013636672775999999999999947075Southsouth19901999200320082013532481501Northcentral1990199920032008201344345441457
Percent of women delivered without assistance
Northeast199019992003200820135612321981860000000000000196999999999999993Northwest19901999200320082013635255305438278Southeast199019992003200820131592299999999999999804315Southwest1990199920032008201315724093213Southsouth19901999200320082013183118Northcentral199019992003200820134099999999999999691019999999999999965
Percentage of women with any level of education
Northeast19901999200320082013183632345389Northwest1990199920032008201313799999999999997354000000000000062779999999999999732537200000000000003Southeast19901999200320082013569812822792813Southwest19901999200320082013703772767785829Southsouth199019992003200820137940000000000000685187
Percentage ()
Total Fertility Rate
Northeast19901999200320082013653267977263Northwest1990199920032008201366449999999999996645677367Southeast199019992003200820135573000000000000446399999999999997409999999999999964847Southwest199019992003200820135461000000000000345409999999999999964545999999999999996Southsouth19901999200320082013459999999999999964743
Total Fertiliy Rate
Median Age at First Birth of Women Ages 25-49
Northeast19901999200320082013188182178182188Northwest199019992003200820131951860000000000000117818317899999999999999Southeast199019992003200820131960000000000000121227236237Southwest19901999200320082013205211221227227Southsouth19901999200320082013198214218
Age
Percent of women who know at least 1 contraceptive method
Northeast1990199920032008201324354635586732Northwest199019992003200820133034227509999999999999445181099999999999994Southeast1990199920032008201356681599999999999994871855959Southwest19901999200320082013735999999999999948729795964Southsouth19901999200320082013942899977
Percent ()
Current use of contraceptive method amongst married women
Northeast1990199920032008201323142432Northwest199019992003200820131232490000000000000042843Southeast1990199920032008201388000000000000007235225234293Southwest19901999200320082013152623270000000000000331738Southsouth19901999200320082013254262281
Percent ()
Median Age at First Marraige (women 25-49)
Northeast199019992003200820131521515156163Northwest19901999200320082013154146146152153Southeast19901999200320082013183202218228227Southwest19901999200320082013197202213219218Southsouth19901999200320082013192209215
Age
No Antenatal Care Provision
Northeast1990199920032008201354754147151240799999999999997Northwest19901999200320082013524650999999999999945967099999999999994554Southeast199019992003200820131960000000000000177087442Southwest199019992003200820137735229999999999999985757Southsouth19901999200320082013168188206
Percent ()
Total fertility rate
Northeast19901999200320082013653267977263Northwest1990199920032008201366449999999999996645677367Southeast199019992003200820135573000000000000446399999999999997409999999999999964847Southwest199019992003200820135461000000000000345409999999999999964545999999999999996Southsouth19901999200320082013459999999999999964743Northcentral1990199920032008201371449575453
Facility Delivery
Northeast1990199920032008201310411717100000000000001128195Northwest19901999200320082013969999999999999936410484115Southeast199019992003200820134635498417390000000000000678099999999999994Southwest19901999200320082013636672775999999999999947075Southsouth19901999200320082013532481501
Percent()
Neonatal mortality19901999200320082013578251554744Infant mortality1990199920032008201310988261149189Neonatal mortality38637299999999999997345137Infant mortality827743669582
Infant Mortality
Northeast199019992003200820138777940000000000000612510977Northwest1990199920032008201310988261149189Southeast19901999200320082013827743669582Southwest1990199920032008201384669900000000000006695961Southsouth199019992003200820131208458
Percent ()
Median Age at First Birth of Women Ages 25-49
Northeast19901999200320082013188182178182188Northwest199019992003200820131951860000000000000117818317899999999999999Southeast199019992003200820131960000000000000121227236237Southwest19901999200320082013205211221227227Southsouth19901999200320082013198214218Northcentral1990199920032008201319819720206
Percent of women who know about at least 1 contraceptive method
Northeast1990199920032008201324354635586732Northwest199019992003200820133034227509999999999999445181099999999999994Southeast1990199920032008201356681599999999999994871855959Southwest19901999200320082013735999999999999948729795964Southsouth19901999200320082013942899977Northcentral19901999200320082013707740000000000000664378599999999999994
Use of contraceptive method (married women)
Northeast1990199920032008201323142432Northwest199019992003200820131232490000000000000042843Southeast1990199920032008201388000000000000007235225234293Southwest19901999200320082013152623270000000000000331738Southsouth19901999200320082013254262281Northcentral1990199920032008201317813313156
Median Age at First Marraige (women 25-49)
Northeast199019992003200820131521515156163Northwest19901999200320082013154146146152153Southeast19901999200320082013183202218228227Southwest19901999200320082013197202213219218Southsouth19901999200320082013192209215Northcentral199019992003200820131789999999999999917718318899999999999999
Total unmet need for FP
Northeast199019992003200820132091221810000000000000117600000000000001175Northwest1990199920032008201314224411120812Southeast199019992003200820132632091889999999999999918100000000000001125Southwest1990199920032008201323157172197154Southsouth19901999200320082013245259222Northcentral19901999200320082013163218187235
Total demand for FP
Northeast19901999200320082013229153223216207Northwest1990199920032008201315427616100000000000001235163Southeast1990199920032008201335299999999999997444414415418Southwest1990199920032008201338419499513535Southsouth19901999200320082013499522502Northcentral19901999200320082013341351317391
Percentage of FP demand satisfied
Northeast19901999200320082013880000000000000072019187152Northwest1990199920032008201379117308117262Southeast199019992003200820132545354356370Southwest199019992003200820133956256559999999999999461771099999999999994Southsouth19901999200320082013509503559Northcentral1990199920032008201352237941399
Nigeria laws
States 2008
States 2013
States 2013 (2)
State trends
FCT - Abuja2008201328252Benue20082013142165Kogi2008201396999999999999993105Kwara2008201324640200000000000003Nasarawa200820131218100000000000001Plateau20082013111152Adamawa200820132844000000000000004Taraba2008201358Abia20082013239334Anambra2008201334435Ebonyi2008201361157Enugu20082013211314Imo20082013227341Akawa Ibom2008201332700000000000003255Bayelsa20082013101133Cross River2008201320324Delta20082013266287Edo20082013316303Rivers20082013272345Ekiti20082013173345Lagos20082013496483Ogun2008201313926Ondo20082013212311Osun200820133838299999999999997Oyo20082013219374Niger200820134599999999999999666Bauchi200820132722000000000000002Borno200820136518Gombe20082013564Yobe200820131911000000000000001Jigawa200820130209Kaduna2008201396202Kano200820132299999999999999806Katsina200820130813Kebbi200820131913Sokoto200820132111000000000000001Zamfara20082013253
Facility Delivery
FCT - Abuja2008201354269099999999999994Benue20082013509509Kogi2008201377378900000000000006Kwara20082013488767Nasarawa20082013329401Plateau2008201330235799999999999997Adamawa20082013107334Taraba20082013211234Abia2008201374400000000000006728Anambra20082013878846Ebonyi2008201340700000000000003596Enugu20082013536855Imo20082013943909Akawa Ibom20082013369432Bayelsa2008201318399999999999999284Cross River20082013385404Delta20082013572576Edo20082013762747Rivers2008201347949Ekiti20082013752863Lagos2008201376900000000000006772Ogun20082013638747Ondo20082013469562Osun20082013851891Oyo2008201367099999999999994747Niger20082013159253Bauchi200820131316899999999999999Borno2008201311817Gombe20082013172276Yobe200820136176Jigawa200820134567Kaduna2008201318399999999999999324Kano20082013111129Katsina20082013429Kebbi200820134885Sokoto200820134400000000000000447Zamfara20082013655
Percentage receiving no antenatal care
FCT - Abuja200820138959Benue20082013305396Kogi2008201314254Kwara2008201333949000000000000004Nasarawa20082013232305Plateau20082013157339Adamawa2008201337799999999999997134Taraba2008201346337299999999999997Abia200820138300000000000000747Anambra200820130843Ebonyi200820132010000000000000171Enugu2008201310832Imo200820132509Akawa Ibom20082013126225Bayelsa20082013355517Cross River20082013159138Delta200820131917899999999999999Edo2008201354144Rivers2008201326620Ekiti20082013322999999999999998Lagos200820131812Ogun200820135422999999999999998Ondo20082013147146Osun200820130615Oyo20082013105106Niger2008201339200000000000003282Bauchi2008201349133200000000000003Borno20082013648587Gombe20082013405225Yobe2008201362565599999999999994Jigawa20082013787472Kaduna2008201336200000000000003442Kano20082013487354Katsina20082013828658Kebbi20082013847712Sokoto20082013853797Zamfara2008201385573599999999999994
STATUS OF WOMENrsquoS HEALTH 2013
NORTHERN STATES ONLY
States wo (n=8) States w (n=12) Sig (2-tailed)Determinants of Health
Median age at first birth women aged 25-49 208 184Education level (none) 310 671 lt00001 who participate in their own health care decisions 541 163 lt00001Fertility Total Fertility Rate 520 671 0003 of 15-19 yo who have begun childbearing 1738 3673 lt00001
Family PlanningSRHHeard of any contraception method 8734 7388 001Current use of any contraception method (married women) 1726 368 0001Have NOT heard FP message on radio or TV 6414 7982 003Knoweldge of HIVAIDS 8988 8906 043Maternal Health
No Antenatal Care provider 2136 5211 lt00001
Health facility delivery 5104 1447 lt00001
No assistance during delivery 670 1838 002
Sheet1
Percentage of females without any level of education
Northeast19901999200320082013826468655611Northwest1990199920032008201386264599999999999994722675628Southeast19901999200320082013431188178208187Southwest1990199920032008201329722823321517100000000000001Southsouth1990199920032008201320614913Northcentral19901999200320082013414093929999999999999738
Percent of women who did not receive ANC
Northeast1990199920032008201354754147151240799999999999997Northwest19901999200320082013524650999999999999945967099999999999994554Southeast199019992003200820131960000000000000177087442Southwest199019992003200820137735229999999999999985757Southsouth19901999200320082013168188206Northcentral1990199920032008201320225326226
Percent of women who delivered in a facility
Northeast1990199920032008201310411717100000000000001128195Northwest19901999200320082013969999999999999936410484115Southeast199019992003200820134635498417390000000000000678099999999999994Southwest19901999200320082013636672775999999999999947075Southsouth19901999200320082013532481501Northcentral1990199920032008201344345441457
Percent of women delivered without assistance
Northeast199019992003200820135612321981860000000000000196999999999999993Northwest19901999200320082013635255305438278Southeast199019992003200820131592299999999999999804315Southwest1990199920032008201315724093213Southsouth19901999200320082013183118Northcentral199019992003200820134099999999999999691019999999999999965
Percentage of women with any level of education
Northeast19901999200320082013183632345389Northwest1990199920032008201313799999999999997354000000000000062779999999999999732537200000000000003Southeast19901999200320082013569812822792813Southwest19901999200320082013703772767785829Southsouth199019992003200820137940000000000000685187
Percentage ()
Total Fertility Rate
Northeast19901999200320082013653267977263Northwest1990199920032008201366449999999999996645677367Southeast199019992003200820135573000000000000446399999999999997409999999999999964847Southwest199019992003200820135461000000000000345409999999999999964545999999999999996Southsouth19901999200320082013459999999999999964743
Total Fertiliy Rate
Median Age at First Birth of Women Ages 25-49
Northeast19901999200320082013188182178182188Northwest199019992003200820131951860000000000000117818317899999999999999Southeast199019992003200820131960000000000000121227236237Southwest19901999200320082013205211221227227Southsouth19901999200320082013198214218
Age
Percent of women who know at least 1 contraceptive method
Northeast1990199920032008201324354635586732Northwest199019992003200820133034227509999999999999445181099999999999994Southeast1990199920032008201356681599999999999994871855959Southwest19901999200320082013735999999999999948729795964Southsouth19901999200320082013942899977
Percent ()
Current use of contraceptive method amongst married women
Northeast1990199920032008201323142432Northwest199019992003200820131232490000000000000042843Southeast1990199920032008201388000000000000007235225234293Southwest19901999200320082013152623270000000000000331738Southsouth19901999200320082013254262281
Percent ()
Median Age at First Marraige (women 25-49)
Northeast199019992003200820131521515156163Northwest19901999200320082013154146146152153Southeast19901999200320082013183202218228227Southwest19901999200320082013197202213219218Southsouth19901999200320082013192209215
Age
No Antenatal Care Provision
Northeast1990199920032008201354754147151240799999999999997Northwest19901999200320082013524650999999999999945967099999999999994554Southeast199019992003200820131960000000000000177087442Southwest199019992003200820137735229999999999999985757Southsouth19901999200320082013168188206
Percent ()
Total fertility rate
Northeast19901999200320082013653267977263Northwest1990199920032008201366449999999999996645677367Southeast199019992003200820135573000000000000446399999999999997409999999999999964847Southwest199019992003200820135461000000000000345409999999999999964545999999999999996Southsouth19901999200320082013459999999999999964743Northcentral1990199920032008201371449575453
Facility Delivery
Northeast1990199920032008201310411717100000000000001128195Northwest19901999200320082013969999999999999936410484115Southeast199019992003200820134635498417390000000000000678099999999999994Southwest19901999200320082013636672775999999999999947075Southsouth19901999200320082013532481501
Percent()
Neonatal mortality19901999200320082013578251554744Infant mortality1990199920032008201310988261149189Neonatal mortality38637299999999999997345137Infant mortality827743669582
Infant Mortality
Northeast199019992003200820138777940000000000000612510977Northwest1990199920032008201310988261149189Southeast19901999200320082013827743669582Southwest1990199920032008201384669900000000000006695961Southsouth199019992003200820131208458
Percent ()
Median Age at First Birth of Women Ages 25-49
Northeast19901999200320082013188182178182188Northwest199019992003200820131951860000000000000117818317899999999999999Southeast199019992003200820131960000000000000121227236237Southwest19901999200320082013205211221227227Southsouth19901999200320082013198214218Northcentral1990199920032008201319819720206
Percent of women who know about at least 1 contraceptive method
Northeast1990199920032008201324354635586732Northwest199019992003200820133034227509999999999999445181099999999999994Southeast1990199920032008201356681599999999999994871855959Southwest19901999200320082013735999999999999948729795964Southsouth19901999200320082013942899977Northcentral19901999200320082013707740000000000000664378599999999999994
Use of contraceptive method (married women)
Northeast1990199920032008201323142432Northwest199019992003200820131232490000000000000042843Southeast1990199920032008201388000000000000007235225234293Southwest19901999200320082013152623270000000000000331738Southsouth19901999200320082013254262281Northcentral1990199920032008201317813313156
Median Age at First Marraige (women 25-49)
Northeast199019992003200820131521515156163Northwest19901999200320082013154146146152153Southeast19901999200320082013183202218228227Southwest19901999200320082013197202213219218Southsouth19901999200320082013192209215Northcentral199019992003200820131789999999999999917718318899999999999999
Total unmet need for FP
Northeast199019992003200820132091221810000000000000117600000000000001175Northwest1990199920032008201314224411120812Southeast199019992003200820132632091889999999999999918100000000000001125Southwest1990199920032008201323157172197154Southsouth19901999200320082013245259222Northcentral19901999200320082013163218187235
Total demand for FP
Northeast19901999200320082013229153223216207Northwest1990199920032008201315427616100000000000001235163Southeast1990199920032008201335299999999999997444414415418Southwest1990199920032008201338419499513535Southsouth19901999200320082013499522502Northcentral19901999200320082013341351317391
Percentage of FP demand satisfied
Northeast19901999200320082013880000000000000072019187152Northwest1990199920032008201379117308117262Southeast199019992003200820132545354356370Southwest199019992003200820133956256559999999999999461771099999999999994Southsouth19901999200320082013509503559Northcentral1990199920032008201352237941399
Nigeria laws
States 2008
States 2013
States 2013 (2)
State trends
FCT - Abuja2008201328252Benue20082013142165Kogi2008201396999999999999993105Kwara2008201324640200000000000003Nasarawa200820131218100000000000001Plateau20082013111152Adamawa200820132844000000000000004Taraba2008201358Abia20082013239334Anambra2008201334435Ebonyi2008201361157Enugu20082013211314Imo20082013227341Akawa Ibom2008201332700000000000003255Bayelsa20082013101133Cross River2008201320324Delta20082013266287Edo20082013316303Rivers20082013272345Ekiti20082013173345Lagos20082013496483Ogun2008201313926Ondo20082013212311Osun200820133838299999999999997Oyo20082013219374Niger200820134599999999999999666Bauchi200820132722000000000000002Borno200820136518Gombe20082013564Yobe200820131911000000000000001Jigawa200820130209Kaduna2008201396202Kano200820132299999999999999806Katsina200820130813Kebbi200820131913Sokoto200820132111000000000000001Zamfara20082013253
Facility Delivery
FCT - Abuja2008201354269099999999999994Benue20082013509509Kogi2008201377378900000000000006Kwara20082013488767Nasarawa20082013329401Plateau2008201330235799999999999997Adamawa20082013107334Taraba20082013211234Abia2008201374400000000000006728Anambra20082013878846Ebonyi2008201340700000000000003596Enugu20082013536855Imo20082013943909Akawa Ibom20082013369432Bayelsa2008201318399999999999999284Cross River20082013385404Delta20082013572576Edo20082013762747Rivers2008201347949Ekiti20082013752863Lagos2008201376900000000000006772Ogun20082013638747Ondo20082013469562Osun20082013851891Oyo2008201367099999999999994747Niger20082013159253Bauchi200820131316899999999999999Borno2008201311817Gombe20082013172276Yobe200820136176Jigawa200820134567Kaduna2008201318399999999999999324Kano20082013111129Katsina20082013429Kebbi200820134885Sokoto200820134400000000000000447Zamfara20082013655
Percentage receiving no antenatal care
FCT - Abuja200820138959Benue20082013305396Kogi2008201314254Kwara2008201333949000000000000004Nasarawa20082013232305Plateau20082013157339Adamawa2008201337799999999999997134Taraba2008201346337299999999999997Abia200820138300000000000000747Anambra200820130843Ebonyi200820132010000000000000171Enugu2008201310832Imo200820132509Akawa Ibom20082013126225Bayelsa20082013355517Cross River20082013159138Delta200820131917899999999999999Edo2008201354144Rivers2008201326620Ekiti20082013322999999999999998Lagos200820131812Ogun200820135422999999999999998Ondo20082013147146Osun200820130615Oyo20082013105106Niger2008201339200000000000003282Bauchi2008201349133200000000000003Borno20082013648587Gombe20082013405225Yobe2008201362565599999999999994Jigawa20082013787472Kaduna2008201336200000000000003442Kano20082013487354Katsina20082013828658Kebbi20082013847712Sokoto20082013853797Zamfara2008201385573599999999999994
THE ROLE OF EDUCATION
Living in a state with customary and religious laws and laws that impede access to sexual and reproductive health services affect education opportunities for women ndash an example
Child marriage Customary law allows marriage of girls between 12 and
15 years the minimum age of marriage can be as low as nine Under Islamic law age of marriage is defined as ldquoage of pubertyrdquo
Among married girls aged 15 to 19 62 have already given birth
Almost 1 out of 4 gave birth before age 15 Only 2 of 15 to 19-year-old married girls are in school
compared to 69 of unmarried girls
Source ReutersA Akinleye
EDUCATION AS A MEDIATOR
1 Living in a state with living with customary and religious laws and laws that impede access to sexual and reproductive health services is a significant predictor or current contraception use amongst married women
(Pearson Correlation = -747) (Linear regression R2=56 F(1 35)=4423 plt00001 βSTATE=-2271 t=-665 plt00001)
2 Living in a state with living with customary and religious laws and laws that impede access to sexual and reproductive health services is a significant predictor of education level
(Pearson Correlation = 901) (Linear regression R2=81 F(1 35)=15083 plt00001 βEDUCATION=4624 t=1228 plt00001)
3 Living in a state with living with customary and religious laws and laws that impede access to sexual and reproductive health services is a significant predictor of education level
(Linear regression R2 = 72 F(2 34) = 4398 plt00001 βSTATE=274 t=43 p=067 βEDUCATION= -55 t=-445 plt00001)
Current contraception
use
Living in a state w
customary laws
Education Level (None)
a b
crsquo
TO CONCLUDE WHY IS THE LAW IMPORTANT
Nigerian states with customary and religious laws and laws that impede access to sexual and reproductive health services have seen fewer if any improvements in womenrsquos health outcomes across the years
Education mediates the relationship between current contraception use amongst married women and living in a state with customary and religious laws
Progress in achieving development goals have been slow and uneven and wide regional differences exist
Customary religious and traditional laws tend to have particular impacts on women and girls and must be addressed
Domestic legal frameworks are largely inadequate in addressing sexual and reproductive health due to loopholes
Social norms and practices are shifting but others continue as part of deep-rooted value systems that subordinate women and girls
Integrated approaches must be developed with the support and knowledge of women and girls and must involve traditional cultural and religious leaders as well as men and boys
- Association between Plural Legal Systems and Sexual and Reproductive Health Outcomes for Women and Girls in Northern Nigeria
- Overview
- Convention on the Elimination of all Forms of Discrimination Against Women (CEDAW) impact on Sexual amp reproductive health
- Plural Legal Systems
- Customary Religious and Traditional LawLegal pluralism permits religious traditional and customary law or practice to trump national legislation through two primary avenues
- Nigeria Legal System
- Nigeria Legal framework
- NIGeRia Laws and policies
- Legal systems amp geography
- Data Sources
- Regional Time trends (1990-2013)
- Fertility
- Family Planning
- Maternal Health
- State-level Time trends (2008-2013)
- State-level Time trends (2008-2013)
- Slide Number 17
- Slide Number 18
- The role of education
- Education as a mediator
- To Conclude Why is the law important
-
| Current use of any contraception method (married women) | Health facility delivery | rate change contra | rate change facility | No Antenatal Care provider | |||||||||||||||||||||||
| State | 2008 | 2013 | 2008 | 2013 | 2008 | 2013 | rate of change | ||||||||||||||||||||
| North Central | FCT - Abuja | 28 | 252 | 542 | 691 | -28 | 149 | 89 | 59 | -3 | |||||||||||||||||
| North Central | Benue | 142 | 165 | 509 | 509 | 23 | 0 | 305 | 396 | 91 | |||||||||||||||||
| North Central | Kogi | 97 | 105 | 773 | 789 | 08 | 16 | 142 | 54 | -88 | |||||||||||||||||
| North Central | Kwara | 246 | 402 | 488 | 767 | 156 | 279 | 339 | 49 | -29 | |||||||||||||||||
| North Central | Nasarawa | 12 | 181 | 329 | 401 | 61 | 72 | 232 | 305 | 73 | |||||||||||||||||
| North Central | Plateau | 111 | 152 | 302 | 358 | 41 | 56 | 157 | 339 | 182 | |||||||||||||||||
| North East | Adamawa | 28 | 44 | 107 | 334 | 16 | 227 | 378 | 134 | -244 | |||||||||||||||||
| North East | Taraba | 5 | 8 | 211 | 234 | 3 | 23 | 463 | 373 | -9 | |||||||||||||||||
| South East | Abia | 239 | 334 | 744 | 728 | 95 | -16 | 83 | 47 | -36 | |||||||||||||||||
| South East | Anambra | 344 | 35 | 878 | 846 | 06 | -32 | 08 | 43 | 35 | |||||||||||||||||
| South East | Ebonyi | 61 | 157 | 407 | 596 | 96 | 189 | 201 | 71 | -13 | |||||||||||||||||
| South East | Enugu | 211 | 314 | 536 | 855 | 103 | 319 | 108 | 32 | -76 | |||||||||||||||||
| South East | Imo | 227 | 341 | 943 | 909 | 114 | -34 | 25 | 09 | -16 | |||||||||||||||||
| South South | Akawa Ibom | 327 | 255 | 369 | 432 | -72 | 63 | 126 | 225 | 99 | |||||||||||||||||
| South South | Bayelsa | 101 | 133 | 184 | 284 | 32 | 10 | 355 | 517 | 162 | |||||||||||||||||
| South South | Cross River | 203 | 24 | 385 | 404 | 37 | 19 | 159 | 138 | -21 | |||||||||||||||||
| South South | Delta | 266 | 287 | 572 | 576 | 21 | 04 | 19 | 179 | -11 | |||||||||||||||||
| South South | Edo | 316 | 303 | 762 | 747 | -13 | -15 | 54 | 144 | 9 | |||||||||||||||||
| South South | Rivers | 272 | 345 | 479 | 49 | 73 | 11 | 266 | 20 | -66 | |||||||||||||||||
| South West | Ekiti | 173 | 345 | 752 | 863 | 172 | 111 | 3 | 23 | -07 | |||||||||||||||||
| South West | Lagos | 496 | 483 | 769 | 772 | -13 | 03 | 18 | 12 | -06 | |||||||||||||||||
| South West | Ogun | 139 | 26 | 638 | 747 | 121 | 109 | 54 | 23 | -31 | |||||||||||||||||
| South West | Ondo | 212 | 311 | 469 | 562 | 99 | 93 | 147 | 146 | -01 | |||||||||||||||||
| South West | Osun | 38 | 383 | 851 | 891 | 03 | 4 | 06 | 15 | 09 | |||||||||||||||||
| South West | Oyo | 219 | 374 | 671 | 747 | 155 | 76 | 5344 | 7448 | average rate change states without | 105 | 106 | 01 | ||||||||||||||
| North Central | Niger | 46 | 66 | 159 | 253 | 2 | 94 | 392 | 282 | -11 | |||||||||||||||||
| North East | Bauchi | 27 | 22 | 13 | 169 | -05 | 39 | 491 | 332 | -159 | |||||||||||||||||
| North East | Borno | 65 | 18 | 118 | 17 | -47 | 52 | 648 | 587 | -61 | |||||||||||||||||
| North East | Gombe | 56 | 4 | 172 | 276 | -16 | 104 | 405 | 225 | -18 | |||||||||||||||||
| North East | Yobe | 19 | 11 | 61 | 76 | -08 | 15 | 625 | 656 | 31 | |||||||||||||||||
| North West | Jigawa | 02 | 09 | 45 | 67 | 07 | 22 | 787 | 472 | -315 | |||||||||||||||||
| North West | Kaduna | 96 | 202 | 184 | 324 | 106 | 14 | 362 | 442 | 8 | |||||||||||||||||
| North West | Kano | 23 | 06 | 111 | 129 | -17 | 18 | 487 | 354 | -133 | |||||||||||||||||
| North West | Katsina | 08 | 13 | 42 | 9 | 05 | 48 | 828 | 658 | -17 | |||||||||||||||||
| North West | Kebbi | 19 | 13 | 48 | 85 | -06 | 37 | 847 | 712 | -135 | |||||||||||||||||
| North West | Sokoto | 21 | 11 | 44 | 47 | -1 | 03 | 853 | 797 | -56 | |||||||||||||||||
| North West | Zamfara | 25 | 3 | 65 | 5 | 05 | -15 | 02833333333 | 46416666667 | average rate change states with | 855 | 736 | -119 | ||||||||||||||
| 00071049204 | 01702860614 | 00077553648 |
| 2008 | State | Education level female (none) | Education level female (primary) | TFR | Median age at first birth women aged 25-49 | of 15-19 yo who have begun childbearing | Heard of any method | Heard of modern method | Current use of any contraception method (married women) | Have NOT heard FP message on radio or TV | No Antenatal Care provider | Health facility delivery | No assistance during delivery | Knoweldge of AIDS (women) | who participate in their own health care decisions | men who agree that a husband is justified in hitting his wife | State wtraditional law | ||||||||||||||||||
| North Central | FCT - Abuja | 145 | 95 | 45 | 236 | 92 | 927 | 92 | 252 | 387 | 59 | 691 | 4 | 904 | 559 | 18 | 0 | ||||||||||||||||||
| North Central | Benue | 257 | 94 | 52 | 189 | 225 | 964 | 96 | 165 | 745 | 396 | 509 | 6 | 997 | 285 | 57 | 0 | ||||||||||||||||||
| North Central | Kogi | 257 | 118 | 42 | 21 | 178 | 775 | 77 | 105 | 606 | 54 | 789 | 04 | 88 | 617 | 187 | 0 | ||||||||||||||||||
| North Central | Kwara | 266 | 123 | 51 | 221 | 59 | 947 | 946 | 402 | 205 | 49 | 767 | 1 | 925 | 803 | 62 | 0 | ||||||||||||||||||
| North Central | Nasarawa | 413 | 94 | 54 | 206 | 154 | 844 | 836 | 181 | 79 | 305 | 401 | 129 | 825 | 507 | 454 | 0 | ||||||||||||||||||
| North Central | Plateau | 356 | 102 | 54 | 219 | 131 | 824 | 82 | 152 | 826 | 339 | 358 | 135 | 806 | 637 | 317 | 0 | ||||||||||||||||||
| North East | Adamawa | 355 | 87 | 58 | 191 | 287 | 837 | 837 | 44 | 663 | 134 | 334 | 67 | 897 | 349 | 28 | 0 | ||||||||||||||||||
| North East | Taraba | 432 | 96 | 6 | 189 | 264 | 869 | 867 | 8 | 909 | 373 | 234 | 91 | 956 | 568 | 226 | 0 | ||||||||||||||||||
| North Central | Niger | 616 | 6 | 61 | 198 | 273 | 555 | 546 | 66 | 844 | 282 | 253 | 58 | 64 | 187 | 196 | 1 | ||||||||||||||||||
| North East | bauchi | 623 | 73 | 81 | 177 | 481 | 668 | 666 | 22 | 768 | 332 | 169 | 212 | 872 | 29 | 416 | 1 | ||||||||||||||||||
| North East | Borno | 69 | 47 | 47 | 204 | 288 | 643 | 575 | 18 | 802 | 587 | 17 | 24 | 804 | 25 | 401 | 1 | ||||||||||||||||||
| North East | Gombe | 616 | 49 | 7 | 181 | 364 | 64 | 618 | 4 | 844 | 225 | 276 | 152 | 794 | 56 | 337 | 1 | ||||||||||||||||||
| North East | Yobe | 853 | 12 | 66 | 189 | 251 | 805 | 742 | 11 | 873 | 656 | 76 | 02 | 971 | 7 | 345 | 1 | ||||||||||||||||||
| North West | Jigawa | 713 | 64 | 76 | 177 | 517 | 751 | 709 | 09 | 859 | 472 | 67 | 231 | 935 | 133 | 202 | 1 | ||||||||||||||||||
| North West | Kaduna | 403 | 92 | 41 | 194 | 332 | 982 | 937 | 202 | 589 | 442 | 324 | 156 | 958 | 541 | 151 | 1 | ||||||||||||||||||
| North West | Kano | 542 | 83 | 68 | 182 | 232 | 82 | 798 | 06 | 627 | 354 | 129 | 39 | 997 | 14 | 11 | 1 | ||||||||||||||||||
| North West | Katsina | 677 | 73 | 74 | 173 | 533 | 898 | 89 | 13 | 626 | 658 | 9 | 25 | 997 | 337 | 288 | 1 | ||||||||||||||||||
| North West | Kebbi | 758 | 43 | 67 | 179 | 344 | 51 | 47 | 13 | 944 | 712 | 85 | 279 | 759 | 27 | 495 | 1 | ||||||||||||||||||
| North West | Sokoto | 785 | 31 | 7 | 174 | 36 | 753 | 749 | 11 | 971 | 797 | 47 | 01 | 991 | 09 | 332 | 1 | ||||||||||||||||||
| North West | Zamfara | 773 | 37 | 84 | 176 | 432 | 841 | 809 | 3 | 831 | 736 | 5 | 451 | 969 | 39 | 447 | 1 | ||||||||||||||||||
| 00000007362 | 00000392724 | 00028858881 | 00005053265 | 00001462922 | 00108017923 | 00039047205 | 00009920058 | 00341461283 | 00007434824 | 00000263782 | 00230582487 | 04294511369 | 00000429505 | 04012033851 | |||||||||||||||||||||
| South East | Abia | 172 | 138 | 42 | 66 | 954 | 945 | 334 | 522 | 47 | 728 | 03 | 986 | 593 | 354 | 0 | |||||||||||||||||||
| South East | Anambra | 101 | 122 | 42 | 248 | 27 | 971 | 966 | 35 | 716 | 43 | 846 | 0 | 996 | 759 | 211 | 0 | ||||||||||||||||||
| South East | Ebonyi | 278 | 128 | 53 | 214 | 96 | 891 | 888 | 157 | 488 | 71 | 596 | 5 | 983 | 421 | 227 | 0 | ||||||||||||||||||
| South East | Enugu | 231 | 145 | 48 | 229 | 94 | 994 | 992 | 314 | 581 | 32 | 855 | 05 | 995 | 637 | 265 | 0 | ||||||||||||||||||
| South East | Imo | 134 | 123 | 48 | 114 | 997 | 989 | 341 | 487 | 09 | 909 | 05 | 989 | 766 | 273 | 0 | |||||||||||||||||||
| South South | Akawa Ibom | 129 | 156 | 39 | 212 | 179 | 982 | 98 | 255 | 459 | 225 | 432 | 06 | 959 | 459 | 265 | 0 | ||||||||||||||||||
| South South | Bayelsa | 104 | 139 | 45 | 192 | 167 | 996 | 996 | 133 | 42 | 517 | 284 | 01 | 90 | 316 | 251 | 0 | ||||||||||||||||||
| South South | Cross River | 18 | 139 | 54 | 21 | 184 | 96 | 958 | 24 | 415 | 138 | 404 | 22 | 965 | 60 | 37 | 0 | ||||||||||||||||||
| South South | Delta | 143 | 138 | 41 | 22 | 83 | 948 | 944 | 287 | 673 | 179 | 576 | 54 | 924 | 711 | 281 | 0 | ||||||||||||||||||
| South South | Edo | 121 | 131 | 44 | 225 | 39 | 985 | 985 | 303 | 422 | 144 | 747 | 16 | 961 | 715 | 351 | 0 | ||||||||||||||||||
| South South | Rivers | 10 | 137 | 38 | 231 | 139 | 998 | 996 | 345 | 71 | 20 | 49 | 03 | 936 | 779 | 161 | 0 | ||||||||||||||||||
| South West | Ekiti | 152 | 115 | 43 | 228 | 53 | 989 | 989 | 345 | 26 | 23 | 863 | 05 | 994 | 72 | 34 | 0 | ||||||||||||||||||
| South West | Lagos | 9 | 107 | 41 | 245 | 48 | 999 | 999 | 483 | 253 | 12 | 772 | 08 | 981 | 788 | 149 | 0 | ||||||||||||||||||
| South West | Ogun | 241 | 212 | 54 | 216 | 10 | 991 | 991 | 26 | 354 | 23 | 747 | 02 | 971 | 79 | 234 | 0 | ||||||||||||||||||
| South West | Ondo | 141 | 131 | 52 | 219 | 135 | 928 | 913 | 311 | 454 | 146 | 562 | 33 | 881 | 641 | 218 | 0 | ||||||||||||||||||
| South West | Osun | 163 | 97 | 41 | 235 | 11 | 995 | 995 | 383 | 227 | 15 | 891 | 02 | 997 | 53 | 74 | 0 | ||||||||||||||||||
| South West | Oyo | 249 | 119 | 45 | 214 | 124 | 909 | 889 | 374 | 247 | 106 | 747 | 23 | 846 | 734 | 123 | 0 | ||||||||||||||||||
| States wo (n=8) | States w (n=12) | Sig (2-tailed) | |||||||||||||||||||||||||||||||||
| Determinants of Health | |||||||||||||||||||||||||||||||||||
| Median age at first birth women aged 25-49 | 208 | 184 | |||||||||||||||||||||||||||||||||
| Education level (none) | 310 | 671 | lt00001 | ||||||||||||||||||||||||||||||||
| who participate in their own health care decisions | 541 | 163 | lt00001 | ||||||||||||||||||||||||||||||||
| Fertility | |||||||||||||||||||||||||||||||||||
| Total Fertility Rate | 520 | 671 | 0003 | ||||||||||||||||||||||||||||||||
| of 15-19 yo who have begun childbearing | 1738 | 3673 | lt00001 | ||||||||||||||||||||||||||||||||
| Family PlanningSRH | |||||||||||||||||||||||||||||||||||
| Heard of any contraception method | 8734 | 7388 | 001 | ||||||||||||||||||||||||||||||||
| Current use of any contraception method (married women) | 1726 | 368 | 0001 | ||||||||||||||||||||||||||||||||
| Have NOT heard FP message on radio or TV | 6414 | 7982 | 003 | ||||||||||||||||||||||||||||||||
| Knoweldge of HIVAIDS | 8988 | 8906 | 043 | ||||||||||||||||||||||||||||||||
| Maternal Health | |||||||||||||||||||||||||||||||||||
| No Antenatal Care provider | 2136 | 5211 | lt00001 | ||||||||||||||||||||||||||||||||
| Health facility delivery | 5104 | 1447 | lt00001 | ||||||||||||||||||||||||||||||||
| No assistance during delivery | 670 | 1838 | 002 |
| 2008 | State | Education level female (none) | Education level female (primary) | TFR | of 15-19 yo who have begun childbearing | Heard of any method | Heard of modern method | Current use of any contraception method (married women) | Have NOT heard FP message on radio or TV | No Antenatal Care provider | Health facility delivery | No assistance during delivery | Knoweldge of AIDS (women) | who participate in their own health care decisions | men who agree that a husband is justified in hitting his wife | State wtraditional law | |||||||||||||||||
| North Central | FCT - Abuja | 145 | 95 | 45 | 92 | 927 | 92 | 252 | 387 | 59 | 691 | 4 | 904 | 559 | 18 | 0 | |||||||||||||||||
| North Central | Benue | 257 | 94 | 52 | 225 | 964 | 96 | 165 | 745 | 396 | 509 | 6 | 997 | 285 | 57 | 0 | |||||||||||||||||
| North Central | Kogi | 257 | 118 | 42 | 178 | 775 | 77 | 105 | 606 | 54 | 789 | 04 | 88 | 617 | 187 | 0 | |||||||||||||||||
| North Central | Kwara | 266 | 123 | 51 | 59 | 947 | 946 | 402 | 205 | 49 | 767 | 1 | 925 | 803 | 62 | 0 | |||||||||||||||||
| North Central | Nasarawa | 413 | 94 | 54 | 154 | 844 | 836 | 181 | 79 | 305 | 401 | 129 | 825 | 507 | 454 | 0 | |||||||||||||||||
| North Central | Plateau | 356 | 102 | 54 | 131 | 824 | 82 | 152 | 826 | 339 | 358 | 135 | 806 | 637 | 317 | 0 | |||||||||||||||||
| North East | Adamawa | 355 | 87 | 58 | 287 | 837 | 837 | 44 | 663 | 134 | 334 | 67 | 897 | 349 | 28 | 0 | |||||||||||||||||
| North East | Taraba | 432 | 96 | 6 | 264 | 869 | 867 | 8 | 909 | 373 | 234 | 91 | 956 | 568 | 226 | 0 | |||||||||||||||||
| South East | Abia | 172 | 138 | 42 | 66 | 954 | 945 | 334 | 522 | 47 | 728 | 03 | 986 | 593 | 354 | 0 | |||||||||||||||||
| South East | Anambra | 101 | 122 | 42 | 27 | 971 | 966 | 35 | 716 | 43 | 846 | 0 | 996 | 759 | 211 | 0 | |||||||||||||||||
| South East | Ebonyi | 278 | 128 | 53 | 96 | 891 | 888 | 157 | 488 | 71 | 596 | 5 | 983 | 421 | 227 | 0 | |||||||||||||||||
| South East | Enugu | 231 | 145 | 48 | 94 | 994 | 992 | 314 | 581 | 32 | 855 | 05 | 995 | 637 | 265 | 0 | |||||||||||||||||
| South East | Imo | 134 | 123 | 48 | 114 | 997 | 989 | 341 | 487 | 09 | 909 | 05 | 989 | 766 | 273 | 0 | |||||||||||||||||
| South South | Akawa Ibom | 129 | 156 | 39 | 179 | 982 | 98 | 255 | 459 | 225 | 432 | 06 | 959 | 459 | 265 | 0 | |||||||||||||||||
| South South | Bayelsa | 104 | 139 | 45 | 167 | 996 | 996 | 133 | 42 | 517 | 284 | 01 | 90 | 316 | 251 | 0 | |||||||||||||||||
| South South | Cross River | 18 | 139 | 54 | 184 | 96 | 958 | 24 | 415 | 138 | 404 | 22 | 965 | 60 | 37 | 0 | |||||||||||||||||
| South South | Delta | 143 | 138 | 41 | 83 | 948 | 944 | 287 | 673 | 179 | 576 | 54 | 924 | 711 | 281 | 0 | |||||||||||||||||
| South South | Edo | 121 | 131 | 44 | 39 | 985 | 985 | 303 | 422 | 144 | 747 | 16 | 961 | 715 | 351 | 0 | |||||||||||||||||
| South South | Rivers | 10 | 137 | 38 | 139 | 998 | 996 | 345 | 71 | 20 | 49 | 03 | 936 | 779 | 161 | 0 | |||||||||||||||||
| South West | Ekiti | 152 | 115 | 43 | 53 | 989 | 989 | 345 | 26 | 23 | 863 | 05 | 994 | 72 | 34 | 0 | |||||||||||||||||
| South West | Lagos | 9 | 107 | 41 | 48 | 999 | 999 | 483 | 253 | 12 | 772 | 08 | 981 | 788 | 149 | 0 | |||||||||||||||||
| South West | Ogun | 241 | 212 | 54 | 10 | 991 | 991 | 26 | 354 | 23 | 747 | 02 | 971 | 79 | 234 | 0 | |||||||||||||||||
| South West | Ondo | 141 | 131 | 52 | 135 | 928 | 913 | 311 | 454 | 146 | 562 | 33 | 881 | 641 | 218 | 0 | |||||||||||||||||
| South West | Osun | 163 | 97 | 41 | 11 | 995 | 995 | 383 | 227 | 15 | 891 | 02 | 997 | 53 | 74 | 0 | |||||||||||||||||
| South West | Oyo | 249 | 119 | 45 | 124 | 909 | 889 | 374 | 247 | 106 | 747 | 23 | 846 | 734 | 123 | 0 | |||||||||||||||||
| North Central | Niger | 616 | 6 | 61 | 273 | 555 | 546 | 66 | 844 | 282 | 253 | 58 | 64 | 187 | 196 | 1 | |||||||||||||||||
| North East | bauchi | 623 | 73 | 81 | 481 | 668 | 666 | 22 | 768 | 332 | 169 | 212 | 872 | 29 | 416 | 1 | |||||||||||||||||
| North East | Borno | 69 | 47 | 47 | 288 | 643 | 575 | 18 | 802 | 587 | 17 | 24 | 804 | 25 | 401 | 1 | |||||||||||||||||
| North East | Gombe | 616 | 49 | 7 | 364 | 64 | 618 | 4 | 844 | 225 | 276 | 152 | 794 | 56 | 337 | 1 | |||||||||||||||||
| North East | Yobe | 853 | 12 | 66 | 251 | 805 | 742 | 11 | 873 | 656 | 76 | 02 | 971 | 7 | 345 | 1 | |||||||||||||||||
| North West | Jigawa | 713 | 64 | 76 | 517 | 751 | 709 | 09 | 859 | 472 | 67 | 231 | 935 | 133 | 202 | 1 | |||||||||||||||||
| North West | Kaduna | 403 | 92 | 41 | 332 | 982 | 937 | 202 | 589 | 442 | 324 | 156 | 958 | 541 | 151 | 1 | |||||||||||||||||
| North West | Kano | 542 | 83 | 68 | 232 | 82 | 798 | 06 | 627 | 354 | 129 | 39 | 997 | 14 | 11 | 1 | |||||||||||||||||
| North West | Katsina | 677 | 73 | 74 | 533 | 898 | 89 | 13 | 626 | 658 | 9 | 25 | 997 | 337 | 288 | 1 | |||||||||||||||||
| North West | Kebbi | 758 | 43 | 67 | 344 | 51 | 47 | 13 | 944 | 712 | 85 | 279 | 759 | 27 | 495 | 1 | |||||||||||||||||
| North West | Sokoto | 785 | 31 | 7 | 36 | 753 | 749 | 11 | 971 | 797 | 47 | 01 | 991 | 09 | 332 | 1 | |||||||||||||||||
| North West | Zamfara | 773 | 37 | 84 | 432 | 841 | 809 | 3 | 831 | 736 | 5 | 451 | 969 | 39 | 447 | 1 | |||||||||||||||||
| 0 | 00000000031 | 00000001254 | 00000000003 | 00000003864 | 0000000045 | 00000000536 | 00000378873 | 00000000471 | 0000000004 | 0000011062 | 00509577936 | 00000000007 | 01036675858 | ||||||||||||||||||||
| 4744 | 12196 | 93896 | 93484 | 26384 | 51276 | 14556 | 62128 | 3096 | 93816 | 61136 | 24468 | ||||||||||||||||||||||
| 67083333333 | 36725 | 738833333333 | 709083333333 | 3675 | 798166666667 | 521083333333 | 144666666667 | 183833333333 | 890583333333 | 16275 | 30175 | ||||||||||||||||||||||
| States wo (n=25) | States w (n=12) | Sig (2-tailed) | |||||||||||||||||||||||||||||||
| Determinants of Health | |||||||||||||||||||||||||||||||||
| Median age at first birth women aged 25-49 | 217 | 184 | |||||||||||||||||||||||||||||||
| Education level (none) | 208 | 671 | lt00001 | ||||||||||||||||||||||||||||||
| who participate in their own health care decisions | 611 | 163 | lt00001 | ||||||||||||||||||||||||||||||
| Fertility | |||||||||||||||||||||||||||||||||
| Total Fertility Rate | 474 | 671 | lt00001 | ||||||||||||||||||||||||||||||
| of 15-19 yo who have begun childbearing | 122 | 367 | lt00001 | ||||||||||||||||||||||||||||||
| Family PlanningSRH | |||||||||||||||||||||||||||||||||
| Heard of any contraception method | 939 | 739 | lt00001 | ||||||||||||||||||||||||||||||
| Current use of any contraception method (married women) | 264 | 37 | lt00001 | ||||||||||||||||||||||||||||||
| Have NOT heard FP message on radio or TV | 513 | 798 | lt00001 | ||||||||||||||||||||||||||||||
| Knoweldge of HIVAIDS | 938 | 891 | 0102 | ||||||||||||||||||||||||||||||
| Maternal Health | |||||||||||||||||||||||||||||||||
| No Antenatal Care provider | 146 | 521 | lt00001 | ||||||||||||||||||||||||||||||
| Health facility delivery | 621 | 145 | lt00001 | ||||||||||||||||||||||||||||||
| No assistance during delivery | 31 | 184 | lt00001 |
| 2008 | State | Education level female (none) | Education level female (primary) | TFR | Median age at first birth women aged 25-49 | of 15-19 yo who have begun childbearing | Heard of any method | Heard of modern method | Current use of any contraception method (married women) | Have NOT heard FP message on radio or TV | Partner knows about contraception use | No Antenatal Care provider | Health facility delivery | No assistance during delivery | Knoweldge of AIDS (women) | who participate in their own health care decisions | men who agree that a husband is justified in hitting his wife | men agree that thre is no reason for wife to deny sex | men believe they have the right to use force to have sex with wife | State wtraditional law | |||||||||||||||||||||
| North Central | FCT - Abuja | 177 | 10 | 4 | 228 | 66 | 887 | 885 | 28 | 662 | 861 | 89 | 542 | 4 | 883 | 493 | 42 | 18 | 21 | 0 | |||||||||||||||||||||
| North Central | Benue | 343 | 123 | 59 | 187 | 227 | 918 | 913 | 142 | 787 | 899 | 305 | 509 | 22 | 978 | 521 | 48 | 17 | 45 | 0 | |||||||||||||||||||||
| North Central | Kogi | 296 | 134 | 42 | 204 | 152 | 813 | 79 | 97 | 682 | 764 | 142 | 773 | 55 | 882 | 767 | 186 | 146 | 38 | 0 | |||||||||||||||||||||
| North Central | Kwara | 443 | 88 | 45 | 202 | 295 | 616 | 576 | 246 | 76 | 855 | 339 | 488 | 269 | 581 | 355 | 92 | 103 | 12 | 0 | |||||||||||||||||||||
| North Central | Nasarawa | 304 | 94 | 47 | 20 | 197 | 475 | 469 | 12 | 804 | 752 | 232 | 329 | 89 | 718 | 68 | 712 | 05 | 198 | 0 | |||||||||||||||||||||
| North Central | Plateau | 307 | 158 | 53 | 203 | 148 | 71 | 708 | 111 | 861 | 697 | 157 | 302 | 41 | 818 | 62 | 365 | 05 | 64 | 0 | |||||||||||||||||||||
| North East | Adamawa | 498 | 75 | 68 | 192 | 243 | 611 | 602 | 28 | 724 | 571 | 378 | 107 | 183 | 857 | 428 | 464 | 07 | 117 | 0 | |||||||||||||||||||||
| North East | Taraba | 489 | 68 | 59 | 194 | 215 | 794 | 792 | 5 | 899 | 796 | 463 | 211 | 111 | 923 | 344 | 291 | 26 | 8 | 0 | |||||||||||||||||||||
| South East | Abia | 16 | 138 | 44 | 244 | 134 | 963 | 96 | 239 | 342 | 911 | 83 | 744 | 22 | 989 | 515 | 387 | 18 | 57 | 0 | |||||||||||||||||||||
| South East | Anambra | 135 | 128 | 5 | 244 | 62 | 892 | 865 | 344 | 447 | 934 | 08 | 878 | 0 | 995 | 61 | 125 | 11 | 28 | 0 | |||||||||||||||||||||
| South East | Ebonyi | 345 | 137 | 56 | 21 | 82 | 607 | 599 | 61 | 642 | 849 | 201 | 407 | 144 | 916 | 493 | 642 | 49 | 14 | 0 | |||||||||||||||||||||
| South East | Enugu | 308 | 148 | 44 | 23 | 58 | 797 | 788 | 211 | 497 | 806 | 108 | 536 | 12 | 937 | 582 | 692 | 37 | 74 | 0 | |||||||||||||||||||||
| South East | Imo | 156 | 139 | 48 | 243 | 79 | 929 | 923 | 227 | 262 | 935 | 25 | 943 | 05 | 99 | 661 | 296 | 47 | 14 | 0 | |||||||||||||||||||||
| South South | Akawa Ibom | 122 | 193 | 4 | 22 | 151 | 966 | 947 | 327 | 338 | 826 | 126 | 369 | 06 | 983 | 636 | 288 | 43 | 45 | 0 | |||||||||||||||||||||
| South South | Bayelsa | 178 | 127 | 58 | 191 | 211 | 89 | 884 | 101 | 492 | 809 | 355 | 184 | 0 | 904 | 509 | 252 | 26 | 43 | 0 | |||||||||||||||||||||
| South South | Cross River | 183 | 155 | 54 | 198 | 181 | 779 | 77 | 203 | 506 | 827 | 159 | 385 | 36 | 952 | 679 | 538 | 17 | 54 | 0 | |||||||||||||||||||||
| South South | Delta | 144 | 171 | 45 | 218 | 82 | 859 | 818 | 266 | 718 | 858 | 19 | 572 | 33 | 896 | 781 | 405 | 0 | 23 | 0 | |||||||||||||||||||||
| South South | Edo | 159 | 161 | 53 | 218 | 29 | 876 | 872 | 316 | 395 | 792 | 54 | 762 | 23 | 851 | 67 | 321 | 08 | 19 | 0 | |||||||||||||||||||||
| South South | Rivers | 14 | 128 | 43 | 217 | 99 | 972 | 959 | 272 | 446 | 885 | 266 | 479 | 57 | 921 | 532 | 259 | 64 | 23 | 0 | |||||||||||||||||||||
| South West | Ekiti | 187 | 114 | 5 | 227 | 79 | 949 | 949 | 173 | 384 | 819 | 3 | 752 | 34 | 957 | 762 | 158 | 42 | 14 | 0 | |||||||||||||||||||||
| South West | Lagos | 97 | 111 | 4 | 243 | 53 | 988 | 979 | 496 | 176 | 877 | 18 | 769 | 2 | 98 | 689 | 214 | 76 | 05 | 0 | |||||||||||||||||||||
| South West | Ogun | 318 | 179 | 54 | 218 | 12 | 886 | 884 | 139 | 29 | 919 | 54 | 638 | 04 | 852 | 657 | 30 | 27 | 18 | 0 | |||||||||||||||||||||
| South West | Ondo | 236 | 112 | 49 | 221 | 77 | 924 | 912 | 212 | 345 | 837 | 147 | 469 | 6 | 842 | 744 | 94 | 5 | 29 | 0 | |||||||||||||||||||||
| South West | Osun | 33 | 159 | 4 | 224 | 5 | 966 | 961 | 38 | 183 | 873 | 06 | 851 | 18 | 953 | 653 | 325 | 07 | 1 | 0 | |||||||||||||||||||||
| South West | Oyo | 224 | 146 | 5 | 216 | 197 | 937 | 933 | 219 | 338 | 857 | 105 | 671 | 62 | 933 | 677 | 31 | 38 | 1 | 0 | |||||||||||||||||||||
| North Central | Niger | 683 | 44 | 75 | 193 | 414 | 263 | 259 | 46 | 796 | -633 | 392 | 159 | 186 | 414 | 43 | 309 | 35 | 55 | 1 | |||||||||||||||||||||
| North East | bauchi | 722 | 66 | 81 | 175 | 51 | 70 | 672 | 27 | 811 | 758 | 491 | 13 | 343 | 891 | 165 | 32 | 18 | 178 | 1 | |||||||||||||||||||||
| North East | Borno | 798 | 46 | 71 | 179 | 48 | 547 | 54 | 65 | 864 | 837 | 648 | 118 | 8 | 838 | 273 | 623 | 83 | 348 | 1 | |||||||||||||||||||||
| North East | Gombe | 546 | 61 | 74 | 184 | 465 | 487 | 484 | 56 | 757 | 672 | 405 | 172 | 133 | 732 | 441 | 401 | 02 | 75 | 1 | |||||||||||||||||||||
| North East | Yobe | 77 | 36 | 75 | 177 | 417 | 312 | 285 | 19 | 821 | 699 | 625 | 61 | 173 | 521 | 57 | 546 | 11 | 507 | 1 | |||||||||||||||||||||
| North West | Jigawa | 76 | 73 | 71 | 186 | 45 | 431 | 423 | 02 | 819 | 50 | 787 | 45 | 294 | 968 | 137 | 143 | 104 | 33 | 1 | |||||||||||||||||||||
| North West | Kaduna | 419 | 92 | 63 | 19 | 316 | 839 | 829 | 96 | 747 | 634 | 362 | 184 | 64 | 97 | 481 | 151 | 67 | 33 | 1 | |||||||||||||||||||||
| North West | Kano | 595 | 104 | 81 | 179 | 422 | 47 | 466 | 23 | 617 | 68 | 487 | 111 | 579 | 942 | 62 | 57 | 13 | 27 | 1 | |||||||||||||||||||||
| North West | Katsina | 76 | 51 | 72 | 179 | 65 | 257 | 239 | 08 | 53 | 444 | 828 | 42 | 595 | 839 | 238 | 184 | 68 | 115 | 1 | |||||||||||||||||||||
| North West | Kebbi | 778 | 36 | 6 | 185 | 389 | 18 | 135 | 19 | 773 | 529 | 847 | 48 | 53 | 766 | 133 | 808 | 159 | 68 | 1 | |||||||||||||||||||||
| North West | Sokoto | 835 | 34 | 87 | 179 | 467 | 468 | 445 | 21 | 738 | 556 | 853 | 44 | 252 | 784 | 46 | 448 | 25 | 93 | 1 | |||||||||||||||||||||
| North West | Zamfara | 841 | 18 | 75 | 185 | 47 | 475 | 40 | 25 | 819 | 613 | 855 | 65 | 606 | 696 | 264 | 197 | 225 | 62 | 1 | |||||||||||||||||||||
| 0 | 00000000073 | 0 | 00000001142 | 0 | 00000000141 | 0000000012 | 00000029067 | 00004726093 | 00001914403 | 00000000001 | 00000000504 | 00000004739 | 00046873618 | 0000000001 | 03898156073 | 00307981969 | 00034416604 |
| Nigeria | |||
| Marriage amp Sexual Activity | |||
| Law criminalizing child marriage | |||
| Legal Age of Marriage | 9-18 Depends on state and religion | ||
| Age of capacity to consent to sex | Puberty-18 Depends on state and religion | ||
| Access to SRH services | |||
| Age of consent to aceess contraceptives | No information available | ||
| Is spousal consent required to access any SRH services | Not legally but many providers require it | ||
| Abortion legal | Illegal except to save womans life | ||
| Gender-based violence (GBV) | |||
| Is there a law on GBV | Yes Depends on state | ||
| Is marital rape criminalized | No | ||
| Legal Framework | |||
| Is there implementing legislation for international law | Yes | ||
| UN Conventions Ratified | CEDAWCEDAW Optional Protocol | ||
| CRCCRC Optional Protocols | |||
| Customary amp religious law | Yes |
| 1990 | 1999 | 2003 | 2008 | 2013 | ||||||||||||||||||||||||||||||||||||
| Demographics | ||||||||||||||||||||||||||||||||||||||||
| Taken from 1980 NDSS amp NFS census 1991 census 2006 | Population | 847 | 889 | 1404 | ||||||||||||||||||||||||||||||||||||
| Percet urban | 23 | 363 | ||||||||||||||||||||||||||||||||||||||
| Total fertility rate (per 1000) | 63 | 59 | 57 | |||||||||||||||||||||||||||||||||||||
| Infant Mortality Rate (per 1000) | 85 | 93 | 100 | |||||||||||||||||||||||||||||||||||||
| Life expectancy at birth | 48 | 532 | Any education | 1990 | 1999 | 2003 | 2008 | 2013 | ||||||||||||||||||||||||||||||||
| Education level of female hh (none) | Northeast | 82 | 64 | 68 | 655 | 611 | Northeast | 18 | 36 | 32 | 345 | 389 | ||||||||||||||||||||||||||||
| Northwest | 862 | 646 | 722 | 675 | 628 | Northwest | 138 | 354 | 278 | 325 | 372 | |||||||||||||||||||||||||||||
| Southeast | 431 | 188 | 178 | 208 | 187 | Southeast | 569 | 812 | 822 | 792 | 813 | |||||||||||||||||||||||||||||
| Southwest | 297 | 228 | 233 | 215 | 171 | Southwest | 703 | 772 | 767 | 785 | 829 | |||||||||||||||||||||||||||||
| Southsouth | 206 | 149 | 13 | Southsouth | 794 | 851 | 87 | |||||||||||||||||||||||||||||||||
| Northcentral | 41 | 409 | 393 | 38 | Northcentral | 59 | 591 | 607 | 62 | |||||||||||||||||||||||||||||||
| Education level of female hh (primary) | Northeast | 48 | 144 | 171 | 159 | 167 | ||||||||||||||||||||||||||||||||||
| Northwest | 66 | 115 | 136 | 131 | 158 | |||||||||||||||||||||||||||||||||||
| Southeast | 246 | 445 | 251 | 232 | 22 | |||||||||||||||||||||||||||||||||||
| Southwest | 275 | 366 | 199 | 192 | 195 | |||||||||||||||||||||||||||||||||||
| Southsouth | na | na | 275 | 22 | 224 | |||||||||||||||||||||||||||||||||||
| Northcentral | na | 315 | 272 | 238 | 233 | |||||||||||||||||||||||||||||||||||
| Female by age amp education (none) | 5-9 | 544 | 328 | 459 | 439 | 434 | ||||||||||||||||||||||||||||||||||
| 10-14 | 341 | 20 | 268 | 258 | 259 | |||||||||||||||||||||||||||||||||||
| 15-19 | 336 | 221 | 302 | 241 | 271 | |||||||||||||||||||||||||||||||||||
| 20-24 | 42 | 289 | 339 | 298 | 332 | |||||||||||||||||||||||||||||||||||
| 25-29 | 542 | 319 | 397 | 331 | 376 | |||||||||||||||||||||||||||||||||||
| 30-34 | 711 | 395 | 475 | 373 | 38 | |||||||||||||||||||||||||||||||||||
| 35-39 | 704 | 446 | 498 | 372 | 407 | |||||||||||||||||||||||||||||||||||
| 40-44 | 789 | 562 | 604 | 46 | 427 | |||||||||||||||||||||||||||||||||||
| 45-49 | 847 | 58 | 68 | 549 | 51 | |||||||||||||||||||||||||||||||||||
| 50-54 | 909 | 63 | 763 | 621 | 567 | |||||||||||||||||||||||||||||||||||
| 55-59 | 958 | 728 | 809 | 641 | 644 | |||||||||||||||||||||||||||||||||||
| 60-64 | 963 | 766 | 855 | 695 | 696 | |||||||||||||||||||||||||||||||||||
| 65+ | 952 | 836 | 887 | 779 | 782 | |||||||||||||||||||||||||||||||||||
| Female by Residence amp Education (none) | Urban | 363 | 254 | 319 | 22 | 215 | ||||||||||||||||||||||||||||||||||
| Rural | 652 | 433 | 534 | 489 | 535 | |||||||||||||||||||||||||||||||||||
| Fertility | ||||||||||||||||||||||||||||||||||||||||
| TRF | Northeast | 6532 | 679 | 7 | 72 | 63 | ||||||||||||||||||||||||||||||||||
| Northwest | 6645 | 645 | 67 | 73 | 67 | |||||||||||||||||||||||||||||||||||
| Southeast | 5573 | 464 | 41 | 48 | 47 | |||||||||||||||||||||||||||||||||||
| Southwest | 5461 | 45 | 41 | 45 | 46 | |||||||||||||||||||||||||||||||||||
| Southsouth | 46 | 47 | 43 | |||||||||||||||||||||||||||||||||||||
| Northcentral | 71 | 449 | 57 | 54 | 53 | |||||||||||||||||||||||||||||||||||
| TFR Urban | 503 | 45 | 49 | 47 | 47 | |||||||||||||||||||||||||||||||||||
| TFR Rural | 633 | 544 | 61 | 63 | 62 | |||||||||||||||||||||||||||||||||||
| Median age at first birth by region and age 25-49 | Northeast | 188 | 182 | 178 | 182 | 188 | ||||||||||||||||||||||||||||||||||
| Northwest | 195 | 186 | 178 | 183 | 179 | |||||||||||||||||||||||||||||||||||
| Southeast | 196 | 21 | 227 | 236 | 237 | |||||||||||||||||||||||||||||||||||
| Southwest | 205 | 211 | 221 | 227 | 227 | |||||||||||||||||||||||||||||||||||
| Southsouth | 198 | 214 | 218 | |||||||||||||||||||||||||||||||||||||
| Northcentral | 198 | 197 | 20 | 206 | ||||||||||||||||||||||||||||||||||||
| Ages 15-19 | started childbearing by 15 | 131 | 108 | 75 | 63 | 51 | ||||||||||||||||||||||||||||||||||
| started childbearing by 16 | 208 | 94 | 139 | 13 | 134 | |||||||||||||||||||||||||||||||||||
| started childbearing by 17 | 302 | 264 | 311 | 242 | 226 | |||||||||||||||||||||||||||||||||||
| started childbearing by 18 | 393 | 305 | 342 | 357 | 372 | |||||||||||||||||||||||||||||||||||
| started childbearing by 19 | 428 | 343 | 395 | 384 | 413 | |||||||||||||||||||||||||||||||||||
| started childbearing Northeast | 502 | 513 | 445 | 393 | 321 | |||||||||||||||||||||||||||||||||||
| started childbearing Northwest | 462 | 547 | 452 | 446 | 357 | |||||||||||||||||||||||||||||||||||
| started childbearing Southeast | 167 | 83 | 62 | 81 | 82 | |||||||||||||||||||||||||||||||||||
| started childbearing Southwest | 108 | 79 | 47 | 88 | 82 | |||||||||||||||||||||||||||||||||||
| started childbearing Southsouth | na | na | 143 | 119 | 123 | |||||||||||||||||||||||||||||||||||
| started childbearing Northcentral | na | 176 | 164 | 222 | 188 | |||||||||||||||||||||||||||||||||||
| Fertility Regulation | ||||||||||||||||||||||||||||||||||||||||
| Know modern method | Northeast | 219 | 346 | 608 | 572 | 701 | ||||||||||||||||||||||||||||||||||
| Northwest | 277 | 391 | 718 | 431 | 784 | |||||||||||||||||||||||||||||||||||
| Southeast | 539 | 79 | 845 | 843 | 954 | |||||||||||||||||||||||||||||||||||
| Southwest | 714 | 837 | 965 | 944 | 957 | |||||||||||||||||||||||||||||||||||
| Southsouth | na | na | 933 | 882 | 975 | |||||||||||||||||||||||||||||||||||
| Northcentral | na | 677 | 759 | 632 | 78 | |||||||||||||||||||||||||||||||||||
| Know any method | Northeast | 24 | 354 | 635 | 586 | 732 | ||||||||||||||||||||||||||||||||||
| Northwest | 303 | 422 | 751 | 451 | 811 | |||||||||||||||||||||||||||||||||||
| Southeast | 566 | 816 | 871 | 855 | 959 | |||||||||||||||||||||||||||||||||||
| Southwest | 736 | 872 | 97 | 95 | 964 | |||||||||||||||||||||||||||||||||||
| Southsouth | 942 | 899 | 977 | |||||||||||||||||||||||||||||||||||||
| Northcentral | 70 | 774 | 643 | 786 | ||||||||||||||||||||||||||||||||||||
| Current use of any contraception method (married women) | Northeast | 2 | 31 | 42 | 4 | 32 | ||||||||||||||||||||||||||||||||||
| Northwest | 12 | 32 | 49 | 28 | 43 | |||||||||||||||||||||||||||||||||||
| Southeast | 88 | 235 | 225 | 234 | 293 | |||||||||||||||||||||||||||||||||||
| Southwest | 15 | 262 | 327 | 317 | 38 | |||||||||||||||||||||||||||||||||||
| Southsouth | 254 | 262 | 281 | |||||||||||||||||||||||||||||||||||||
| Northcentral | 178 | 133 | 13 | 156 | ||||||||||||||||||||||||||||||||||||
| Have NOT heard FP message on radio or TV | Northeast | 847 | 863 | 766 | 814 | 807 | ||||||||||||||||||||||||||||||||||
| Northwest | 801 | 744 | 604 | 693 | 734 | |||||||||||||||||||||||||||||||||||
| Southeast | 795 | 612 | 414 | 422 | 565 | |||||||||||||||||||||||||||||||||||
| Southwest | 545 | 38 | 301 | 257 | 289 | |||||||||||||||||||||||||||||||||||
| Southsouth | na | na | 447 | 486 | 552 | |||||||||||||||||||||||||||||||||||
| Northcentral | na | 66 | 697 | 776 | 69 | |||||||||||||||||||||||||||||||||||
| Both partners approve FP | Northeast | 39 | 157 | 18 | ||||||||||||||||||||||||||||||||||||
| Northwest | 345 | 173 | 174 | |||||||||||||||||||||||||||||||||||||
| Southeast | 438 | 43 | 507 | |||||||||||||||||||||||||||||||||||||
| Southwest | 496 | 516 | 606 | |||||||||||||||||||||||||||||||||||||
| Southsouth | na | na | 474 | |||||||||||||||||||||||||||||||||||||
| Northcentral | na | 45 | 406 | |||||||||||||||||||||||||||||||||||||
| Husban disapproves FP | Northeast | 109 | 52 | 114 | ||||||||||||||||||||||||||||||||||||
| Northwest | 62 | 26 | 75 | |||||||||||||||||||||||||||||||||||||
| Southeast | 124 | 97 | 91 | |||||||||||||||||||||||||||||||||||||
| Southwest | 175 | 74 | 115 | |||||||||||||||||||||||||||||||||||||
| Southsouth | na | na | 178 | |||||||||||||||||||||||||||||||||||||
| Northcentral | na | 69 | 11 | |||||||||||||||||||||||||||||||||||||
| Proximate determinants of fertility | ||||||||||||||||||||||||||||||||||||||||
| Married by age | 15-19 | 34 | 244 | 309 | 278 | 282 | ||||||||||||||||||||||||||||||||||
| 20-24 | 708 | 576 | 592 | 571 | 613 | |||||||||||||||||||||||||||||||||||
| 25-29 | 815 | 78 | 803 | 788 | 798 | |||||||||||||||||||||||||||||||||||
| 30-34 | 849 | 847 | 867 | 885 | 866 | |||||||||||||||||||||||||||||||||||
| 35-39 | 837 | 849 | 913 | 904 | 894 | |||||||||||||||||||||||||||||||||||
| 40-44 | 777 | 827 | 876 | 885 | 878 | |||||||||||||||||||||||||||||||||||
| 45-49 | 787 | 756 | 847 | 856 | 839 | |||||||||||||||||||||||||||||||||||
| Never married by age | 15-19 | 614 | 725 | 667 | 706 | 704 | ||||||||||||||||||||||||||||||||||
| 20-24 | 217 | 365 | 361 | 384 | 331 | |||||||||||||||||||||||||||||||||||
| 25-29 | 79 | 13 | 122 | 162 | 141 | |||||||||||||||||||||||||||||||||||
| 30-34 | 09 | 51 | 51 | 58 | 67 | |||||||||||||||||||||||||||||||||||
| 35-39 | 12 | 19 | 17 | 26 | 27 | |||||||||||||||||||||||||||||||||||
| 40-44 | 03 | 13 | 07 | 14 | 15 | |||||||||||||||||||||||||||||||||||
| 45-49 | 01 | 11 | 09 | 08 | 07 | |||||||||||||||||||||||||||||||||||
| Median age at first marraige by region and age less than 50 of women in this group had births so could not calculate | 20-49 Northeast | 152 | 151 | 153 | 156 | 164 | ||||||||||||||||||||||||||||||||||
| 20-49 Northwest | 154 | 147 | 148 | 153 | 154 | |||||||||||||||||||||||||||||||||||
| 20-49 Southeast | 185 | |||||||||||||||||||||||||||||||||||||||
| 20-49 Southwest | ||||||||||||||||||||||||||||||||||||||||
| 20-49 Southsouth | na | na | ||||||||||||||||||||||||||||||||||||||
| 20-49 Northcentral | na | 182 | 182 | 187 | 191 | |||||||||||||||||||||||||||||||||||
| Northeast | 152 | 15 | 15 | 156 | 163 | |||||||||||||||||||||||||||||||||||
| Northwest | 154 | 146 | 146 | 152 | 153 | |||||||||||||||||||||||||||||||||||
| Southeast | 183 | 202 | 218 | 228 | 227 | |||||||||||||||||||||||||||||||||||
| Southwest | 197 | 202 | 213 | 219 | 218 | |||||||||||||||||||||||||||||||||||
| Southsouth | 192 | 209 | 215 | |||||||||||||||||||||||||||||||||||||
| Northcentral | 179 | 177 | 183 | 189 | ||||||||||||||||||||||||||||||||||||
| Fertility Preferences married women | ||||||||||||||||||||||||||||||||||||||||
| Total unmet need for family planning by age | 15-19 | 16 | 148 | 146 | 19 | 131 | ||||||||||||||||||||||||||||||||||
| 20-24 | 146 | 227 | 164 | 214 | 166 | |||||||||||||||||||||||||||||||||||
| 25-29 | 161 | 17 | 171 | 204 | 168 | |||||||||||||||||||||||||||||||||||
| 30-34 | 181 | 179 | 191 | 201 | 171 | |||||||||||||||||||||||||||||||||||
| 35-39 | 239 | 181 | 181 | 213 | 176 | |||||||||||||||||||||||||||||||||||
| 40-44 | 297 | 154 | 193 | 214 | 168 | |||||||||||||||||||||||||||||||||||
| 45-49 | 434 | 119 | 114 | 162 | 115 | |||||||||||||||||||||||||||||||||||
| Total unmet need for FP by region | Northeast | 209 | 122 | 181 | 176 | 175 | ||||||||||||||||||||||||||||||||||
| Northwest | 142 | 244 | 111 | 208 | 12 | |||||||||||||||||||||||||||||||||||
| Southeast | 263 | 209 | 189 | 181 | 125 | |||||||||||||||||||||||||||||||||||
| Southwest | 23 | 157 | 172 | 197 | 154 | |||||||||||||||||||||||||||||||||||
| Southsouth | 245 | 259 | 222 | |||||||||||||||||||||||||||||||||||||
| Northcentral | 163 | 218 | 187 | 235 | ||||||||||||||||||||||||||||||||||||
| Total demand for FP | Northeast | 229 | 153 | 223 | 216 | 207 | ||||||||||||||||||||||||||||||||||
| Northwest | 154 | 276 | 161 | 235 | 163 | |||||||||||||||||||||||||||||||||||
| Southeast | 353 | 444 | 414 | 415 | 418 | |||||||||||||||||||||||||||||||||||
| Southwest | 38 | 419 | 499 | 513 | 535 | |||||||||||||||||||||||||||||||||||
| Southsouth | 499 | 522 | 502 | |||||||||||||||||||||||||||||||||||||
| Northcentral | 341 | 351 | 317 | 391 | ||||||||||||||||||||||||||||||||||||
| Percentage of demand staisfied | Northeast | 88 | 20 | 19 | 187 | 152 | ||||||||||||||||||||||||||||||||||
| Northwest | 79 | 117 | 308 | 117 | 262 | |||||||||||||||||||||||||||||||||||
| Southeast | 254 | 53 | 543 | 563 | 70 | |||||||||||||||||||||||||||||||||||
| Southwest | 395 | 625 | 656 | 617 | 711 | |||||||||||||||||||||||||||||||||||
| Southsouth | 509 | 503 | 559 | |||||||||||||||||||||||||||||||||||||
| Northcentral | 522 | 379 | 41 | 399 | ||||||||||||||||||||||||||||||||||||
| Infant amp Child Mortality | ||||||||||||||||||||||||||||||||||||||||
| Northeast | Neonatal mortality | 392 | 445 | 61 | 53 | 42 | ||||||||||||||||||||||||||||||||||
| Postneonatal mortality | 485 | 349 | 65 | 56 | 33 | |||||||||||||||||||||||||||||||||||
| Infant mortality | 877 | 794 | 125 | 109 | 77 | |||||||||||||||||||||||||||||||||||
| Child mortality | 1392 | 1041 | 154 | 126 | 90 | |||||||||||||||||||||||||||||||||||
| Under-five mortality | 2146 | 1752 | 260 | 222 | 160 | |||||||||||||||||||||||||||||||||||
| Northwest | Neonatal mortality | 578 | 251 | 55 | 47 | 44 | ||||||||||||||||||||||||||||||||||
| Postneonatal mortality | 52 | 575 | 59 | 44 | 46 | |||||||||||||||||||||||||||||||||||
| Infant mortality | 1098 | 826 | 114 | 91 | 89 | |||||||||||||||||||||||||||||||||||
| Child mortality | 1512 | 1151 | 176 | 139 | 105 | |||||||||||||||||||||||||||||||||||
| Under-five mortality | 2444 | 1882 | 269 | 217 | 185 | |||||||||||||||||||||||||||||||||||
| Southeast | Neonatal mortality | 386 | 373 | 34 | 51 | 37 | ||||||||||||||||||||||||||||||||||
| Postneonatal mortality | 441 | 371 | 32 | 44 | 45 | |||||||||||||||||||||||||||||||||||
| Infant mortality | 827 | 743 | 66 | 95 | 82 | |||||||||||||||||||||||||||||||||||
| Child mortality | 665 | 656 | 40 | 64 | 54 | |||||||||||||||||||||||||||||||||||
| Under-five mortality | 1437 | 135 | 103 | 153 | 131 | |||||||||||||||||||||||||||||||||||
| Southwest | Neonatal mortality | 463 | 426 | 39 | 37 | 39 | ||||||||||||||||||||||||||||||||||
| Postneonatal mortality | 383 | 273 | 30 | 22 | 21 | |||||||||||||||||||||||||||||||||||
| Infant mortality | 846 | 699 | 69 | 59 | 61 | |||||||||||||||||||||||||||||||||||
| Child mortality | 903 | 339 | 47 | 32 | 31 | |||||||||||||||||||||||||||||||||||
| Under-five mortality | 1672 | 1015 | 113 | 89 | 90 | |||||||||||||||||||||||||||||||||||
| Southsouth | Neonatal mortality | 53 | 48 | 32 | ||||||||||||||||||||||||||||||||||||
| Postneonatal mortality | 68 | 37 | 26 | Northeast | Neonatal mortality | 392 | 445 | 61 | 53 | 42 | ||||||||||||||||||||||||||||||
| Infant mortality | 120 | 84 | 58 | Northwest | Neonatal mortality | 578 | 251 | 55 | 47 | 44 | ||||||||||||||||||||||||||||||
| Child mortality | 63 | 58 | 35 | Southeast | Neonatal mortality | 386 | 373 | 34 | 51 | 37 | ||||||||||||||||||||||||||||||
| Under-five mortality | 176 | 138 | 91 | Southwest | Neonatal mortality | 463 | 426 | 39 | 37 | 39 | ||||||||||||||||||||||||||||||
| Northcentral | Neonatal mortality | 238 | 53 | 41 | 35 | Southsouth | Neonatal mortality | 53 | 48 | 32 | ||||||||||||||||||||||||||||||
| Postneonatal mortality | 269 | 49 | 37 | 31 | Northeast | Postneonatal mortality | 485 | 349 | 65 | 56 | 33 | |||||||||||||||||||||||||||||
| Infant mortality | 507 | 103 | 77 | 66 | Northwest | Postneonatal mortality | 52 | 575 | 59 | 44 | 46 | |||||||||||||||||||||||||||||
| Child mortality | 355 | 70 | 62 | 36 | Southwest | Postneonatal mortality | 383 | 273 | 30 | 22 | 21 | |||||||||||||||||||||||||||||
| Under-five mortality | 844 | 165 | 135 | 100 | Southeast | Postneonatal mortality | 441 | 371 | 32 | 44 | 45 | |||||||||||||||||||||||||||||
| Maternal amp Child Health | Southsouth | Postneonatal mortality | 68 | 37 | 26 | |||||||||||||||||||||||||||||||||||
| No antenatal care provider | Northeast | 547 | 541 | 471 | 512 | 408 | Northeast | Infant mortality | 877 | 794 | 125 | 109 | 77 | |||||||||||||||||||||||||||
| Northwest | 524 | 651 | 59 | 671 | 554 | Northwest | Infant mortality | 1098 | 826 | 114 | 91 | 89 | ||||||||||||||||||||||||||||
| Southeast | 196 | 77 | 08 | 74 | 42 | Southeast | Infant mortality | 827 | 743 | 66 | 95 | 82 | ||||||||||||||||||||||||||||
| Southwest | 77 | 35 | 23 | 57 | 57 | Southwest | Infant mortality | 846 | 699 | 69 | 59 | 61 | ||||||||||||||||||||||||||||
| Southsouth | 168 | 188 | 206 | Southsouth | Infant mortality | 120 | 84 | 58 | ||||||||||||||||||||||||||||||||
| Northcentral | 202 | 253 | 262 | 26 | Northeast | Under-five mortality | 2146 | 1752 | 260 | 222 | 160 | |||||||||||||||||||||||||||||
| Health facility delivery | Northeast | 104 | 117 | 171 | 128 | 195 | Northwest | Under-five mortality | 2444 | 1882 | 269 | 217 | 185 | |||||||||||||||||||||||||||
| Northwest | 97 | 64 | 104 | 84 | 115 | Southeast | Under-five mortality | 1437 | 135 | 103 | 153 | 131 | ||||||||||||||||||||||||||||
| Southeast | 463 | 549 | 841 | 739 | 781 | Southwest | Under-five mortality | 1672 | 1015 | 113 | 89 | 90 | ||||||||||||||||||||||||||||
| Southwest | 636 | 672 | 776 | 70 | 75 | Southsouth | Under-five mortality | 176 | 138 | 91 | ||||||||||||||||||||||||||||||
| Southsouth | 532 | 481 | 501 | Northeast | Child mortality | 1392 | 1041 | 154 | 126 | 90 | ||||||||||||||||||||||||||||||
| Northcentral | 443 | 454 | 41 | 457 | Northwest | Child mortality | 1512 | 1151 | 176 | 139 | 105 | |||||||||||||||||||||||||||||
| No assistance during delivery | Northeast | 561 | 232 | 198 | 186 | 97 | Southeast | Child mortality | 665 | 656 | 40 | 64 | 54 | |||||||||||||||||||||||||||
| Northwest | 635 | 255 | 305 | 438 | 278 | Southwest | Child mortality | 903 | 339 | 47 | 32 | 31 | ||||||||||||||||||||||||||||
| Southeast | 159 | 23 | 04 | 3 | 15 | Southsouth | Child mortality | 63 | 58 | 35 | ||||||||||||||||||||||||||||||
| Southwest | 157 | 24 | 09 | 32 | 13 | |||||||||||||||||||||||||||||||||||
| Southsouth | 18 | 31 | 18 | |||||||||||||||||||||||||||||||||||||
| Northcentral | 41 | 9 | 102 | 65 | ||||||||||||||||||||||||||||||||||||
| STDs FGM others | na | yes | yes | yes | yes |
| Current use of any contraception method (married women) | Health facility delivery | rate change contra | rate change facility | No Antenatal Care provider | |||||||||||||||||||||||
| State | 2008 | 2013 | 2008 | 2013 | 2008 | 2013 | rate of change | ||||||||||||||||||||
| North Central | FCT - Abuja | 28 | 252 | 542 | 691 | -28 | 149 | 89 | 59 | -3 | |||||||||||||||||
| North Central | Benue | 142 | 165 | 509 | 509 | 23 | 0 | 305 | 396 | 91 | |||||||||||||||||
| North Central | Kogi | 97 | 105 | 773 | 789 | 08 | 16 | 142 | 54 | -88 | |||||||||||||||||
| North Central | Kwara | 246 | 402 | 488 | 767 | 156 | 279 | 339 | 49 | -29 | |||||||||||||||||
| North Central | Nasarawa | 12 | 181 | 329 | 401 | 61 | 72 | 232 | 305 | 73 | |||||||||||||||||
| North Central | Plateau | 111 | 152 | 302 | 358 | 41 | 56 | 157 | 339 | 182 | |||||||||||||||||
| North East | Adamawa | 28 | 44 | 107 | 334 | 16 | 227 | 378 | 134 | -244 | |||||||||||||||||
| North East | Taraba | 5 | 8 | 211 | 234 | 3 | 23 | 463 | 373 | -9 | |||||||||||||||||
| South East | Abia | 239 | 334 | 744 | 728 | 95 | -16 | 83 | 47 | -36 | |||||||||||||||||
| South East | Anambra | 344 | 35 | 878 | 846 | 06 | -32 | 08 | 43 | 35 | |||||||||||||||||
| South East | Ebonyi | 61 | 157 | 407 | 596 | 96 | 189 | 201 | 71 | -13 | |||||||||||||||||
| South East | Enugu | 211 | 314 | 536 | 855 | 103 | 319 | 108 | 32 | -76 | |||||||||||||||||
| South East | Imo | 227 | 341 | 943 | 909 | 114 | -34 | 25 | 09 | -16 | |||||||||||||||||
| South South | Akawa Ibom | 327 | 255 | 369 | 432 | -72 | 63 | 126 | 225 | 99 | |||||||||||||||||
| South South | Bayelsa | 101 | 133 | 184 | 284 | 32 | 10 | 355 | 517 | 162 | |||||||||||||||||
| South South | Cross River | 203 | 24 | 385 | 404 | 37 | 19 | 159 | 138 | -21 | |||||||||||||||||
| South South | Delta | 266 | 287 | 572 | 576 | 21 | 04 | 19 | 179 | -11 | |||||||||||||||||
| South South | Edo | 316 | 303 | 762 | 747 | -13 | -15 | 54 | 144 | 9 | |||||||||||||||||
| South South | Rivers | 272 | 345 | 479 | 49 | 73 | 11 | 266 | 20 | -66 | |||||||||||||||||
| South West | Ekiti | 173 | 345 | 752 | 863 | 172 | 111 | 3 | 23 | -07 | |||||||||||||||||
| South West | Lagos | 496 | 483 | 769 | 772 | -13 | 03 | 18 | 12 | -06 | |||||||||||||||||
| South West | Ogun | 139 | 26 | 638 | 747 | 121 | 109 | 54 | 23 | -31 | |||||||||||||||||
| South West | Ondo | 212 | 311 | 469 | 562 | 99 | 93 | 147 | 146 | -01 | |||||||||||||||||
| South West | Osun | 38 | 383 | 851 | 891 | 03 | 4 | 06 | 15 | 09 | |||||||||||||||||
| South West | Oyo | 219 | 374 | 671 | 747 | 155 | 76 | 5344 | 7448 | average rate change states without | 105 | 106 | 01 | ||||||||||||||
| North Central | Niger | 46 | 66 | 159 | 253 | 2 | 94 | 392 | 282 | -11 | |||||||||||||||||
| North East | Bauchi | 27 | 22 | 13 | 169 | -05 | 39 | 491 | 332 | -159 | |||||||||||||||||
| North East | Borno | 65 | 18 | 118 | 17 | -47 | 52 | 648 | 587 | -61 | |||||||||||||||||
| North East | Gombe | 56 | 4 | 172 | 276 | -16 | 104 | 405 | 225 | -18 | |||||||||||||||||
| North East | Yobe | 19 | 11 | 61 | 76 | -08 | 15 | 625 | 656 | 31 | |||||||||||||||||
| North West | Jigawa | 02 | 09 | 45 | 67 | 07 | 22 | 787 | 472 | -315 | |||||||||||||||||
| North West | Kaduna | 96 | 202 | 184 | 324 | 106 | 14 | 362 | 442 | 8 | |||||||||||||||||
| North West | Kano | 23 | 06 | 111 | 129 | -17 | 18 | 487 | 354 | -133 | |||||||||||||||||
| North West | Katsina | 08 | 13 | 42 | 9 | 05 | 48 | 828 | 658 | -17 | |||||||||||||||||
| North West | Kebbi | 19 | 13 | 48 | 85 | -06 | 37 | 847 | 712 | -135 | |||||||||||||||||
| North West | Sokoto | 21 | 11 | 44 | 47 | -1 | 03 | 853 | 797 | -56 | |||||||||||||||||
| North West | Zamfara | 25 | 3 | 65 | 5 | 05 | -15 | 02833333333 | 46416666667 | average rate change states with | 855 | 736 | -119 | ||||||||||||||
| 00071049204 | 01702860614 | 00077553648 |
| 2008 | State | Education level female (none) | Education level female (primary) | TFR | Median age at first birth women aged 25-49 | of 15-19 yo who have begun childbearing | Heard of any method | Heard of modern method | Current use of any contraception method (married women) | Have NOT heard FP message on radio or TV | No Antenatal Care provider | Health facility delivery | No assistance during delivery | Knoweldge of AIDS (women) | who participate in their own health care decisions | men who agree that a husband is justified in hitting his wife | State wtraditional law | ||||||||||||||||||
| North Central | FCT - Abuja | 145 | 95 | 45 | 236 | 92 | 927 | 92 | 252 | 387 | 59 | 691 | 4 | 904 | 559 | 18 | 0 | ||||||||||||||||||
| North Central | Benue | 257 | 94 | 52 | 189 | 225 | 964 | 96 | 165 | 745 | 396 | 509 | 6 | 997 | 285 | 57 | 0 | ||||||||||||||||||
| North Central | Kogi | 257 | 118 | 42 | 21 | 178 | 775 | 77 | 105 | 606 | 54 | 789 | 04 | 88 | 617 | 187 | 0 | ||||||||||||||||||
| North Central | Kwara | 266 | 123 | 51 | 221 | 59 | 947 | 946 | 402 | 205 | 49 | 767 | 1 | 925 | 803 | 62 | 0 | ||||||||||||||||||
| North Central | Nasarawa | 413 | 94 | 54 | 206 | 154 | 844 | 836 | 181 | 79 | 305 | 401 | 129 | 825 | 507 | 454 | 0 | ||||||||||||||||||
| North Central | Plateau | 356 | 102 | 54 | 219 | 131 | 824 | 82 | 152 | 826 | 339 | 358 | 135 | 806 | 637 | 317 | 0 | ||||||||||||||||||
| North East | Adamawa | 355 | 87 | 58 | 191 | 287 | 837 | 837 | 44 | 663 | 134 | 334 | 67 | 897 | 349 | 28 | 0 | ||||||||||||||||||
| North East | Taraba | 432 | 96 | 6 | 189 | 264 | 869 | 867 | 8 | 909 | 373 | 234 | 91 | 956 | 568 | 226 | 0 | ||||||||||||||||||
| North Central | Niger | 616 | 6 | 61 | 198 | 273 | 555 | 546 | 66 | 844 | 282 | 253 | 58 | 64 | 187 | 196 | 1 | ||||||||||||||||||
| North East | bauchi | 623 | 73 | 81 | 177 | 481 | 668 | 666 | 22 | 768 | 332 | 169 | 212 | 872 | 29 | 416 | 1 | ||||||||||||||||||
| North East | Borno | 69 | 47 | 47 | 204 | 288 | 643 | 575 | 18 | 802 | 587 | 17 | 24 | 804 | 25 | 401 | 1 | ||||||||||||||||||
| North East | Gombe | 616 | 49 | 7 | 181 | 364 | 64 | 618 | 4 | 844 | 225 | 276 | 152 | 794 | 56 | 337 | 1 | ||||||||||||||||||
| North East | Yobe | 853 | 12 | 66 | 189 | 251 | 805 | 742 | 11 | 873 | 656 | 76 | 02 | 971 | 7 | 345 | 1 | ||||||||||||||||||
| North West | Jigawa | 713 | 64 | 76 | 177 | 517 | 751 | 709 | 09 | 859 | 472 | 67 | 231 | 935 | 133 | 202 | 1 | ||||||||||||||||||
| North West | Kaduna | 403 | 92 | 41 | 194 | 332 | 982 | 937 | 202 | 589 | 442 | 324 | 156 | 958 | 541 | 151 | 1 | ||||||||||||||||||
| North West | Kano | 542 | 83 | 68 | 182 | 232 | 82 | 798 | 06 | 627 | 354 | 129 | 39 | 997 | 14 | 11 | 1 | ||||||||||||||||||
| North West | Katsina | 677 | 73 | 74 | 173 | 533 | 898 | 89 | 13 | 626 | 658 | 9 | 25 | 997 | 337 | 288 | 1 | ||||||||||||||||||
| North West | Kebbi | 758 | 43 | 67 | 179 | 344 | 51 | 47 | 13 | 944 | 712 | 85 | 279 | 759 | 27 | 495 | 1 | ||||||||||||||||||
| North West | Sokoto | 785 | 31 | 7 | 174 | 36 | 753 | 749 | 11 | 971 | 797 | 47 | 01 | 991 | 09 | 332 | 1 | ||||||||||||||||||
| North West | Zamfara | 773 | 37 | 84 | 176 | 432 | 841 | 809 | 3 | 831 | 736 | 5 | 451 | 969 | 39 | 447 | 1 | ||||||||||||||||||
| 00000007362 | 00000392724 | 00028858881 | 00005053265 | 00001462922 | 00108017923 | 00039047205 | 00009920058 | 00341461283 | 00007434824 | 00000263782 | 00230582487 | 04294511369 | 00000429505 | 04012033851 | |||||||||||||||||||||
| South East | Abia | 172 | 138 | 42 | 66 | 954 | 945 | 334 | 522 | 47 | 728 | 03 | 986 | 593 | 354 | 0 | |||||||||||||||||||
| South East | Anambra | 101 | 122 | 42 | 248 | 27 | 971 | 966 | 35 | 716 | 43 | 846 | 0 | 996 | 759 | 211 | 0 | ||||||||||||||||||
| South East | Ebonyi | 278 | 128 | 53 | 214 | 96 | 891 | 888 | 157 | 488 | 71 | 596 | 5 | 983 | 421 | 227 | 0 | ||||||||||||||||||
| South East | Enugu | 231 | 145 | 48 | 229 | 94 | 994 | 992 | 314 | 581 | 32 | 855 | 05 | 995 | 637 | 265 | 0 | ||||||||||||||||||
| South East | Imo | 134 | 123 | 48 | 114 | 997 | 989 | 341 | 487 | 09 | 909 | 05 | 989 | 766 | 273 | 0 | |||||||||||||||||||
| South South | Akawa Ibom | 129 | 156 | 39 | 212 | 179 | 982 | 98 | 255 | 459 | 225 | 432 | 06 | 959 | 459 | 265 | 0 | ||||||||||||||||||
| South South | Bayelsa | 104 | 139 | 45 | 192 | 167 | 996 | 996 | 133 | 42 | 517 | 284 | 01 | 90 | 316 | 251 | 0 | ||||||||||||||||||
| South South | Cross River | 18 | 139 | 54 | 21 | 184 | 96 | 958 | 24 | 415 | 138 | 404 | 22 | 965 | 60 | 37 | 0 | ||||||||||||||||||
| South South | Delta | 143 | 138 | 41 | 22 | 83 | 948 | 944 | 287 | 673 | 179 | 576 | 54 | 924 | 711 | 281 | 0 | ||||||||||||||||||
| South South | Edo | 121 | 131 | 44 | 225 | 39 | 985 | 985 | 303 | 422 | 144 | 747 | 16 | 961 | 715 | 351 | 0 | ||||||||||||||||||
| South South | Rivers | 10 | 137 | 38 | 231 | 139 | 998 | 996 | 345 | 71 | 20 | 49 | 03 | 936 | 779 | 161 | 0 | ||||||||||||||||||
| South West | Ekiti | 152 | 115 | 43 | 228 | 53 | 989 | 989 | 345 | 26 | 23 | 863 | 05 | 994 | 72 | 34 | 0 | ||||||||||||||||||
| South West | Lagos | 9 | 107 | 41 | 245 | 48 | 999 | 999 | 483 | 253 | 12 | 772 | 08 | 981 | 788 | 149 | 0 | ||||||||||||||||||
| South West | Ogun | 241 | 212 | 54 | 216 | 10 | 991 | 991 | 26 | 354 | 23 | 747 | 02 | 971 | 79 | 234 | 0 | ||||||||||||||||||
| South West | Ondo | 141 | 131 | 52 | 219 | 135 | 928 | 913 | 311 | 454 | 146 | 562 | 33 | 881 | 641 | 218 | 0 | ||||||||||||||||||
| South West | Osun | 163 | 97 | 41 | 235 | 11 | 995 | 995 | 383 | 227 | 15 | 891 | 02 | 997 | 53 | 74 | 0 | ||||||||||||||||||
| South West | Oyo | 249 | 119 | 45 | 214 | 124 | 909 | 889 | 374 | 247 | 106 | 747 | 23 | 846 | 734 | 123 | 0 |
| 2008 | State | Education level female (none) | Education level female (primary) | TFR | of 15-19 yo who have begun childbearing | Heard of any method | Heard of modern method | Current use of any contraception method (married women) | Have NOT heard FP message on radio or TV | No Antenatal Care provider | Health facility delivery | No assistance during delivery | Knoweldge of AIDS (women) | who participate in their own health care decisions | men who agree that a husband is justified in hitting his wife | State wtraditional law | |||||||||||||||||
| North Central | FCT - Abuja | 145 | 95 | 45 | 92 | 927 | 92 | 252 | 387 | 59 | 691 | 4 | 904 | 559 | 18 | 0 | |||||||||||||||||
| North Central | Benue | 257 | 94 | 52 | 225 | 964 | 96 | 165 | 745 | 396 | 509 | 6 | 997 | 285 | 57 | 0 | |||||||||||||||||
| North Central | Kogi | 257 | 118 | 42 | 178 | 775 | 77 | 105 | 606 | 54 | 789 | 04 | 88 | 617 | 187 | 0 | |||||||||||||||||
| North Central | Kwara | 266 | 123 | 51 | 59 | 947 | 946 | 402 | 205 | 49 | 767 | 1 | 925 | 803 | 62 | 0 | |||||||||||||||||
| North Central | Nasarawa | 413 | 94 | 54 | 154 | 844 | 836 | 181 | 79 | 305 | 401 | 129 | 825 | 507 | 454 | 0 | |||||||||||||||||
| North Central | Plateau | 356 | 102 | 54 | 131 | 824 | 82 | 152 | 826 | 339 | 358 | 135 | 806 | 637 | 317 | 0 | |||||||||||||||||
| North East | Adamawa | 355 | 87 | 58 | 287 | 837 | 837 | 44 | 663 | 134 | 334 | 67 | 897 | 349 | 28 | 0 | |||||||||||||||||
| North East | Taraba | 432 | 96 | 6 | 264 | 869 | 867 | 8 | 909 | 373 | 234 | 91 | 956 | 568 | 226 | 0 | |||||||||||||||||
| South East | Abia | 172 | 138 | 42 | 66 | 954 | 945 | 334 | 522 | 47 | 728 | 03 | 986 | 593 | 354 | 0 | |||||||||||||||||
| South East | Anambra | 101 | 122 | 42 | 27 | 971 | 966 | 35 | 716 | 43 | 846 | 0 | 996 | 759 | 211 | 0 | |||||||||||||||||
| South East | Ebonyi | 278 | 128 | 53 | 96 | 891 | 888 | 157 | 488 | 71 | 596 | 5 | 983 | 421 | 227 | 0 | |||||||||||||||||
| South East | Enugu | 231 | 145 | 48 | 94 | 994 | 992 | 314 | 581 | 32 | 855 | 05 | 995 | 637 | 265 | 0 | |||||||||||||||||
| South East | Imo | 134 | 123 | 48 | 114 | 997 | 989 | 341 | 487 | 09 | 909 | 05 | 989 | 766 | 273 | 0 | |||||||||||||||||
| South South | Akawa Ibom | 129 | 156 | 39 | 179 | 982 | 98 | 255 | 459 | 225 | 432 | 06 | 959 | 459 | 265 | 0 | |||||||||||||||||
| South South | Bayelsa | 104 | 139 | 45 | 167 | 996 | 996 | 133 | 42 | 517 | 284 | 01 | 90 | 316 | 251 | 0 | |||||||||||||||||
| South South | Cross River | 18 | 139 | 54 | 184 | 96 | 958 | 24 | 415 | 138 | 404 | 22 | 965 | 60 | 37 | 0 | |||||||||||||||||
| South South | Delta | 143 | 138 | 41 | 83 | 948 | 944 | 287 | 673 | 179 | 576 | 54 | 924 | 711 | 281 | 0 | |||||||||||||||||
| South South | Edo | 121 | 131 | 44 | 39 | 985 | 985 | 303 | 422 | 144 | 747 | 16 | 961 | 715 | 351 | 0 | |||||||||||||||||
| South South | Rivers | 10 | 137 | 38 | 139 | 998 | 996 | 345 | 71 | 20 | 49 | 03 | 936 | 779 | 161 | 0 | |||||||||||||||||
| South West | Ekiti | 152 | 115 | 43 | 53 | 989 | 989 | 345 | 26 | 23 | 863 | 05 | 994 | 72 | 34 | 0 | |||||||||||||||||
| South West | Lagos | 9 | 107 | 41 | 48 | 999 | 999 | 483 | 253 | 12 | 772 | 08 | 981 | 788 | 149 | 0 | |||||||||||||||||
| South West | Ogun | 241 | 212 | 54 | 10 | 991 | 991 | 26 | 354 | 23 | 747 | 02 | 971 | 79 | 234 | 0 | |||||||||||||||||
| South West | Ondo | 141 | 131 | 52 | 135 | 928 | 913 | 311 | 454 | 146 | 562 | 33 | 881 | 641 | 218 | 0 | |||||||||||||||||
| South West | Osun | 163 | 97 | 41 | 11 | 995 | 995 | 383 | 227 | 15 | 891 | 02 | 997 | 53 | 74 | 0 | |||||||||||||||||
| South West | Oyo | 249 | 119 | 45 | 124 | 909 | 889 | 374 | 247 | 106 | 747 | 23 | 846 | 734 | 123 | 0 | |||||||||||||||||
| North Central | Niger | 616 | 6 | 61 | 273 | 555 | 546 | 66 | 844 | 282 | 253 | 58 | 64 | 187 | 196 | 1 | |||||||||||||||||
| North East | bauchi | 623 | 73 | 81 | 481 | 668 | 666 | 22 | 768 | 332 | 169 | 212 | 872 | 29 | 416 | 1 | |||||||||||||||||
| North East | Borno | 69 | 47 | 47 | 288 | 643 | 575 | 18 | 802 | 587 | 17 | 24 | 804 | 25 | 401 | 1 | |||||||||||||||||
| North East | Gombe | 616 | 49 | 7 | 364 | 64 | 618 | 4 | 844 | 225 | 276 | 152 | 794 | 56 | 337 | 1 | |||||||||||||||||
| North East | Yobe | 853 | 12 | 66 | 251 | 805 | 742 | 11 | 873 | 656 | 76 | 02 | 971 | 7 | 345 | 1 | |||||||||||||||||
| North West | Jigawa | 713 | 64 | 76 | 517 | 751 | 709 | 09 | 859 | 472 | 67 | 231 | 935 | 133 | 202 | 1 | |||||||||||||||||
| North West | Kaduna | 403 | 92 | 41 | 332 | 982 | 937 | 202 | 589 | 442 | 324 | 156 | 958 | 541 | 151 | 1 | |||||||||||||||||
| North West | Kano | 542 | 83 | 68 | 232 | 82 | 798 | 06 | 627 | 354 | 129 | 39 | 997 | 14 | 11 | 1 | |||||||||||||||||
| North West | Katsina | 677 | 73 | 74 | 533 | 898 | 89 | 13 | 626 | 658 | 9 | 25 | 997 | 337 | 288 | 1 | |||||||||||||||||
| North West | Kebbi | 758 | 43 | 67 | 344 | 51 | 47 | 13 | 944 | 712 | 85 | 279 | 759 | 27 | 495 | 1 | |||||||||||||||||
| North West | Sokoto | 785 | 31 | 7 | 36 | 753 | 749 | 11 | 971 | 797 | 47 | 01 | 991 | 09 | 332 | 1 | |||||||||||||||||
| North West | Zamfara | 773 | 37 | 84 | 432 | 841 | 809 | 3 | 831 | 736 | 5 | 451 | 969 | 39 | 447 | 1 | |||||||||||||||||
| 0 | 00000000031 | 00000001254 | 00000000003 | 00000003864 | 0000000045 | 00000000536 | 00000378873 | 00000000471 | 0000000004 | 0000011062 | 00509577936 | 00000000007 | 01036675858 | ||||||||||||||||||||
| 4744 | 12196 | 93896 | 93484 | 26384 | 51276 | 14556 | 62128 | 3096 | 93816 | 61136 | 24468 | ||||||||||||||||||||||
| 67083333333 | 36725 | 738833333333 | 709083333333 | 3675 | 798166666667 | 521083333333 | 144666666667 | 183833333333 | 890583333333 | 16275 | 30175 | ||||||||||||||||||||||
| States wo (n=25) | States w (n=12) | Sig (2-tailed) | |||||||||||||||||||||||||||||||
| Determinants of Health | |||||||||||||||||||||||||||||||||
| Median age at first birth women aged 25-49 | 217 | 184 | |||||||||||||||||||||||||||||||
| Education level (none) | 208 | 671 | lt00001 | ||||||||||||||||||||||||||||||
| who participate in their own health care decisions | 611 | 163 | lt00001 | ||||||||||||||||||||||||||||||
| Fertility | |||||||||||||||||||||||||||||||||
| Total Fertility Rate | 474 | 671 | lt00001 | ||||||||||||||||||||||||||||||
| of 15-19 yo who have begun childbearing | 122 | 367 | lt00001 | ||||||||||||||||||||||||||||||
| Family PlanningSRH | |||||||||||||||||||||||||||||||||
| Heard of any contraception method | 939 | 739 | lt00001 | ||||||||||||||||||||||||||||||
| Current use of any contraception method (married women) | 264 | 37 | lt00001 | ||||||||||||||||||||||||||||||
| Have NOT heard FP message on radio or TV | 513 | 798 | lt00001 | ||||||||||||||||||||||||||||||
| Knoweldge of HIVAIDS | 938 | 891 | 0102 | ||||||||||||||||||||||||||||||
| Maternal Health | |||||||||||||||||||||||||||||||||
| No Antenatal Care provider | 146 | 521 | lt00001 | ||||||||||||||||||||||||||||||
| Health facility delivery | 621 | 145 | lt00001 | ||||||||||||||||||||||||||||||
| No assistance during delivery | 31 | 184 | lt00001 |
| 2008 | State | Education level female (none) | Education level female (primary) | TFR | Median age at first birth women aged 25-49 | of 15-19 yo who have begun childbearing | Heard of any method | Heard of modern method | Current use of any contraception method (married women) | Have NOT heard FP message on radio or TV | Partner knows about contraception use | No Antenatal Care provider | Health facility delivery | No assistance during delivery | Knoweldge of AIDS (women) | who participate in their own health care decisions | men who agree that a husband is justified in hitting his wife | men agree that thre is no reason for wife to deny sex | men believe they have the right to use force to have sex with wife | State wtraditional law | |||||||||||||||||||||
| North Central | FCT - Abuja | 177 | 10 | 4 | 228 | 66 | 887 | 885 | 28 | 662 | 861 | 89 | 542 | 4 | 883 | 493 | 42 | 18 | 21 | 0 | |||||||||||||||||||||
| North Central | Benue | 343 | 123 | 59 | 187 | 227 | 918 | 913 | 142 | 787 | 899 | 305 | 509 | 22 | 978 | 521 | 48 | 17 | 45 | 0 | |||||||||||||||||||||
| North Central | Kogi | 296 | 134 | 42 | 204 | 152 | 813 | 79 | 97 | 682 | 764 | 142 | 773 | 55 | 882 | 767 | 186 | 146 | 38 | 0 | |||||||||||||||||||||
| North Central | Kwara | 443 | 88 | 45 | 202 | 295 | 616 | 576 | 246 | 76 | 855 | 339 | 488 | 269 | 581 | 355 | 92 | 103 | 12 | 0 | |||||||||||||||||||||
| North Central | Nasarawa | 304 | 94 | 47 | 20 | 197 | 475 | 469 | 12 | 804 | 752 | 232 | 329 | 89 | 718 | 68 | 712 | 05 | 198 | 0 | |||||||||||||||||||||
| North Central | Plateau | 307 | 158 | 53 | 203 | 148 | 71 | 708 | 111 | 861 | 697 | 157 | 302 | 41 | 818 | 62 | 365 | 05 | 64 | 0 | |||||||||||||||||||||
| North East | Adamawa | 498 | 75 | 68 | 192 | 243 | 611 | 602 | 28 | 724 | 571 | 378 | 107 | 183 | 857 | 428 | 464 | 07 | 117 | 0 | |||||||||||||||||||||
| North East | Taraba | 489 | 68 | 59 | 194 | 215 | 794 | 792 | 5 | 899 | 796 | 463 | 211 | 111 | 923 | 344 | 291 | 26 | 8 | 0 | |||||||||||||||||||||
| South East | Abia | 16 | 138 | 44 | 244 | 134 | 963 | 96 | 239 | 342 | 911 | 83 | 744 | 22 | 989 | 515 | 387 | 18 | 57 | 0 | |||||||||||||||||||||
| South East | Anambra | 135 | 128 | 5 | 244 | 62 | 892 | 865 | 344 | 447 | 934 | 08 | 878 | 0 | 995 | 61 | 125 | 11 | 28 | 0 | |||||||||||||||||||||
| South East | Ebonyi | 345 | 137 | 56 | 21 | 82 | 607 | 599 | 61 | 642 | 849 | 201 | 407 | 144 | 916 | 493 | 642 | 49 | 14 | 0 | |||||||||||||||||||||
| South East | Enugu | 308 | 148 | 44 | 23 | 58 | 797 | 788 | 211 | 497 | 806 | 108 | 536 | 12 | 937 | 582 | 692 | 37 | 74 | 0 | |||||||||||||||||||||
| South East | Imo | 156 | 139 | 48 | 243 | 79 | 929 | 923 | 227 | 262 | 935 | 25 | 943 | 05 | 99 | 661 | 296 | 47 | 14 | 0 | |||||||||||||||||||||
| South South | Akawa Ibom | 122 | 193 | 4 | 22 | 151 | 966 | 947 | 327 | 338 | 826 | 126 | 369 | 06 | 983 | 636 | 288 | 43 | 45 | 0 | |||||||||||||||||||||
| South South | Bayelsa | 178 | 127 | 58 | 191 | 211 | 89 | 884 | 101 | 492 | 809 | 355 | 184 | 0 | 904 | 509 | 252 | 26 | 43 | 0 | |||||||||||||||||||||
| South South | Cross River | 183 | 155 | 54 | 198 | 181 | 779 | 77 | 203 | 506 | 827 | 159 | 385 | 36 | 952 | 679 | 538 | 17 | 54 | 0 | |||||||||||||||||||||
| South South | Delta | 144 | 171 | 45 | 218 | 82 | 859 | 818 | 266 | 718 | 858 | 19 | 572 | 33 | 896 | 781 | 405 | 0 | 23 | 0 | |||||||||||||||||||||
| South South | Edo | 159 | 161 | 53 | 218 | 29 | 876 | 872 | 316 | 395 | 792 | 54 | 762 | 23 | 851 | 67 | 321 | 08 | 19 | 0 | |||||||||||||||||||||
| South South | Rivers | 14 | 128 | 43 | 217 | 99 | 972 | 959 | 272 | 446 | 885 | 266 | 479 | 57 | 921 | 532 | 259 | 64 | 23 | 0 | |||||||||||||||||||||
| South West | Ekiti | 187 | 114 | 5 | 227 | 79 | 949 | 949 | 173 | 384 | 819 | 3 | 752 | 34 | 957 | 762 | 158 | 42 | 14 | 0 | |||||||||||||||||||||
| South West | Lagos | 97 | 111 | 4 | 243 | 53 | 988 | 979 | 496 | 176 | 877 | 18 | 769 | 2 | 98 | 689 | 214 | 76 | 05 | 0 | |||||||||||||||||||||
| South West | Ogun | 318 | 179 | 54 | 218 | 12 | 886 | 884 | 139 | 29 | 919 | 54 | 638 | 04 | 852 | 657 | 30 | 27 | 18 | 0 | |||||||||||||||||||||
| South West | Ondo | 236 | 112 | 49 | 221 | 77 | 924 | 912 | 212 | 345 | 837 | 147 | 469 | 6 | 842 | 744 | 94 | 5 | 29 | 0 | |||||||||||||||||||||
| South West | Osun | 33 | 159 | 4 | 224 | 5 | 966 | 961 | 38 | 183 | 873 | 06 | 851 | 18 | 953 | 653 | 325 | 07 | 1 | 0 | |||||||||||||||||||||
| South West | Oyo | 224 | 146 | 5 | 216 | 197 | 937 | 933 | 219 | 338 | 857 | 105 | 671 | 62 | 933 | 677 | 31 | 38 | 1 | 0 | |||||||||||||||||||||
| North Central | Niger | 683 | 44 | 75 | 193 | 414 | 263 | 259 | 46 | 796 | -633 | 392 | 159 | 186 | 414 | 43 | 309 | 35 | 55 | 1 | |||||||||||||||||||||
| North East | bauchi | 722 | 66 | 81 | 175 | 51 | 70 | 672 | 27 | 811 | 758 | 491 | 13 | 343 | 891 | 165 | 32 | 18 | 178 | 1 | |||||||||||||||||||||
| North East | Borno | 798 | 46 | 71 | 179 | 48 | 547 | 54 | 65 | 864 | 837 | 648 | 118 | 8 | 838 | 273 | 623 | 83 | 348 | 1 | |||||||||||||||||||||
| North East | Gombe | 546 | 61 | 74 | 184 | 465 | 487 | 484 | 56 | 757 | 672 | 405 | 172 | 133 | 732 | 441 | 401 | 02 | 75 | 1 | |||||||||||||||||||||
| North East | Yobe | 77 | 36 | 75 | 177 | 417 | 312 | 285 | 19 | 821 | 699 | 625 | 61 | 173 | 521 | 57 | 546 | 11 | 507 | 1 | |||||||||||||||||||||
| North West | Jigawa | 76 | 73 | 71 | 186 | 45 | 431 | 423 | 02 | 819 | 50 | 787 | 45 | 294 | 968 | 137 | 143 | 104 | 33 | 1 | |||||||||||||||||||||
| North West | Kaduna | 419 | 92 | 63 | 19 | 316 | 839 | 829 | 96 | 747 | 634 | 362 | 184 | 64 | 97 | 481 | 151 | 67 | 33 | 1 | |||||||||||||||||||||
| North West | Kano | 595 | 104 | 81 | 179 | 422 | 47 | 466 | 23 | 617 | 68 | 487 | 111 | 579 | 942 | 62 | 57 | 13 | 27 | 1 | |||||||||||||||||||||
| North West | Katsina | 76 | 51 | 72 | 179 | 65 | 257 | 239 | 08 | 53 | 444 | 828 | 42 | 595 | 839 | 238 | 184 | 68 | 115 | 1 | |||||||||||||||||||||
| North West | Kebbi | 778 | 36 | 6 | 185 | 389 | 18 | 135 | 19 | 773 | 529 | 847 | 48 | 53 | 766 | 133 | 808 | 159 | 68 | 1 | |||||||||||||||||||||
| North West | Sokoto | 835 | 34 | 87 | 179 | 467 | 468 | 445 | 21 | 738 | 556 | 853 | 44 | 252 | 784 | 46 | 448 | 25 | 93 | 1 | |||||||||||||||||||||
| North West | Zamfara | 841 | 18 | 75 | 185 | 47 | 475 | 40 | 25 | 819 | 613 | 855 | 65 | 606 | 696 | 264 | 197 | 225 | 62 | 1 | |||||||||||||||||||||
| 0 | 00000000073 | 0 | 00000001142 | 0 | 00000000141 | 0000000012 | 00000029067 | 00004726093 | 00001914403 | 00000000001 | 00000000504 | 00000004739 | 00046873618 | 0000000001 | 03898156073 | 00307981969 | 00034416604 |
| Nigeria | |||
| Marriage amp Sexual Activity | |||
| Law criminalizing child marriage | |||
| Legal Age of Marriage | 9-18 Depends on state and religion | ||
| Age of capacity to consent to sex | Puberty-18 Depends on state and religion | ||
| Access to SRH services | |||
| Age of consent to aceess contraceptives | No information available | ||
| Is spousal consent required to access any SRH services | Not legally but many providers require it | ||
| Abortion legal | Illegal except to save womans life | ||
| Gender-based violence (GBV) | |||
| Is there a law on GBV | Yes Depends on state | ||
| Is marital rape criminalized | No | ||
| Legal Framework | |||
| Is there implementing legislation for international law | Yes | ||
| UN Conventions Ratified | CEDAWCEDAW Optional Protocol | ||
| CRCCRC Optional Protocols | |||
| Customary amp religious law | Yes |
| 1990 | 1999 | 2003 | 2008 | 2013 | ||||||||||||||||||||||||||||||||||||
| Demographics | ||||||||||||||||||||||||||||||||||||||||
| Taken from 1980 NDSS amp NFS census 1991 census 2006 | Population | 847 | 889 | 1404 | ||||||||||||||||||||||||||||||||||||
| Percet urban | 23 | 363 | ||||||||||||||||||||||||||||||||||||||
| Total fertility rate (per 1000) | 63 | 59 | 57 | |||||||||||||||||||||||||||||||||||||
| Infant Mortality Rate (per 1000) | 85 | 93 | 100 | |||||||||||||||||||||||||||||||||||||
| Life expectancy at birth | 48 | 532 | Any education | 1990 | 1999 | 2003 | 2008 | 2013 | ||||||||||||||||||||||||||||||||
| Education level of female hh (none) | Northeast | 82 | 64 | 68 | 655 | 611 | Northeast | 18 | 36 | 32 | 345 | 389 | ||||||||||||||||||||||||||||
| Northwest | 862 | 646 | 722 | 675 | 628 | Northwest | 138 | 354 | 278 | 325 | 372 | |||||||||||||||||||||||||||||
| Southeast | 431 | 188 | 178 | 208 | 187 | Southeast | 569 | 812 | 822 | 792 | 813 | |||||||||||||||||||||||||||||
| Southwest | 297 | 228 | 233 | 215 | 171 | Southwest | 703 | 772 | 767 | 785 | 829 | |||||||||||||||||||||||||||||
| Southsouth | 206 | 149 | 13 | Southsouth | 794 | 851 | 87 | |||||||||||||||||||||||||||||||||
| Northcentral | 41 | 409 | 393 | 38 | Northcentral | 59 | 591 | 607 | 62 | |||||||||||||||||||||||||||||||
| Education level of female hh (primary) | Northeast | 48 | 144 | 171 | 159 | 167 | ||||||||||||||||||||||||||||||||||
| Northwest | 66 | 115 | 136 | 131 | 158 | |||||||||||||||||||||||||||||||||||
| Southeast | 246 | 445 | 251 | 232 | 22 | |||||||||||||||||||||||||||||||||||
| Southwest | 275 | 366 | 199 | 192 | 195 | |||||||||||||||||||||||||||||||||||
| Southsouth | na | na | 275 | 22 | 224 | |||||||||||||||||||||||||||||||||||
| Northcentral | na | 315 | 272 | 238 | 233 | |||||||||||||||||||||||||||||||||||
| Female by age amp education (none) | 5-9 | 544 | 328 | 459 | 439 | 434 | ||||||||||||||||||||||||||||||||||
| 10-14 | 341 | 20 | 268 | 258 | 259 | |||||||||||||||||||||||||||||||||||
| 15-19 | 336 | 221 | 302 | 241 | 271 | |||||||||||||||||||||||||||||||||||
| 20-24 | 42 | 289 | 339 | 298 | 332 | |||||||||||||||||||||||||||||||||||
| 25-29 | 542 | 319 | 397 | 331 | 376 | |||||||||||||||||||||||||||||||||||
| 30-34 | 711 | 395 | 475 | 373 | 38 | |||||||||||||||||||||||||||||||||||
| 35-39 | 704 | 446 | 498 | 372 | 407 | |||||||||||||||||||||||||||||||||||
| 40-44 | 789 | 562 | 604 | 46 | 427 | |||||||||||||||||||||||||||||||||||
| 45-49 | 847 | 58 | 68 | 549 | 51 | |||||||||||||||||||||||||||||||||||
| 50-54 | 909 | 63 | 763 | 621 | 567 | |||||||||||||||||||||||||||||||||||
| 55-59 | 958 | 728 | 809 | 641 | 644 | |||||||||||||||||||||||||||||||||||
| 60-64 | 963 | 766 | 855 | 695 | 696 | |||||||||||||||||||||||||||||||||||
| 65+ | 952 | 836 | 887 | 779 | 782 | |||||||||||||||||||||||||||||||||||
| Female by Residence amp Education (none) | Urban | 363 | 254 | 319 | 22 | 215 | ||||||||||||||||||||||||||||||||||
| Rural | 652 | 433 | 534 | 489 | 535 | |||||||||||||||||||||||||||||||||||
| Fertility | ||||||||||||||||||||||||||||||||||||||||
| TRF | Northeast | 6532 | 679 | 7 | 72 | 63 | ||||||||||||||||||||||||||||||||||
| Northwest | 6645 | 645 | 67 | 73 | 67 | |||||||||||||||||||||||||||||||||||
| Southeast | 5573 | 464 | 41 | 48 | 47 | |||||||||||||||||||||||||||||||||||
| Southwest | 5461 | 45 | 41 | 45 | 46 | |||||||||||||||||||||||||||||||||||
| Southsouth | 46 | 47 | 43 | |||||||||||||||||||||||||||||||||||||
| Northcentral | 71 | 449 | 57 | 54 | 53 | |||||||||||||||||||||||||||||||||||
| TFR Urban | 503 | 45 | 49 | 47 | 47 | |||||||||||||||||||||||||||||||||||
| TFR Rural | 633 | 544 | 61 | 63 | 62 | |||||||||||||||||||||||||||||||||||
| Median age at first birth by region and age 25-49 | Northeast | 188 | 182 | 178 | 182 | 188 | ||||||||||||||||||||||||||||||||||
| Northwest | 195 | 186 | 178 | 183 | 179 | |||||||||||||||||||||||||||||||||||
| Southeast | 196 | 21 | 227 | 236 | 237 | |||||||||||||||||||||||||||||||||||
| Southwest | 205 | 211 | 221 | 227 | 227 | |||||||||||||||||||||||||||||||||||
| Southsouth | 198 | 214 | 218 | |||||||||||||||||||||||||||||||||||||
| Northcentral | 198 | 197 | 20 | 206 | ||||||||||||||||||||||||||||||||||||
| Ages 15-19 | started childbearing by 15 | 131 | 108 | 75 | 63 | 51 | ||||||||||||||||||||||||||||||||||
| started childbearing by 16 | 208 | 94 | 139 | 13 | 134 | |||||||||||||||||||||||||||||||||||
| started childbearing by 17 | 302 | 264 | 311 | 242 | 226 | |||||||||||||||||||||||||||||||||||
| started childbearing by 18 | 393 | 305 | 342 | 357 | 372 | |||||||||||||||||||||||||||||||||||
| started childbearing by 19 | 428 | 343 | 395 | 384 | 413 | |||||||||||||||||||||||||||||||||||
| started childbearing Northeast | 502 | 513 | 445 | 393 | 321 | |||||||||||||||||||||||||||||||||||
| started childbearing Northwest | 462 | 547 | 452 | 446 | 357 | |||||||||||||||||||||||||||||||||||
| started childbearing Southeast | 167 | 83 | 62 | 81 | 82 | |||||||||||||||||||||||||||||||||||
| started childbearing Southwest | 108 | 79 | 47 | 88 | 82 | |||||||||||||||||||||||||||||||||||
| started childbearing Southsouth | na | na | 143 | 119 | 123 | |||||||||||||||||||||||||||||||||||
| started childbearing Northcentral | na | 176 | 164 | 222 | 188 | |||||||||||||||||||||||||||||||||||
| Fertility Regulation | ||||||||||||||||||||||||||||||||||||||||
| Know modern method | Northeast | 219 | 346 | 608 | 572 | 701 | ||||||||||||||||||||||||||||||||||
| Northwest | 277 | 391 | 718 | 431 | 784 | |||||||||||||||||||||||||||||||||||
| Southeast | 539 | 79 | 845 | 843 | 954 | |||||||||||||||||||||||||||||||||||
| Southwest | 714 | 837 | 965 | 944 | 957 | |||||||||||||||||||||||||||||||||||
| Southsouth | na | na | 933 | 882 | 975 | |||||||||||||||||||||||||||||||||||
| Northcentral | na | 677 | 759 | 632 | 78 | |||||||||||||||||||||||||||||||||||
| Know any method | Northeast | 24 | 354 | 635 | 586 | 732 | ||||||||||||||||||||||||||||||||||
| Northwest | 303 | 422 | 751 | 451 | 811 | |||||||||||||||||||||||||||||||||||
| Southeast | 566 | 816 | 871 | 855 | 959 | |||||||||||||||||||||||||||||||||||
| Southwest | 736 | 872 | 97 | 95 | 964 | |||||||||||||||||||||||||||||||||||
| Southsouth | 942 | 899 | 977 | |||||||||||||||||||||||||||||||||||||
| Northcentral | 70 | 774 | 643 | 786 | ||||||||||||||||||||||||||||||||||||
| Current use of any contraception method (married women) | Northeast | 2 | 31 | 42 | 4 | 32 | ||||||||||||||||||||||||||||||||||
| Northwest | 12 | 32 | 49 | 28 | 43 | |||||||||||||||||||||||||||||||||||
| Southeast | 88 | 235 | 225 | 234 | 293 | |||||||||||||||||||||||||||||||||||
| Southwest | 15 | 262 | 327 | 317 | 38 | |||||||||||||||||||||||||||||||||||
| Southsouth | 254 | 262 | 281 | |||||||||||||||||||||||||||||||||||||
| Northcentral | 178 | 133 | 13 | 156 | ||||||||||||||||||||||||||||||||||||
| Have NOT heard FP message on radio or TV | Northeast | 847 | 863 | 766 | 814 | 807 | ||||||||||||||||||||||||||||||||||
| Northwest | 801 | 744 | 604 | 693 | 734 | |||||||||||||||||||||||||||||||||||
| Southeast | 795 | 612 | 414 | 422 | 565 | |||||||||||||||||||||||||||||||||||
| Southwest | 545 | 38 | 301 | 257 | 289 | |||||||||||||||||||||||||||||||||||
| Southsouth | na | na | 447 | 486 | 552 | |||||||||||||||||||||||||||||||||||
| Northcentral | na | 66 | 697 | 776 | 69 | |||||||||||||||||||||||||||||||||||
| Both partners approve FP | Northeast | 39 | 157 | 18 | ||||||||||||||||||||||||||||||||||||
| Northwest | 345 | 173 | 174 | |||||||||||||||||||||||||||||||||||||
| Southeast | 438 | 43 | 507 | |||||||||||||||||||||||||||||||||||||
| Southwest | 496 | 516 | 606 | |||||||||||||||||||||||||||||||||||||
| Southsouth | na | na | 474 | |||||||||||||||||||||||||||||||||||||
| Northcentral | na | 45 | 406 | |||||||||||||||||||||||||||||||||||||
| Husban disapproves FP | Northeast | 109 | 52 | 114 | ||||||||||||||||||||||||||||||||||||
| Northwest | 62 | 26 | 75 | |||||||||||||||||||||||||||||||||||||
| Southeast | 124 | 97 | 91 | |||||||||||||||||||||||||||||||||||||
| Southwest | 175 | 74 | 115 | |||||||||||||||||||||||||||||||||||||
| Southsouth | na | na | 178 | |||||||||||||||||||||||||||||||||||||
| Northcentral | na | 69 | 11 | |||||||||||||||||||||||||||||||||||||
| Proximate determinants of fertility | ||||||||||||||||||||||||||||||||||||||||
| Married by age | 15-19 | 34 | 244 | 309 | 278 | 282 | ||||||||||||||||||||||||||||||||||
| 20-24 | 708 | 576 | 592 | 571 | 613 | |||||||||||||||||||||||||||||||||||
| 25-29 | 815 | 78 | 803 | 788 | 798 | |||||||||||||||||||||||||||||||||||
| 30-34 | 849 | 847 | 867 | 885 | 866 | |||||||||||||||||||||||||||||||||||
| 35-39 | 837 | 849 | 913 | 904 | 894 | |||||||||||||||||||||||||||||||||||
| 40-44 | 777 | 827 | 876 | 885 | 878 | |||||||||||||||||||||||||||||||||||
| 45-49 | 787 | 756 | 847 | 856 | 839 | |||||||||||||||||||||||||||||||||||
| Never married by age | 15-19 | 614 | 725 | 667 | 706 | 704 | ||||||||||||||||||||||||||||||||||
| 20-24 | 217 | 365 | 361 | 384 | 331 | |||||||||||||||||||||||||||||||||||
| 25-29 | 79 | 13 | 122 | 162 | 141 | |||||||||||||||||||||||||||||||||||
| 30-34 | 09 | 51 | 51 | 58 | 67 | |||||||||||||||||||||||||||||||||||
| 35-39 | 12 | 19 | 17 | 26 | 27 | |||||||||||||||||||||||||||||||||||
| 40-44 | 03 | 13 | 07 | 14 | 15 | |||||||||||||||||||||||||||||||||||
| 45-49 | 01 | 11 | 09 | 08 | 07 | |||||||||||||||||||||||||||||||||||
| Median age at first marraige by region and age less than 50 of women in this group had births so could not calculate | 20-49 Northeast | 152 | 151 | 153 | 156 | 164 | ||||||||||||||||||||||||||||||||||
| 20-49 Northwest | 154 | 147 | 148 | 153 | 154 | |||||||||||||||||||||||||||||||||||
| 20-49 Southeast | 185 | |||||||||||||||||||||||||||||||||||||||
| 20-49 Southwest | ||||||||||||||||||||||||||||||||||||||||
| 20-49 Southsouth | na | na | ||||||||||||||||||||||||||||||||||||||
| 20-49 Northcentral | na | 182 | 182 | 187 | 191 | |||||||||||||||||||||||||||||||||||
| Northeast | 152 | 15 | 15 | 156 | 163 | |||||||||||||||||||||||||||||||||||
| Northwest | 154 | 146 | 146 | 152 | 153 | |||||||||||||||||||||||||||||||||||
| Southeast | 183 | 202 | 218 | 228 | 227 | |||||||||||||||||||||||||||||||||||
| Southwest | 197 | 202 | 213 | 219 | 218 | |||||||||||||||||||||||||||||||||||
| Southsouth | 192 | 209 | 215 | |||||||||||||||||||||||||||||||||||||
| Northcentral | 179 | 177 | 183 | 189 | ||||||||||||||||||||||||||||||||||||
| Fertility Preferences married women | ||||||||||||||||||||||||||||||||||||||||
| Total unmet need for family planning by age | 15-19 | 16 | 148 | 146 | 19 | 131 | ||||||||||||||||||||||||||||||||||
| 20-24 | 146 | 227 | 164 | 214 | 166 | |||||||||||||||||||||||||||||||||||
| 25-29 | 161 | 17 | 171 | 204 | 168 | |||||||||||||||||||||||||||||||||||
| 30-34 | 181 | 179 | 191 | 201 | 171 | |||||||||||||||||||||||||||||||||||
| 35-39 | 239 | 181 | 181 | 213 | 176 | |||||||||||||||||||||||||||||||||||
| 40-44 | 297 | 154 | 193 | 214 | 168 | |||||||||||||||||||||||||||||||||||
| 45-49 | 434 | 119 | 114 | 162 | 115 | |||||||||||||||||||||||||||||||||||
| Total unmet need for FP by region | Northeast | 209 | 122 | 181 | 176 | 175 | ||||||||||||||||||||||||||||||||||
| Northwest | 142 | 244 | 111 | 208 | 12 | |||||||||||||||||||||||||||||||||||
| Southeast | 263 | 209 | 189 | 181 | 125 | |||||||||||||||||||||||||||||||||||
| Southwest | 23 | 157 | 172 | 197 | 154 | |||||||||||||||||||||||||||||||||||
| Southsouth | 245 | 259 | 222 | |||||||||||||||||||||||||||||||||||||
| Northcentral | 163 | 218 | 187 | 235 | ||||||||||||||||||||||||||||||||||||
| Total demand for FP | Northeast | 229 | 153 | 223 | 216 | 207 | ||||||||||||||||||||||||||||||||||
| Northwest | 154 | 276 | 161 | 235 | 163 | |||||||||||||||||||||||||||||||||||
| Southeast | 353 | 444 | 414 | 415 | 418 | |||||||||||||||||||||||||||||||||||
| Southwest | 38 | 419 | 499 | 513 | 535 | |||||||||||||||||||||||||||||||||||
| Southsouth | 499 | 522 | 502 | |||||||||||||||||||||||||||||||||||||
| Northcentral | 341 | 351 | 317 | 391 | ||||||||||||||||||||||||||||||||||||
| Percentage of demand staisfied | Northeast | 88 | 20 | 19 | 187 | 152 | ||||||||||||||||||||||||||||||||||
| Northwest | 79 | 117 | 308 | 117 | 262 | |||||||||||||||||||||||||||||||||||
| Southeast | 254 | 53 | 543 | 563 | 70 | |||||||||||||||||||||||||||||||||||
| Southwest | 395 | 625 | 656 | 617 | 711 | |||||||||||||||||||||||||||||||||||
| Southsouth | 509 | 503 | 559 | |||||||||||||||||||||||||||||||||||||
| Northcentral | 522 | 379 | 41 | 399 | ||||||||||||||||||||||||||||||||||||
| Infant amp Child Mortality | ||||||||||||||||||||||||||||||||||||||||
| Northeast | Neonatal mortality | 392 | 445 | 61 | 53 | 42 | ||||||||||||||||||||||||||||||||||
| Postneonatal mortality | 485 | 349 | 65 | 56 | 33 | |||||||||||||||||||||||||||||||||||
| Infant mortality | 877 | 794 | 125 | 109 | 77 | |||||||||||||||||||||||||||||||||||
| Child mortality | 1392 | 1041 | 154 | 126 | 90 | |||||||||||||||||||||||||||||||||||
| Under-five mortality | 2146 | 1752 | 260 | 222 | 160 | |||||||||||||||||||||||||||||||||||
| Northwest | Neonatal mortality | 578 | 251 | 55 | 47 | 44 | ||||||||||||||||||||||||||||||||||
| Postneonatal mortality | 52 | 575 | 59 | 44 | 46 | |||||||||||||||||||||||||||||||||||
| Infant mortality | 1098 | 826 | 114 | 91 | 89 | |||||||||||||||||||||||||||||||||||
| Child mortality | 1512 | 1151 | 176 | 139 | 105 | |||||||||||||||||||||||||||||||||||
| Under-five mortality | 2444 | 1882 | 269 | 217 | 185 | |||||||||||||||||||||||||||||||||||
| Southeast | Neonatal mortality | 386 | 373 | 34 | 51 | 37 | ||||||||||||||||||||||||||||||||||
| Postneonatal mortality | 441 | 371 | 32 | 44 | 45 | |||||||||||||||||||||||||||||||||||
| Infant mortality | 827 | 743 | 66 | 95 | 82 | |||||||||||||||||||||||||||||||||||
| Child mortality | 665 | 656 | 40 | 64 | 54 | |||||||||||||||||||||||||||||||||||
| Under-five mortality | 1437 | 135 | 103 | 153 | 131 | |||||||||||||||||||||||||||||||||||
| Southwest | Neonatal mortality | 463 | 426 | 39 | 37 | 39 | ||||||||||||||||||||||||||||||||||
| Postneonatal mortality | 383 | 273 | 30 | 22 | 21 | |||||||||||||||||||||||||||||||||||
| Infant mortality | 846 | 699 | 69 | 59 | 61 | |||||||||||||||||||||||||||||||||||
| Child mortality | 903 | 339 | 47 | 32 | 31 | |||||||||||||||||||||||||||||||||||
| Under-five mortality | 1672 | 1015 | 113 | 89 | 90 | |||||||||||||||||||||||||||||||||||
| Southsouth | Neonatal mortality | 53 | 48 | 32 | ||||||||||||||||||||||||||||||||||||
| Postneonatal mortality | 68 | 37 | 26 | Northeast | Neonatal mortality | 392 | 445 | 61 | 53 | 42 | ||||||||||||||||||||||||||||||
| Infant mortality | 120 | 84 | 58 | Northwest | Neonatal mortality | 578 | 251 | 55 | 47 | 44 | ||||||||||||||||||||||||||||||
| Child mortality | 63 | 58 | 35 | Southeast | Neonatal mortality | 386 | 373 | 34 | 51 | 37 | ||||||||||||||||||||||||||||||
| Under-five mortality | 176 | 138 | 91 | Southwest | Neonatal mortality | 463 | 426 | 39 | 37 | 39 | ||||||||||||||||||||||||||||||
| Northcentral | Neonatal mortality | 238 | 53 | 41 | 35 | Southsouth | Neonatal mortality | 53 | 48 | 32 | ||||||||||||||||||||||||||||||
| Postneonatal mortality | 269 | 49 | 37 | 31 | Northeast | Postneonatal mortality | 485 | 349 | 65 | 56 | 33 | |||||||||||||||||||||||||||||
| Infant mortality | 507 | 103 | 77 | 66 | Northwest | Postneonatal mortality | 52 | 575 | 59 | 44 | 46 | |||||||||||||||||||||||||||||
| Child mortality | 355 | 70 | 62 | 36 | Southwest | Postneonatal mortality | 383 | 273 | 30 | 22 | 21 | |||||||||||||||||||||||||||||
| Under-five mortality | 844 | 165 | 135 | 100 | Southeast | Postneonatal mortality | 441 | 371 | 32 | 44 | 45 | |||||||||||||||||||||||||||||
| Maternal amp Child Health | Southsouth | Postneonatal mortality | 68 | 37 | 26 | |||||||||||||||||||||||||||||||||||
| No antenatal care provider | Northeast | 547 | 541 | 471 | 512 | 408 | Northeast | Infant mortality | 877 | 794 | 125 | 109 | 77 | |||||||||||||||||||||||||||
| Northwest | 524 | 651 | 59 | 671 | 554 | Northwest | Infant mortality | 1098 | 826 | 114 | 91 | 89 | ||||||||||||||||||||||||||||
| Southeast | 196 | 77 | 08 | 74 | 42 | Southeast | Infant mortality | 827 | 743 | 66 | 95 | 82 | ||||||||||||||||||||||||||||
| Southwest | 77 | 35 | 23 | 57 | 57 | Southwest | Infant mortality | 846 | 699 | 69 | 59 | 61 | ||||||||||||||||||||||||||||
| Southsouth | 168 | 188 | 206 | Southsouth | Infant mortality | 120 | 84 | 58 | ||||||||||||||||||||||||||||||||
| Northcentral | 202 | 253 | 262 | 26 | Northeast | Under-five mortality | 2146 | 1752 | 260 | 222 | 160 | |||||||||||||||||||||||||||||
| Health facility delivery | Northeast | 104 | 117 | 171 | 128 | 195 | Northwest | Under-five mortality | 2444 | 1882 | 269 | 217 | 185 | |||||||||||||||||||||||||||
| Northwest | 97 | 64 | 104 | 84 | 115 | Southeast | Under-five mortality | 1437 | 135 | 103 | 153 | 131 | ||||||||||||||||||||||||||||
| Southeast | 463 | 549 | 841 | 739 | 781 | Southwest | Under-five mortality | 1672 | 1015 | 113 | 89 | 90 | ||||||||||||||||||||||||||||
| Southwest | 636 | 672 | 776 | 70 | 75 | Southsouth | Under-five mortality | 176 | 138 | 91 | ||||||||||||||||||||||||||||||
| Southsouth | 532 | 481 | 501 | Northeast | Child mortality | 1392 | 1041 | 154 | 126 | 90 | ||||||||||||||||||||||||||||||
| Northcentral | 443 | 454 | 41 | 457 | Northwest | Child mortality | 1512 | 1151 | 176 | 139 | 105 | |||||||||||||||||||||||||||||
| No assistance during delivery | Northeast | 561 | 232 | 198 | 186 | 97 | Southeast | Child mortality | 665 | 656 | 40 | 64 | 54 | |||||||||||||||||||||||||||
| Northwest | 635 | 255 | 305 | 438 | 278 | Southwest | Child mortality | 903 | 339 | 47 | 32 | 31 | ||||||||||||||||||||||||||||
| Southeast | 159 | 23 | 04 | 3 | 15 | Southsouth | Child mortality | 63 | 58 | 35 | ||||||||||||||||||||||||||||||
| Southwest | 157 | 24 | 09 | 32 | 13 | |||||||||||||||||||||||||||||||||||
| Southsouth | 18 | 31 | 18 | |||||||||||||||||||||||||||||||||||||
| Northcentral | 41 | 9 | 102 | 65 | ||||||||||||||||||||||||||||||||||||
| STDs FGM others | na | yes | yes | yes | yes |

STATUS OF WOMENrsquoS HEALTH 2013
NORTHERN STATES ONLY
States wo (n=8) States w (n=12) Sig (2-tailed)Determinants of Health
Median age at first birth women aged 25-49 208 184Education level (none) 310 671 lt00001 who participate in their own health care decisions 541 163 lt00001Fertility Total Fertility Rate 520 671 0003 of 15-19 yo who have begun childbearing 1738 3673 lt00001
Family PlanningSRHHeard of any contraception method 8734 7388 001Current use of any contraception method (married women) 1726 368 0001Have NOT heard FP message on radio or TV 6414 7982 003Knoweldge of HIVAIDS 8988 8906 043Maternal Health
No Antenatal Care provider 2136 5211 lt00001
Health facility delivery 5104 1447 lt00001
No assistance during delivery 670 1838 002
Sheet1
Percentage of females without any level of education
Northeast19901999200320082013826468655611Northwest1990199920032008201386264599999999999994722675628Southeast19901999200320082013431188178208187Southwest1990199920032008201329722823321517100000000000001Southsouth1990199920032008201320614913Northcentral19901999200320082013414093929999999999999738
Percent of women who did not receive ANC
Northeast1990199920032008201354754147151240799999999999997Northwest19901999200320082013524650999999999999945967099999999999994554Southeast199019992003200820131960000000000000177087442Southwest199019992003200820137735229999999999999985757Southsouth19901999200320082013168188206Northcentral1990199920032008201320225326226
Percent of women who delivered in a facility
Northeast1990199920032008201310411717100000000000001128195Northwest19901999200320082013969999999999999936410484115Southeast199019992003200820134635498417390000000000000678099999999999994Southwest19901999200320082013636672775999999999999947075Southsouth19901999200320082013532481501Northcentral1990199920032008201344345441457
Percent of women delivered without assistance
Northeast199019992003200820135612321981860000000000000196999999999999993Northwest19901999200320082013635255305438278Southeast199019992003200820131592299999999999999804315Southwest1990199920032008201315724093213Southsouth19901999200320082013183118Northcentral199019992003200820134099999999999999691019999999999999965
Percentage of women with any level of education
Northeast19901999200320082013183632345389Northwest1990199920032008201313799999999999997354000000000000062779999999999999732537200000000000003Southeast19901999200320082013569812822792813Southwest19901999200320082013703772767785829Southsouth199019992003200820137940000000000000685187
Percentage ()
Total Fertility Rate
Northeast19901999200320082013653267977263Northwest1990199920032008201366449999999999996645677367Southeast199019992003200820135573000000000000446399999999999997409999999999999964847Southwest199019992003200820135461000000000000345409999999999999964545999999999999996Southsouth19901999200320082013459999999999999964743
Total Fertiliy Rate
Median Age at First Birth of Women Ages 25-49
Northeast19901999200320082013188182178182188Northwest199019992003200820131951860000000000000117818317899999999999999Southeast199019992003200820131960000000000000121227236237Southwest19901999200320082013205211221227227Southsouth19901999200320082013198214218
Age
Percent of women who know at least 1 contraceptive method
Northeast1990199920032008201324354635586732Northwest199019992003200820133034227509999999999999445181099999999999994Southeast1990199920032008201356681599999999999994871855959Southwest19901999200320082013735999999999999948729795964Southsouth19901999200320082013942899977
Percent ()
Current use of contraceptive method amongst married women
Northeast1990199920032008201323142432Northwest199019992003200820131232490000000000000042843Southeast1990199920032008201388000000000000007235225234293Southwest19901999200320082013152623270000000000000331738Southsouth19901999200320082013254262281
Percent ()
Median Age at First Marraige (women 25-49)
Northeast199019992003200820131521515156163Northwest19901999200320082013154146146152153Southeast19901999200320082013183202218228227Southwest19901999200320082013197202213219218Southsouth19901999200320082013192209215
Age
No Antenatal Care Provision
Northeast1990199920032008201354754147151240799999999999997Northwest19901999200320082013524650999999999999945967099999999999994554Southeast199019992003200820131960000000000000177087442Southwest199019992003200820137735229999999999999985757Southsouth19901999200320082013168188206
Percent ()
Total fertility rate
Northeast19901999200320082013653267977263Northwest1990199920032008201366449999999999996645677367Southeast199019992003200820135573000000000000446399999999999997409999999999999964847Southwest199019992003200820135461000000000000345409999999999999964545999999999999996Southsouth19901999200320082013459999999999999964743Northcentral1990199920032008201371449575453
Facility Delivery
Northeast1990199920032008201310411717100000000000001128195Northwest19901999200320082013969999999999999936410484115Southeast199019992003200820134635498417390000000000000678099999999999994Southwest19901999200320082013636672775999999999999947075Southsouth19901999200320082013532481501
Percent()
Neonatal mortality19901999200320082013578251554744Infant mortality1990199920032008201310988261149189Neonatal mortality38637299999999999997345137Infant mortality827743669582
Infant Mortality
Northeast199019992003200820138777940000000000000612510977Northwest1990199920032008201310988261149189Southeast19901999200320082013827743669582Southwest1990199920032008201384669900000000000006695961Southsouth199019992003200820131208458
Percent ()
Median Age at First Birth of Women Ages 25-49
Northeast19901999200320082013188182178182188Northwest199019992003200820131951860000000000000117818317899999999999999Southeast199019992003200820131960000000000000121227236237Southwest19901999200320082013205211221227227Southsouth19901999200320082013198214218Northcentral1990199920032008201319819720206
Percent of women who know about at least 1 contraceptive method
Northeast1990199920032008201324354635586732Northwest199019992003200820133034227509999999999999445181099999999999994Southeast1990199920032008201356681599999999999994871855959Southwest19901999200320082013735999999999999948729795964Southsouth19901999200320082013942899977Northcentral19901999200320082013707740000000000000664378599999999999994
Use of contraceptive method (married women)
Northeast1990199920032008201323142432Northwest199019992003200820131232490000000000000042843Southeast1990199920032008201388000000000000007235225234293Southwest19901999200320082013152623270000000000000331738Southsouth19901999200320082013254262281Northcentral1990199920032008201317813313156
Median Age at First Marraige (women 25-49)
Northeast199019992003200820131521515156163Northwest19901999200320082013154146146152153Southeast19901999200320082013183202218228227Southwest19901999200320082013197202213219218Southsouth19901999200320082013192209215Northcentral199019992003200820131789999999999999917718318899999999999999
Total unmet need for FP
Northeast199019992003200820132091221810000000000000117600000000000001175Northwest1990199920032008201314224411120812Southeast199019992003200820132632091889999999999999918100000000000001125Southwest1990199920032008201323157172197154Southsouth19901999200320082013245259222Northcentral19901999200320082013163218187235
Total demand for FP
Northeast19901999200320082013229153223216207Northwest1990199920032008201315427616100000000000001235163Southeast1990199920032008201335299999999999997444414415418Southwest1990199920032008201338419499513535Southsouth19901999200320082013499522502Northcentral19901999200320082013341351317391
Percentage of FP demand satisfied
Northeast19901999200320082013880000000000000072019187152Northwest1990199920032008201379117308117262Southeast199019992003200820132545354356370Southwest199019992003200820133956256559999999999999461771099999999999994Southsouth19901999200320082013509503559Northcentral1990199920032008201352237941399
Nigeria laws
States 2008
States 2013
States 2013 (2)
State trends
FCT - Abuja2008201328252Benue20082013142165Kogi2008201396999999999999993105Kwara2008201324640200000000000003Nasarawa200820131218100000000000001Plateau20082013111152Adamawa200820132844000000000000004Taraba2008201358Abia20082013239334Anambra2008201334435Ebonyi2008201361157Enugu20082013211314Imo20082013227341Akawa Ibom2008201332700000000000003255Bayelsa20082013101133Cross River2008201320324Delta20082013266287Edo20082013316303Rivers20082013272345Ekiti20082013173345Lagos20082013496483Ogun2008201313926Ondo20082013212311Osun200820133838299999999999997Oyo20082013219374Niger200820134599999999999999666Bauchi200820132722000000000000002Borno200820136518Gombe20082013564Yobe200820131911000000000000001Jigawa200820130209Kaduna2008201396202Kano200820132299999999999999806Katsina200820130813Kebbi200820131913Sokoto200820132111000000000000001Zamfara20082013253
Facility Delivery
FCT - Abuja2008201354269099999999999994Benue20082013509509Kogi2008201377378900000000000006Kwara20082013488767Nasarawa20082013329401Plateau2008201330235799999999999997Adamawa20082013107334Taraba20082013211234Abia2008201374400000000000006728Anambra20082013878846Ebonyi2008201340700000000000003596Enugu20082013536855Imo20082013943909Akawa Ibom20082013369432Bayelsa2008201318399999999999999284Cross River20082013385404Delta20082013572576Edo20082013762747Rivers2008201347949Ekiti20082013752863Lagos2008201376900000000000006772Ogun20082013638747Ondo20082013469562Osun20082013851891Oyo2008201367099999999999994747Niger20082013159253Bauchi200820131316899999999999999Borno2008201311817Gombe20082013172276Yobe200820136176Jigawa200820134567Kaduna2008201318399999999999999324Kano20082013111129Katsina20082013429Kebbi200820134885Sokoto200820134400000000000000447Zamfara20082013655
Percentage receiving no antenatal care
FCT - Abuja200820138959Benue20082013305396Kogi2008201314254Kwara2008201333949000000000000004Nasarawa20082013232305Plateau20082013157339Adamawa2008201337799999999999997134Taraba2008201346337299999999999997Abia200820138300000000000000747Anambra200820130843Ebonyi200820132010000000000000171Enugu2008201310832Imo200820132509Akawa Ibom20082013126225Bayelsa20082013355517Cross River20082013159138Delta200820131917899999999999999Edo2008201354144Rivers2008201326620Ekiti20082013322999999999999998Lagos200820131812Ogun200820135422999999999999998Ondo20082013147146Osun200820130615Oyo20082013105106Niger2008201339200000000000003282Bauchi2008201349133200000000000003Borno20082013648587Gombe20082013405225Yobe2008201362565599999999999994Jigawa20082013787472Kaduna2008201336200000000000003442Kano20082013487354Katsina20082013828658Kebbi20082013847712Sokoto20082013853797Zamfara2008201385573599999999999994
THE ROLE OF EDUCATION
Living in a state with customary and religious laws and laws that impede access to sexual and reproductive health services affect education opportunities for women ndash an example
Child marriage Customary law allows marriage of girls between 12 and
15 years the minimum age of marriage can be as low as nine Under Islamic law age of marriage is defined as ldquoage of pubertyrdquo
Among married girls aged 15 to 19 62 have already given birth
Almost 1 out of 4 gave birth before age 15 Only 2 of 15 to 19-year-old married girls are in school
compared to 69 of unmarried girls
Source ReutersA Akinleye
EDUCATION AS A MEDIATOR
1 Living in a state with living with customary and religious laws and laws that impede access to sexual and reproductive health services is a significant predictor or current contraception use amongst married women
(Pearson Correlation = -747) (Linear regression R2=56 F(1 35)=4423 plt00001 βSTATE=-2271 t=-665 plt00001)
2 Living in a state with living with customary and religious laws and laws that impede access to sexual and reproductive health services is a significant predictor of education level
(Pearson Correlation = 901) (Linear regression R2=81 F(1 35)=15083 plt00001 βEDUCATION=4624 t=1228 plt00001)
3 Living in a state with living with customary and religious laws and laws that impede access to sexual and reproductive health services is a significant predictor of education level
(Linear regression R2 = 72 F(2 34) = 4398 plt00001 βSTATE=274 t=43 p=067 βEDUCATION= -55 t=-445 plt00001)
Current contraception
use
Living in a state w
customary laws
Education Level (None)
a b
crsquo
TO CONCLUDE WHY IS THE LAW IMPORTANT
Nigerian states with customary and religious laws and laws that impede access to sexual and reproductive health services have seen fewer if any improvements in womenrsquos health outcomes across the years
Education mediates the relationship between current contraception use amongst married women and living in a state with customary and religious laws
Progress in achieving development goals have been slow and uneven and wide regional differences exist
Customary religious and traditional laws tend to have particular impacts on women and girls and must be addressed
Domestic legal frameworks are largely inadequate in addressing sexual and reproductive health due to loopholes
Social norms and practices are shifting but others continue as part of deep-rooted value systems that subordinate women and girls
Integrated approaches must be developed with the support and knowledge of women and girls and must involve traditional cultural and religious leaders as well as men and boys
- Association between Plural Legal Systems and Sexual and Reproductive Health Outcomes for Women and Girls in Northern Nigeria
- Overview
- Convention on the Elimination of all Forms of Discrimination Against Women (CEDAW) impact on Sexual amp reproductive health
- Plural Legal Systems
- Customary Religious and Traditional LawLegal pluralism permits religious traditional and customary law or practice to trump national legislation through two primary avenues
- Nigeria Legal System
- Nigeria Legal framework
- NIGeRia Laws and policies
- Legal systems amp geography
- Data Sources
- Regional Time trends (1990-2013)
- Fertility
- Family Planning
- Maternal Health
- State-level Time trends (2008-2013)
- State-level Time trends (2008-2013)
- Slide Number 17
- Slide Number 18
- The role of education
- Education as a mediator
- To Conclude Why is the law important
-
| Current use of any contraception method (married women) | Health facility delivery | rate change contra | rate change facility | No Antenatal Care provider | |||||||||||||||||||||||
| State | 2008 | 2013 | 2008 | 2013 | 2008 | 2013 | rate of change | ||||||||||||||||||||
| North Central | FCT - Abuja | 28 | 252 | 542 | 691 | -28 | 149 | 89 | 59 | -3 | |||||||||||||||||
| North Central | Benue | 142 | 165 | 509 | 509 | 23 | 0 | 305 | 396 | 91 | |||||||||||||||||
| North Central | Kogi | 97 | 105 | 773 | 789 | 08 | 16 | 142 | 54 | -88 | |||||||||||||||||
| North Central | Kwara | 246 | 402 | 488 | 767 | 156 | 279 | 339 | 49 | -29 | |||||||||||||||||
| North Central | Nasarawa | 12 | 181 | 329 | 401 | 61 | 72 | 232 | 305 | 73 | |||||||||||||||||
| North Central | Plateau | 111 | 152 | 302 | 358 | 41 | 56 | 157 | 339 | 182 | |||||||||||||||||
| North East | Adamawa | 28 | 44 | 107 | 334 | 16 | 227 | 378 | 134 | -244 | |||||||||||||||||
| North East | Taraba | 5 | 8 | 211 | 234 | 3 | 23 | 463 | 373 | -9 | |||||||||||||||||
| South East | Abia | 239 | 334 | 744 | 728 | 95 | -16 | 83 | 47 | -36 | |||||||||||||||||
| South East | Anambra | 344 | 35 | 878 | 846 | 06 | -32 | 08 | 43 | 35 | |||||||||||||||||
| South East | Ebonyi | 61 | 157 | 407 | 596 | 96 | 189 | 201 | 71 | -13 | |||||||||||||||||
| South East | Enugu | 211 | 314 | 536 | 855 | 103 | 319 | 108 | 32 | -76 | |||||||||||||||||
| South East | Imo | 227 | 341 | 943 | 909 | 114 | -34 | 25 | 09 | -16 | |||||||||||||||||
| South South | Akawa Ibom | 327 | 255 | 369 | 432 | -72 | 63 | 126 | 225 | 99 | |||||||||||||||||
| South South | Bayelsa | 101 | 133 | 184 | 284 | 32 | 10 | 355 | 517 | 162 | |||||||||||||||||
| South South | Cross River | 203 | 24 | 385 | 404 | 37 | 19 | 159 | 138 | -21 | |||||||||||||||||
| South South | Delta | 266 | 287 | 572 | 576 | 21 | 04 | 19 | 179 | -11 | |||||||||||||||||
| South South | Edo | 316 | 303 | 762 | 747 | -13 | -15 | 54 | 144 | 9 | |||||||||||||||||
| South South | Rivers | 272 | 345 | 479 | 49 | 73 | 11 | 266 | 20 | -66 | |||||||||||||||||
| South West | Ekiti | 173 | 345 | 752 | 863 | 172 | 111 | 3 | 23 | -07 | |||||||||||||||||
| South West | Lagos | 496 | 483 | 769 | 772 | -13 | 03 | 18 | 12 | -06 | |||||||||||||||||
| South West | Ogun | 139 | 26 | 638 | 747 | 121 | 109 | 54 | 23 | -31 | |||||||||||||||||
| South West | Ondo | 212 | 311 | 469 | 562 | 99 | 93 | 147 | 146 | -01 | |||||||||||||||||
| South West | Osun | 38 | 383 | 851 | 891 | 03 | 4 | 06 | 15 | 09 | |||||||||||||||||
| South West | Oyo | 219 | 374 | 671 | 747 | 155 | 76 | 5344 | 7448 | average rate change states without | 105 | 106 | 01 | ||||||||||||||
| North Central | Niger | 46 | 66 | 159 | 253 | 2 | 94 | 392 | 282 | -11 | |||||||||||||||||
| North East | Bauchi | 27 | 22 | 13 | 169 | -05 | 39 | 491 | 332 | -159 | |||||||||||||||||
| North East | Borno | 65 | 18 | 118 | 17 | -47 | 52 | 648 | 587 | -61 | |||||||||||||||||
| North East | Gombe | 56 | 4 | 172 | 276 | -16 | 104 | 405 | 225 | -18 | |||||||||||||||||
| North East | Yobe | 19 | 11 | 61 | 76 | -08 | 15 | 625 | 656 | 31 | |||||||||||||||||
| North West | Jigawa | 02 | 09 | 45 | 67 | 07 | 22 | 787 | 472 | -315 | |||||||||||||||||
| North West | Kaduna | 96 | 202 | 184 | 324 | 106 | 14 | 362 | 442 | 8 | |||||||||||||||||
| North West | Kano | 23 | 06 | 111 | 129 | -17 | 18 | 487 | 354 | -133 | |||||||||||||||||
| North West | Katsina | 08 | 13 | 42 | 9 | 05 | 48 | 828 | 658 | -17 | |||||||||||||||||
| North West | Kebbi | 19 | 13 | 48 | 85 | -06 | 37 | 847 | 712 | -135 | |||||||||||||||||
| North West | Sokoto | 21 | 11 | 44 | 47 | -1 | 03 | 853 | 797 | -56 | |||||||||||||||||
| North West | Zamfara | 25 | 3 | 65 | 5 | 05 | -15 | 02833333333 | 46416666667 | average rate change states with | 855 | 736 | -119 | ||||||||||||||
| 00071049204 | 01702860614 | 00077553648 |
| 2008 | State | Education level female (none) | Education level female (primary) | TFR | Median age at first birth women aged 25-49 | of 15-19 yo who have begun childbearing | Heard of any method | Heard of modern method | Current use of any contraception method (married women) | Have NOT heard FP message on radio or TV | No Antenatal Care provider | Health facility delivery | No assistance during delivery | Knoweldge of AIDS (women) | who participate in their own health care decisions | men who agree that a husband is justified in hitting his wife | State wtraditional law | ||||||||||||||||||
| North Central | FCT - Abuja | 145 | 95 | 45 | 236 | 92 | 927 | 92 | 252 | 387 | 59 | 691 | 4 | 904 | 559 | 18 | 0 | ||||||||||||||||||
| North Central | Benue | 257 | 94 | 52 | 189 | 225 | 964 | 96 | 165 | 745 | 396 | 509 | 6 | 997 | 285 | 57 | 0 | ||||||||||||||||||
| North Central | Kogi | 257 | 118 | 42 | 21 | 178 | 775 | 77 | 105 | 606 | 54 | 789 | 04 | 88 | 617 | 187 | 0 | ||||||||||||||||||
| North Central | Kwara | 266 | 123 | 51 | 221 | 59 | 947 | 946 | 402 | 205 | 49 | 767 | 1 | 925 | 803 | 62 | 0 | ||||||||||||||||||
| North Central | Nasarawa | 413 | 94 | 54 | 206 | 154 | 844 | 836 | 181 | 79 | 305 | 401 | 129 | 825 | 507 | 454 | 0 | ||||||||||||||||||
| North Central | Plateau | 356 | 102 | 54 | 219 | 131 | 824 | 82 | 152 | 826 | 339 | 358 | 135 | 806 | 637 | 317 | 0 | ||||||||||||||||||
| North East | Adamawa | 355 | 87 | 58 | 191 | 287 | 837 | 837 | 44 | 663 | 134 | 334 | 67 | 897 | 349 | 28 | 0 | ||||||||||||||||||
| North East | Taraba | 432 | 96 | 6 | 189 | 264 | 869 | 867 | 8 | 909 | 373 | 234 | 91 | 956 | 568 | 226 | 0 | ||||||||||||||||||
| North Central | Niger | 616 | 6 | 61 | 198 | 273 | 555 | 546 | 66 | 844 | 282 | 253 | 58 | 64 | 187 | 196 | 1 | ||||||||||||||||||
| North East | bauchi | 623 | 73 | 81 | 177 | 481 | 668 | 666 | 22 | 768 | 332 | 169 | 212 | 872 | 29 | 416 | 1 | ||||||||||||||||||
| North East | Borno | 69 | 47 | 47 | 204 | 288 | 643 | 575 | 18 | 802 | 587 | 17 | 24 | 804 | 25 | 401 | 1 | ||||||||||||||||||
| North East | Gombe | 616 | 49 | 7 | 181 | 364 | 64 | 618 | 4 | 844 | 225 | 276 | 152 | 794 | 56 | 337 | 1 | ||||||||||||||||||
| North East | Yobe | 853 | 12 | 66 | 189 | 251 | 805 | 742 | 11 | 873 | 656 | 76 | 02 | 971 | 7 | 345 | 1 | ||||||||||||||||||
| North West | Jigawa | 713 | 64 | 76 | 177 | 517 | 751 | 709 | 09 | 859 | 472 | 67 | 231 | 935 | 133 | 202 | 1 | ||||||||||||||||||
| North West | Kaduna | 403 | 92 | 41 | 194 | 332 | 982 | 937 | 202 | 589 | 442 | 324 | 156 | 958 | 541 | 151 | 1 | ||||||||||||||||||
| North West | Kano | 542 | 83 | 68 | 182 | 232 | 82 | 798 | 06 | 627 | 354 | 129 | 39 | 997 | 14 | 11 | 1 | ||||||||||||||||||
| North West | Katsina | 677 | 73 | 74 | 173 | 533 | 898 | 89 | 13 | 626 | 658 | 9 | 25 | 997 | 337 | 288 | 1 | ||||||||||||||||||
| North West | Kebbi | 758 | 43 | 67 | 179 | 344 | 51 | 47 | 13 | 944 | 712 | 85 | 279 | 759 | 27 | 495 | 1 | ||||||||||||||||||
| North West | Sokoto | 785 | 31 | 7 | 174 | 36 | 753 | 749 | 11 | 971 | 797 | 47 | 01 | 991 | 09 | 332 | 1 | ||||||||||||||||||
| North West | Zamfara | 773 | 37 | 84 | 176 | 432 | 841 | 809 | 3 | 831 | 736 | 5 | 451 | 969 | 39 | 447 | 1 | ||||||||||||||||||
| 00000007362 | 00000392724 | 00028858881 | 00005053265 | 00001462922 | 00108017923 | 00039047205 | 00009920058 | 00341461283 | 00007434824 | 00000263782 | 00230582487 | 04294511369 | 00000429505 | 04012033851 | |||||||||||||||||||||
| South East | Abia | 172 | 138 | 42 | 66 | 954 | 945 | 334 | 522 | 47 | 728 | 03 | 986 | 593 | 354 | 0 | |||||||||||||||||||
| South East | Anambra | 101 | 122 | 42 | 248 | 27 | 971 | 966 | 35 | 716 | 43 | 846 | 0 | 996 | 759 | 211 | 0 | ||||||||||||||||||
| South East | Ebonyi | 278 | 128 | 53 | 214 | 96 | 891 | 888 | 157 | 488 | 71 | 596 | 5 | 983 | 421 | 227 | 0 | ||||||||||||||||||
| South East | Enugu | 231 | 145 | 48 | 229 | 94 | 994 | 992 | 314 | 581 | 32 | 855 | 05 | 995 | 637 | 265 | 0 | ||||||||||||||||||
| South East | Imo | 134 | 123 | 48 | 114 | 997 | 989 | 341 | 487 | 09 | 909 | 05 | 989 | 766 | 273 | 0 | |||||||||||||||||||
| South South | Akawa Ibom | 129 | 156 | 39 | 212 | 179 | 982 | 98 | 255 | 459 | 225 | 432 | 06 | 959 | 459 | 265 | 0 | ||||||||||||||||||
| South South | Bayelsa | 104 | 139 | 45 | 192 | 167 | 996 | 996 | 133 | 42 | 517 | 284 | 01 | 90 | 316 | 251 | 0 | ||||||||||||||||||
| South South | Cross River | 18 | 139 | 54 | 21 | 184 | 96 | 958 | 24 | 415 | 138 | 404 | 22 | 965 | 60 | 37 | 0 | ||||||||||||||||||
| South South | Delta | 143 | 138 | 41 | 22 | 83 | 948 | 944 | 287 | 673 | 179 | 576 | 54 | 924 | 711 | 281 | 0 | ||||||||||||||||||
| South South | Edo | 121 | 131 | 44 | 225 | 39 | 985 | 985 | 303 | 422 | 144 | 747 | 16 | 961 | 715 | 351 | 0 | ||||||||||||||||||
| South South | Rivers | 10 | 137 | 38 | 231 | 139 | 998 | 996 | 345 | 71 | 20 | 49 | 03 | 936 | 779 | 161 | 0 | ||||||||||||||||||
| South West | Ekiti | 152 | 115 | 43 | 228 | 53 | 989 | 989 | 345 | 26 | 23 | 863 | 05 | 994 | 72 | 34 | 0 | ||||||||||||||||||
| South West | Lagos | 9 | 107 | 41 | 245 | 48 | 999 | 999 | 483 | 253 | 12 | 772 | 08 | 981 | 788 | 149 | 0 | ||||||||||||||||||
| South West | Ogun | 241 | 212 | 54 | 216 | 10 | 991 | 991 | 26 | 354 | 23 | 747 | 02 | 971 | 79 | 234 | 0 | ||||||||||||||||||
| South West | Ondo | 141 | 131 | 52 | 219 | 135 | 928 | 913 | 311 | 454 | 146 | 562 | 33 | 881 | 641 | 218 | 0 | ||||||||||||||||||
| South West | Osun | 163 | 97 | 41 | 235 | 11 | 995 | 995 | 383 | 227 | 15 | 891 | 02 | 997 | 53 | 74 | 0 | ||||||||||||||||||
| South West | Oyo | 249 | 119 | 45 | 214 | 124 | 909 | 889 | 374 | 247 | 106 | 747 | 23 | 846 | 734 | 123 | 0 | ||||||||||||||||||
| States wo (n=8) | States w (n=12) | Sig (2-tailed) | |||||||||||||||||||||||||||||||||
| Determinants of Health | |||||||||||||||||||||||||||||||||||
| Median age at first birth women aged 25-49 | 208 | 184 | |||||||||||||||||||||||||||||||||
| Education level (none) | 310 | 671 | lt00001 | ||||||||||||||||||||||||||||||||
| who participate in their own health care decisions | 541 | 163 | lt00001 | ||||||||||||||||||||||||||||||||
| Fertility | |||||||||||||||||||||||||||||||||||
| Total Fertility Rate | 520 | 671 | 0003 | ||||||||||||||||||||||||||||||||
| of 15-19 yo who have begun childbearing | 1738 | 3673 | lt00001 | ||||||||||||||||||||||||||||||||
| Family PlanningSRH | |||||||||||||||||||||||||||||||||||
| Heard of any contraception method | 8734 | 7388 | 001 | ||||||||||||||||||||||||||||||||
| Current use of any contraception method (married women) | 1726 | 368 | 0001 | ||||||||||||||||||||||||||||||||
| Have NOT heard FP message on radio or TV | 6414 | 7982 | 003 | ||||||||||||||||||||||||||||||||
| Knoweldge of HIVAIDS | 8988 | 8906 | 043 | ||||||||||||||||||||||||||||||||
| Maternal Health | |||||||||||||||||||||||||||||||||||
| No Antenatal Care provider | 2136 | 5211 | lt00001 | ||||||||||||||||||||||||||||||||
| Health facility delivery | 5104 | 1447 | lt00001 | ||||||||||||||||||||||||||||||||
| No assistance during delivery | 670 | 1838 | 002 |
| 2008 | State | Education level female (none) | Education level female (primary) | TFR | of 15-19 yo who have begun childbearing | Heard of any method | Heard of modern method | Current use of any contraception method (married women) | Have NOT heard FP message on radio or TV | No Antenatal Care provider | Health facility delivery | No assistance during delivery | Knoweldge of AIDS (women) | who participate in their own health care decisions | men who agree that a husband is justified in hitting his wife | State wtraditional law | |||||||||||||||||
| North Central | FCT - Abuja | 145 | 95 | 45 | 92 | 927 | 92 | 252 | 387 | 59 | 691 | 4 | 904 | 559 | 18 | 0 | |||||||||||||||||
| North Central | Benue | 257 | 94 | 52 | 225 | 964 | 96 | 165 | 745 | 396 | 509 | 6 | 997 | 285 | 57 | 0 | |||||||||||||||||
| North Central | Kogi | 257 | 118 | 42 | 178 | 775 | 77 | 105 | 606 | 54 | 789 | 04 | 88 | 617 | 187 | 0 | |||||||||||||||||
| North Central | Kwara | 266 | 123 | 51 | 59 | 947 | 946 | 402 | 205 | 49 | 767 | 1 | 925 | 803 | 62 | 0 | |||||||||||||||||
| North Central | Nasarawa | 413 | 94 | 54 | 154 | 844 | 836 | 181 | 79 | 305 | 401 | 129 | 825 | 507 | 454 | 0 | |||||||||||||||||
| North Central | Plateau | 356 | 102 | 54 | 131 | 824 | 82 | 152 | 826 | 339 | 358 | 135 | 806 | 637 | 317 | 0 | |||||||||||||||||
| North East | Adamawa | 355 | 87 | 58 | 287 | 837 | 837 | 44 | 663 | 134 | 334 | 67 | 897 | 349 | 28 | 0 | |||||||||||||||||
| North East | Taraba | 432 | 96 | 6 | 264 | 869 | 867 | 8 | 909 | 373 | 234 | 91 | 956 | 568 | 226 | 0 | |||||||||||||||||
| South East | Abia | 172 | 138 | 42 | 66 | 954 | 945 | 334 | 522 | 47 | 728 | 03 | 986 | 593 | 354 | 0 | |||||||||||||||||
| South East | Anambra | 101 | 122 | 42 | 27 | 971 | 966 | 35 | 716 | 43 | 846 | 0 | 996 | 759 | 211 | 0 | |||||||||||||||||
| South East | Ebonyi | 278 | 128 | 53 | 96 | 891 | 888 | 157 | 488 | 71 | 596 | 5 | 983 | 421 | 227 | 0 | |||||||||||||||||
| South East | Enugu | 231 | 145 | 48 | 94 | 994 | 992 | 314 | 581 | 32 | 855 | 05 | 995 | 637 | 265 | 0 | |||||||||||||||||
| South East | Imo | 134 | 123 | 48 | 114 | 997 | 989 | 341 | 487 | 09 | 909 | 05 | 989 | 766 | 273 | 0 | |||||||||||||||||
| South South | Akawa Ibom | 129 | 156 | 39 | 179 | 982 | 98 | 255 | 459 | 225 | 432 | 06 | 959 | 459 | 265 | 0 | |||||||||||||||||
| South South | Bayelsa | 104 | 139 | 45 | 167 | 996 | 996 | 133 | 42 | 517 | 284 | 01 | 90 | 316 | 251 | 0 | |||||||||||||||||
| South South | Cross River | 18 | 139 | 54 | 184 | 96 | 958 | 24 | 415 | 138 | 404 | 22 | 965 | 60 | 37 | 0 | |||||||||||||||||
| South South | Delta | 143 | 138 | 41 | 83 | 948 | 944 | 287 | 673 | 179 | 576 | 54 | 924 | 711 | 281 | 0 | |||||||||||||||||
| South South | Edo | 121 | 131 | 44 | 39 | 985 | 985 | 303 | 422 | 144 | 747 | 16 | 961 | 715 | 351 | 0 | |||||||||||||||||
| South South | Rivers | 10 | 137 | 38 | 139 | 998 | 996 | 345 | 71 | 20 | 49 | 03 | 936 | 779 | 161 | 0 | |||||||||||||||||
| South West | Ekiti | 152 | 115 | 43 | 53 | 989 | 989 | 345 | 26 | 23 | 863 | 05 | 994 | 72 | 34 | 0 | |||||||||||||||||
| South West | Lagos | 9 | 107 | 41 | 48 | 999 | 999 | 483 | 253 | 12 | 772 | 08 | 981 | 788 | 149 | 0 | |||||||||||||||||
| South West | Ogun | 241 | 212 | 54 | 10 | 991 | 991 | 26 | 354 | 23 | 747 | 02 | 971 | 79 | 234 | 0 | |||||||||||||||||
| South West | Ondo | 141 | 131 | 52 | 135 | 928 | 913 | 311 | 454 | 146 | 562 | 33 | 881 | 641 | 218 | 0 | |||||||||||||||||
| South West | Osun | 163 | 97 | 41 | 11 | 995 | 995 | 383 | 227 | 15 | 891 | 02 | 997 | 53 | 74 | 0 | |||||||||||||||||
| South West | Oyo | 249 | 119 | 45 | 124 | 909 | 889 | 374 | 247 | 106 | 747 | 23 | 846 | 734 | 123 | 0 | |||||||||||||||||
| North Central | Niger | 616 | 6 | 61 | 273 | 555 | 546 | 66 | 844 | 282 | 253 | 58 | 64 | 187 | 196 | 1 | |||||||||||||||||
| North East | bauchi | 623 | 73 | 81 | 481 | 668 | 666 | 22 | 768 | 332 | 169 | 212 | 872 | 29 | 416 | 1 | |||||||||||||||||
| North East | Borno | 69 | 47 | 47 | 288 | 643 | 575 | 18 | 802 | 587 | 17 | 24 | 804 | 25 | 401 | 1 | |||||||||||||||||
| North East | Gombe | 616 | 49 | 7 | 364 | 64 | 618 | 4 | 844 | 225 | 276 | 152 | 794 | 56 | 337 | 1 | |||||||||||||||||
| North East | Yobe | 853 | 12 | 66 | 251 | 805 | 742 | 11 | 873 | 656 | 76 | 02 | 971 | 7 | 345 | 1 | |||||||||||||||||
| North West | Jigawa | 713 | 64 | 76 | 517 | 751 | 709 | 09 | 859 | 472 | 67 | 231 | 935 | 133 | 202 | 1 | |||||||||||||||||
| North West | Kaduna | 403 | 92 | 41 | 332 | 982 | 937 | 202 | 589 | 442 | 324 | 156 | 958 | 541 | 151 | 1 | |||||||||||||||||
| North West | Kano | 542 | 83 | 68 | 232 | 82 | 798 | 06 | 627 | 354 | 129 | 39 | 997 | 14 | 11 | 1 | |||||||||||||||||
| North West | Katsina | 677 | 73 | 74 | 533 | 898 | 89 | 13 | 626 | 658 | 9 | 25 | 997 | 337 | 288 | 1 | |||||||||||||||||
| North West | Kebbi | 758 | 43 | 67 | 344 | 51 | 47 | 13 | 944 | 712 | 85 | 279 | 759 | 27 | 495 | 1 | |||||||||||||||||
| North West | Sokoto | 785 | 31 | 7 | 36 | 753 | 749 | 11 | 971 | 797 | 47 | 01 | 991 | 09 | 332 | 1 | |||||||||||||||||
| North West | Zamfara | 773 | 37 | 84 | 432 | 841 | 809 | 3 | 831 | 736 | 5 | 451 | 969 | 39 | 447 | 1 | |||||||||||||||||
| 0 | 00000000031 | 00000001254 | 00000000003 | 00000003864 | 0000000045 | 00000000536 | 00000378873 | 00000000471 | 0000000004 | 0000011062 | 00509577936 | 00000000007 | 01036675858 | ||||||||||||||||||||
| 4744 | 12196 | 93896 | 93484 | 26384 | 51276 | 14556 | 62128 | 3096 | 93816 | 61136 | 24468 | ||||||||||||||||||||||
| 67083333333 | 36725 | 738833333333 | 709083333333 | 3675 | 798166666667 | 521083333333 | 144666666667 | 183833333333 | 890583333333 | 16275 | 30175 | ||||||||||||||||||||||
| States wo (n=25) | States w (n=12) | Sig (2-tailed) | |||||||||||||||||||||||||||||||
| Determinants of Health | |||||||||||||||||||||||||||||||||
| Median age at first birth women aged 25-49 | 217 | 184 | |||||||||||||||||||||||||||||||
| Education level (none) | 208 | 671 | lt00001 | ||||||||||||||||||||||||||||||
| who participate in their own health care decisions | 611 | 163 | lt00001 | ||||||||||||||||||||||||||||||
| Fertility | |||||||||||||||||||||||||||||||||
| Total Fertility Rate | 474 | 671 | lt00001 | ||||||||||||||||||||||||||||||
| of 15-19 yo who have begun childbearing | 122 | 367 | lt00001 | ||||||||||||||||||||||||||||||
| Family PlanningSRH | |||||||||||||||||||||||||||||||||
| Heard of any contraception method | 939 | 739 | lt00001 | ||||||||||||||||||||||||||||||
| Current use of any contraception method (married women) | 264 | 37 | lt00001 | ||||||||||||||||||||||||||||||
| Have NOT heard FP message on radio or TV | 513 | 798 | lt00001 | ||||||||||||||||||||||||||||||
| Knoweldge of HIVAIDS | 938 | 891 | 0102 | ||||||||||||||||||||||||||||||
| Maternal Health | |||||||||||||||||||||||||||||||||
| No Antenatal Care provider | 146 | 521 | lt00001 | ||||||||||||||||||||||||||||||
| Health facility delivery | 621 | 145 | lt00001 | ||||||||||||||||||||||||||||||
| No assistance during delivery | 31 | 184 | lt00001 |
| 2008 | State | Education level female (none) | Education level female (primary) | TFR | Median age at first birth women aged 25-49 | of 15-19 yo who have begun childbearing | Heard of any method | Heard of modern method | Current use of any contraception method (married women) | Have NOT heard FP message on radio or TV | Partner knows about contraception use | No Antenatal Care provider | Health facility delivery | No assistance during delivery | Knoweldge of AIDS (women) | who participate in their own health care decisions | men who agree that a husband is justified in hitting his wife | men agree that thre is no reason for wife to deny sex | men believe they have the right to use force to have sex with wife | State wtraditional law | |||||||||||||||||||||
| North Central | FCT - Abuja | 177 | 10 | 4 | 228 | 66 | 887 | 885 | 28 | 662 | 861 | 89 | 542 | 4 | 883 | 493 | 42 | 18 | 21 | 0 | |||||||||||||||||||||
| North Central | Benue | 343 | 123 | 59 | 187 | 227 | 918 | 913 | 142 | 787 | 899 | 305 | 509 | 22 | 978 | 521 | 48 | 17 | 45 | 0 | |||||||||||||||||||||
| North Central | Kogi | 296 | 134 | 42 | 204 | 152 | 813 | 79 | 97 | 682 | 764 | 142 | 773 | 55 | 882 | 767 | 186 | 146 | 38 | 0 | |||||||||||||||||||||
| North Central | Kwara | 443 | 88 | 45 | 202 | 295 | 616 | 576 | 246 | 76 | 855 | 339 | 488 | 269 | 581 | 355 | 92 | 103 | 12 | 0 | |||||||||||||||||||||
| North Central | Nasarawa | 304 | 94 | 47 | 20 | 197 | 475 | 469 | 12 | 804 | 752 | 232 | 329 | 89 | 718 | 68 | 712 | 05 | 198 | 0 | |||||||||||||||||||||
| North Central | Plateau | 307 | 158 | 53 | 203 | 148 | 71 | 708 | 111 | 861 | 697 | 157 | 302 | 41 | 818 | 62 | 365 | 05 | 64 | 0 | |||||||||||||||||||||
| North East | Adamawa | 498 | 75 | 68 | 192 | 243 | 611 | 602 | 28 | 724 | 571 | 378 | 107 | 183 | 857 | 428 | 464 | 07 | 117 | 0 | |||||||||||||||||||||
| North East | Taraba | 489 | 68 | 59 | 194 | 215 | 794 | 792 | 5 | 899 | 796 | 463 | 211 | 111 | 923 | 344 | 291 | 26 | 8 | 0 | |||||||||||||||||||||
| South East | Abia | 16 | 138 | 44 | 244 | 134 | 963 | 96 | 239 | 342 | 911 | 83 | 744 | 22 | 989 | 515 | 387 | 18 | 57 | 0 | |||||||||||||||||||||
| South East | Anambra | 135 | 128 | 5 | 244 | 62 | 892 | 865 | 344 | 447 | 934 | 08 | 878 | 0 | 995 | 61 | 125 | 11 | 28 | 0 | |||||||||||||||||||||
| South East | Ebonyi | 345 | 137 | 56 | 21 | 82 | 607 | 599 | 61 | 642 | 849 | 201 | 407 | 144 | 916 | 493 | 642 | 49 | 14 | 0 | |||||||||||||||||||||
| South East | Enugu | 308 | 148 | 44 | 23 | 58 | 797 | 788 | 211 | 497 | 806 | 108 | 536 | 12 | 937 | 582 | 692 | 37 | 74 | 0 | |||||||||||||||||||||
| South East | Imo | 156 | 139 | 48 | 243 | 79 | 929 | 923 | 227 | 262 | 935 | 25 | 943 | 05 | 99 | 661 | 296 | 47 | 14 | 0 | |||||||||||||||||||||
| South South | Akawa Ibom | 122 | 193 | 4 | 22 | 151 | 966 | 947 | 327 | 338 | 826 | 126 | 369 | 06 | 983 | 636 | 288 | 43 | 45 | 0 | |||||||||||||||||||||
| South South | Bayelsa | 178 | 127 | 58 | 191 | 211 | 89 | 884 | 101 | 492 | 809 | 355 | 184 | 0 | 904 | 509 | 252 | 26 | 43 | 0 | |||||||||||||||||||||
| South South | Cross River | 183 | 155 | 54 | 198 | 181 | 779 | 77 | 203 | 506 | 827 | 159 | 385 | 36 | 952 | 679 | 538 | 17 | 54 | 0 | |||||||||||||||||||||
| South South | Delta | 144 | 171 | 45 | 218 | 82 | 859 | 818 | 266 | 718 | 858 | 19 | 572 | 33 | 896 | 781 | 405 | 0 | 23 | 0 | |||||||||||||||||||||
| South South | Edo | 159 | 161 | 53 | 218 | 29 | 876 | 872 | 316 | 395 | 792 | 54 | 762 | 23 | 851 | 67 | 321 | 08 | 19 | 0 | |||||||||||||||||||||
| South South | Rivers | 14 | 128 | 43 | 217 | 99 | 972 | 959 | 272 | 446 | 885 | 266 | 479 | 57 | 921 | 532 | 259 | 64 | 23 | 0 | |||||||||||||||||||||
| South West | Ekiti | 187 | 114 | 5 | 227 | 79 | 949 | 949 | 173 | 384 | 819 | 3 | 752 | 34 | 957 | 762 | 158 | 42 | 14 | 0 | |||||||||||||||||||||
| South West | Lagos | 97 | 111 | 4 | 243 | 53 | 988 | 979 | 496 | 176 | 877 | 18 | 769 | 2 | 98 | 689 | 214 | 76 | 05 | 0 | |||||||||||||||||||||
| South West | Ogun | 318 | 179 | 54 | 218 | 12 | 886 | 884 | 139 | 29 | 919 | 54 | 638 | 04 | 852 | 657 | 30 | 27 | 18 | 0 | |||||||||||||||||||||
| South West | Ondo | 236 | 112 | 49 | 221 | 77 | 924 | 912 | 212 | 345 | 837 | 147 | 469 | 6 | 842 | 744 | 94 | 5 | 29 | 0 | |||||||||||||||||||||
| South West | Osun | 33 | 159 | 4 | 224 | 5 | 966 | 961 | 38 | 183 | 873 | 06 | 851 | 18 | 953 | 653 | 325 | 07 | 1 | 0 | |||||||||||||||||||||
| South West | Oyo | 224 | 146 | 5 | 216 | 197 | 937 | 933 | 219 | 338 | 857 | 105 | 671 | 62 | 933 | 677 | 31 | 38 | 1 | 0 | |||||||||||||||||||||
| North Central | Niger | 683 | 44 | 75 | 193 | 414 | 263 | 259 | 46 | 796 | -633 | 392 | 159 | 186 | 414 | 43 | 309 | 35 | 55 | 1 | |||||||||||||||||||||
| North East | bauchi | 722 | 66 | 81 | 175 | 51 | 70 | 672 | 27 | 811 | 758 | 491 | 13 | 343 | 891 | 165 | 32 | 18 | 178 | 1 | |||||||||||||||||||||
| North East | Borno | 798 | 46 | 71 | 179 | 48 | 547 | 54 | 65 | 864 | 837 | 648 | 118 | 8 | 838 | 273 | 623 | 83 | 348 | 1 | |||||||||||||||||||||
| North East | Gombe | 546 | 61 | 74 | 184 | 465 | 487 | 484 | 56 | 757 | 672 | 405 | 172 | 133 | 732 | 441 | 401 | 02 | 75 | 1 | |||||||||||||||||||||
| North East | Yobe | 77 | 36 | 75 | 177 | 417 | 312 | 285 | 19 | 821 | 699 | 625 | 61 | 173 | 521 | 57 | 546 | 11 | 507 | 1 | |||||||||||||||||||||
| North West | Jigawa | 76 | 73 | 71 | 186 | 45 | 431 | 423 | 02 | 819 | 50 | 787 | 45 | 294 | 968 | 137 | 143 | 104 | 33 | 1 | |||||||||||||||||||||
| North West | Kaduna | 419 | 92 | 63 | 19 | 316 | 839 | 829 | 96 | 747 | 634 | 362 | 184 | 64 | 97 | 481 | 151 | 67 | 33 | 1 | |||||||||||||||||||||
| North West | Kano | 595 | 104 | 81 | 179 | 422 | 47 | 466 | 23 | 617 | 68 | 487 | 111 | 579 | 942 | 62 | 57 | 13 | 27 | 1 | |||||||||||||||||||||
| North West | Katsina | 76 | 51 | 72 | 179 | 65 | 257 | 239 | 08 | 53 | 444 | 828 | 42 | 595 | 839 | 238 | 184 | 68 | 115 | 1 | |||||||||||||||||||||
| North West | Kebbi | 778 | 36 | 6 | 185 | 389 | 18 | 135 | 19 | 773 | 529 | 847 | 48 | 53 | 766 | 133 | 808 | 159 | 68 | 1 | |||||||||||||||||||||
| North West | Sokoto | 835 | 34 | 87 | 179 | 467 | 468 | 445 | 21 | 738 | 556 | 853 | 44 | 252 | 784 | 46 | 448 | 25 | 93 | 1 | |||||||||||||||||||||
| North West | Zamfara | 841 | 18 | 75 | 185 | 47 | 475 | 40 | 25 | 819 | 613 | 855 | 65 | 606 | 696 | 264 | 197 | 225 | 62 | 1 | |||||||||||||||||||||
| 0 | 00000000073 | 0 | 00000001142 | 0 | 00000000141 | 0000000012 | 00000029067 | 00004726093 | 00001914403 | 00000000001 | 00000000504 | 00000004739 | 00046873618 | 0000000001 | 03898156073 | 00307981969 | 00034416604 |
| Nigeria | |||
| Marriage amp Sexual Activity | |||
| Law criminalizing child marriage | |||
| Legal Age of Marriage | 9-18 Depends on state and religion | ||
| Age of capacity to consent to sex | Puberty-18 Depends on state and religion | ||
| Access to SRH services | |||
| Age of consent to aceess contraceptives | No information available | ||
| Is spousal consent required to access any SRH services | Not legally but many providers require it | ||
| Abortion legal | Illegal except to save womans life | ||
| Gender-based violence (GBV) | |||
| Is there a law on GBV | Yes Depends on state | ||
| Is marital rape criminalized | No | ||
| Legal Framework | |||
| Is there implementing legislation for international law | Yes | ||
| UN Conventions Ratified | CEDAWCEDAW Optional Protocol | ||
| CRCCRC Optional Protocols | |||
| Customary amp religious law | Yes |
| 1990 | 1999 | 2003 | 2008 | 2013 | ||||||||||||||||||||||||||||||||||||
| Demographics | ||||||||||||||||||||||||||||||||||||||||
| Taken from 1980 NDSS amp NFS census 1991 census 2006 | Population | 847 | 889 | 1404 | ||||||||||||||||||||||||||||||||||||
| Percet urban | 23 | 363 | ||||||||||||||||||||||||||||||||||||||
| Total fertility rate (per 1000) | 63 | 59 | 57 | |||||||||||||||||||||||||||||||||||||
| Infant Mortality Rate (per 1000) | 85 | 93 | 100 | |||||||||||||||||||||||||||||||||||||
| Life expectancy at birth | 48 | 532 | Any education | 1990 | 1999 | 2003 | 2008 | 2013 | ||||||||||||||||||||||||||||||||
| Education level of female hh (none) | Northeast | 82 | 64 | 68 | 655 | 611 | Northeast | 18 | 36 | 32 | 345 | 389 | ||||||||||||||||||||||||||||
| Northwest | 862 | 646 | 722 | 675 | 628 | Northwest | 138 | 354 | 278 | 325 | 372 | |||||||||||||||||||||||||||||
| Southeast | 431 | 188 | 178 | 208 | 187 | Southeast | 569 | 812 | 822 | 792 | 813 | |||||||||||||||||||||||||||||
| Southwest | 297 | 228 | 233 | 215 | 171 | Southwest | 703 | 772 | 767 | 785 | 829 | |||||||||||||||||||||||||||||
| Southsouth | 206 | 149 | 13 | Southsouth | 794 | 851 | 87 | |||||||||||||||||||||||||||||||||
| Northcentral | 41 | 409 | 393 | 38 | Northcentral | 59 | 591 | 607 | 62 | |||||||||||||||||||||||||||||||
| Education level of female hh (primary) | Northeast | 48 | 144 | 171 | 159 | 167 | ||||||||||||||||||||||||||||||||||
| Northwest | 66 | 115 | 136 | 131 | 158 | |||||||||||||||||||||||||||||||||||
| Southeast | 246 | 445 | 251 | 232 | 22 | |||||||||||||||||||||||||||||||||||
| Southwest | 275 | 366 | 199 | 192 | 195 | |||||||||||||||||||||||||||||||||||
| Southsouth | na | na | 275 | 22 | 224 | |||||||||||||||||||||||||||||||||||
| Northcentral | na | 315 | 272 | 238 | 233 | |||||||||||||||||||||||||||||||||||
| Female by age amp education (none) | 5-9 | 544 | 328 | 459 | 439 | 434 | ||||||||||||||||||||||||||||||||||
| 10-14 | 341 | 20 | 268 | 258 | 259 | |||||||||||||||||||||||||||||||||||
| 15-19 | 336 | 221 | 302 | 241 | 271 | |||||||||||||||||||||||||||||||||||
| 20-24 | 42 | 289 | 339 | 298 | 332 | |||||||||||||||||||||||||||||||||||
| 25-29 | 542 | 319 | 397 | 331 | 376 | |||||||||||||||||||||||||||||||||||
| 30-34 | 711 | 395 | 475 | 373 | 38 | |||||||||||||||||||||||||||||||||||
| 35-39 | 704 | 446 | 498 | 372 | 407 | |||||||||||||||||||||||||||||||||||
| 40-44 | 789 | 562 | 604 | 46 | 427 | |||||||||||||||||||||||||||||||||||
| 45-49 | 847 | 58 | 68 | 549 | 51 | |||||||||||||||||||||||||||||||||||
| 50-54 | 909 | 63 | 763 | 621 | 567 | |||||||||||||||||||||||||||||||||||
| 55-59 | 958 | 728 | 809 | 641 | 644 | |||||||||||||||||||||||||||||||||||
| 60-64 | 963 | 766 | 855 | 695 | 696 | |||||||||||||||||||||||||||||||||||
| 65+ | 952 | 836 | 887 | 779 | 782 | |||||||||||||||||||||||||||||||||||
| Female by Residence amp Education (none) | Urban | 363 | 254 | 319 | 22 | 215 | ||||||||||||||||||||||||||||||||||
| Rural | 652 | 433 | 534 | 489 | 535 | |||||||||||||||||||||||||||||||||||
| Fertility | ||||||||||||||||||||||||||||||||||||||||
| TRF | Northeast | 6532 | 679 | 7 | 72 | 63 | ||||||||||||||||||||||||||||||||||
| Northwest | 6645 | 645 | 67 | 73 | 67 | |||||||||||||||||||||||||||||||||||
| Southeast | 5573 | 464 | 41 | 48 | 47 | |||||||||||||||||||||||||||||||||||
| Southwest | 5461 | 45 | 41 | 45 | 46 | |||||||||||||||||||||||||||||||||||
| Southsouth | 46 | 47 | 43 | |||||||||||||||||||||||||||||||||||||
| Northcentral | 71 | 449 | 57 | 54 | 53 | |||||||||||||||||||||||||||||||||||
| TFR Urban | 503 | 45 | 49 | 47 | 47 | |||||||||||||||||||||||||||||||||||
| TFR Rural | 633 | 544 | 61 | 63 | 62 | |||||||||||||||||||||||||||||||||||
| Median age at first birth by region and age 25-49 | Northeast | 188 | 182 | 178 | 182 | 188 | ||||||||||||||||||||||||||||||||||
| Northwest | 195 | 186 | 178 | 183 | 179 | |||||||||||||||||||||||||||||||||||
| Southeast | 196 | 21 | 227 | 236 | 237 | |||||||||||||||||||||||||||||||||||
| Southwest | 205 | 211 | 221 | 227 | 227 | |||||||||||||||||||||||||||||||||||
| Southsouth | 198 | 214 | 218 | |||||||||||||||||||||||||||||||||||||
| Northcentral | 198 | 197 | 20 | 206 | ||||||||||||||||||||||||||||||||||||
| Ages 15-19 | started childbearing by 15 | 131 | 108 | 75 | 63 | 51 | ||||||||||||||||||||||||||||||||||
| started childbearing by 16 | 208 | 94 | 139 | 13 | 134 | |||||||||||||||||||||||||||||||||||
| started childbearing by 17 | 302 | 264 | 311 | 242 | 226 | |||||||||||||||||||||||||||||||||||
| started childbearing by 18 | 393 | 305 | 342 | 357 | 372 | |||||||||||||||||||||||||||||||||||
| started childbearing by 19 | 428 | 343 | 395 | 384 | 413 | |||||||||||||||||||||||||||||||||||
| started childbearing Northeast | 502 | 513 | 445 | 393 | 321 | |||||||||||||||||||||||||||||||||||
| started childbearing Northwest | 462 | 547 | 452 | 446 | 357 | |||||||||||||||||||||||||||||||||||
| started childbearing Southeast | 167 | 83 | 62 | 81 | 82 | |||||||||||||||||||||||||||||||||||
| started childbearing Southwest | 108 | 79 | 47 | 88 | 82 | |||||||||||||||||||||||||||||||||||
| started childbearing Southsouth | na | na | 143 | 119 | 123 | |||||||||||||||||||||||||||||||||||
| started childbearing Northcentral | na | 176 | 164 | 222 | 188 | |||||||||||||||||||||||||||||||||||
| Fertility Regulation | ||||||||||||||||||||||||||||||||||||||||
| Know modern method | Northeast | 219 | 346 | 608 | 572 | 701 | ||||||||||||||||||||||||||||||||||
| Northwest | 277 | 391 | 718 | 431 | 784 | |||||||||||||||||||||||||||||||||||
| Southeast | 539 | 79 | 845 | 843 | 954 | |||||||||||||||||||||||||||||||||||
| Southwest | 714 | 837 | 965 | 944 | 957 | |||||||||||||||||||||||||||||||||||
| Southsouth | na | na | 933 | 882 | 975 | |||||||||||||||||||||||||||||||||||
| Northcentral | na | 677 | 759 | 632 | 78 | |||||||||||||||||||||||||||||||||||
| Know any method | Northeast | 24 | 354 | 635 | 586 | 732 | ||||||||||||||||||||||||||||||||||
| Northwest | 303 | 422 | 751 | 451 | 811 | |||||||||||||||||||||||||||||||||||
| Southeast | 566 | 816 | 871 | 855 | 959 | |||||||||||||||||||||||||||||||||||
| Southwest | 736 | 872 | 97 | 95 | 964 | |||||||||||||||||||||||||||||||||||
| Southsouth | 942 | 899 | 977 | |||||||||||||||||||||||||||||||||||||
| Northcentral | 70 | 774 | 643 | 786 | ||||||||||||||||||||||||||||||||||||
| Current use of any contraception method (married women) | Northeast | 2 | 31 | 42 | 4 | 32 | ||||||||||||||||||||||||||||||||||
| Northwest | 12 | 32 | 49 | 28 | 43 | |||||||||||||||||||||||||||||||||||
| Southeast | 88 | 235 | 225 | 234 | 293 | |||||||||||||||||||||||||||||||||||
| Southwest | 15 | 262 | 327 | 317 | 38 | |||||||||||||||||||||||||||||||||||
| Southsouth | 254 | 262 | 281 | |||||||||||||||||||||||||||||||||||||
| Northcentral | 178 | 133 | 13 | 156 | ||||||||||||||||||||||||||||||||||||
| Have NOT heard FP message on radio or TV | Northeast | 847 | 863 | 766 | 814 | 807 | ||||||||||||||||||||||||||||||||||
| Northwest | 801 | 744 | 604 | 693 | 734 | |||||||||||||||||||||||||||||||||||
| Southeast | 795 | 612 | 414 | 422 | 565 | |||||||||||||||||||||||||||||||||||
| Southwest | 545 | 38 | 301 | 257 | 289 | |||||||||||||||||||||||||||||||||||
| Southsouth | na | na | 447 | 486 | 552 | |||||||||||||||||||||||||||||||||||
| Northcentral | na | 66 | 697 | 776 | 69 | |||||||||||||||||||||||||||||||||||
| Both partners approve FP | Northeast | 39 | 157 | 18 | ||||||||||||||||||||||||||||||||||||
| Northwest | 345 | 173 | 174 | |||||||||||||||||||||||||||||||||||||
| Southeast | 438 | 43 | 507 | |||||||||||||||||||||||||||||||||||||
| Southwest | 496 | 516 | 606 | |||||||||||||||||||||||||||||||||||||
| Southsouth | na | na | 474 | |||||||||||||||||||||||||||||||||||||
| Northcentral | na | 45 | 406 | |||||||||||||||||||||||||||||||||||||
| Husban disapproves FP | Northeast | 109 | 52 | 114 | ||||||||||||||||||||||||||||||||||||
| Northwest | 62 | 26 | 75 | |||||||||||||||||||||||||||||||||||||
| Southeast | 124 | 97 | 91 | |||||||||||||||||||||||||||||||||||||
| Southwest | 175 | 74 | 115 | |||||||||||||||||||||||||||||||||||||
| Southsouth | na | na | 178 | |||||||||||||||||||||||||||||||||||||
| Northcentral | na | 69 | 11 | |||||||||||||||||||||||||||||||||||||
| Proximate determinants of fertility | ||||||||||||||||||||||||||||||||||||||||
| Married by age | 15-19 | 34 | 244 | 309 | 278 | 282 | ||||||||||||||||||||||||||||||||||
| 20-24 | 708 | 576 | 592 | 571 | 613 | |||||||||||||||||||||||||||||||||||
| 25-29 | 815 | 78 | 803 | 788 | 798 | |||||||||||||||||||||||||||||||||||
| 30-34 | 849 | 847 | 867 | 885 | 866 | |||||||||||||||||||||||||||||||||||
| 35-39 | 837 | 849 | 913 | 904 | 894 | |||||||||||||||||||||||||||||||||||
| 40-44 | 777 | 827 | 876 | 885 | 878 | |||||||||||||||||||||||||||||||||||
| 45-49 | 787 | 756 | 847 | 856 | 839 | |||||||||||||||||||||||||||||||||||
| Never married by age | 15-19 | 614 | 725 | 667 | 706 | 704 | ||||||||||||||||||||||||||||||||||
| 20-24 | 217 | 365 | 361 | 384 | 331 | |||||||||||||||||||||||||||||||||||
| 25-29 | 79 | 13 | 122 | 162 | 141 | |||||||||||||||||||||||||||||||||||
| 30-34 | 09 | 51 | 51 | 58 | 67 | |||||||||||||||||||||||||||||||||||
| 35-39 | 12 | 19 | 17 | 26 | 27 | |||||||||||||||||||||||||||||||||||
| 40-44 | 03 | 13 | 07 | 14 | 15 | |||||||||||||||||||||||||||||||||||
| 45-49 | 01 | 11 | 09 | 08 | 07 | |||||||||||||||||||||||||||||||||||
| Median age at first marraige by region and age less than 50 of women in this group had births so could not calculate | 20-49 Northeast | 152 | 151 | 153 | 156 | 164 | ||||||||||||||||||||||||||||||||||
| 20-49 Northwest | 154 | 147 | 148 | 153 | 154 | |||||||||||||||||||||||||||||||||||
| 20-49 Southeast | 185 | |||||||||||||||||||||||||||||||||||||||
| 20-49 Southwest | ||||||||||||||||||||||||||||||||||||||||
| 20-49 Southsouth | na | na | ||||||||||||||||||||||||||||||||||||||
| 20-49 Northcentral | na | 182 | 182 | 187 | 191 | |||||||||||||||||||||||||||||||||||
| Northeast | 152 | 15 | 15 | 156 | 163 | |||||||||||||||||||||||||||||||||||
| Northwest | 154 | 146 | 146 | 152 | 153 | |||||||||||||||||||||||||||||||||||
| Southeast | 183 | 202 | 218 | 228 | 227 | |||||||||||||||||||||||||||||||||||
| Southwest | 197 | 202 | 213 | 219 | 218 | |||||||||||||||||||||||||||||||||||
| Southsouth | 192 | 209 | 215 | |||||||||||||||||||||||||||||||||||||
| Northcentral | 179 | 177 | 183 | 189 | ||||||||||||||||||||||||||||||||||||
| Fertility Preferences married women | ||||||||||||||||||||||||||||||||||||||||
| Total unmet need for family planning by age | 15-19 | 16 | 148 | 146 | 19 | 131 | ||||||||||||||||||||||||||||||||||
| 20-24 | 146 | 227 | 164 | 214 | 166 | |||||||||||||||||||||||||||||||||||
| 25-29 | 161 | 17 | 171 | 204 | 168 | |||||||||||||||||||||||||||||||||||
| 30-34 | 181 | 179 | 191 | 201 | 171 | |||||||||||||||||||||||||||||||||||
| 35-39 | 239 | 181 | 181 | 213 | 176 | |||||||||||||||||||||||||||||||||||
| 40-44 | 297 | 154 | 193 | 214 | 168 | |||||||||||||||||||||||||||||||||||
| 45-49 | 434 | 119 | 114 | 162 | 115 | |||||||||||||||||||||||||||||||||||
| Total unmet need for FP by region | Northeast | 209 | 122 | 181 | 176 | 175 | ||||||||||||||||||||||||||||||||||
| Northwest | 142 | 244 | 111 | 208 | 12 | |||||||||||||||||||||||||||||||||||
| Southeast | 263 | 209 | 189 | 181 | 125 | |||||||||||||||||||||||||||||||||||
| Southwest | 23 | 157 | 172 | 197 | 154 | |||||||||||||||||||||||||||||||||||
| Southsouth | 245 | 259 | 222 | |||||||||||||||||||||||||||||||||||||
| Northcentral | 163 | 218 | 187 | 235 | ||||||||||||||||||||||||||||||||||||
| Total demand for FP | Northeast | 229 | 153 | 223 | 216 | 207 | ||||||||||||||||||||||||||||||||||
| Northwest | 154 | 276 | 161 | 235 | 163 | |||||||||||||||||||||||||||||||||||
| Southeast | 353 | 444 | 414 | 415 | 418 | |||||||||||||||||||||||||||||||||||
| Southwest | 38 | 419 | 499 | 513 | 535 | |||||||||||||||||||||||||||||||||||
| Southsouth | 499 | 522 | 502 | |||||||||||||||||||||||||||||||||||||
| Northcentral | 341 | 351 | 317 | 391 | ||||||||||||||||||||||||||||||||||||
| Percentage of demand staisfied | Northeast | 88 | 20 | 19 | 187 | 152 | ||||||||||||||||||||||||||||||||||
| Northwest | 79 | 117 | 308 | 117 | 262 | |||||||||||||||||||||||||||||||||||
| Southeast | 254 | 53 | 543 | 563 | 70 | |||||||||||||||||||||||||||||||||||
| Southwest | 395 | 625 | 656 | 617 | 711 | |||||||||||||||||||||||||||||||||||
| Southsouth | 509 | 503 | 559 | |||||||||||||||||||||||||||||||||||||
| Northcentral | 522 | 379 | 41 | 399 | ||||||||||||||||||||||||||||||||||||
| Infant amp Child Mortality | ||||||||||||||||||||||||||||||||||||||||
| Northeast | Neonatal mortality | 392 | 445 | 61 | 53 | 42 | ||||||||||||||||||||||||||||||||||
| Postneonatal mortality | 485 | 349 | 65 | 56 | 33 | |||||||||||||||||||||||||||||||||||
| Infant mortality | 877 | 794 | 125 | 109 | 77 | |||||||||||||||||||||||||||||||||||
| Child mortality | 1392 | 1041 | 154 | 126 | 90 | |||||||||||||||||||||||||||||||||||
| Under-five mortality | 2146 | 1752 | 260 | 222 | 160 | |||||||||||||||||||||||||||||||||||
| Northwest | Neonatal mortality | 578 | 251 | 55 | 47 | 44 | ||||||||||||||||||||||||||||||||||
| Postneonatal mortality | 52 | 575 | 59 | 44 | 46 | |||||||||||||||||||||||||||||||||||
| Infant mortality | 1098 | 826 | 114 | 91 | 89 | |||||||||||||||||||||||||||||||||||
| Child mortality | 1512 | 1151 | 176 | 139 | 105 | |||||||||||||||||||||||||||||||||||
| Under-five mortality | 2444 | 1882 | 269 | 217 | 185 | |||||||||||||||||||||||||||||||||||
| Southeast | Neonatal mortality | 386 | 373 | 34 | 51 | 37 | ||||||||||||||||||||||||||||||||||
| Postneonatal mortality | 441 | 371 | 32 | 44 | 45 | |||||||||||||||||||||||||||||||||||
| Infant mortality | 827 | 743 | 66 | 95 | 82 | |||||||||||||||||||||||||||||||||||
| Child mortality | 665 | 656 | 40 | 64 | 54 | |||||||||||||||||||||||||||||||||||
| Under-five mortality | 1437 | 135 | 103 | 153 | 131 | |||||||||||||||||||||||||||||||||||
| Southwest | Neonatal mortality | 463 | 426 | 39 | 37 | 39 | ||||||||||||||||||||||||||||||||||
| Postneonatal mortality | 383 | 273 | 30 | 22 | 21 | |||||||||||||||||||||||||||||||||||
| Infant mortality | 846 | 699 | 69 | 59 | 61 | |||||||||||||||||||||||||||||||||||
| Child mortality | 903 | 339 | 47 | 32 | 31 | |||||||||||||||||||||||||||||||||||
| Under-five mortality | 1672 | 1015 | 113 | 89 | 90 | |||||||||||||||||||||||||||||||||||
| Southsouth | Neonatal mortality | 53 | 48 | 32 | ||||||||||||||||||||||||||||||||||||
| Postneonatal mortality | 68 | 37 | 26 | Northeast | Neonatal mortality | 392 | 445 | 61 | 53 | 42 | ||||||||||||||||||||||||||||||
| Infant mortality | 120 | 84 | 58 | Northwest | Neonatal mortality | 578 | 251 | 55 | 47 | 44 | ||||||||||||||||||||||||||||||
| Child mortality | 63 | 58 | 35 | Southeast | Neonatal mortality | 386 | 373 | 34 | 51 | 37 | ||||||||||||||||||||||||||||||
| Under-five mortality | 176 | 138 | 91 | Southwest | Neonatal mortality | 463 | 426 | 39 | 37 | 39 | ||||||||||||||||||||||||||||||
| Northcentral | Neonatal mortality | 238 | 53 | 41 | 35 | Southsouth | Neonatal mortality | 53 | 48 | 32 | ||||||||||||||||||||||||||||||
| Postneonatal mortality | 269 | 49 | 37 | 31 | Northeast | Postneonatal mortality | 485 | 349 | 65 | 56 | 33 | |||||||||||||||||||||||||||||
| Infant mortality | 507 | 103 | 77 | 66 | Northwest | Postneonatal mortality | 52 | 575 | 59 | 44 | 46 | |||||||||||||||||||||||||||||
| Child mortality | 355 | 70 | 62 | 36 | Southwest | Postneonatal mortality | 383 | 273 | 30 | 22 | 21 | |||||||||||||||||||||||||||||
| Under-five mortality | 844 | 165 | 135 | 100 | Southeast | Postneonatal mortality | 441 | 371 | 32 | 44 | 45 | |||||||||||||||||||||||||||||
| Maternal amp Child Health | Southsouth | Postneonatal mortality | 68 | 37 | 26 | |||||||||||||||||||||||||||||||||||
| No antenatal care provider | Northeast | 547 | 541 | 471 | 512 | 408 | Northeast | Infant mortality | 877 | 794 | 125 | 109 | 77 | |||||||||||||||||||||||||||
| Northwest | 524 | 651 | 59 | 671 | 554 | Northwest | Infant mortality | 1098 | 826 | 114 | 91 | 89 | ||||||||||||||||||||||||||||
| Southeast | 196 | 77 | 08 | 74 | 42 | Southeast | Infant mortality | 827 | 743 | 66 | 95 | 82 | ||||||||||||||||||||||||||||
| Southwest | 77 | 35 | 23 | 57 | 57 | Southwest | Infant mortality | 846 | 699 | 69 | 59 | 61 | ||||||||||||||||||||||||||||
| Southsouth | 168 | 188 | 206 | Southsouth | Infant mortality | 120 | 84 | 58 | ||||||||||||||||||||||||||||||||
| Northcentral | 202 | 253 | 262 | 26 | Northeast | Under-five mortality | 2146 | 1752 | 260 | 222 | 160 | |||||||||||||||||||||||||||||
| Health facility delivery | Northeast | 104 | 117 | 171 | 128 | 195 | Northwest | Under-five mortality | 2444 | 1882 | 269 | 217 | 185 | |||||||||||||||||||||||||||
| Northwest | 97 | 64 | 104 | 84 | 115 | Southeast | Under-five mortality | 1437 | 135 | 103 | 153 | 131 | ||||||||||||||||||||||||||||
| Southeast | 463 | 549 | 841 | 739 | 781 | Southwest | Under-five mortality | 1672 | 1015 | 113 | 89 | 90 | ||||||||||||||||||||||||||||
| Southwest | 636 | 672 | 776 | 70 | 75 | Southsouth | Under-five mortality | 176 | 138 | 91 | ||||||||||||||||||||||||||||||
| Southsouth | 532 | 481 | 501 | Northeast | Child mortality | 1392 | 1041 | 154 | 126 | 90 | ||||||||||||||||||||||||||||||
| Northcentral | 443 | 454 | 41 | 457 | Northwest | Child mortality | 1512 | 1151 | 176 | 139 | 105 | |||||||||||||||||||||||||||||
| No assistance during delivery | Northeast | 561 | 232 | 198 | 186 | 97 | Southeast | Child mortality | 665 | 656 | 40 | 64 | 54 | |||||||||||||||||||||||||||
| Northwest | 635 | 255 | 305 | 438 | 278 | Southwest | Child mortality | 903 | 339 | 47 | 32 | 31 | ||||||||||||||||||||||||||||
| Southeast | 159 | 23 | 04 | 3 | 15 | Southsouth | Child mortality | 63 | 58 | 35 | ||||||||||||||||||||||||||||||
| Southwest | 157 | 24 | 09 | 32 | 13 | |||||||||||||||||||||||||||||||||||
| Southsouth | 18 | 31 | 18 | |||||||||||||||||||||||||||||||||||||
| Northcentral | 41 | 9 | 102 | 65 | ||||||||||||||||||||||||||||||||||||
| STDs FGM others | na | yes | yes | yes | yes |

THE ROLE OF EDUCATION
Living in a state with customary and religious laws and laws that impede access to sexual and reproductive health services affect education opportunities for women ndash an example
Child marriage Customary law allows marriage of girls between 12 and
15 years the minimum age of marriage can be as low as nine Under Islamic law age of marriage is defined as ldquoage of pubertyrdquo
Among married girls aged 15 to 19 62 have already given birth
Almost 1 out of 4 gave birth before age 15 Only 2 of 15 to 19-year-old married girls are in school
compared to 69 of unmarried girls
Source ReutersA Akinleye
EDUCATION AS A MEDIATOR
1 Living in a state with living with customary and religious laws and laws that impede access to sexual and reproductive health services is a significant predictor or current contraception use amongst married women
(Pearson Correlation = -747) (Linear regression R2=56 F(1 35)=4423 plt00001 βSTATE=-2271 t=-665 plt00001)
2 Living in a state with living with customary and religious laws and laws that impede access to sexual and reproductive health services is a significant predictor of education level
(Pearson Correlation = 901) (Linear regression R2=81 F(1 35)=15083 plt00001 βEDUCATION=4624 t=1228 plt00001)
3 Living in a state with living with customary and religious laws and laws that impede access to sexual and reproductive health services is a significant predictor of education level
(Linear regression R2 = 72 F(2 34) = 4398 plt00001 βSTATE=274 t=43 p=067 βEDUCATION= -55 t=-445 plt00001)
Current contraception
use
Living in a state w
customary laws
Education Level (None)
a b
crsquo
TO CONCLUDE WHY IS THE LAW IMPORTANT
Nigerian states with customary and religious laws and laws that impede access to sexual and reproductive health services have seen fewer if any improvements in womenrsquos health outcomes across the years
Education mediates the relationship between current contraception use amongst married women and living in a state with customary and religious laws
Progress in achieving development goals have been slow and uneven and wide regional differences exist
Customary religious and traditional laws tend to have particular impacts on women and girls and must be addressed
Domestic legal frameworks are largely inadequate in addressing sexual and reproductive health due to loopholes
Social norms and practices are shifting but others continue as part of deep-rooted value systems that subordinate women and girls
Integrated approaches must be developed with the support and knowledge of women and girls and must involve traditional cultural and religious leaders as well as men and boys
- Association between Plural Legal Systems and Sexual and Reproductive Health Outcomes for Women and Girls in Northern Nigeria
- Overview
- Convention on the Elimination of all Forms of Discrimination Against Women (CEDAW) impact on Sexual amp reproductive health
- Plural Legal Systems
- Customary Religious and Traditional LawLegal pluralism permits religious traditional and customary law or practice to trump national legislation through two primary avenues
- Nigeria Legal System
- Nigeria Legal framework
- NIGeRia Laws and policies
- Legal systems amp geography
- Data Sources
- Regional Time trends (1990-2013)
- Fertility
- Family Planning
- Maternal Health
- State-level Time trends (2008-2013)
- State-level Time trends (2008-2013)
- Slide Number 17
- Slide Number 18
- The role of education
- Education as a mediator
- To Conclude Why is the law important
-