association between diet, dental caries and body mass
TRANSCRIPT

__________________________________________________________________________________
Association between diet, dental caries and body mass index
among grade six learners at selected primary schools in Pretoria,
Gauteng province – South Africa
By
Ntombizodwa Rosemary Nkambule
Submitted in partial fulfilment of
the requirements for
the degree
of
Magister Chirurgae Dentium (Community Dentistry)
In the
School of Dentistry
Faculty of Health Sciences
University of Pretoria
November 2017
SUPERVISOR: Prof A Bhayat

` __________________________________________________________________________________
ii
DECLARATION
I declare that every aspect of the dissertation entitled “Association between diet,
dental caries and body mass index among grade six learners at selected primary
schools in Pretoria, Gauteng province – South Africa” was undertaken by me. It has
not been submitted for any degree or examination at any university, and all the
resource materials used and quoted have been duly acknowledged
---------------------------------------------- ------------------
Ntombizodwa Rosemary Nkambule Date
----------------------------------------------- ------------------
SUPERVISOR AND HEAD OF DEPARTMENT Date
Prof. A. Bhayat
Department of Community Dentistry

` __________________________________________________________________________________
iii
DEDICATION
This dissertation is dedicated to the memory of my late mom Florence Radebe for
leaving behind an education foundation seed in me. My late dad Naphtal Radebe for
showing his selfless love, care and raising me alone as a single parent from the age
of eleven years.

` __________________________________________________________________________________
iv
ACKNOWLEDGEMENTS
I wish to express my profound gratitude and thanksgiving to the Almighty God, for
being my Way Maker, Promise Keeper, Light in the darkness and for remaining a
Faithfull God. Provision of an Abundant strength throughout the vigorous journey of
MChD course. My sincere appreciation goes to the following people, without whom
this study would not be possible.
Prof A Bhayat for his role as project supervisor, statistical advisor and for
guiding me each time I got stacked with my writing up
To Dr TK Madiba for assisting with data collection and being my pillar and
strength when the going became tougher throughout this study. Thandi
Madiba, for her constant prayers and support.
Prof OA Ayo Yusuf, for provision of statician certificate and his wife Imade
Ayo Yusuf for her continued support throughout my MChD course
Prof P J Van Wyk, for his continued support, guidance and for opening his
door each time I needed assistance even if he was working part time.
My dearest husband Desmond Nkambule, for being so patient and showing
support throughout the period that I was studying
Warmest regards to my children Siphiwe and Sibusisiwe for enduring my
numerous absences from home, in order to finish this course.
To my uncle, Samuel Thulare whose passion and commitment towards my
higher learning continued to be my source of inspiration.
To my sister Nomahlubi Radebe and all my family members, for the support
and prayers. Finally, I give thanks to all my friends and colleagues who gave
me support and contributed directly and indirectly to completion of my course.

` __________________________________________________________________________________
v
ABSTRACT
Introduction: Childhood obesity and dental caries (DC) have increased worldwide
and are continuing to pose challenges to public health. The increasing risk of obesity
for children is of particular concern because research has suggested that childhood
obesity predicts adult obesity. Children experiencing DC early in their lives have a
much greater probability of subsequent caries in their permanent dentitions and
adulthood. Studies have reported a strong association between the nutritional intake
and DC and reported a direct link between DC, sugar consumption and obesity.
Objectives: to assess the association between dental caries (DC), the Body Mass
Index (BMI) and diet among grade six learners at selected primary schools in
Tshwane West District.
Methods: A cross-sectional analytical study of grade six learners was carried out in
Tshwane. The data collection consisted of a questionnaire, clinical oral examination
and anthropometric measurements. All clinical data was collected by a single
calibrated examiner. A validated questionnaire was used to collect the demographic
data and the type of diet consumed. The SPSS version 23 software was used for
analysis. Descriptive statistics, Chi-Square test to test for significance for categorical
data and logistic regression analysis were used to determine statistical significance.
Results: The response rate was 83% (440) and of these 53% were male. The mean
age of the participants was 11.8yrs. The majority of the participant’s fathers (71%)
and 50% of mothers were employed. The DC prevalence was 43% with a mean
DMFT score of 1.19 (SD= ±1.79). The PUFA score was zero. Less than half (47%) of
the participants reported to brush their teeth twice daily. The majority (71%) claimed

` __________________________________________________________________________________
vi
to drink between one and one and a half glasses of sugar-sweetened beverages
(SSBs) with 67% eating between one and three sweets per day. While most of the
participants reported having a balanced meal at supper, a third reported eating junk
food. The majority (71%) of participants had a BMI score that was within the normal
range with 19% being overweight. There were no significant associations between
the mean DMFT, BMI scores and the SES of the participants.
Conclusion:
The DMFT was low, but the decayed component was relatively high. The PUFA
score was zero. Most participants were classified as having a “normal” BMI with
almost a quarter being classified “overweight”. There were no significant
associations between the DMFT and the mean BMI scores and SES of the learners.
More than half of the participants were from a medium SES and had a slightly high
DMFT score than their counterparts. Less than half reported to brush their teeth
daily, most of them had a balanced diet at supper.

` __________________________________________________________________________________
vii
TABLE OF CONTENTS
DECLARATION ........................................................................................................... ii
DEDICATION ............................................................................................................. iii
ACKNOWLEDGEMENTS .......................................................................................... iv
ABSTRACT ................................................................................................................ v
TABLE OF CONTENTS ............................................................................................ vii
LIST OF TABLES ....................................................................................................... x
LIST OF FIGURES ..................................................................................................... xi
LIST OF ABBREVIATIONS AND ACRONYMS ......................................................... xii
CHAPTER 1: INTRODUCTION .................................................................................. 1
1.1 Introduction and study rationale ........................................................................... 1
CHAPTER 2. LITERATURE REVIEW ........................................................................ 3
2.1 Dental caries: Aetiology ........................................................................................ 3
2.1.1 Prevalence and trends of dental caries in developed and developing countries 4
2.2 Dental caries indices ............................................................................................ 6
2.2.1 DMFT index ....................................................................................................... 6
2.2.3 PUFA Index ....................................................................................................... 9
2.5 Association between diet, DC and BMI .............................................................. 14
CHAPTER 3: METHODOLOGY ............................................................................... 17
3.1. Aim of the study................................................................................................. 17
3.2. Objectives ......................................................................................................... 17

` __________________________________________________________________________________
viii
3.3. Methods ............................................................................................................ 17
3.3.1 Study design.................................................................................................... 17
3.3.2 Study Population ............................................................................................. 17
3.3.3 Study Setting ................................................................................................... 18
3.3.5. Exclusion criteria ............................................................................................ 18
3.4 Sampling ............................................................................................................ 18
3.6 Data capturing and analysis of data ................................................................... 20
3.8. Socioeconomic status (SES) ............................................................................. 21
3.9. Oral hygiene practices ....................................................................................... 21
3.10. Ethical considerations ..................................................................................... 22
CHAPTER 4: RESULTS ........................................................................................... 23
4.1 Response rate and demographic characteristics ............................................... 23
4.2 DMFT ................................................................................................................. 24
4.3 BMI ..................................................................................................................... 26
4.4 Oral health practices .......................................................................................... 26
4.4 Association between dental caries, mean age, BMI, SSBs and sweets ............. 27
CHAPTER 5: DISCUSSION ..................................................................................... 29
5.1 Dental caries prevalence .................................................................................... 29
5.2 Body Mass Index ................................................................................................ 29
5.3 Oral Health Practices ......................................................................................... 30
5.4 Dietary Intake ..................................................................................................... 31

` __________________________________________________________________________________
ix
5.7 Conclusion ......................................................................................................... 33
5.8 Recommendations ............................................................................................. 33
6. REFERENCES ..................................................................................................... 34
Appendix A: Data collection sheet ............................................................................ 47
Appendix B: Assent form .......................................................................................... 50
Appendix C: Consent form ....................................................................................... 51
Appendix D: Referral Letter ...................................................................................... 52
Appendix E: Ethics Clearance certificate .................................................................. 53
Appendix F: Permission from Gauteng Department of Education ............................ 54
Appendix G: Permission from Tshwane West District .............................................. 56

` __________________________________________________________________________________
x
LIST OF TABLES
Table 1. Participant’s demographic characteristics
Table 2. Participant’s socioeconomic status
Table 3. The mean DMFT of the participants
Table 4. Participants diet and oral health practices
Table 5. Association between DCs, mean age, BMI, SSBs and sweets

` __________________________________________________________________________________
xi
LIST OF FIGURES
Figure 1. Distribution of participants according to their BMI classification

` __________________________________________________________________________________
xii
LIST OF ABBREVIATIONS AND ACRONYMS
BMI: Body Mass Index
DC: Dental caries
DMFT: Decayed, Missing, Filled Teeth (for the permanent dentition)
NCOHS: National Children Oral Health Survey
NSNP: National School Nutrition Program
PUFA: Pulpal involvement, Ulceration, Fistula and Abscess
SA: South Africa
SES: Socioeconomic status
SiC: Significant caries index
SSBs: Sugar-sweetened beverages
SM: Streptococcus Mutans
WHO: World Health Organisation
SANHANES: South African National Health and Nutrition Examination Survey

` __________________________________________________________________________________
1
CHAPTER 1: INTRODUCTION
1.1 Introduction and study rationale
Childhood obesity and dental caries (DC) has increased worldwide and is continuing
to pose challenges to public health.1-3 Many studies have demonstrated that excess
weight is associated with precursors of adult illnesses including cardiovascular
disease and type 2 diabetes.4-7 The increasing risk of obesity for children is of
particular concern because research has suggested that childhood obesity predicts
adult obesity.8, 9 South Africa (SA) is reported to have the highest prevalence of
people classified as overweight and obese (29% of men and 56% of women) of all
countries in Africa and so, the need for immediate preventive action is warranted.2, 7
The 2013 South African National Health and Nutrition Examination Survey
(SANHANES-1) reported a high prevalence of overweight and obesity among
children and adolescents, particularly from urban areas.10. The prevalence among 15
to 17 year old girls and boys was 9% and 27% respectively and between 10% and
23% among 10 to 14 year olds.10
Studies have reported a strong association between the nutritional intake and DC
status and reported a direct link between caries, sugar consumption and obesity.2, 3,
11 DC is an infectious and transmissible disease, which is multifactorial and strongly
modified by diet. The process involves a chronic imbalance between multiple risk
factors and protective factors, each of which must instantaneously be present to
initiate and progress the disease.12 These include immunological factors,
fermentable carbohydrates, reduced saliva flow, immature enamel and defects of
tooth tissues.12, 13 The dental hard tissues is destructed by acidic by-products from
bacterial fermentation of dietary carbohydrates.

` __________________________________________________________________________________
2
A decrease in the prevalence of DC has been reported in many developed countries
whilst there has been an increase in the prevalence in some developing countries.14-
16 Children experiencing caries early in their lives have a much greater probability of
subsequent caries in their permanent dentitions and adulthood.17 Untreated caries in
both dentitions is of major concern in developing countries with consequences of
such untreated cases in children found to include delayed physical growth and
development, loss of school days, restricted daily activities and a diminished ability
to learn.18
Several studies have been done on the association between DC and BMI among
children in developed countries while few studies have been done in developing
countries, including SA.3, 19-23 Therefore this study sought to assess the association
between diet, DC and BMI among grade six learners at selected primary schools in
the Tshwane West District.

` __________________________________________________________________________________
3
CHAPTER 2. LITERATURE REVIEW
2.1 Dental caries: Aetiology
DC is an infectious, multifactorial and transmissible disease. DC requires a
susceptible tooth, cariogenic bacteria and specific dietary factors (fermentable
carbohydrates) to initiate and progress. It is influenced by numerous genetic, oral
environment and behavioural risk factors strongly modified by diet.13, 22, 24 The
bacteria implicated in DC are of the group termed Streptococci Mutans (SM) and
they have been shown to have a positive correlation with DC.25, 26 Davies and Wan
et al demonstrated that in the pre-dentate mouth of infants SM is absent, but soon
after eruption of infant’s first primary tooth, the concentration of SM level
increases.27, 28 .It requires a non-shedding surface like enamel to adhere onto and as
a result, once the tooth erupts, the bacteria have an ideal environment to thrive.27
Since SM are found in the mouth, transmission occurs vertically mediated via the
saliva of siblings, caregivers, mothers and guardians serves as a reservoir and it is
how SM is acquired.29 SM is part of the normal flora and as a result cannot be
completely illuminated. However, it can be controlled by adequate oral hygiene,
removal of plaque, reduction of salivary SM in mothers and care givers by providing
education and relevant information during and after pregnancy.
Diet; fermentable carbohydrates and time
There is evidence that sugars and other fermentable carbohydrates (such as highly
refined flour) play a role in the initiation and development of DC. Sucrose, the most
common sugar is the only one, that when metabolized, produces dextran which

` __________________________________________________________________________________
4
promotes superior bacterial adhesion to teeth. Because of this, it is considered the
most important substrate in the establishment of cariogenic bacteria.12 The
frequency of sucrose has been shown to be more important than the total amount
consumed.12, 13. An increased frequency decreases the pH of the oral cavity which
enhances the establishment and the dominance of SM. The duration that the sugar
is in the mouth increases the potential for enamel demineralization and reduces the
time for remineralization by saliva, with the result that demineralization becomes the
predominant mechanism.12, 13 Under-nutrition is associated with enamel hypoplasia
and salivary gland atrophy which increases the risk of DC, and the effect of this is
pronounced during the pre-eruptive stages of tooth development.30 On the other
hand, over-nutrition, manifesting as obesity, has also been associated with DC.31
Another protective factor is saliva, through its special properties compositions of
ions, enzymes, antibodies. pH, flow rate and buffering capacity has been considered
as protective against dental caries.12 The ions include calcium, fluoride and
magnesium, all of which are essential for the remineralisation of the tooth.32 As long
as the saliva is saturated with these ions, it has the ability to remineralize the tooth
and reverse the initiation of early DC. Saliva also has the ability to buffer the pH of
the oral cavity and shift it from an acidic (demineralization) to a basic environment
which promotes remineralisation.32 As a result, the saliva flow and composition is
essential in the prevention of DC. 12
2.1.1 Prevalence and trends of dental caries in developed and
developing countries
Varying prevalence values of DC have been reported in developed and developing
countries for different age groups. Individual studies amongst the 3-6year age group

` __________________________________________________________________________________
5
from 2012-2016 in SA were from Gauteng and Kwazulu Natal (KZN) provinces.
These studies showed the prevalence of dental caries in 3-6 year age group to be
49% for Gauteng and 73% for KZN.72, 79 The last Children Oral Health Survey
(NCOHS) done in SA was from the period 1999-2002. The results from the different
provinces amongst the 3-5year age group showed the following percentages of
prevalence: Gauteng, 49.%, KZN 52%, Western Cape 77%, Eastern Cape 59%,
Free State 60%, North West 41, Mpumalanga 40 and Limpopo 31.73 Comparing the
recent studies with the NCOHS of 1999-2002, the prevalence at Gauteng province
remained the same whilst there has been an increase in prevalence for the KZN
province.72, 79 Other studies from developing countries like Nigeria, Sri Lanka, Brazil
and India reported prevalences ranging from 32% to 44%. Studies from developed
countries like United State of America (USA), Germany, and Italy, reported the
prevalence of DC in 3-5-year olds to be 6%, 9% and 19% respectively. For the ten to
fifteen-year olds, the prevalence of DC in developing countries (SA, Kenya, India and
Qatar) were 40%, 37%, 65% and 85% with an exception of Nigeria reporting a low
(16%) prevalence, whiles in developed countries (Turkey (84%), Germany (55%),
Italy (40%) and Sweden (32%).33-36
In this context, it is critical to determine factors like poverty, lack of oral health
centres that may increase the incidence of DC. Studies conducted in other countries
reported that the prevalence of DC among children has risen according to the
availability or lack thereof of quality food and nutritional education.37

` __________________________________________________________________________________
6
2.2 Dental caries indices
2.2.1 DMFT index
Decayed-Missing-Filled (DMF) Index was introduced by Klein et al in 1938 and
modified by the World Health Organisation (WHO), has been used for more than 70
years and is well established as the key measure of caries experience in dental
epidemiology.38, 39
The DMF index is applied to the permanent dentition and is expressed as the total
number of teeth or surfaces that are decayed (D), missing (M), or filled (F) in an
individual. When the index is applied to teeth specifically, it is called the DMFT index,
and scores per individual can range from 0 to 28 or 32, depending on whether the
third molars are included in the scoring. When the index is applied only to tooth
surfaces (five per posterior tooth and four per anterior tooth), it is called the DMFS
index, and scores per individual can range from 0 to 128 or 148, depending on
whether the third molars are included in the scoring.39
When written in lowercase letters, the dmf index is a variation that is applied to the
primary dentition. The caries experience for a child is expressed as the total number
of teeth or surfaces that are decayed (d), missing (m), or filled (f). The dmft index
expresses the number of affected teeth in the primary dentition, with scores ranging
from 0 to 20 for children. The dmfs index expresses the number of affected surfaces
in primary dentition (five per posterior tooth and four per anterior tooth), with a score
range of 0 to 88 surfaces. Because of the difficulty in distinguishing between teeth
extracted due to caries and those that have naturally exfoliated, missing teeth may
be ignored according to some protocols. In this case, it is called the df index.38, 39

` __________________________________________________________________________________
7
Traditionally, caries has been measured by DMFT/S index, where only teeth or
surfaces with cavitated lesions extending into the dentine have been counted.38, 39
Over the years, DMFT index has been criticized for several reasons.40
(1) diagnosis of caries lesions has been shown to be unreliable,
(2) the reason for extraction for caries is very difficult to confirm at the point of
examination,
(3) secondary caries lesions which are only detectable with radiographs are not
counted,
(4) the activity of the lesions is not determined,
(5) enamel caries lesions are not included,
(6) DMF values are not related to the number of teeth/surfaces at risk,
(7) DMF index gives an equal weight to missing teeth, untreated caries, or restored
teeth,
(8) DMF index can overestimate caries experience by teeth with preventive resin
restorations (PRR) or with cosmetic restorations,
(9) DMFT index is of a little use for estimating treatment needs,
(10) DMF index does not include sealants.
Additional problem with DMFT index has been the skewed distribution of caries
experience, which could be measured by using the significant caries index (SiC).41
If the DMFT score is high, it suggests a higher prevalence of dental caries in which
amongst other contributing factors is nutritional factors. These nutritional factors
include higher levels of consumption of sweetened foods, SSBs, or consumption of

` __________________________________________________________________________________
8
other unhealthy foods.42 Low socio-economic status and low education also
contributed to a higher prevalence of DMFT and poor health.2, 22 Frequent clinical
examination, and routine health care by a dental and other health provider, has been
shown to lower the prevalence of dental caries, as they address factors including
brushing frequency, physical activity, unhealthy diet and quitting unhealthy habits
affecting oral hygiene, including smoking.43 Low DMFT is not as often commented on
in research; much of the research focuses on high DMFT. However, research
available suggests that variables including community water fluoridation and access
to routine health care including preventive programmes like application of sealants
may be a reason for lower mean DMFT scores.44
2.2.2 Significant caries index (SiC)
The SiC index was introduced in 2000 to bring attention to the individuals with the
highest caries values in each population.45 It is calculated by taking the mean DMFT
of the one third of the individuals having the highest of DMFT values in a given
population.46, 47 An analysis conducted by the WHO to report the prevalence of
dental caries using SiC index, found that there was a skewed distribution of caries
prevalence in many countries and there was a significant proportion of 12-year-olds
that had high or even very high DMFT values even though a proportion was totally
caries free.46 This polarization of the caries picture had the effect of making the
mean DMFT value less meaningful as a population descriptor in that it does not
accurately reflect the burden of disease.48 Thus it may lead to the incorrect
conclusion that the prevalence of caries in the population is relatively low, whereas in
reality population subgroups still suffer from high caries rates.44 The use of the SiC
index might solve the problem related to skewed caries distribution.48

` __________________________________________________________________________________
9
2.2.3 PUFA Index
DMFT/dmft index has been used worldwide to collect prevalence data on DC for so
many decades, however, this cumulative index fails to provide information on the
clinical consequences and severity of untreated dental caries. The severity of DC
manifests itself in the involvement of the pulp and the development of abscess,
which is more jeopardous than the carious lesion itself.
To determine the severity and extensiveness of oral conditions that result due to
untreated dental caries, the PUFA index was developed.49 When used in conjunction
with DMFT index, it helps in projecting the clinical consequences of untreated
carious lesions.50 The PUFA index records the presence of grossly decayed teeth
with, P/p: visible pulpal involvement, U/u: ulceration due to trauma from tooth
fragments, F/f: fistula and A/a: abscess. Uppercase letters are used for the
permanent dentition and lowercase letters used for the primary dentition. The PUFA⁄
pufa score per person is calculated in the same cumulative way as for the
DMFT⁄dmft and represents the number of teeth that meet the PUFA⁄ pufa diagnostic
criteria. The PUFA for permanent teeth and pufa for primary teeth are reported
separately.49
A study conducted in West Rand, SA among four to five and six to eight-year-old
reported the prevalence of pufa to be 49% and 46% respectively. These meant that
for the four to five-year olds, more than one in three children presented with pulpitis,
ulceration, fistular or abscess and for the six-year-old the figure was almost one in
2.5 children. The Pufa scores implied that more advanced treatment options such as
endodontics, pulpotomy, or pulpectomy were to be considered if more teeth were to
be saved from extraction.51 Studies done in Pakistan and India reported the

` __________________________________________________________________________________
10
prevalence of PUFA be 49% indicating half the decay had progressed to involve the
pulp.52, 53 This implies the cost implication that may be needed to save those teeth
which could be underestimated by the low DMFT prevalence. Untreated dental
caries may result in a higher risk of hospitalisation, loss of days at school with
diminished ability to learn and poor child development.54, 55
2.3 Diet and dental caries in rural and urban areas
Empirical data exists demonstrating that dietary sugar and increased carbohydrate
consumption has a negative impact on health including an increase in the BMI and
increased risk for DC37, 56. In rural areas, the risk for consumption of sugar may be
reduced, depending on the level of agricultural investment and fresh produce
available to children and adults living in these areas. 57 In urban areas, particularly in
regions where individuals experience high rates of income, the risk for consumption
of sugary sweets and other unhealthy foods increase. This could lead to the
development of DC if good oral hygiene habits are not practiced.37 Urban areas are
characterized by markedly different food supply environments. Options for eating
outside of the house or buying processed or prepared food are more abundant in
urban areas, in part because food-manufacturing sectors are often based nearby.58
Moreover, the ongoing expansion of supermarket and fast food chains in the
developing world is still mainly concentrated in urban areas.59 Urbanization also
coincides with increases in wealth, which in turn can be expected to significantly
change dietary patterns.60

` __________________________________________________________________________________
11
2.4 Prevention and management of dental caries
Prevention and management of caries occurs at the individual, professional and/or
community levels. Identification of the groups at risk is important since the disease is
widespread but not uniformly distributed.61 Observing good dental hygiene and
control of consumption of the cariogenic sticky foods are the initial approach in the
prevention of caries. Dental restoration, endodontic treatment and extraction is
needed when caries have progressed to destroy the tooth structure. For Prevention
the use of fluoride containing toothpaste, topical application of fluoride vanishes and
placement of fissure sealants is recommended.
2.5 BMI
BMI is a widely used screening tool to estimate individual’s total amount of body fat,
based on two anthropometric parameters, height and weight.62 It is calculated by
dividing the weight in kilograms by height in metres squared (m). Differences in BMI
between people of the same age and gender are usually due to body fat. However,
there are exceptions to this rule, which means a BMI figure may not be accurate.62
Since the calculation requires only height and weight, it is inexpensive, easy to use
for clinicians, general public and children do not find it uncomfortable.
2.5.1 BMI and children
The healthy BMI range for adults is 18.5 to 24.9. However, children are constantly
growing, which makes it difficult to have set values for BMI cut-offs. For adults who
have stopped growing, an increase in BMI is usually caused by an increase in body
fat. But as children grow, their amount of body fat changes and so will their BMI. For
example, BMI usually decreases during the preschool years and then increases into

` __________________________________________________________________________________
12
adulthood. For this reason, a BMI calculation for a child or adolescent is interpreted
differently from an adult’s and takes into account the age and sex of the child or
adolescent.63
Some exceptions to the BMI rule
BMI does not differentiate between body fat and muscle mass. This means there are
some exceptions to the BMI guidelines, including:
Muscles – body builders and people who have a lot of muscle bulk will have a high
BMI, but are not overweight.
Physical disabilities – people who have a physical disability and are unable to walk
may have muscle wasting. Their BMI may be slightly lower, but this does not
necessarily mean they are underweight
Height – BMI is not totally independent of height and it tends to overestimate obesity
among shorter people and underestimate it among taller people.
People of different ethnic groups – Asians and Indians, for example, have more
body fat at any given BMI compared to people of European descent. Therefore, the
cut-offs for overweight and obesity may need to be lower for these populations.63
The WHO has developed recommendations on the reference values (cut-off points),
to classify the weight condition of individuals into underweight, normal, overweight
and obese. A healthy BMI range is between 19 and 25, and a BMI between 25 and
29 is considered moderately overweight and over 29 indicates obesity for adults. For
children the following categories are used; underweight (<13.25 kg/m2), normal
(13.26-18.59 kg/m2), overweight (18.60-21.59 kg/m2) and obese (≥21.60 kg/m2).64, 65
These universal cut-off points for BMI of classified as overweight and obese

` __________________________________________________________________________________
13
correlate with body fat and with cardiovascular risk factors and the probability to
acquire diabetes. It is known that diabetes is only a possible consequence, among
many other disorders, associated with obesity, which has increased its prevalence
worldwide among young population in recent years and it has been recognized as
epidemic in almost all countries.66 Being overweight or underweight can affect an
individual’s health.66
If an adult person is overweight (with a BMI over 25) and physically inactive, they
may develop: cardiovascular (heart and blood circulation) disease, gallbladder
disease, high blood pressure (hypertension), type 2 diabetes, osteoarthritis, certain
types of cancer, such as colon and breast cancer, depression and other mental
health disorders. If an adult person underweight, (BMI less than 18.5), they may be
malnourished and develop compromised immune function, respiratory disease,
digestive diseases, cancer and osteoporosis.66
Contributing factors
There are numerous factors that can influence body weight. The individual has no
control over some of these factors, including developmental determinants, genetic
makeup, gender and age. Other factors that influence body weight over which the
individual has potential control include educational background, socioeconomic
status, cultural and some environmental and social factors.67
Eating habits of individuals, duration and the frequency of food consumption also
has an effect on body weight.68 A high-energy intake or an energy intake that is not
adjusted downward with declining physical activity or age-related decreases in lean
body mass is associated with the development of overweight or obesity in
susceptible individuals. High-fat diets may promote increased energy intake or may

` __________________________________________________________________________________
14
be associated with metabolic changes that promote the deposition of adipose
tissue.68 BMI does have limitations in its ability to assess adiposity. It has long been
recognized that elevation of BMI does not always equate to increased adiposity.68
Because it is a weight-for-height measure, BMI does not distinguish between fat
mass and lean body mass. Thus, individuals with increased muscle mass may also
have increased BMI.68
As previously mentioned SA battles with an increase in prevalence of obesity and
hence measuring BMI in a school setting will assist identifying those children at high
risk and therefore allow for early intervention.69, 70
2.5 Association between diet, DC and BMI
Evidence of the association between the nutritional status and DC is inconsistent.
While some studies have reported a positive correlation between caries and obesity,
others have shown that underweight children tend to have a higher prevalence of
caries compared to their overweight counterparts.2, 11 Globally DC affects 600 million
children and adolescents while the prevalence of obesity ranged between 8% and
24%.71, 72 Studies suggest that both contribute to significant health expenditures.73, 74
For example, the annual cost of obesity in Australia was recently quoted as high as
$58.2 billion Australian dollars, with obesity and overweight considered among the
three highest contributions to disability and poor quality of life.73 Dental disease is
also increasingly costly, with expenses rising as high as six to fourteen percent of
current healthcare expenses.73, 74 Obesity is also a multifactorial disorder, influenced
by environmental and genetic risk factors, where a sustained imbalance between
energy intake and energy expenditure facilitates storage of excess energy as fat.75
Diet is a primary determinant of obesity. Consumption of energy-dense low nutrition

` __________________________________________________________________________________
15
foods, which tend to be high in saturated fats and sugars, and low fruit and vegetable
consumption have been linked with increased weight gain and obesity.76-80 Poor diet
can also impact negatively on health through effects on immune functioning, growth,
development, ageing and oral health. Poor oral health is typified by the onset of DC,
presently the most common chronic disease found in children.81 Children with caries
may present with pain and ultimately tooth loss. This could result in a reduction in
food intake, which in turn may lead to stunted growth.64 On the contrary, an increase
consumption of fermentable carbohydrates can result in an increase in both weight
and in the prevalence of dental caries.82 Alswat et al., reported a positive association
between DC and BMI, whilst Bhayat et al., and Frias-Bulhosa et al., reported a non-
significant association.43, 83, 84 Although the eating pattern among overweight and
obese children may represent a risk of dental caries, systematic reviews has
revealed contradictory results, mainly in paediatric populations.22, 85-87
A systematic review by Kantovitz et al., (2006), which focused on obesity and dental
caries studies among all age groups. Out of 33 papers only 7 met the inclusion
criteria.86 Of these, one study by Willerhausen et al. (2004) showed that children with
normal weight had significantly less caries than overweight children.88 However, the
Willerhausen et al. studies used BMI scores which are not as meaningful as BMI-for-
age percentiles in growing children and adolescence.89 BMI can be interpreted using
WHO categories for growing children and adolescents.90 It has been used in the
past and has been proven to be a reliable and accurate classification of normal,
underweight, overweight and obese individuals.39
A recently published systematic review of studies done between 2004-2011 reported
that two studies had found overweight and obese adolescents to have more caries

` __________________________________________________________________________________
16
than normal-weight individuals. Out of 47 studies, only two had associated
overweight and obese with dental caries.22 One study concluded that only 12-year-
old children with caries was associated with high BMI and the other reported an
association only in the primary dentition.22 These inconsistencies may be caused by
differences in study design, study location, methods of assessment of nutritional
status and of DC, and the age of the participants and their socio-economic
background.91 The review also reported that high BMI was associated with high
caries experience in developed, industrialised countries but not in developing, newly
industrialised countries such as Brazil, India and Thailand.2 This might be due to
increased affluence and access to high caloric carbohydrate-rich foods and drinks,
increasing consumption of animal products and refined foods at the expense of
vegetables and fruits and lack of physical activity.
Although there is still no consensus on the association of BMI and DC, from the
literature, there is enough evidence on dietary factors that can lead to an in increase
in BMI and development of caries

` __________________________________________________________________________________
17
CHAPTER 3: METHODOLOGY
3.1. Aim of the study
The aim of the study was to determine the relationship between diet, dental caries
and the BMI among grade six learners at selected primary schools in Tshwane West
District, Pretoria.
3.2. Objectives
There were two key objectives in this study:
A. To determine the;
1. Dental caries prevalence and severity using the DMFT and PUFA indices
respectively
2. Body mass Index, and
3. Association between diet, DC and BMI
B. To assess the diet and oral health practices of the children in this study cohort
3.3. Methods
3.3.1 Study design
A quantitative cross sectional analytical study design was used.
3.3.2 Study Population
The study was conducted amongst all grade six learners enrolled at the selected
public primary schools in Tshwane West District, Pretoria

` __________________________________________________________________________________
18
3.3.3 Study Setting
Four public primary schools located in Tshwane West district, Pretoria were selected
using a convenience sampling strategy. All schools were classified as quintile 1-3,
according to Department of education, which denotes low SES. These schools are
non-paying fee, learners qualify to eat in a National School Nutrition Program
(NSNP), and learners are provided with school uniform if parents cannot afford to
buy it.
3.4 Inclusion criteria
All learners who were enrolled in grade six for the year 2017. The oral health of
children 12 years old is the object of several epidemiological studies conducted
around the world. According to the World Health Organization (WHO, 1997), the
importance given to this age group is due to the fact that it is this age that children
leave primary school.39 Thus, in many countries, is the last age at which data can be
easily obtained through a reliable sample of the school system. Moreover, it is
possible that at this age all the permanent teeth except third molars, have already
erupted. In this study the majority of 12 year olds were found to be at grade six
3.3.5. Exclusion criteria
Grade six learners who did not give consent. Learners who were enrolled from grade
1 to 5, and grade 7 for the year 2017.
3.4 Sampling
The sample size was calculated from a total population of 11265 grade 6 learners
who were enrolled for 2016 at all public primary schools in Tshwane West District.
` __________________________________________________________________________________
19
Assuming the prevalence of obesity to be 23%75 with a confidence level of 95% and
a marginal error of ± 0.05, a minimum sample size of 372 learners was required.
Tshwane West district has 93 primary schools, which were clustered into four areas
(North, South, West and East) according to geographic location. One school was
selected from each cluster using a convenience sampling technique. On average,
the numbers of learners per school ranged between 94 and 130. Five hundred and
twenty nine assent and consent forms were distributed, 440 were signed and
returned. A Kappa score of 0.85 and 0.90 was obtained prior and during the study
respectively to ensure intra examiner reliability.
3.5 Data collection tools
The data collection consisted of three parts: a questionnaire for diet and
demographics, a clinical oral examination and the recording of the anthropometric
scores (Appendix A). The questionnaire was developed based on previous studies
and modified to suit the environment of this study.83, 92 Two researchers administered
the questionnaire. All the oral examinations was performed by a single calibrated
dentist in a classroom under natural light with the participant sitting on a school chair.
The primary dentition was excluded because at 12 years of age 90% of primary teeth
had already exfoliated. Only teeth with cavitated caries was diagnosed as decayed
while those with early white spot lesions or fissure sealants were recorded as sound.
The World Health Organization (WHO) criteria was used to assess the caries status
using DMFT and PUFA indices.39 According to WHO, caries experience in 12 year
old is classified into 5 categories; very low<1.2, low 1.2-2.6, moderate 2.7-4.4, high
4.5-6.5 and very high > 6.5.39 For this study the categories were classified into
three;(no caries = 0, low caries = 0.1- 2.6, and moderate ≥ 2.7) for ease of analysis.

` __________________________________________________________________________________
20
The learners were assured that the natural light would not harm them nor cause any
injury, side effect during and or after the examination period. The PUFA index was
used to measure the severity of the DC. A single operator recorded height and
weight and this was used to compute the BMI (weight in kilograms divided by height
in metres squared (kg)/ m2). The height of children, standing upright without shoes,
was measured with a portable stadiometer to the nearest 0.5 cm. Weight was
recorded with a calibrated portable electronic digital scale to the nearest 0.5 kg. A
stadiometer and digital scale was recalibrated each day before data collection. No
adjustments were made for clothing, but children were requested to remove shoes,
jackets and jerseys prior to measuring the weight.
3.5.1 Calibration and training
In order to obtain an acceptable level of reliability, one examiner was calibrated to
record the caries status. Calibration for the recording of caries was done using slides
and mounted extracted teeth and a Kappa scores ranging from 0.85 and 0.90 was
obtained prior and during the study and considered acceptable for intra-examiner
reliability, respectively. Every tenth learner was re-examined to ensure intra-
examiner reliability. Only one examiner recorded the weight and height of the
learners and for every tenth learner the weight and height was re-recorded to ensure
reliability
3.6 Data capturing and analysis of data
The data was captured using Microsoft Excel and imported into SPSS version 23 for
analysis. Descriptive statistics including the percentages, means and standard
deviations was performed. Inferential tests such as Chi-Square test to test for

` __________________________________________________________________________________
21
significance for categorical data between the different BMI and DMFT groups and
Kruskal-Wallis test for comparing continuous data was used. Linear regression
analysis was used to assess significance levels after controlling for possible
confounding variables.
3.7. Reporting of findings to study subjects
Parents or legal guardians of all learners examined were notified of their child’s oral
health status, including presence of caries. If treatment was required, a referral letter
was given to them. (Annexure B)
3.8. Socioeconomic status (SES)
After thorough review of the literature, various questions were developed and
modified to suit the current study. Data was categorized for comparison between
various variables for ease of analysis. Socioeconomic status was determined by
scoring the parents employment status, last school grade, owning DSTV and home
type. High scores were given for parents who were employed, those with a high
education, those who owned a DSTV and those living in a home rather than a shack
or flat. The total score was categorised into low, medium and high with the highest
score referring to high SES.
3.9. Oral hygiene practices
The participants received a 15-minute presentation regarding oral hygiene practices
and healthy eating habits after data collection to modify their oral healthcare
knowledge and practices. They were shown how to brush and floss their teeth and
all participants received pamphlets containing information on brushing and oral
hygiene practices, a toothbrush and a toothpaste.

` __________________________________________________________________________________
22
3.10. Ethical considerations
Ethical clearance and permission to conduct the study was obtained from the
University of Pretoria, Research Ethics Committee of the Faculty of Health Sciences
(442/2016) (Appendix E), assent form (Appendix B), consent form (Appendix C),
Gauteng Department of Education (Appendix F) and the manager at Department of
Education, Tshwane west district (Appendix G). All information was strictly
confidential.
` __________________________________________________________________________________
23
CHAPTER 4: RESULTS
4.1 Response rate and demographic characteristics
A total of 529 consent and assent forms were distributed to grade six learners at the
four-selected public primary schools located in Tshwane West district. Of these, 440
(83%) learners returned the signed consent forms and were included in the study.
Those who did not have signed consent forms or who were absent on the day of the
clinical examination were excluded from the study. The demographic information is
summarized in (Table 1). The mean age of the participants was 11.8yrs (SD=
±0.98yrs; range 10-15years) and more than half (53%) were males. Some of the
learners did not know the employment status or the last school grade that their
parents had passed and as a result, they were not included in the analysis. The
majority (71%) of fathers and half (50%) of the mothers were employed. Most of the
parents completed high school. Almost two thirds (60%) were classified as being
from a medium SES, whilst 30% were classified as being from a high SES. (Table 2)

` __________________________________________________________________________________
24
Table 1. Participant’s demographic characteristics
Table 2. Participant’s socioeconomic status (SES)
Category N %
Low 40 (10)
Medium 266 (60)
High 134 (30)
Total 440 (100)
4.2 DMFT
The prevalence of DC was 43% (189/440) with a mean DMFT score of 1.19 (SD=
±1.79). The mean D component was significantly higher (p=0.00) compared to the M
and the F. The mean decayed component comprised 90% of the mean DMFT score
with the remainder comprising of both missing and filled at 5% respectively. Although
there was no statistical difference between the males and females (p=0.31) with
Gender (%) Mean age in years (±SD) Mean age (±SD)
Female 207 (47) 11.61 (±0.93) 11.8 (±0.98)
Male 233 (53) 11.93 (±1.01)
Mother (n=420) (%) Father (n=381) (%)
Employed
208 (50)
Unemployed
212 (50)
Employed
273 (72)
Unemployed
108 (28)
Mother (n=272) (%) Father (n=219) (%)
Primary
school
9 (3)
High
school
234 (86)
Tertiary
29 (11)
Primary
school
9 (4)
High
school
186 (85)
Tertiary
24 (11)
` __________________________________________________________________________________
25
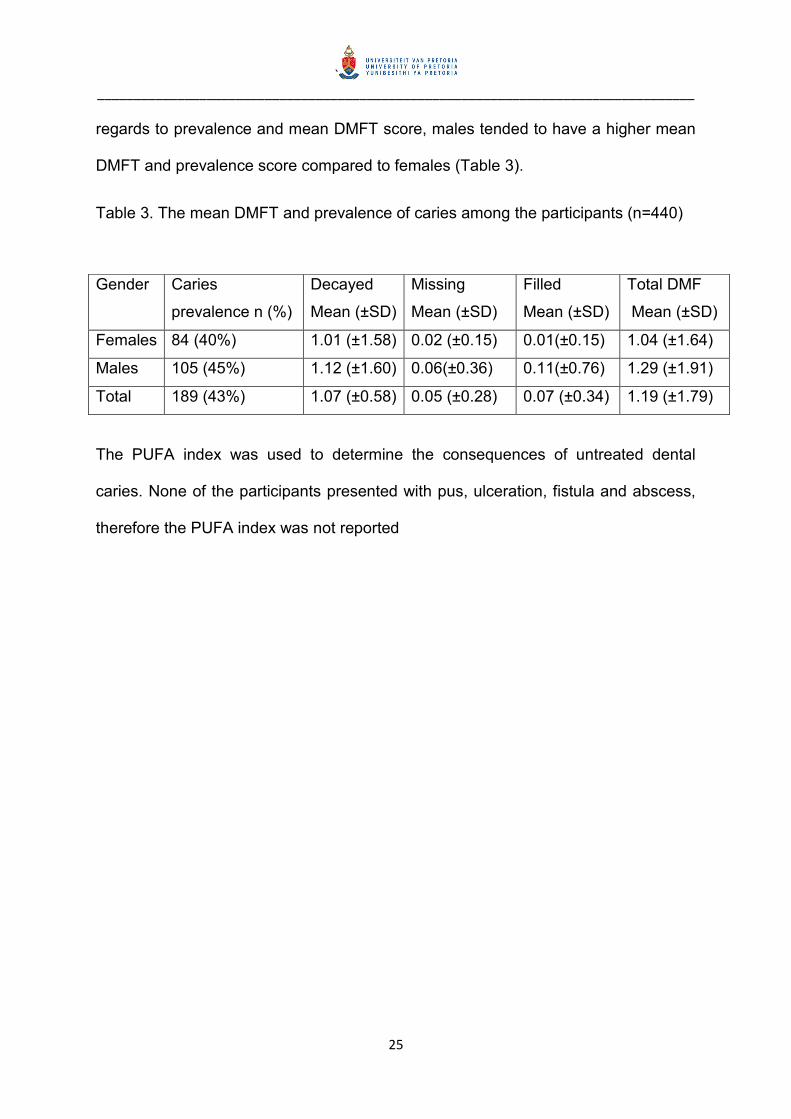
regards to prevalence and mean DMFT score, males tended to have a higher mean
DMFT and prevalence score compared to females (Table 3).
Table 3. The mean DMFT and prevalence of caries among the participants (n=440)
The PUFA index was used to determine the consequences of untreated dental
caries. None of the participants presented with pus, ulceration, fistula and abscess,
therefore the PUFA index was not reported
Gender Caries
prevalence n (%)
Decayed
Mean (±SD)
Missing
Mean (±SD)
Filled
Mean (±SD)
Total DMF
Mean (±SD)
Females 84 (40%) 1.01 (±1.58) 0.02 (±0.15) 0.01(±0.15) 1.04 (±1.64)
Males 105 (45%) 1.12 (±1.60) 0.06(±0.36) 0.11(±0.76) 1.29 (±1.91)
Total 189 (43%) 1.07 (±0.58) 0.05 (±0.28) 0.07 (±0.34) 1.19 (±1.79)

` __________________________________________________________________________________
26
4.3 BMI
The mean BMI was 17.74 (±3.00) kg/m2. The majority (71%) of participants had a
BMI score that was within the normal range with 19% being overweight (figure 1).
Figure 1. Distribution of participants according to their BMI classification (n=440)
There were no significant associations between the mean DMFT (p=0.51) and BMI
(p=0.20) scores and the SES categories of the participants (Anova test). While there
was no significant association, participants from medium SES tended to have a
higher DMFT than their counterparts.
4.4 Oral health practices
Less than half (47%) of the participants reported to brush their teeth twice daily. The
majority (71%) claimed that they drank between one and one and a half glasses of
sugar sweetened beverages (SSBs) daily and more than half 67% reported to eat

` __________________________________________________________________________________
27
one to three sweets per day. Regarding the type of meals, half reported to eat only
starch (e.g soft porridge and bread) for breakfast. For lunch and supper, the majority
consumed a combination of starch (pap, potatoes and rice) and proteins (beef meat,
fish and cheese) and almost a third reported to eat junk food (atchar, fried potato
fries and, bread) during lunch. (Table 4)
Table 4. Participants diet and oral health practices
Brushing teeth (n= 434) N (%)
Once a day 159 (37)
Twice a day 203 (47)
More than twice a day 72 (17)
Number of glasses of sugar sweetened beverages consumed (n = 435)
1 to 1.5 glasses 307 (71)
2 and more glasses 128 (30)
Number of sweets consumed (n= 395)
1 to 3 sweets 264 (67)
4 or more sweets 131 (33)
Meals Starch Proteins Combination Junk
Breakfast (n= 373) 185(50) 4 (1) 172 (46) 12 (3)
Lunch (n = 430) 98 (23) 5 (1) 203 (47) 124 (29)
Supper (n=436) 14 (3) 2 (1) 415 (95) 5 (1)
4.4 Association between dental caries, mean age, BMI, SSBs and
sweets
The participants with a moderate DMFT were significantly more likely to be older,
had a higher BMI and consumed more SSBs compared to those with no or low
DMFT scores (Table 5).

` __________________________________________________________________________________
28
Table 5. Association between dental caries, mean age, BMI, SSBs and sweets
*Level of significance at p<0.05
DMFT Age years
mean
(±SD)
p-
value
BMI
mean
(±SD)
p-
value
SSBs
mean
(±SD)
p-
value
Sweets
mean
(±SD
p-
value
No caries
(DMFT=0)
11.69
(±0.96)
0.00*
17.70
(±3.20)
0.56
1.48
(±0.89)
0.34
2.59
(±2.11)
0.01*
Low caries
(DMFT=0.1-2.6)
11.69
(±0.97)
17.50
(±2.35)
1.54
(±0.77)
3.44
(±2.74)
Moderate
(DMFT ≥2.7)
12.13
(±0.98)
18.00
(±3.58)
1.64
(±1.15)
3.19
(±3.44)

` __________________________________________________________________________________
29
CHAPTER 5: DISCUSSION
5.1 Dental caries prevalence
The caries prevalence in the current study was 43% with a mean DMFT score of
1.19 which is considered “low” by the WHO. Although considered low, the decayed
component made up 90% of the DMFT score. This was similar to other studies done
both in South Africa and in other developing countries which ranged between 83%
and 96%.93-98 This high proportion of unrestored teeth in developing countries could
be due to a lack of public oral health facilities and resources (dental restorative
materials, personnel, dental equipment etc.) which could lead to an overburden of
the current structures.99 This often results in dental personnel not being able to
provide restorative and preventive dental services. Furthermore, lack of dental
awareness and low priority placed on oral health care compared with other needs
could be responsible for not restoring teeth.97, 99 Another reason could be due to
accessibility to oral health service due to either lack of transport, bad roads and cost
of transport.
5.2 Body Mass Index
BMI has been widely used in the field of dentistry, especially in studies related to
obesity and DC.100 About 71% of the current study participants had a BMI score
within the “normal range” while 19% were “overweight”. This was similar to other
studies that reported that 88% and 78% had normal weight and between 3% and
19% being overweight (Nigeria and India respectively).18, 101 The prevalence of
overweight in these studies was higher than the global prevalence in children aged
5-17 years as estimated by the WHO to be approximately 10%102. However, authors

` __________________________________________________________________________________
30
agree that the WHO value is unequally distributed due to the combination of first,
third world countries, and the combination of the various ages of participants. In this
study, only 1% of the participants were categorised as underweight compared to a
2005 study, which showed that the school age children showed signs of nutritional
problems in the form of stunting (18%), wasting (4%) and overweight (6%).103 The
reason might be that many children were now receiving fruit and vegetables through
NSNP, and an increase in the average meal cost allowance per student per day and
the addition of a guideline to allow for fresh vegetables or fruit to be served daily.104
There were no differences in BMI of the participants in relation to parental
employment status and parental level of education. The reason might be that the
NSNP could be reducing the disparity between the children who would normally
bring food and those who would not afford it.
5.3 Oral Health Practices
Less than half (47%) of participants reported to brush twice daily with a fluoride
toothpaste and this has been widely promoted by the dental profession since it plays
a pivotal role in the prevention and control of DC.24, 105
This was similar to a Chinese study which reported 44% of school children brushed
their teeth twice a day.106 Possible reasons for the low rate of frequent brushing in
this current study could be attributed to the low SES of the participants. The schools
where the study was performed were classified as quintile 1-3, which denotes low
SES, and this meant that most learners were from a low SES. The purchase of
toothpaste might not be a first priority for the participant’s parents. Additionally, it
might be lack of knowledge from both parents and participants.

` __________________________________________________________________________________
31
5.4 Dietary Intake
The majority (67%) of participants ate between one and three sweets per day and
this could be as a result of easy access to shops that were located around all the
schools that were visited. This was in contrast to a study done in China where almost
70% of school learners consumed more than 4 sweets per day.106 This could be due
to lack of knowledge about the danger of consumption of sweets and that the sweets
that are sold at the school are considered to be cheaper than nutritious food in the
current study. Almost all of the participants (96%) reported to eat breakfast, which
consisted of starch and proteins. In SA, the staple food is mealie-meal, which is
composed of starch. Most households have mealie meal, which can be served as
soft porridge. During lunch, less than half (47%) ate a combination of starch and
proteins while 29% reported eating junk food. Participants that ate lunch provided by
the National School Nutrition Program (NSNP) are served a balanced meal
prescribed by the dietitian according the SA basic education policy, whilst those that
were not participating in the NSNP could have been eating junk food that was
purchased from the school vendors or brought it from home.107, 108 For supper, the
majority (95%) ate a combination of starch and proteins. The reason might be that
this could be the only time parents of the participants are able to get to prepare a
balanced nutritious meal and at that time most of the participants are at home
because of fear of danger to be at the streets at night. Also, it could be only time
where all family members are present.

` __________________________________________________________________________________
32
5.5 Diet, DC and BMI
Older participants were more likely to have a higher prevalence of DC as compared
to younger participants. The possible reason could be that teeth were present in the
mouth for a longer period in the older participants and therefore were exposed to risk
factors like SSBs and sweets. Similar to other studies, there was a statistically
significant association between the DMFT score and the number of sweets eaten
daily.109 Those with moderate DMFT scores consumed more sweets and SSBs
compared to those with no or low DMFT scores. Although there was no significant
association between the DMFT score and the BMI, those with moderate caries were
more likely to have a higher BMI. This could be as a result of consuming junk foods
such as fried food loaded with fat and refined carbohydrates as reported in the diet
analysis. There was no statistical significance between SES, DMFT and BMI. This
could be due to the sample of this study being similar in socioeconomic status.
5.6 Limitations
Only self-reported qualitative and not quantitative analysis of diet was done. This
might be a reason why findings reported a weak association between DC, diet and
the BMI. Another limitation could be response bias because the data was collected
by using an interview method and participants may have been reluctant to answer
honestly. Additionally, although the employment status was reported, participants at
that age were not aware of their parent’s employment status and educational levels.
The study also did not include the salary of the parents.
` __________________________________________________________________________________
33
5.7 Conclusion
The DMFT was low, but the decayed component was relatively high. The PUFA
score was zero. Most participants were classified as having a “normal” BMI with
almost a quarter being classified “overweight”. There were no significant
associations between the DMFT and the mean BMI scores and SES of the learners.
More than half of the participants were from a medium SES and had a slightly high
DMFT score than their counterparts. Less than half reported to brush their teeth
daily, most of them had a balanced diet at supper.
5.8 Recommendations
Primary schools should be used to promote oral health by provision of oral health
education and by highlighting harmful dietary practices. Harmful dietary practices
must not only be taught to learners but the schools should take a step further by
regulating the type of food sold at the cafeteria and with vendors outside the school
premises. This will assist learners in making healthy choices when purchasing food
and drinks. These recommendations are made in light of results of this study where
participants reported to be consuming up to three sweets daily and consuming up to
almost two glasses of SSBs that are bought at schools. While prevention and oral
health promotion is important, curative services have to be rendered to participants
with decayed teeth.

` __________________________________________________________________________________
34
6. REFERENCES
1.Lobstein T, Frelut ML. Prevalence of overweight among children in Europe. Obes
Rev. 2003;4(4):195-200.
2.Hayden C, Bowler JO, Chambers S, Freeman R, Humphris G, Richards D, et al.
Obesity and dental caries in children: a systematic review and meta-analysis.
Community Dent Oral Epidemiol. 2013;41(4):289-308.
3.World Health Organisation. Diet, nutrition and the prevention of chronic diseases.
World Health Organ Tech Rep Ser. 2003;916:1-149.
4.Nadeau KJ, Maahs DM, Daniels SR, Eckel RH. Childhood obesity and
cardiovascular disease: links and prevention strategies. Nature Reviews Cardiology.
2011;8(9):513-25.
5.Alberti G, Zimmet P, Shaw J, Bloomgarden Z, Kaufman F, Silink M. Type 2
Diabetes in the Young: The Evolving Epidemic The International Diabetes
Federation Consensus Workshop. Diabetes Care. 2004;27(7):1798-811.
6.Hedley AA, Ogden CL, Johnson CL, Carroll MD, Curtin LR, Flegal KM. Prevalence
of overweight and obesity among US children, adolescents, and adults, 1999-2002.
JAMA. 2004;291(23):2847-50.
7.Escobar MAC, Veerman JL, Tollman SM, Bertram MY, Hofman KJ. Evidence that
a tax on sugar sweetened beverages reduces the obesity rate: a meta-analysis.
BMC Public Health. 2013;13(1):1072-82.
8.Whitaker RC, Wright JA, Pepe MS, Seidel KD, Dietz WH. Predicting obesity in
young adulthood from childhood and parental obesity. N Engl J Med.
1997;337(13):869-73.

` __________________________________________________________________________________
35
9.Freedman DS, Khan LK, Dietz WH, Srinivasan SR, Berenson GS. Relationship of
childhood obesity to coronary heart disease risk factors in adulthood: the Bogalusa
Heart Study. Pediatrics. 2001;108(3):712-8.
10.Shisana O, Labadarios D, Rehle T, Simbayi L, Zuma K, Dhansay A, et al. The
South African National Health and Nutrition Examination Survey, 2012: SANHANES-
1: the health and nutritional status of the nation: HSRC press; 2014.
11.Te Morenga L, Mallard S, Mann J. Dietary sugars and body weight: systematic
review and meta-analyses of randomised controlled trials and cohort studies.
2013;345(7891):E7492-500.
12.Selwitz RH, Ismail AI, Pitts NB. Dental caries. The Lancet. 2007;369(9555):51-9.
13.Gussy MG, Waters EG, Walsh O, Kilpatrick NM. Early childhood caries: current
evidence for aetiology and prevention. J Paediatr Child Health. 2006;42(1‐2):37-43.
14.Prashanth S, Venkatesh B, Vivek D, Amitha H. Comparison of association of
dental caries in relation with body mass index (BMI) in government and private
school children. J Dent Sci Res. 2011;2(2):1-5.
15.Bagramian RA, Garcia-Godoy F, Volpe AR. The global increase in dental caries.
A pending public health crisis. Am J Dent. 2009;22(1):3-8.
16.Gimenez T, Bispo BA, Souza DP, Viganó ME, Wanderley MT, Mendes FM, et al.
Does the decline in caries prevalence of Latin American and Caribbean children
continue in the new Century? Evidence from systematic review with meta-analysis.
PLoS One. 2016;11(10):e0164903.
17.Çolak H, Dülgergil ÇT, Dalli M, Hamidi MM. Early childhood caries update: a
review of causes, diagnoses, and treatments. Journal of Natural Science, Biology
and Medicine. 2013;4(1):29.

` __________________________________________________________________________________
36
18.Denloye O, Popoola B, Ifesanya J. Association between dental caries and body
mass index in 12–15 year old private school children in Ibadan, Nigeria. Pediatric
Dental Journal. 2016;26(1):28-33.
19.Marshall TA, Eichenberger-Gilmore JM, Broffitt BA, Warren JJ, Levy SM. Dental
caries and childhood obesity: roles of diet and socioeconomic status. Community
Dent Oral Epidemiol. 2007;35(6):449-58.
20.Willershausen B, Moschos D, Azrak B, Blettner M. Correlation between oral
health and body mass index (BMI) in 2071 primary school pupils. Eur J Med Res.
2007;12(7):295-302.
21.Willerhausen B, Blettner M, Kasaj A, Hohenfellner K. Association between body
mass index and dental health in 1,290 children of elementary schools in a German
city. Clin Oral Investig. 2007;11(3):195-200.
22.Hooley M, Skouteris H, Boganin C, Satur J, Kilpatrick N. Body mass index and
dental caries in children and adolescents: a systematic review of literature published
2004 to 2011. Systematic reviews. 2012;1(1):57-83.
23.Sakeenabi B, Shivalinga Swamy H, Noor Mohammed R. Association between
obesity, dental caries and socioeconomic status in 6-and 13-year-old school
children. Oral Health and Preventive Dentistry. 2012;10(3):231-41.
24.Harris R, Nicoll AD, Adair PM, Pine CM. Risk factors for dental caries in young
children: a systematic review of the literature. Community Dent Health.
2004;21(1):71-85.
25.Damle S, Yadav R, Garg S, Dhindsa A, Beniwal V, Loomba A, et al. Transmission
of mutans streptococci in mother-child pairs. Indian J Med Res. 2016;144(2):264.

` __________________________________________________________________________________
37
26.Nurelhuda NM, Al-Haroni M, Trovik T, Bakken V. Caries experience and
quantification of Streptococcus mutans and Streptococcus sobrinus in saliva of
Sudanese schoolchildren. Caries Res. 2010;44(4):402-7.
27.Davies GN. Early childhood caries—a synopsis. Community Dent Oral Epidemiol.
1998;26(S1):106-16.
28.Wan A, Seow W, Purdie D, Bird P, Walsh L, Tudehope D. Oral colonization of
Streptococcus mutans in six-month-old predentate infants. J Dent Res.
2001;80(12):2060-5.
29.Vadiakas G. Case definition, aetiology and risk assessment of early childhood
caries (ECC): a revisited review. Eur Arch Paediatr Dent. 2008;9(3):114-25.
30.Moynihan PJ. The role of diet and nutrition in the etiology and prevention of oral
diseases. Bull World Health Organ. 2005;83(9):694-9.
31.Hayden C, Bowler JO, Chambers S, Freeman R, Humphris G, Richards D, et al.
Obesity and dental caries in children: a systematic review and meta‐analysis.
Community Dent Oral Epidemiol. 2013;41(4):289-308.
32.Garcia-Godoy F, Hicks MJ. Maintaining the integrity of the enamel surface: The
role of dental biofilm, saliva and preventive agents in enamel demineralization and
remineralization. J Am Dent Assoc. 2008;139(5 SUPPL.):25S-34S.
33.Köksal E, Tekçiçek M, Yalçin SS, TugruI B, Yalçin S, Pekcan G. Association
between anthropometric measurements and dental caries in Turkish school children.
Cent Eur J Public Health. 2011;19(3):147.
34.Willershausen B, Moschos D, Azrak B, Blettner M. Correlation between oral
health and body mass index (BMI) in 2071 primary school pupils. Eur J Med Res.
2007;12(7):295.

` __________________________________________________________________________________
38
35.Costacurta M, Di Renzo L, Bianchi A, Fabiocchi F, De Lorenzo A, Docimo R.
Obesity and dental caries in paediatric patients. A cross-sectional study. Eur J
Paediatr Dent. 2011;12(2):112.
36.Gerdin EW, Angbratt M, Aronsson K, Eriksson E, Johansson I. Dental caries and
body mass index by socio‐economic status in Swedish children. Community Dent
Oral Epidemiol. 2008;36(5):459-65.
37.Joury E, Al-Kaabi R, Tappuni AR. Constructing public health policies in post crisis
countries: lessons to learn from the associations between free-sugars consumption
and diabetes, obesity and dental caries before, during and after sanctions in Iraq.
Journal of Public Health. 2016;24(6):563-9.
38.Klein H, Palmer CE, Knutson J. Studies on Dental Caries. Public Health Rep.
1938;53:751-65.
39.World Health Organization. Oral health surveys: basic methods: World Health
Organization; 2013.
40.Pitts N. The impact of diagnostic criteria on estimates of prevalence, extend and
severity of dental caries. Blackwell Munksgaard, Singapore; 2008.
41.Shrout PE, Fleiss JL. Intraclass correlations: uses in assessing rater reliability.
Psychol Bull. 1979;86(2):420.
42.Punitha V, Amudhan A, Sivaprakasam P, Rathanaprabu V. Role of dietary habits
and diet in caries occurrence and severity among urban adolescent school children.
J Pharm Bioallied Sci. 2015;7(Suppl 1):S296.
43.Alswat K, Mohamed WS, Wahab MA, Aboelil AA. The association between body
mass index and dental caries: Cross-sectional study. J Clin Med Res. 2016;8(2):147.

` __________________________________________________________________________________
39
44.Ditmyer MM, Dounis G, Howard KM, Mobley C, Cappelli D. Validation of a
multifactorial risk factor model used for predicting future caries risk with Nevada
adolescents. BMC Oral Health. 2011;11:18.
45.World Health Organization. Significant Caries Index 2008 [http://www. whocollab.
od. mah. se/sicdata. html]. Accessed on August 2017. 2010;9.
46.Nishi M BD, Stjernsward J. . Significant caries index (SCI): World Health
Organization, Collaboration, Centre,; 2010 [cited 2017 20 May, ]. Available from:
[http://www.whocollab.od.mah.se/sicdata.html],.
47.Bratthall D. Introducing the Significant Caries Index together with a proposal for a
new global oral health goal for 12‐year‐olds. Int Dent J. 2000;50(6):378-84.
48.Campusº G, Solinasº G, Maidae C, Castiglia P. The" Significant Caries
Index”(SiC): a Critical Approach. 2003.
49.Monse B, Heinrich‐Weltzien R, Benzian H, Holmgren C, van Palenstein
Helderman W. PUFA–an index of clinical consequences of untreated dental caries.
Community Dent Oral Epidemiol. 2010;38(1):77-82.
50.Grund K, Goddon I, Schüler IM, Lehmann T, Heinrich-Weltzien R. Clinical
consequences of untreated dental caries in German 5-and 8-year-olds. BMC Oral
Health. 2015;15(1):140.
51.Thekiso M, Yengopal V, Rudolph M, Bhayat A. Caries status among children in
the West Rand District of Gauteng Province, South Africa. South African Dental
Journal. 2012;67(7):318-20.
52.Kamran R, Farooq W, Faisal MR, Jahangir F. Clinical consequences of untreated
dental caries assessed using PUFA index and its covariates in children residing in
orphanages of Pakistan. BMC Oral Health. 2017;17(1):108.

` __________________________________________________________________________________
40
53.Tiwari S, Dubey A, Singh B, Avinash A. Clinical Consequences of Untreated
Dental Caries Evaluated with the Pulpal Involvement-Roots-Sepsis Index in the
Primary Dentition of School Children from the Raipur and Durg Districts,
Chhattisgarh State, India. Med Princ Pract. 2014.
54.Finucane D. Rationale for restoration of carious primary teeth: a review. Eur Arch
Paediatr Dent. 2012;13(6):281-92.
55.Sheiham A. Oral health, general health and quality of life. Bull World Health
Organ. 2005;83(9):644-.
56.Schwendicke F, Thomson WM, Broadbent JM, Stolpe M. Effects of Taxing Sugar-
Sweetened Beverages on Caries and Treatment Costs. J Dent Res.
2016;95(12):1327-32.
57.Tappuni AR, Al-Kaabi R, Joury E. Effect of Free Sugars on Diabetes, Obesity,
and Dental Caries. J Dent Res. 2017;96(1):116.
58.Codjoe SNA, Okutu D, Abu M. Urban Household Characteristics and Dietary
Diversity: An Analysis of Food Security in Accra, Ghana. Food Nutr Bull.
2016;37(2):202-18.
59.Hawkes C. Dietary implications of supermarket development: a global
perspective. Development Policy Review. 2008;26(6):657-92.
60.Regmi A, Dyck J. Effects of urbanization on global food demand. Changing
structure of global food consumption and trade. 2001:23-30.
61.Touger-Decker R, Van Loveren C. Sugars and dental caries. The American
journal of clinical nutrition. 2003;78(4):881S-92S.
62.Freedman DS, Horlick M, Berenson GS. A comparison of the Slaughter skinfold-
thickness equations and BMI in predicting body fatness and cardiovascular disease

` __________________________________________________________________________________
41
risk factor levels in children. The American journal of clinical nutrition.
2013;98(6):1417-24.
63.Control CfD, Prevention. Body mass index: considerations for practitioners. Cdc
[Internet]. 2011:1-4.
64.Malek Mohammadi T, Hossienian Z, Bakhteyar M. The association of body mass
index with dental caries in an Iranian sample of children. J Oral Health & Oral
Epidemiol. 2012;1(1):29-35.
65.World Health Organization. BMI classification. Global database on body mass
index: an interactive surveillance tool for monitoring nutrition transition. Geneva:
World Health Organization. 2006.
66.Organization WH. Global database on body mass index. 2011. Global Database
on Body Mass Index. 2011.
67.Kukulu K, Sarvan S, Muslu L, Yirmibeşoğlu ŞG. Dietary habits, economic status,
academic performance and body mass index in school children: a comparative
study. Journal of Child Health Care. 2010;14(4):355-66.
68.Asil E, Surucuoglu MS, Cakiroglu FP, Ucar A, Ozcelik AO, Yilmaz MV, et al.
Factors That Affect Body Mass Index of Adults. Pakistan Journal of Nutrition.
2014;13(5):255-60.
69.Mei Z, Grummer-Strawn LM, Pietrobelli A, Goulding A, Goran MI, Dietz WH.
Validity of body mass index compared with other body-composition screening
indexes for the assessment of body fatness in children and adolescents. The
American journal of clinical nutrition. 2002;75(6):978-85.
70.Daniels SR. The use of BMI in the clinical setting. Pediatrics.
2009;124(Supplement 1):S35-S41.

` __________________________________________________________________________________
42
71.Kassebaum NJ, Bernabé E, Dahiya M, Bhandari B, Murray C, Marcenes W.
Global burden of untreated caries: a systematic review and metaregression. J Dent
Res. 2015;94(5):650-8.
72.Ng M, Fleming T, Robinson M, Thomson B, Graetz N, Margono C, et al. Global,
regional, and national prevalence of overweight and obesity in children and adults
during 1980–2013: a systematic analysis for the Global Burden of Disease Study
2013. The lancet. 2014;384(9945):766-81.
73.Hooley M, Skouteris H, Boganin C, Satur J, Kilpatrick N. Body mass index and
dental caries in children and adolescents: a systematic review of literature published
2004 to 2011. Systematic reviews. 2012;1(1):57.
74.Listl S, Galloway J, Mossey P, Marcenes W. Global economic impact of dental
diseases. J Dent Res. 2015:0022034515602879.
75.Al Shehri A, Al Fattani A, Al Alwan I. Obesity among Saudi children. Saudi
Journal of Obesity. 2013;1(1):3-9.
76.Nicklas TA, Yang S-J, Baranowski T, Zakeri I, Berenson G. Eating patterns and
obesity in children: The Bogalusa Heart Study. Am J Prev Med. 2003;25(1):9-16.
77.Vernarelli JA, Mitchell DC, Hartman TJ, Rolls BJ. Dietary energy density is
associated with body weight status and vegetable intake in US children. The Journal
of nutrition. 2011;141(12):2204-10.
78.Miller P, Moore RH, Kral TV. Children’s daily fruit and vegetable intake:
associations with maternal intake and child weight status. J Nutr Educ Behav.
2011;43(5):396-400.
79.Matthews VL, Wien M, Sabaté J. The risk of child and adolescent overweight is
related to types of food consumed. Nutr J. 2011;10(1):1-7.
` __________________________________________________________________________________
43
80.Müller MJ, Koertzinger I, Mast M, Langnäse K, Grund A. Physical activity and diet
in 5 to 7 years old children. Public Health Nutr. 1999;2(3a):443-4.
81.Petersen PE, Bourgeois D, Ogawa H, Estupinan-Day S, Ndiaye C. The global
burden of oral diseases and risks to oral health. Bull World Health Organ.
2005;83(9):661-9.
82.Parkar SM, Chokshi M. Exploring the association between dental caries and body
mass index in public school children of Ahmedabad city, Gujarat. SRM Journal of
Research in Dental Sciences. 2013;4(3):101-5.
83.Bhayat A, Ahmad MS, Fadel HT. Association between body mass index, diet and
dental caries in Grade 6 boys in Medina, Saudi Arabia. Eastern Mediterranean
health journal = La revue de sante de la Mediterranee orientale = al-Majallah al-
sihhiyah li-sharq al-mutawassit. 2016;22(9):687-93.
84.Frias-Bulhosa J, Barbosa P, Gomes E, Vieira MR, Manso MC. Association
between body mass index and caries among 13-year-old population in Castelo de
Paiva, Portugal. Revista Portuguesa de Estomatologia, Medicina Dentária e Cirurgia
Maxilofacial. 2015;56(1):3-8.
85.Lempert SM, Froberg K, Christensen LB, Kristensen PL, Heitmann BL.
Association between body mass index and caries among children and adolescents.
Community Dent Oral Epidemiol. 2014;42(1):53-60.
86.Kantovitz KR, Pascon FM, Rontani RMP, Gaviao MBD, Pascon FM. Obesity and
dental caries--A systematic review. Oral health & preventive dentistry. 2006;4(2).
87.Alm A, Isaksson H, Fahraeus C, Koch G, Andersson-Gare B, Nilsson M, et al.
BMI status in Swedish children and young adults in relation to caries prevalence.
Swed Dent J. 2011;35(1):1-8.
` __________________________________________________________________________________
44
88.Willershausen B, Haas G, Krummenauer F, Hohenfellner K. Relationship
between high weight and caries frequency in German elementary school children.
Eur J Med Res. 2004;9:400-4.
89.Werner SL, Phillips C, Koroluk LD. Association between childhood obesity and
dental caries. Pediatr Dent. 2012;34(1):23-7.
90.Organization WH. Physical status: the use and interpretation of anthropometry.
Geneva; 1995. WHO technical report series. 2011;854:2009-6.
91.Costa LR, Daher A, Queiroz MG. Early childhood caries and body mass index in
young children from low income families. Int J Environ Res Public Health.
2013;10(3):867-78.
92.Al-Muammar M, El-Shafie M, Feroze S. Association between dietary habits and
body mass index of adolescent females in intermediate schools in Riyadh, Saudi
Arabia/association entre les habitudes alimentaires et l'indice de masse corporelle
chez des collegiennes a Riyad (Arabie saoudite). Eastern Mediterranean Health
Journal. 2014;20(1):39.
93.Van Wyk P, Louw A, Du Plessis J. Caries status and treatment needs in South
Africa: report of the 1999-2002 National Children's Oral Health Survey. SADJ: journal
of the South African Dental Association= tydskrif van die Suid-Afrikaanse
Tandheelkundige Vereniging. 2004;59(6):238, 40-2.
94.Bajomo A, Rudolph M, Ogunbodede E. Dental caries in six, 12 and 15 year old
Venda children in South Africa. East Afr Med J. 2004;81(5):236-43.
95.Braimoh OB, Umanah AU, Ilochonwu NA. Caries Distribution, Prevalence, and
Treatment Needs among 12–15-Year-Old Secondary School Students in Port
Harcourt, Rivers State, Nigeria. Journal of Dental Surgery. 2014;2014(9):1-6.
` __________________________________________________________________________________
45
96.Mafuvadze BT, Mahachi L, Mafuvadze B. Dental caries and oral health practice
among 12 year old school children from low socio-economic status background in
Zimbabwe. The Pan African medical journal. 2013;14.
97.Jain A, Jain V, Suri SM, Jain R. Prevalence of dental caries in male children from
3 to 14 years of age of Bundelkhand region, India. International Journal Of
Community Medicine And Public Health. 2017;3(4):787-90.
98.Zhang S, Liu J, Lo ECM, Chu CH. Dental and periodontal status of 12-year-old
Bulang children in China. BMC Oral Health. 2014;14:32.
99.Ramphoma K. Oral Health in South Africa: Exploring the role of dental public
health specialists. South African Dental Journal. 2016;71(9):402-3.
100.Mohammadi TM, Hossienian Z, Bakhteyar M. The association of body mass
index with dental caries in an Iranian sample of children. Journal of Oral Health and
Oral Epidemiology. 2012;1(1):29-35.
101.Thippeswamy HM, Kumar N, Acharya S, Pentapati KC. Relationship between
body mass index and dental caries among adolescent children in South India. The
West Indian medical journal. 2011;60(5):581-6.
102.Lobstein T, Baur L, Uauy R. Obesity in children and young people: a crisis in
public health. Obes Rev. 2004;5(s1):4-85.
103.Armstrong ME, Lambert MI, Lambert EV. Secular trends in the prevalence of
stunting, overweight and obesity among South African children (1994–2004). Eur J
Clin Nutr. 2011;65(7):835-40.
104.Draper C, Basset S, De Villiers A, Lambert EV, Group HW. Results from South
Africa’s 2014 report card on physical activity for children and youth. Journal of
physical Activity and Health. 2014;11(s1):S98-S104.

` __________________________________________________________________________________
46
105.Petersen PE. Sociobehavioural risk factors in dental caries–international
perspectives. Community Dent Oral Epidemiol. 2005;33(4):274-9.
106.Zhu L, Petersen PE, Wang HY, Bian JY, Zhang BX. Oral health knowledge,
attitudes and behaviour of children and adolescents in China. Int Dent J.
2003;53(5):289-98.
107.Department of Basic Education. (2010c). National School Nutrition Programme.
Annual Report 2009/10. Pretoria: 2010.
108.Rendall-Mkosi K, Wenhold F, Sibanda N. Case study of the national school
nutrition programme in South Africa. Pretoria: PCD, NEPAD and DOBE. 2013.
109.Elangovan A, Mungara J, Joseph E. Exploring the relation between body mass
index, diet, and dental caries among 6-12-year-old children. J Indian Soc Pedod
Prev Dent. 2012;30(4):293-300.

` __________________________________________________________________________________
47
Appendix A: Data collection sheet
Association between dental caries and body mass index among 6th grade
leaners at selected primary schools in Tshwane West District, Pretoria,
Gauteng province – South Africa
Demographics
1. Age in years
2. Gender Male
Female
3. Parents: Employed Unemployed
Mother
Father
4. What is the last grade or standard your parents passed?
Mother
Father
5. Type of home where you stay Tick the applicable one
Flat
House
Shack
6. How many rooms does your family house comprise of?
7. How many brothers of sisters do you have?
8. How many people are living in the house?
Yes No
9. Does your home have DSTV/ any satellite TV?
10. Height (meters)?
11. Weight (kg)?
Diet history
Food type and amount Breakfast Lunch Supper
1. What kind of food do you
eat

` __________________________________________________________________________________
48
Yes No
2. Do you drink any soft
drinks beverages for an
example Coke, Fanta orange
or juice
If yes how many cans do you
drink per day
Yes No
3. Do you suck lollipop/eat
sweets and chocolate?
If yes how many per day?
4. Do you eat from the
feeding scheme at your
school?
Breakfast Lunch
Yes No
5. Do you participate in any
sport activity e.g soccer,
netball, rugby
Yes No
How many days in a week do
you participate
Oral Health Practices
Yes No
1. Do you brush your teeth?
2. If yes times do you brush your teeth 1. O Once daily
Twice daily
More than
twice daily
Other
Yes No
3. Do you use a toothpaste
4. If yes, what type do you normally use

` __________________________________________________________________________________
49
DMFT AND PUFA INDEX
DMFT: 0=Sound, D=decayed, M=missing, F=filled
17 16 15 14 13 12 11 21 22 23 24 25 26 27
47 46 45 44 43 42 41 31 32 33 34 35 36 37
PUFA: 0=Healthy, P=pulpal involvement, U=ulcer, F=fistula, A=abscess
17 16 15 14 13 12 11 21 22 23 24 25 26 27
47 46 45 44 43 42 41 31 32 33 34 35 36 37

` __________________________________________________________________________________
50
Appendix B: Assent form
INFORMATION LEAFLET AND ASSENT FORM
PROJECT TITLE: Association between dental caries and body mass index among 6th
grade leaners at selected primary school in Pretoria, Gauteng province – South Africa
Dear learner
I am Dr NR Nkambule a dentist specializing in Community Dentistry at the School of
Dentistry, University of Pretoria. I am planning to conduct a study at your school on all the
grade 6 learners and I would like you to participate. The aim of this study is to determine
the relationship between diet, decayed teeth, weight and height among the grade 6
leaners at selected primary school in Pretoria. I will ask you a few questions regarding
your diet and oral hygiene. I will look into your mouth and will then write down what I see in
your mouth. I will also note how much you weigh and how tall you are. There are no risks or
pain involved for you in participating in this study. A letter will be written to your parents
explaining your oral health status and whether you need to undergo dental treatment or not.
If you need treatment, you will be given a referral letter that can be taken to a dentist or oral
health centre of your choice to carry out the dental treatment if you choose to. The results of
the study might help to improve your oral and dental health.
No names will be written on the results and all the information will be kept confidential. No
one will force you to carry on or be cross or upset with you if you don’t want to. Take your
time before deciding if you want to participate in this study. If you sign at the bottom it will
mean that you have read this document, and that you would like to be in this study. If you
have any questions that this leaflet does not fully explain please do not hesitate to ask the
me at this number 082 7725135 / 012 319 2447
I, ……………………………………………………. (print full name), Date……………….
understand that my parent(s)/guardian(s) have given permission (said it is okay) for me to
take part in the research project. I am taking part because I want to and not because I’m
forced to do so. I have been assured that I can stop at any time I want to without getting into
any trouble (nothing bad will happen to me and nobody will be mad at me if I want to stop).
Also, I can always ask the dentist any question about the study.
School Name:………………………………………………Grade…………………
Researcher’s name: Dr NR Nkambule:
Signature………………………..Date:……………………

` __________________________________________________________________________________
51
Appendix C: Consent form
INFORMATION LEAFLET AND CONSENT FORM
PROJECT TITLE: Association between dental caries and body mass index among 6th
grade leaners at selected primary schools in Tshwane West District, Pretoria, Gauteng
province – South Africa
Dear Parent / Guardian
I am Dr NR Nkambule a dentist specializing in Community Dentistry at the School of
Dentistry, University of Pretoria. I am planning to conduct a study at your child’s school on all
the grade 6 learners. The aim of this study is to determine the relationship between
decayed teeth, weight and height among the grade 6 leaners at selected primary
school in Tshwane West District, Pretoria. I will ask your child a few questions regarding
his/her diet and oral hygiene. I will have a look into your child’s mouth then write down oral
conditions that I see in your child’s mouth and also note how much your child weigh and how
tall he/she is. There are no risks or pain involved for your child in participating in this study. A
letter will be written to you explaining the oral health status of your child. If dental treatment
is needed for your child, you will receive a referral letter that can be taken to a dentist or oral
health centre of your choice to carry out the dental treatment if you want to. The results of
the study might help the clinics and hospitals to improve the dental services they offer to
your child and other children and also to improve their oral health.
No names will be written on the results and all the information will be kept confidential. Take
your time before deciding if you want your child to participate in this study by allowing a
dentist to look at your child’s mouth. If you sign at the bottom it will mean that you have read
this document, and that you would like your child to be in this study. If you have any
questions that this leaflet does not fully explain please do not hesitate to ask the me at this
number 082 7725135 / 012 319 2447
Parent/Guardian’s name: -----------------------------------------------(Please print)
Parent/Guadian’s signature……………………………………: Date…………………
Child’s Name………………………………………..Grade…………………………….....
Signature………………………..Date:……………………
Researcher’s name: Dr NR Nkambule:
Signature………………………..Date:……………………

` __________________________________________________________________________________
52
Appendix D: Referral Letter
Department of Community Dentistry
University of Pretoria
Contact details: (012) 3192419
Patient:
Dear service provider
Thank you for seeing the above-mentioned patient.
The learner was screened during a community outreach programme and it was
found that he/she has carious teeth that either need to be restored or extracted.
Please manage the patient further.
Name of Doctor: Dr NR Nkambule
Signature:
Date: 22 May 2017

` __________________________________________________________________________________
53
Appendix E: Ethics Clearance certificate

` __________________________________________________________________________________
54
Appendix F: Permission from Gauteng Department of
Education

` __________________________________________________________________________________
55

` __________________________________________________________________________________
56
Appendix G: Permission from Tshwane West District