asset/liability management - cornerstoneleague.coop ncua eds meeting alexandria, virginia february...
TRANSCRIPT
1
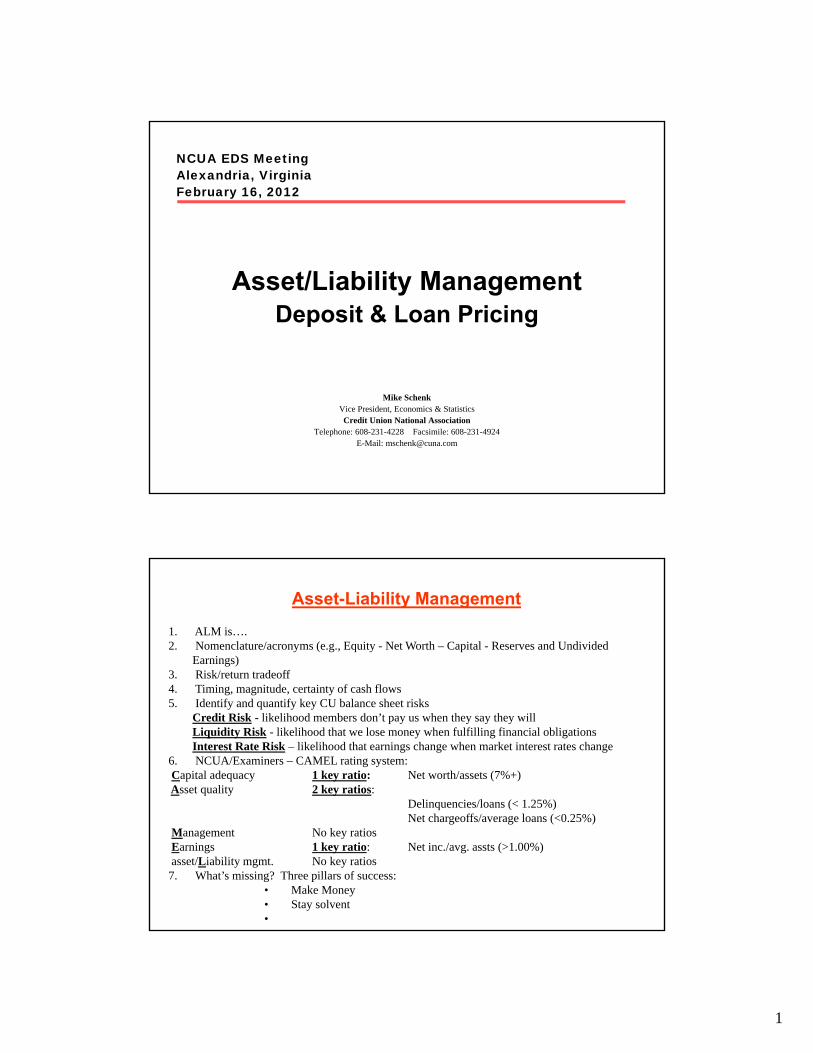
NCUA EDS MeetingAlexandria, VirginiaFebruary 16, 2012
Asset/Liability ManagementDeposit & Loan Pricing
Mike SchenkVice President, Economics & StatisticsCredit Union National Association
Telephone: 608-231-4228 Facsimile: 608-231-4924E-Mail: [email protected]
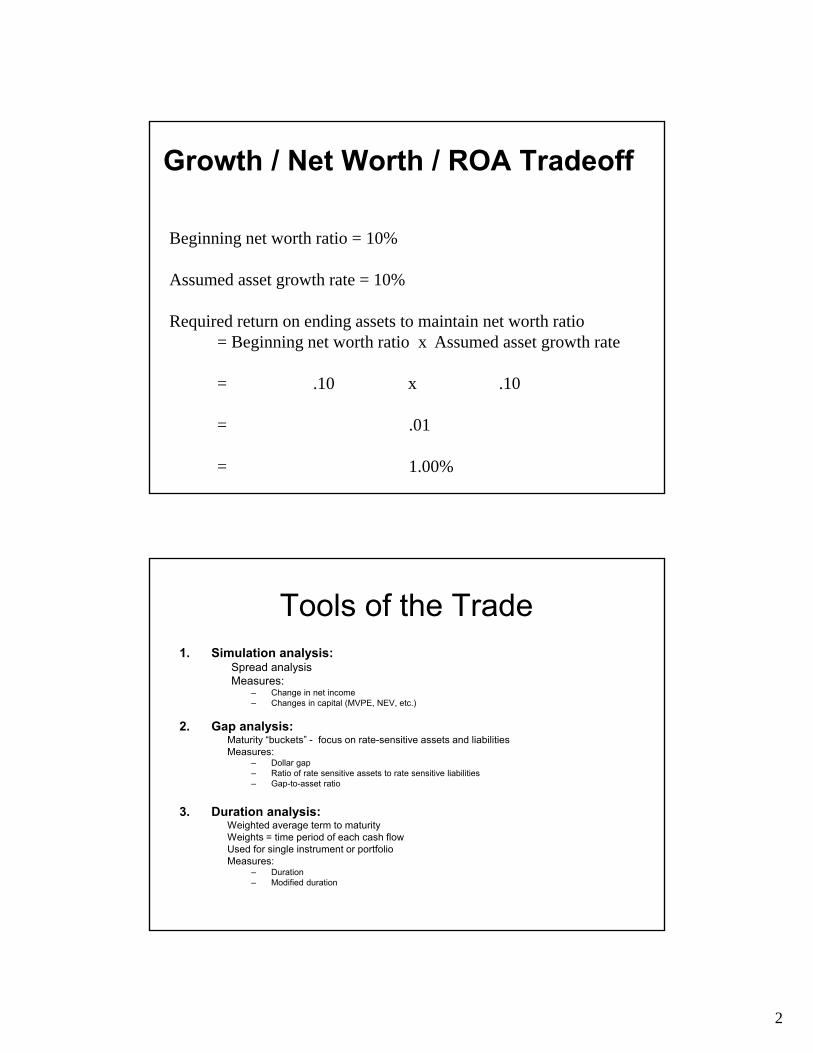
Asset-Liability Management
1. ALM is….2. Nomenclature/acronyms (e.g., Equity - Net Worth – Capital - Reserves and Undivided
Earnings)3. Risk/return tradeoff4. Timing, magnitude, certainty of cash flows5. Identify and quantify key CU balance sheet risks
Credit Risk - likelihood members don’t pay us when they say they willLiquidity Risk - likelihood that we lose money when fulfilling financial obligationsInterest Rate Risk – likelihood that earnings change when market interest rates change
6. NCUA/Examiners – CAMEL rating system:Capital adequacy 1 key ratio: Net worth/assets (7%+)Asset quality 2 key ratios:
Delinquencies/loans (< 1.25%)Net chargeoffs/average loans (<0.25%)
Management No key ratiosEarnings 1 key ratio: Net inc./avg. assts (>1.00%)asset/Liability mgmt. No key ratios7. What’s missing? Three pillars of success:
• Make Money• Stay solvent•
2
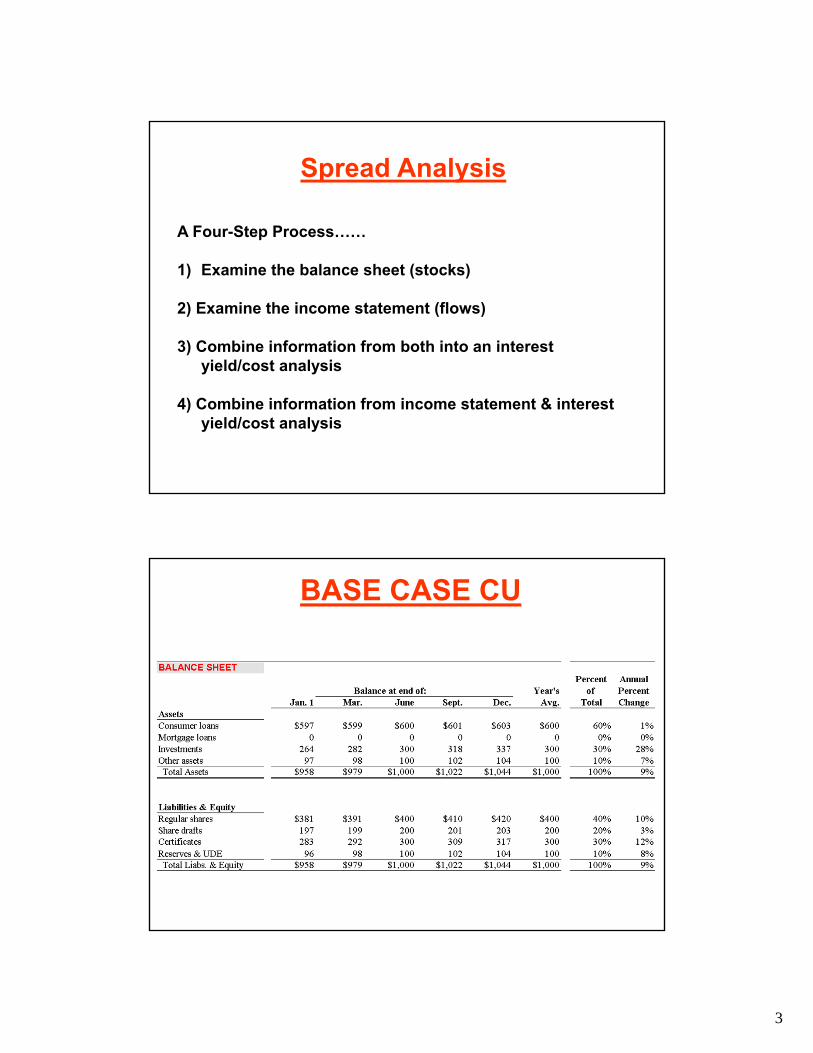
Growth / Net Worth / ROA Tradeoff
Beginning net worth ratio = 10%
Assumed asset growth rate = 10%
Required return on ending assets to maintain net worth ratio= Beginning net worth ratio x Assumed asset growth rate
= .10 x .10
= .01
= 1.00%
Tools of the Trade1. Simulation analysis:
Spread analysisMeasures:
– Change in net income– Changes in capital (MVPE, NEV, etc.)
2. Gap analysis:Maturity “buckets” - focus on rate-sensitive assets and liabilitiesMeasures:
– Dollar gap– Ratio of rate sensitive assets to rate sensitive liabilities– Gap-to-asset ratio
3. Duration analysis:Weighted average term to maturityWeights = time period of each cash flowUsed for single instrument or portfolioMeasures:
– Duration– Modified duration
3
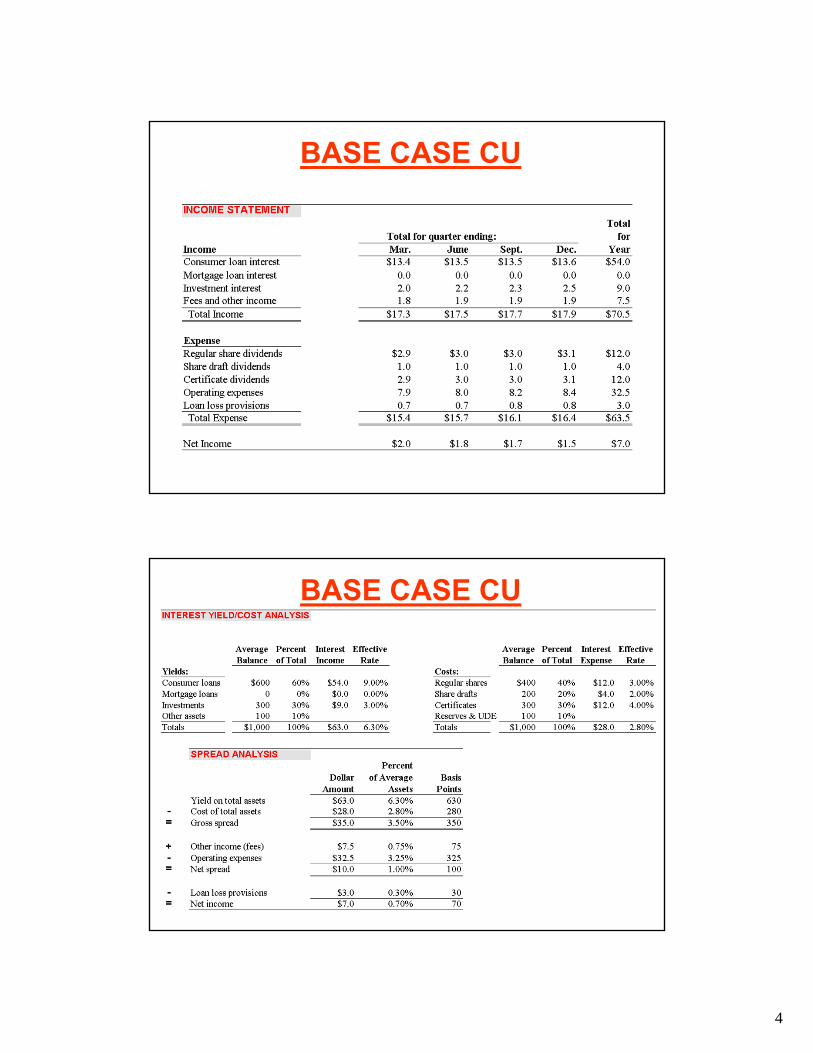
Spread Analysis
A Four-Step Process……
1) Examine the balance sheet (stocks)
2) Examine the income statement (flows)
3) Combine information from both into an interest yield/cost analysis
4) Combine information from income statement & interest yield/cost analysis
BASE CASE CU
4
BASE CASE CU
BASE CASE CU
5
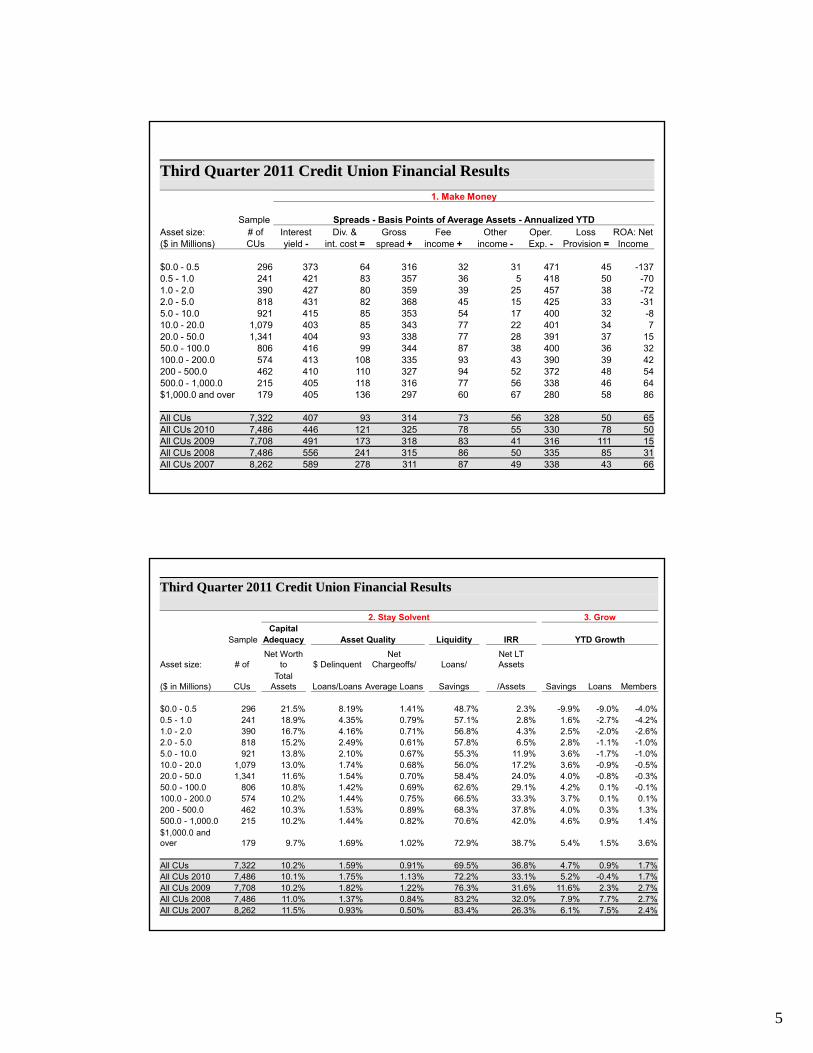
Third Quarter 2011 Credit Union Financial Results
1. Make Money
Sample Spreads - Basis Points of Average Assets - Annualized YTDAsset size: # of Interest Div. & Gross Fee Other Oper. Loss ROA: Net($ in Millions) CUs yield - int. cost = spread + income + income - Exp. - Provision = Income
$0.0 - 0.5 296 373 64 316 32 31 471 45 -1370.5 - 1.0 241 421 83 357 36 5 418 50 -701.0 - 2.0 390 427 80 359 39 25 457 38 -722.0 - 5.0 818 431 82 368 45 15 425 33 -315.0 - 10.0 921 415 85 353 54 17 400 32 -810.0 - 20.0 1,079 403 85 343 77 22 401 34 720.0 - 50.0 1,341 404 93 338 77 28 391 37 1550.0 - 100.0 806 416 99 344 87 38 400 36 32100.0 - 200.0 574 413 108 335 93 43 390 39 42200 - 500.0 462 410 110 327 94 52 372 48 54500.0 - 1,000.0 215 405 118 316 77 56 338 46 64$1,000.0 and over 179 405 136 297 60 67 280 58 86
All CUs 7,322 407 93 314 73 56 328 50 65All CUs 2010 7,486 446 121 325 78 55 330 78 50All CUs 2009 7,708 491 173 318 83 41 316 111 15All CUs 2008 7,486 556 241 315 86 50 335 85 31All CUs 2007 8,262 589 278 311 87 49 338 43 66
Third Quarter 2011 Credit Union Financial Results
2. Stay Solvent 3. GrowCapital
Sample Adequacy Asset Quality Liquidity IRR YTD Growth
Asset size: # ofNet Worth
to $ DelinquentNet
Chargeoffs/ Loans/Net LT Assets
($ in Millions) CUsTotal
Assets Loans/Loans Average Loans Savings /Assets Savings Loans Members
$0.0 - 0.5 296 21.5% 8.19% 1.41% 48.7% 2.3% -9.9% -9.0% -4.0%0.5 - 1.0 241 18.9% 4.35% 0.79% 57.1% 2.8% 1.6% -2.7% -4.2%1.0 - 2.0 390 16.7% 4.16% 0.71% 56.8% 4.3% 2.5% -2.0% -2.6%2.0 - 5.0 818 15.2% 2.49% 0.61% 57.8% 6.5% 2.8% -1.1% -1.0%5.0 - 10.0 921 13.8% 2.10% 0.67% 55.3% 11.9% 3.6% -1.7% -1.0%10.0 - 20.0 1,079 13.0% 1.74% 0.68% 56.0% 17.2% 3.6% -0.9% -0.5%20.0 - 50.0 1,341 11.6% 1.54% 0.70% 58.4% 24.0% 4.0% -0.8% -0.3%50.0 - 100.0 806 10.8% 1.42% 0.69% 62.6% 29.1% 4.2% 0.1% -0.1%100.0 - 200.0 574 10.2% 1.44% 0.75% 66.5% 33.3% 3.7% 0.1% 0.1%200 - 500.0 462 10.3% 1.53% 0.89% 68.3% 37.8% 4.0% 0.3% 1.3%500.0 - 1,000.0 215 10.2% 1.44% 0.82% 70.6% 42.0% 4.6% 0.9% 1.4%$1,000.0 and over 179 9.7% 1.69% 1.02% 72.9% 38.7% 5.4% 1.5% 3.6%
All CUs 7,322 10.2% 1.59% 0.91% 69.5% 36.8% 4.7% 0.9% 1.7%All CUs 2010 7,486 10.1% 1.75% 1.13% 72.2% 33.1% 5.2% -0.4% 1.7%All CUs 2009 7,708 10.2% 1.82% 1.22% 76.3% 31.6% 11.6% 2.3% 2.7%All CUs 2008 7,486 11.0% 1.37% 0.84% 83.2% 32.0% 7.9% 7.7% 2.7%All CUs 2007 8,262 11.5% 0.93% 0.50% 83.4% 26.3% 6.1% 7.5% 2.4%
6
The Good Old Days
Balance sheet management was simple:
• Investments had clearly defined, one dimensional outcomes
• Mortgages were prepaid only when significant advantage was obvious
• Savers saw the certainty of retail deposits as an advantage
• Competition was local and relationships drove banking
Life was good:• High margin balance sheets produced steady performance• Stable cash flows led to ample and predictable liquidity
The Environment Today
Balance sheet management is more complex
• Investments are multi-dimensional and optionality driven
• Mortgages prepay at the first hint of a rate advantage
• Retail deposits are a constant supply and cost challenge
Life is Much Tougher:• Low margins and optionality have transformed balance sheets• Producing highly variable cash flows, unsteady performance
and uncertain liquidity
7
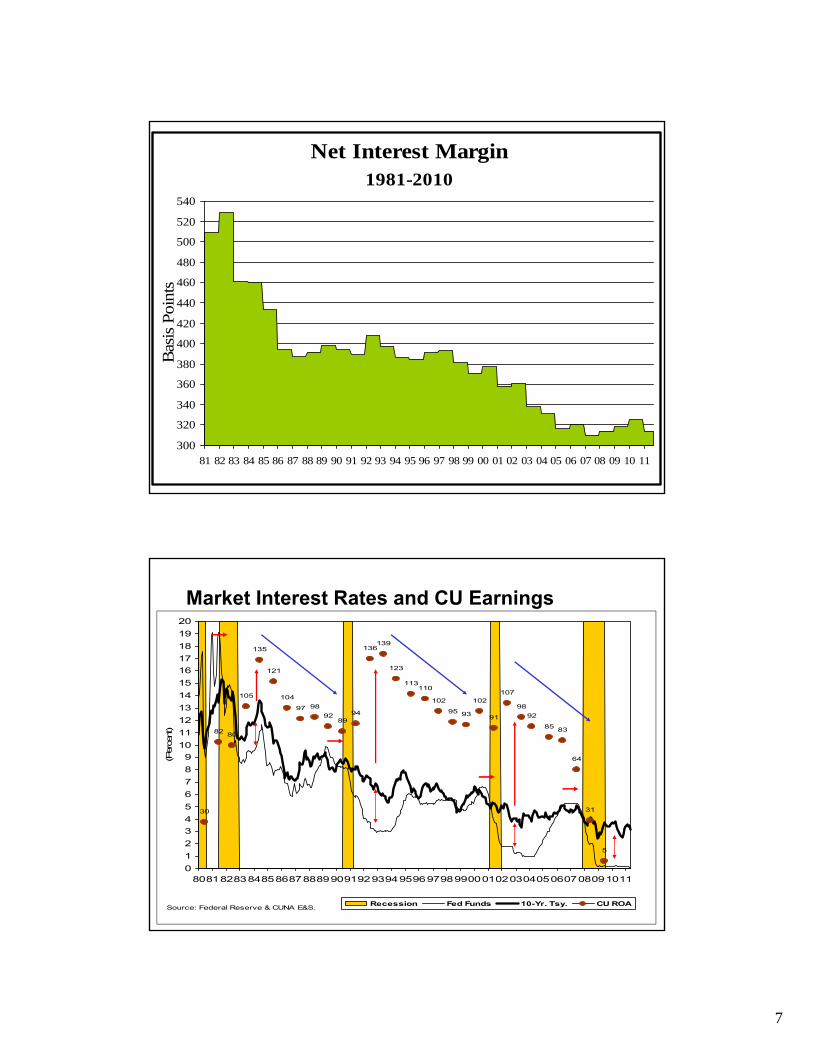
Net Interest Margin 1981-2010
300
320
340
360
380
400
420
440
460
480
500
520
540
81 82 83 84 85 86 87 88 89 90 91 92 93 94 95 96 97 98 99 00 01 02 03 04 05 06 07 08 09 10 11
Bas
is P
oint
s
30
82 80
105
135
121
104
97 98
9289
94
136139
123
113110
102
95 93
102
91
107
98
92
85 83
64
31
5
0
1
2
3
4
5
6
7
8
9
10
11
12
13
14
15
16
17
18
19
20
8081828384858687888990919293949596979899000102030405060708091011
(Per
cent)
Recession Fed Funds 10-Yr. Tsy. CU ROASource: Federal Reserve & CUNA E&S.
Market Interest Rates and CU Earnings
8
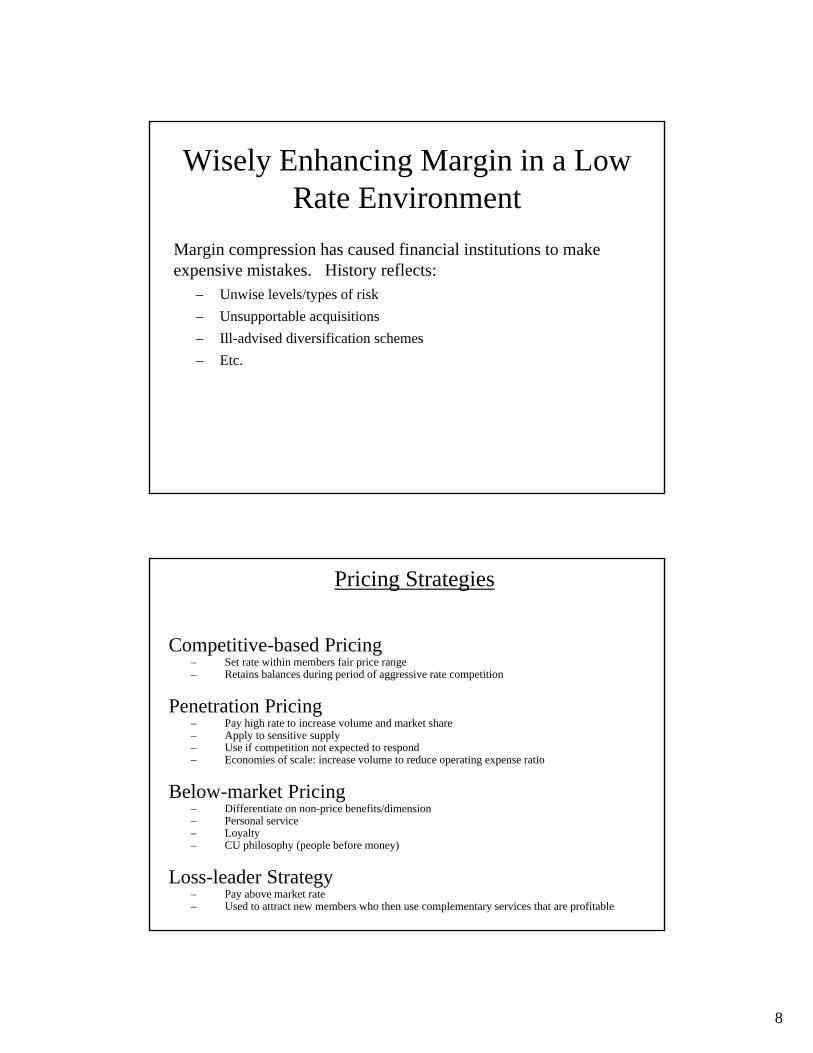
Wisely Enhancing Margin in a Low Rate Environment
Margin compression has caused financial institutions to make expensive mistakes. History reflects:
– Unwise levels/types of risk
– Unsupportable acquisitions
– Ill-advised diversification schemes
– Etc.
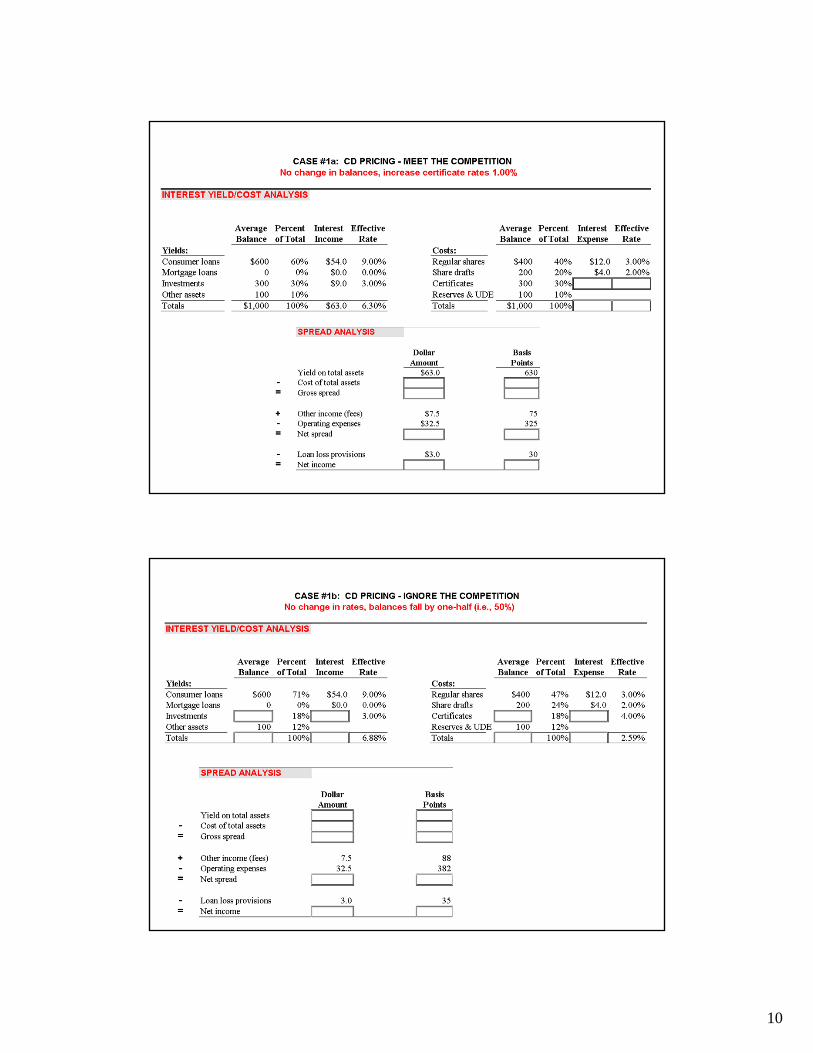
Pricing Strategies
Competitive-based Pricing– Set rate within members fair price range– Retains balances during period of aggressive rate competition
Penetration Pricing– Pay high rate to increase volume and market share– Apply to sensitive supply– Use if competition not expected to respond– Economies of scale: increase volume to reduce operating expense ratio
Below-market Pricing– Differentiate on non-price benefits/dimension– Personal service– Loyalty– CU philosophy (people before money)
Loss-leader Strategy– Pay above market rate– Used to attract new members who then use complementary services that are profitable
9
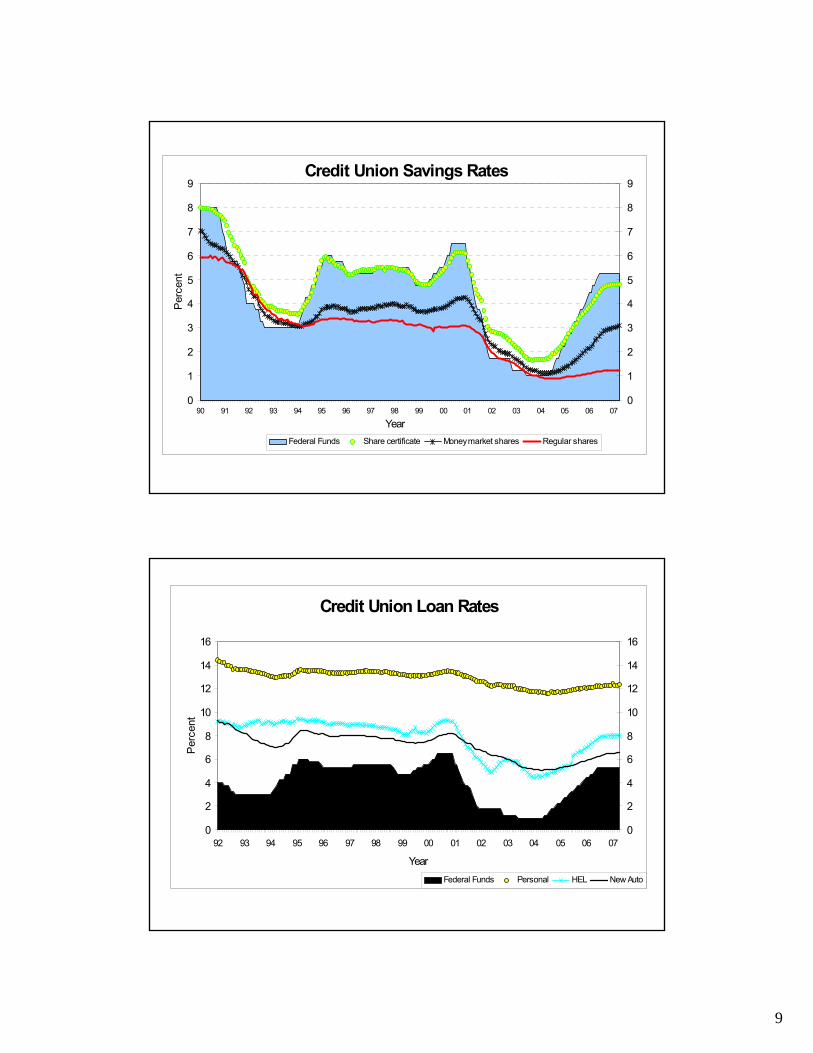
Credit Union Savings Rates
0
1
2
3
4
5
6
7
8
9
90 91 92 93 94 95 96 97 98 99 00 01 02 03 04 05 06 07
Year
Per
cent
0
1
2
3
4
5
6
7
8
9
Federal Funds Share certificate Money market shares Regular shares
Credit Union Loan Rates
0
2
4
6
8
10
12
14
16
92 93 94 95 96 97 98 99 00 01 02 03 04 05 06 07
Year
Per
cent
0
2
4
6
8
10
12
14
16
Federal Funds Personal HEL New Auto
10
11
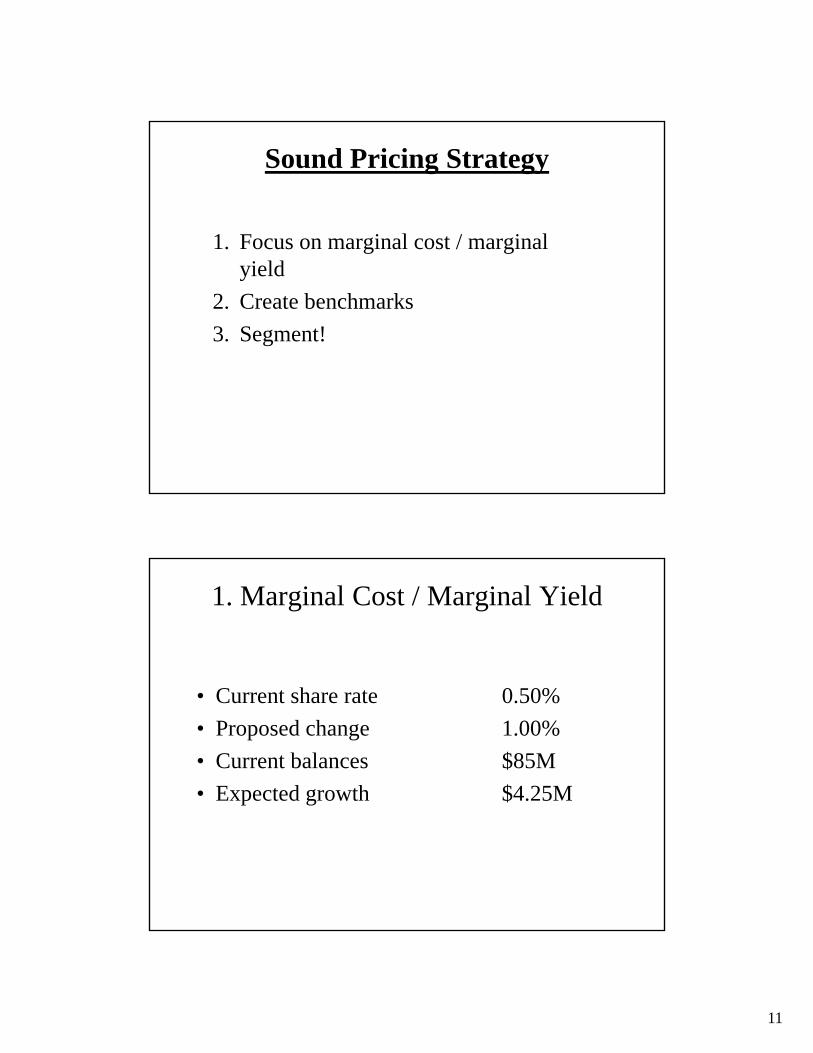
Sound Pricing Strategy
1. Focus on marginal cost / marginal yield
2. Create benchmarks
3. Segment!
1. Marginal Cost / Marginal Yield
• Current share rate 0.50%
• Proposed change 1.00%
• Current balances $85M
• Expected growth $4.25M
12
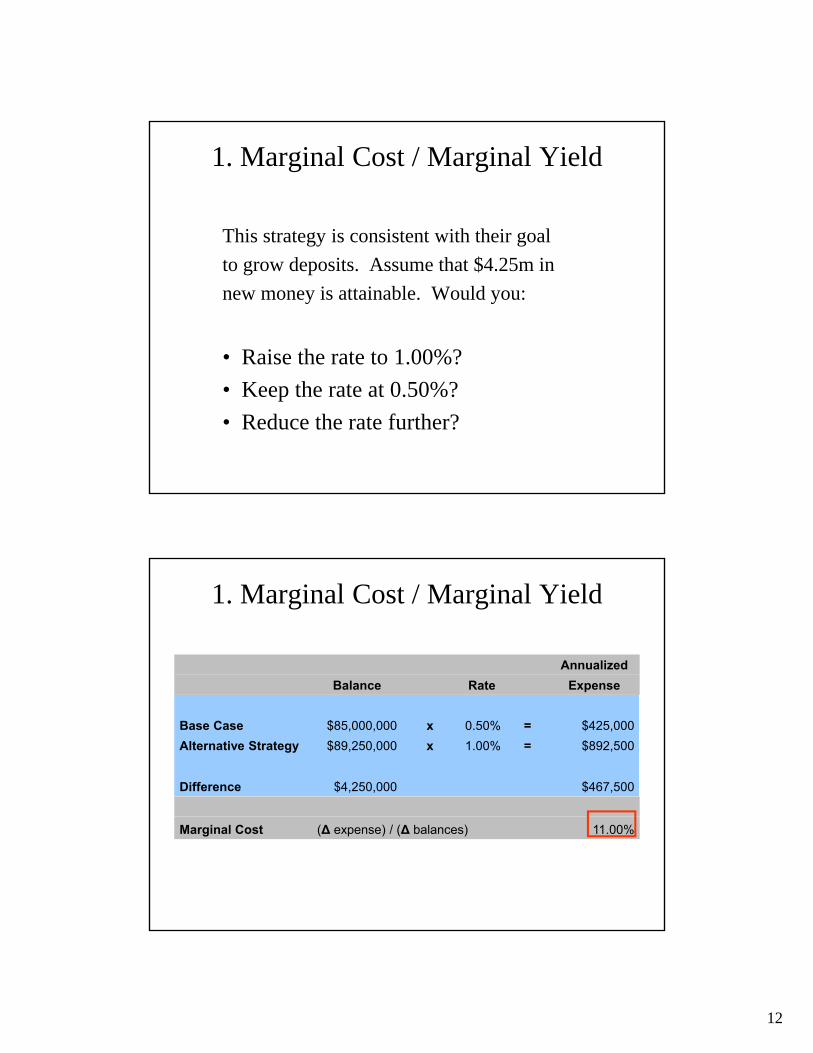
1. Marginal Cost / Marginal Yield
This strategy is consistent with their goal
to grow deposits. Assume that $4.25m in
new money is attainable. Would you:
• Raise the rate to 1.00%?
• Keep the rate at 0.50%?
• Reduce the rate further?
1. Marginal Cost / Marginal Yield
Annualized
Balance Rate Expense
Base Case $85,000,000 x 0.50% = $425,000
Alternative Strategy $89,250,000 x 1.00% = $892,500
Difference $4,250,000 $467,500
Marginal Cost (Δ expense) / (Δ balances) 11.00%
13
1. Marginal Cost / Marginal Yield
• How can our cost of funds be 11.0% when we’re only paying 1.00% on the average?– Average cost doesn’t evaluate one alternative vs.
another
– Average cost hides the extra money you had to pay on balances you would have had at the lower rate anyway
– ***11.0% cost does not include any shift***
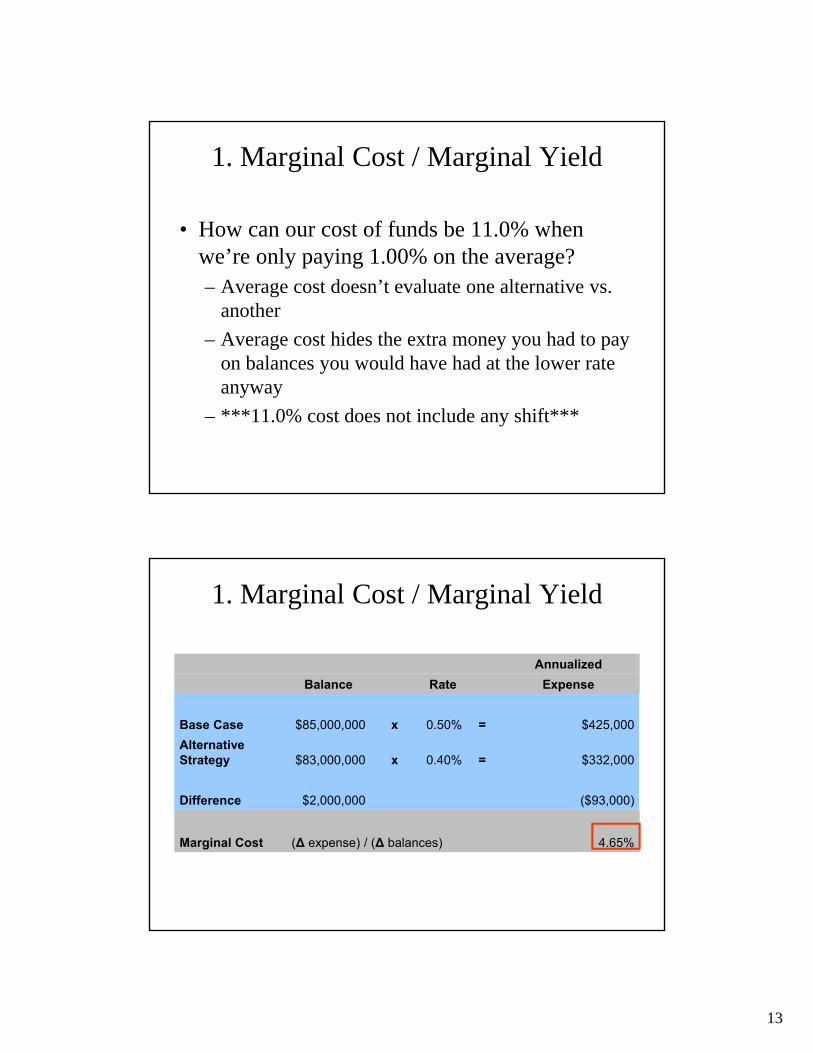
1. Marginal Cost / Marginal Yield
Annualized
Balance Rate Expense
Base Case $85,000,000 x 0.50% = $425,000
Alternative Strategy $83,000,000 x 0.40% = $332,000
Difference $2,000,000 ($93,000)
Marginal Cost (Δ expense) / (Δ balances) 4.65%
14
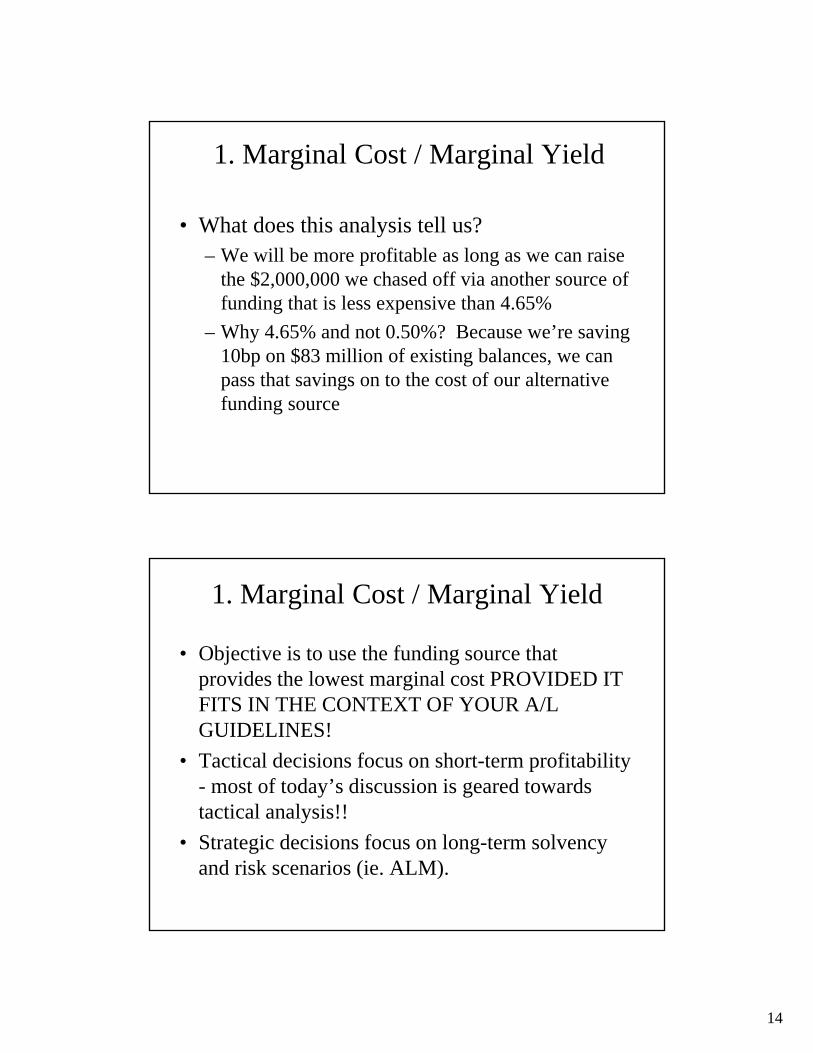
1. Marginal Cost / Marginal Yield
• What does this analysis tell us?– We will be more profitable as long as we can raise
the $2,000,000 we chased off via another source of funding that is less expensive than 4.65%
– Why 4.65% and not 0.50%? Because we’re saving 10bp on $83 million of existing balances, we can pass that savings on to the cost of our alternative funding source
1. Marginal Cost / Marginal Yield
• Objective is to use the funding source that provides the lowest marginal cost PROVIDED IT FITS IN THE CONTEXT OF YOUR A/L GUIDELINES!
• Tactical decisions focus on short-term profitability - most of today’s discussion is geared towards tactical analysis!!
• Strategic decisions focus on long-term solvency and risk scenarios (ie. ALM).
15
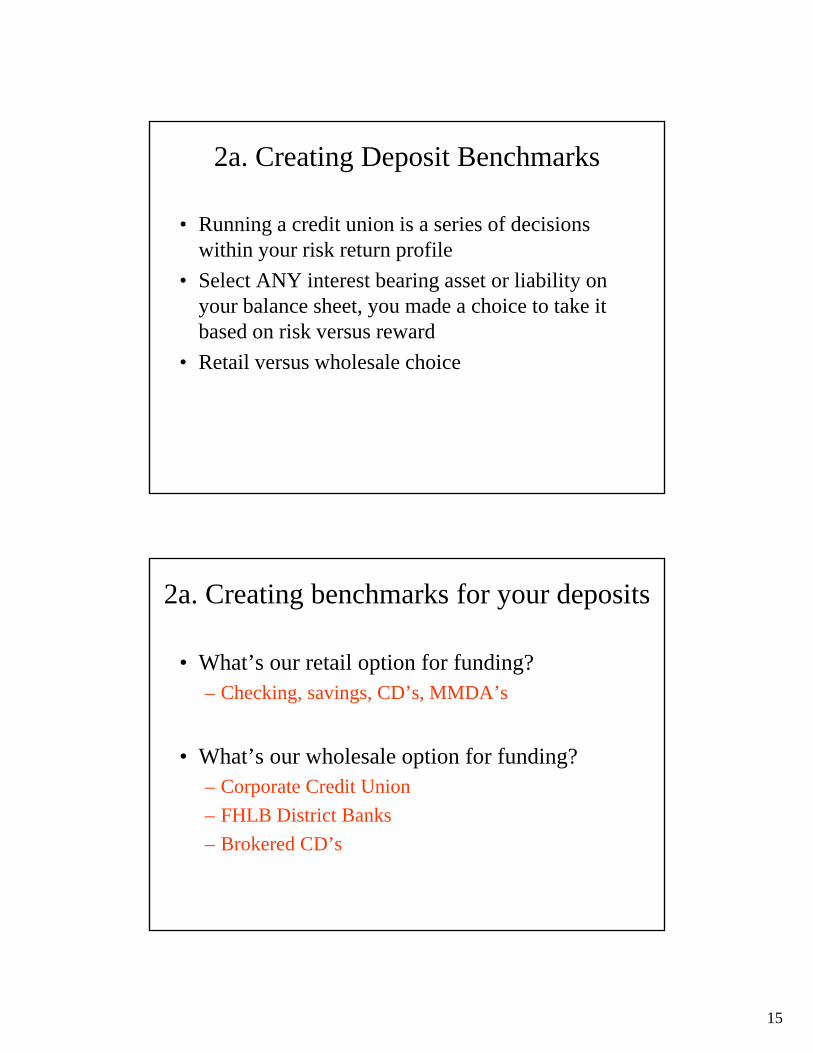
2a. Creating Deposit Benchmarks
• Running a credit union is a series of decisions within your risk return profile
• Select ANY interest bearing asset or liability on your balance sheet, you made a choice to take it based on risk versus reward
• Retail versus wholesale choice
2a. Creating benchmarks for your deposits
• What’s our retail option for funding?– Checking, savings, CD’s, MMDA’s
• What’s our wholesale option for funding?– Corporate Credit Union
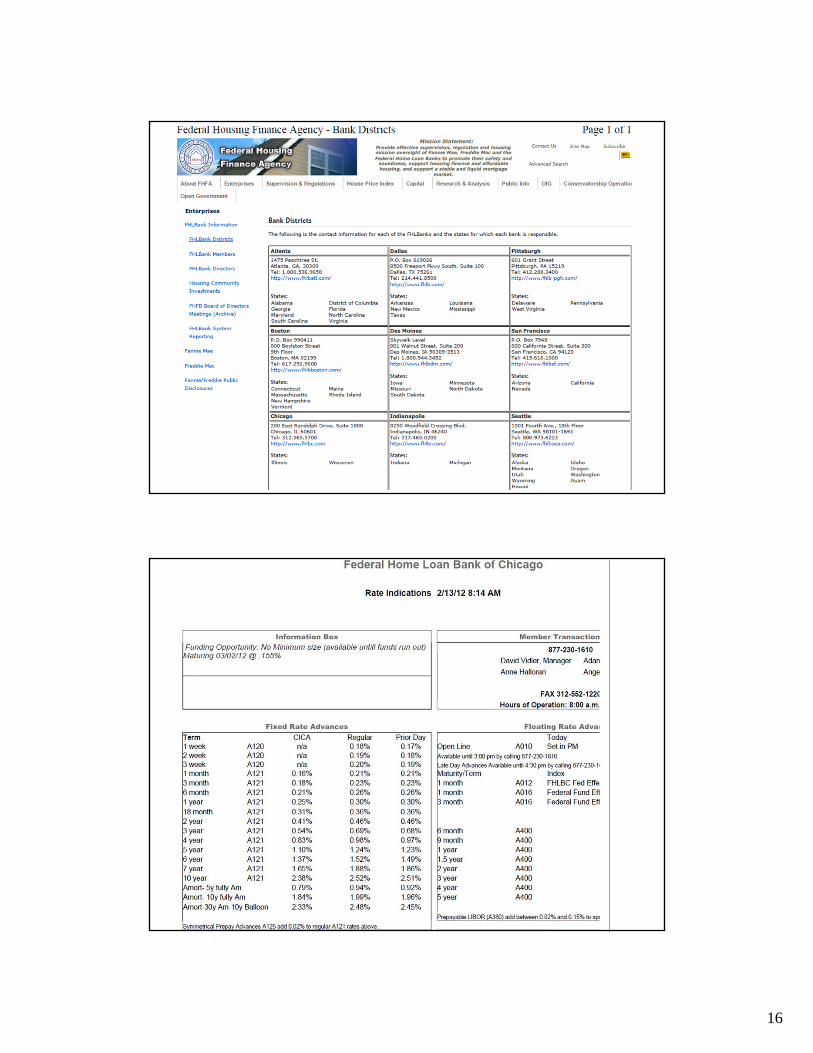
– FHLB District Banks
– Brokered CD’s
16
17
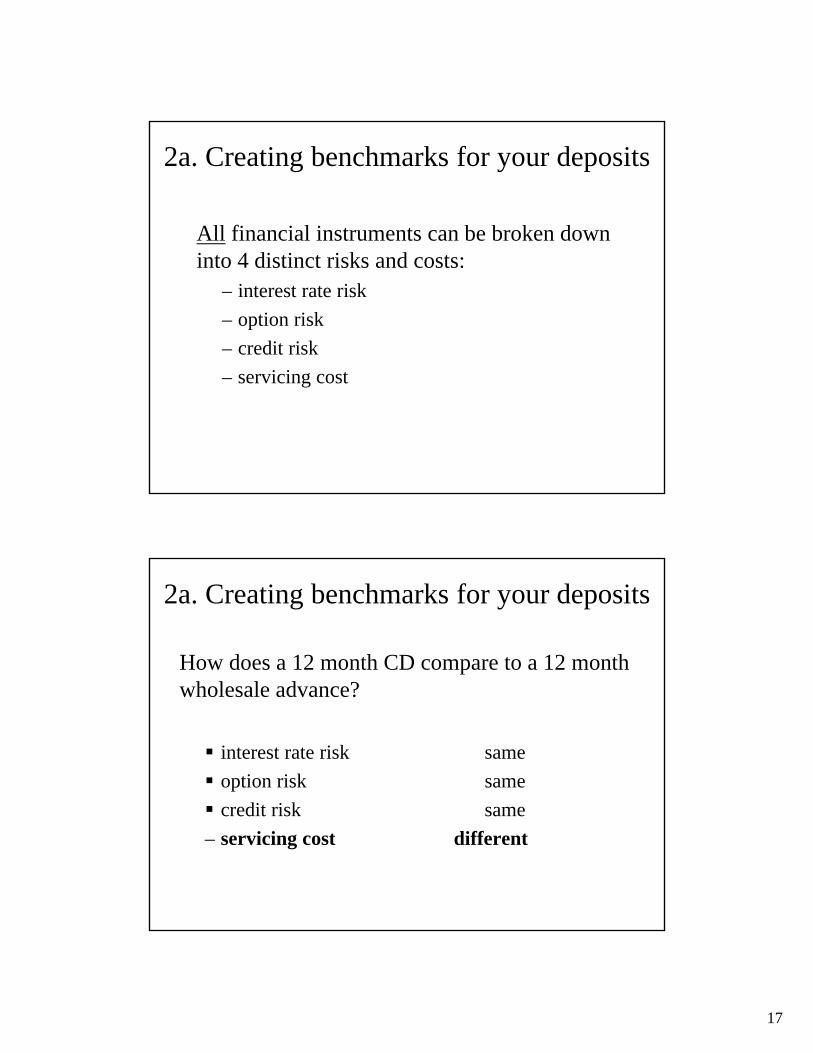
2a. Creating benchmarks for your deposits
All financial instruments can be broken down into 4 distinct risks and costs:
– interest rate risk
– option risk
– credit risk
– servicing cost
2a. Creating benchmarks for your deposits
How does a 12 month CD compare to a 12 month wholesale advance?
interest rate risk same
option risk same
credit risk same
– servicing cost different
18
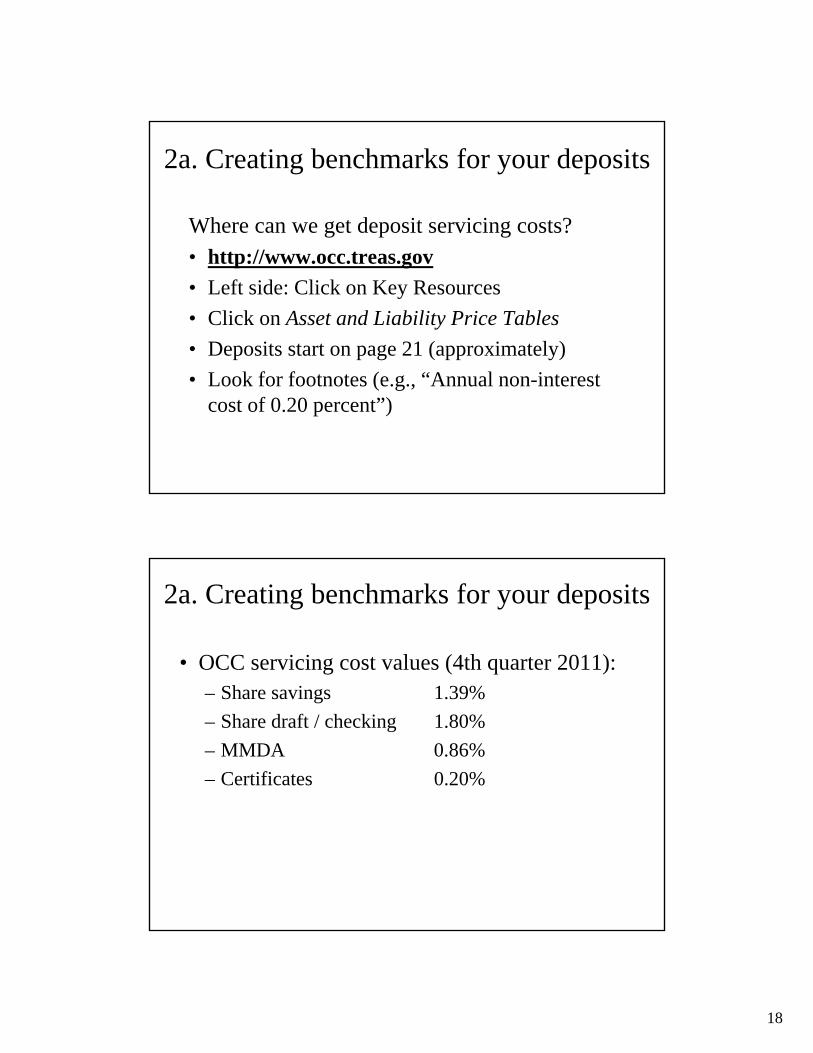
2a. Creating benchmarks for your deposits
Where can we get deposit servicing costs?• http://www.occ.treas.gov
• Left side: Click on Key Resources
• Click on Asset and Liability Price Tables
• Deposits start on page 21 (approximately)
• Look for footnotes (e.g., “Annual non-interest cost of 0.20 percent”)
2a. Creating benchmarks for your deposits
• OCC servicing cost values (4th quarter 2011):– Share savings 1.39%
– Share draft / checking 1.80%
– MMDA 0.86%
– Certificates 0.20%
19
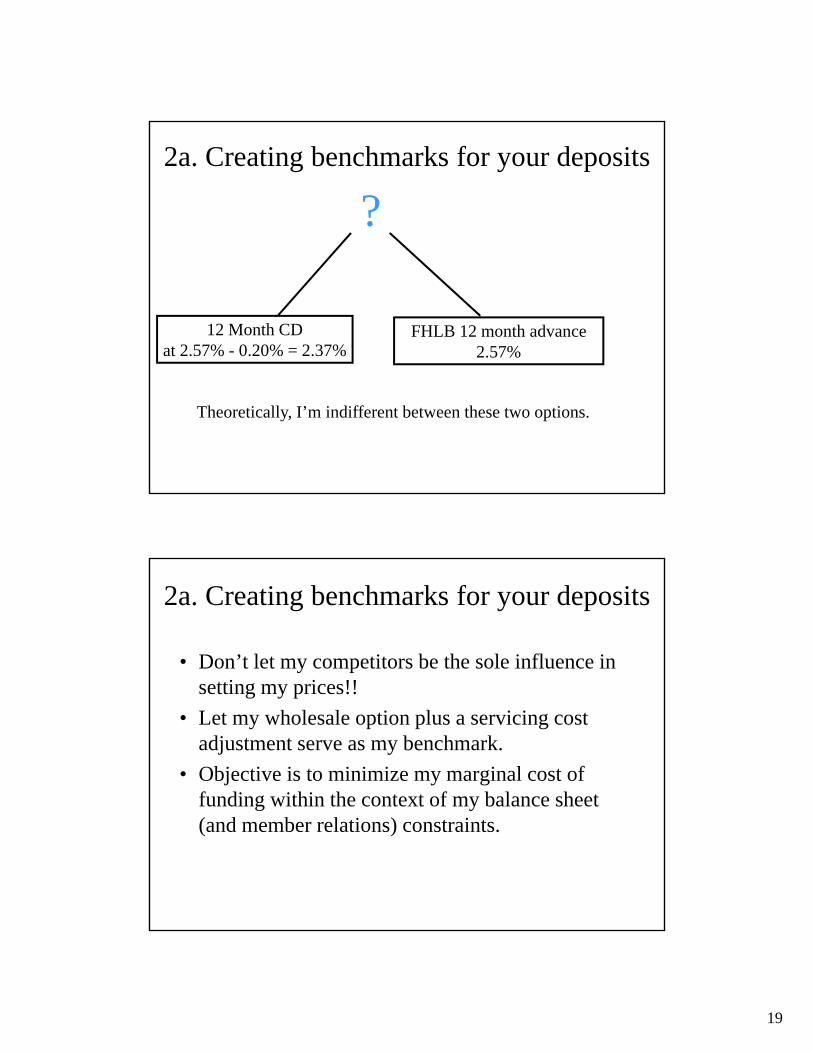
2a. Creating benchmarks for your deposits
12 Month CDat 2.57% - 0.20% = 2.37%
FHLB 12 month advance2.57%
Theoretically, I’m indifferent between these two options.
?
2a. Creating benchmarks for your deposits
• Don’t let my competitors be the sole influence in setting my prices!!
• Let my wholesale option plus a servicing cost adjustment serve as my benchmark.
• Objective is to minimize my marginal cost of funding within the context of my balance sheet (and member relations) constraints.
20
2a. Creating benchmarks for your deposits
Efficiently priced deposits have 2 benefits:
1. Minimized cost of funds = max net income
2. Use the benchmark as your discount rate when calculating present value of projected cash flows (NEV). To the extent that you consistently beat your wholesale alternative, your PV will be optimized.
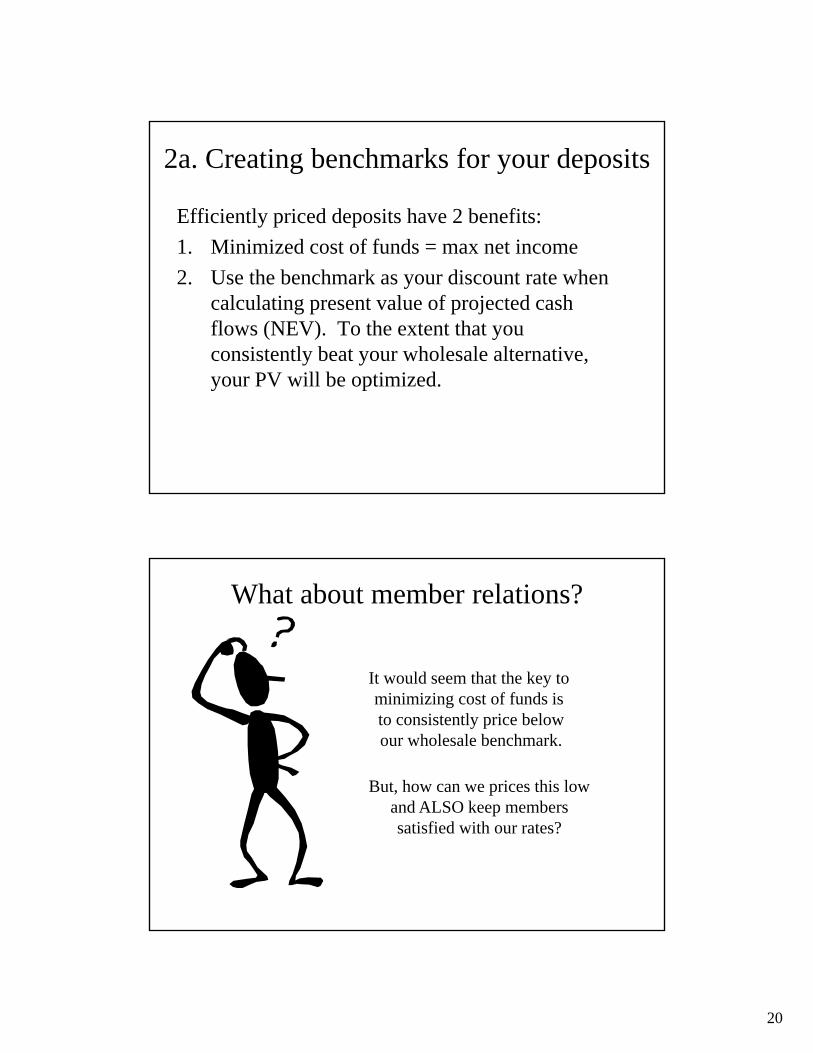
What about member relations?
But, how can we prices this lowand ALSO keep memberssatisfied with our rates?
It would seem that the key tominimizing cost of funds isto consistently price belowour wholesale benchmark.
21
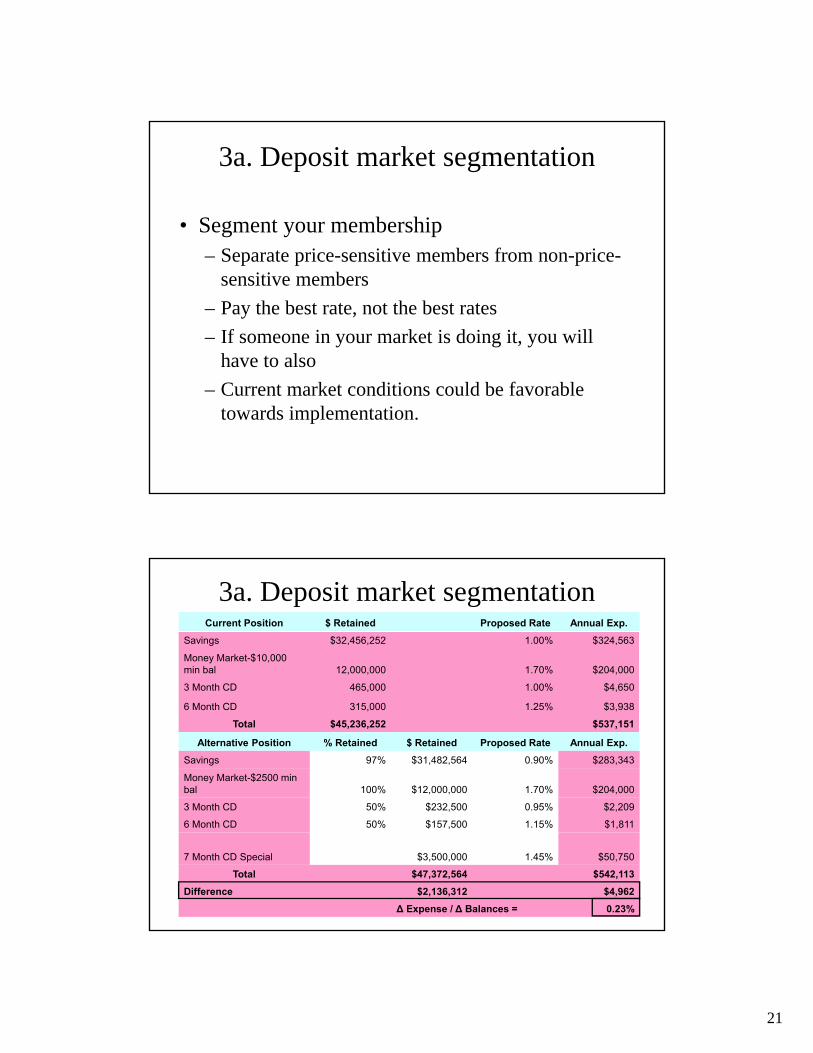
3a. Deposit market segmentation
• Segment your membership– Separate price-sensitive members from non-price-
sensitive members
– Pay the best rate, not the best rates
– If someone in your market is doing it, you will have to also
– Current market conditions could be favorable towards implementation.
3a. Deposit market segmentationCurrent Position $ Retained Proposed Rate Annual Exp.
Savings $32,456,252 1.00% $324,563
Money Market-$10,000 min bal 12,000,000 1.70% $204,000
3 Month CD 465,000 1.00% $4,650
6 Month CD 315,000 1.25% $3,938
Total $45,236,252 $537,151
Alternative Position % Retained $ Retained Proposed Rate Annual Exp.
Savings 97% $31,482,564 0.90% $283,343
Money Market-$2500 min bal 100% $12,000,000 1.70% $204,000
3 Month CD 50% $232,500 0.95% $2,209
6 Month CD 50% $157,500 1.15% $1,811
7 Month CD Special $3,500,000 1.45% $50,750
Total $47,372,564 $542,113
Difference $2,136,312 $4,962
Δ Expense / Δ Balances = 0.23%
22
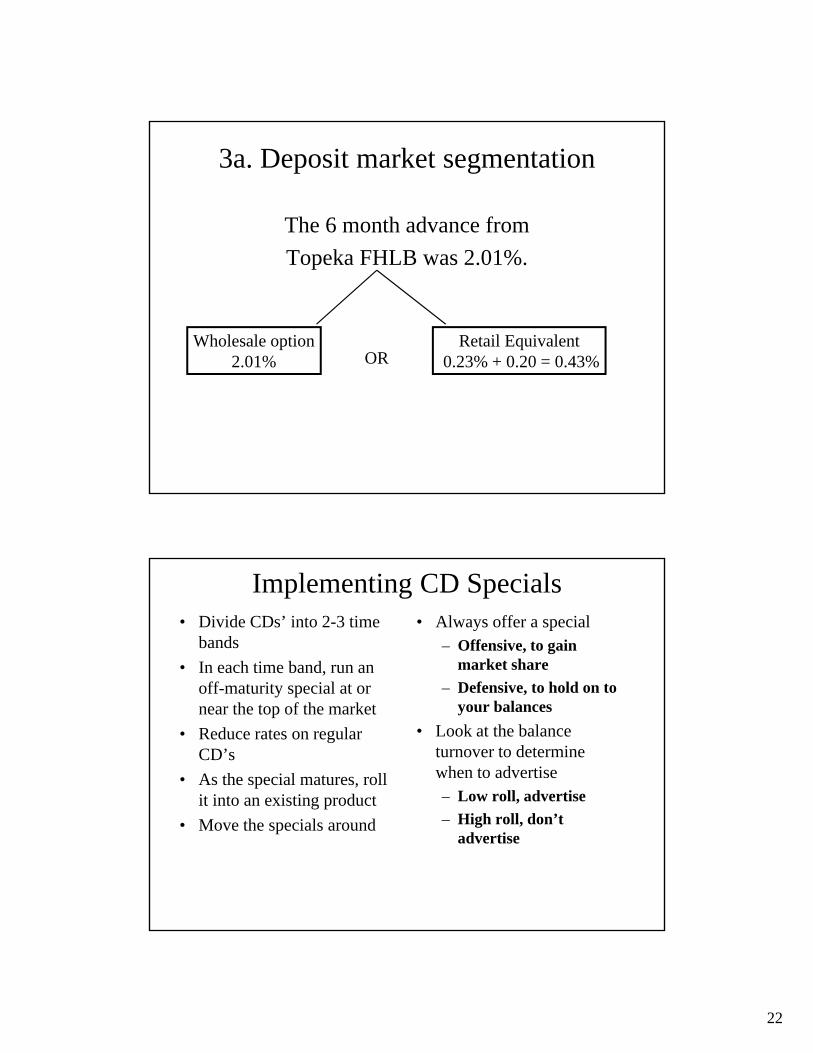
3a. Deposit market segmentation
The 6 month advance from
Topeka FHLB was 2.01%.
Wholesale option2.01%
Retail Equivalent0.23% + 0.20 = 0.43%OR
Implementing CD Specials• Divide CDs’ into 2-3 time
bands
• In each time band, run an off-maturity special at or near the top of the market
• Reduce rates on regular CD’s
• As the special matures, roll it into an existing product
• Move the specials around
• Always offer a special– Offensive, to gain
market share
– Defensive, to hold on to your balances
• Look at the balance turnover to determine when to advertise– Low roll, advertise
– High roll, don’t advertise
23
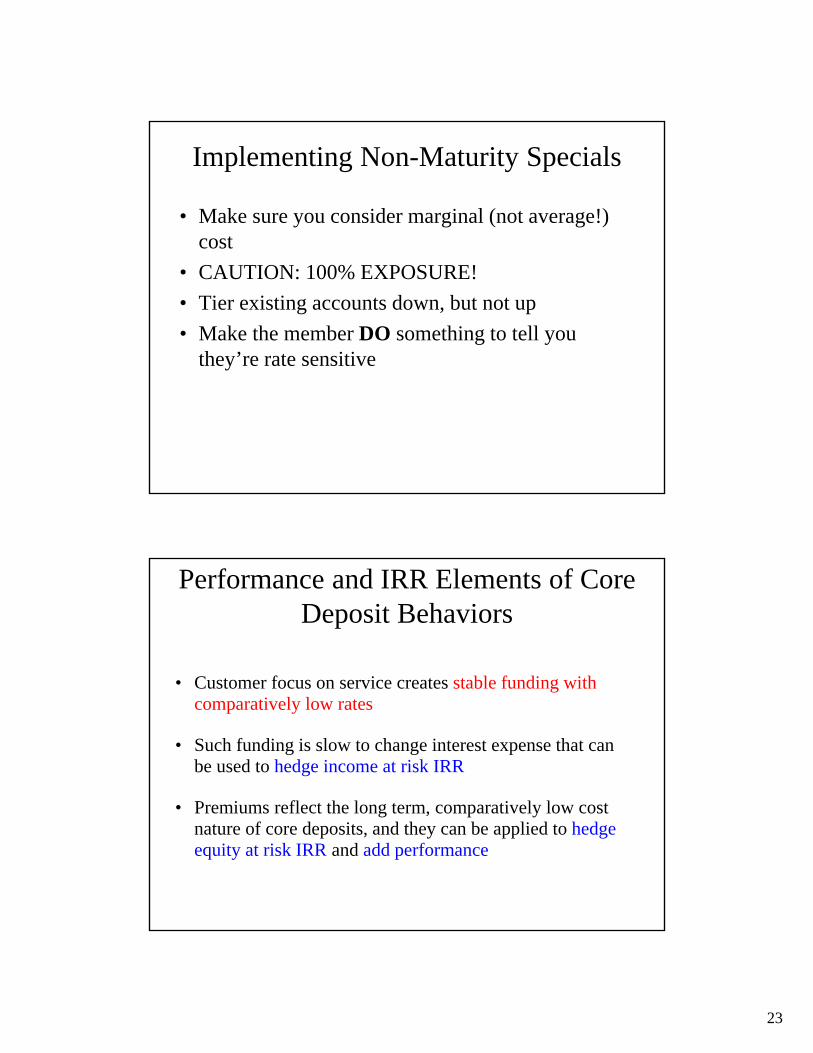
Implementing Non-Maturity Specials
• Make sure you consider marginal (not average!) cost
• CAUTION: 100% EXPOSURE!
• Tier existing accounts down, but not up
• Make the member DO something to tell you they’re rate sensitive
Performance and IRR Elements of Core Deposit Behaviors
• Customer focus on service creates stable funding with comparatively low rates
• Such funding is slow to change interest expense that can be used to hedge income at risk IRR
• Premiums reflect the long term, comparatively low cost nature of core deposits, and they can be applied to hedge equity at risk IRR and add performance
24
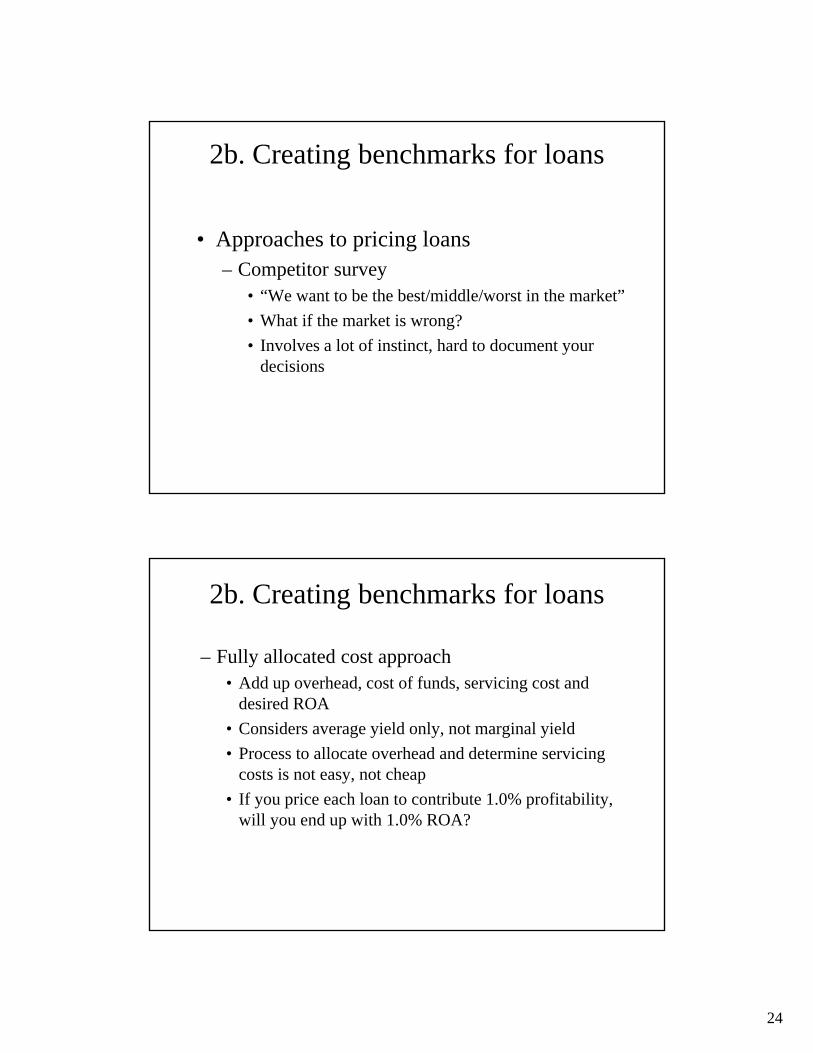
2b. Creating benchmarks for loans
• Approaches to pricing loans– Competitor survey
• “We want to be the best/middle/worst in the market”
• What if the market is wrong?
• Involves a lot of instinct, hard to document your decisions
2b. Creating benchmarks for loans
– Fully allocated cost approach• Add up overhead, cost of funds, servicing cost and
desired ROA
• Considers average yield only, not marginal yield
• Process to allocate overhead and determine servicing costs is not easy, not cheap
• If you price each loan to contribute 1.0% profitability, will you end up with 1.0% ROA?
25
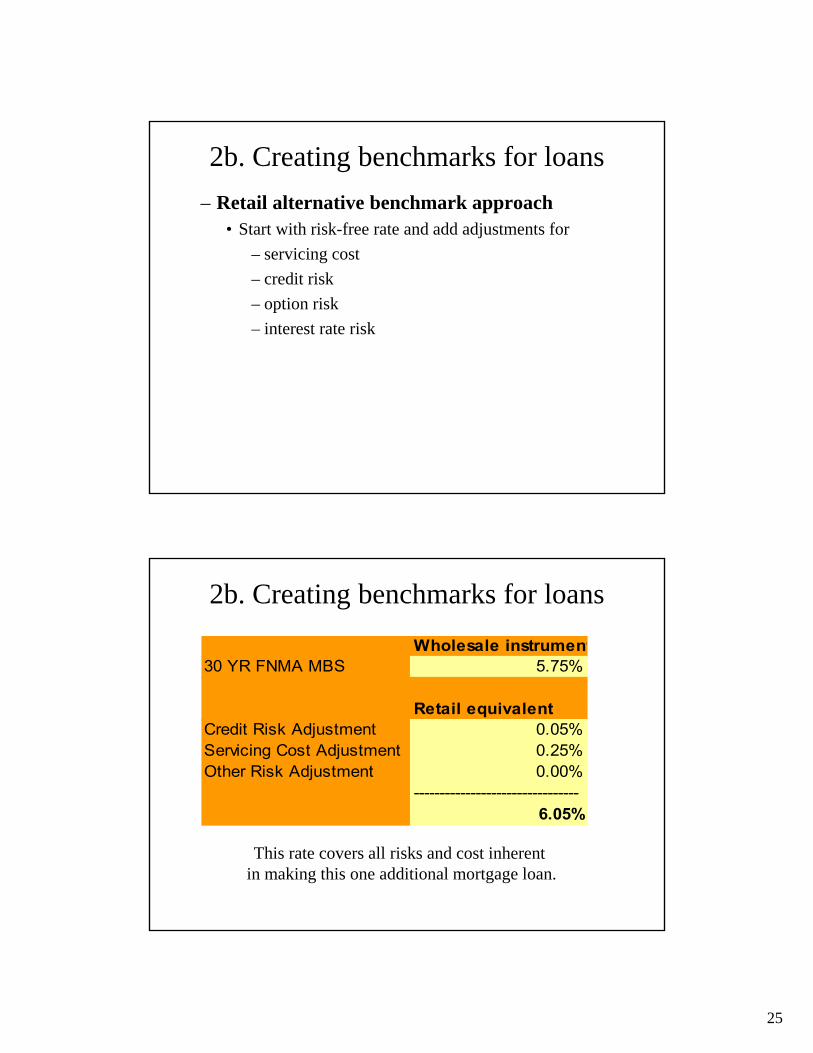
2b. Creating benchmarks for loans
– Retail alternative benchmark approach• Start with risk-free rate and add adjustments for
– servicing cost
– credit risk
– option risk
– interest rate risk
2b. Creating benchmarks for loans
This rate covers all risks and cost inherentin making this one additional mortgage loan.
Wholesale instrument30 YR FNMA MBS 5.75%
Retail equivalentCredit Risk Adjustment 0.05%Servicing Cost Adjustment 0.25%Other Risk Adjustment 0.00%
--------------------------------6.05%
26
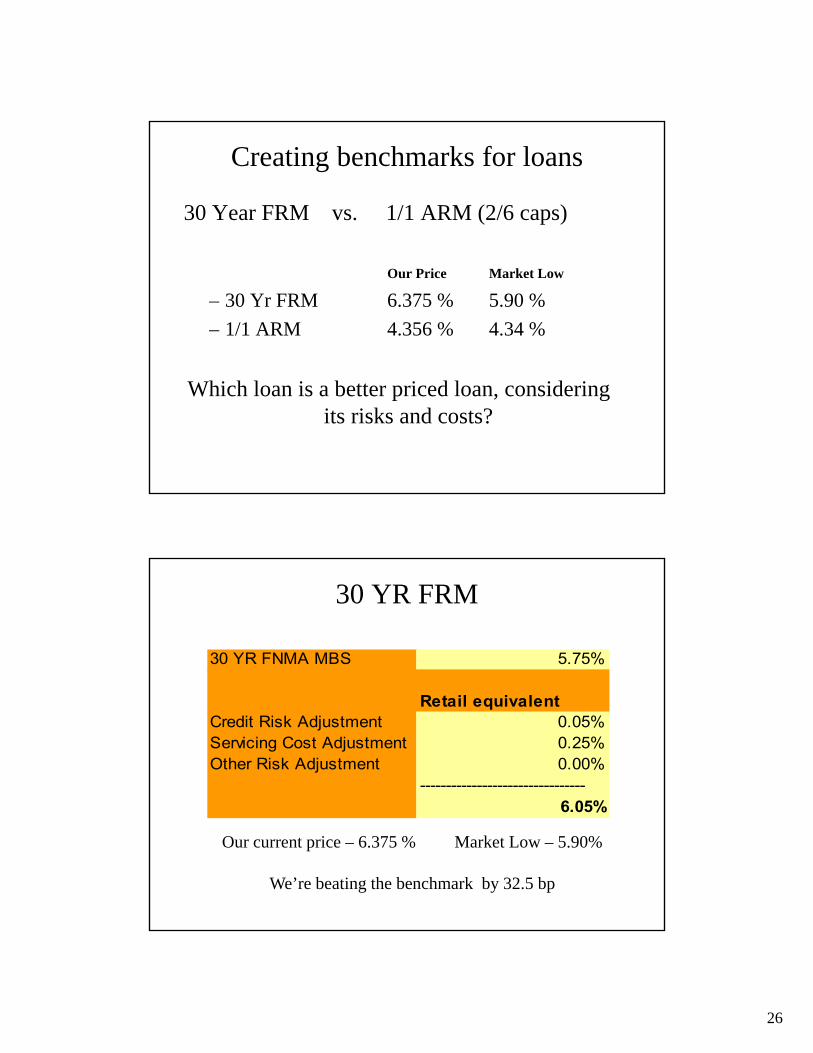
Creating benchmarks for loans
30 Year FRM vs. 1/1 ARM (2/6 caps)
Our Price Market Low
– 30 Yr FRM 6.375 % 5.90 %
– 1/1 ARM 4.356 % 4.34 %
Which loan is a better priced loan, considering its risks and costs?
30 YR FRM
Our current price – 6.375 % Market Low – 5.90%
We’re beating the benchmark by 32.5 bp
30 YR FNMA MBS 5.75%
Retail equivalentCredit Risk Adjustment 0.05%Servicing Cost Adjustment 0.25%Other Risk Adjustment 0.00%
--------------------------------6.05%
27
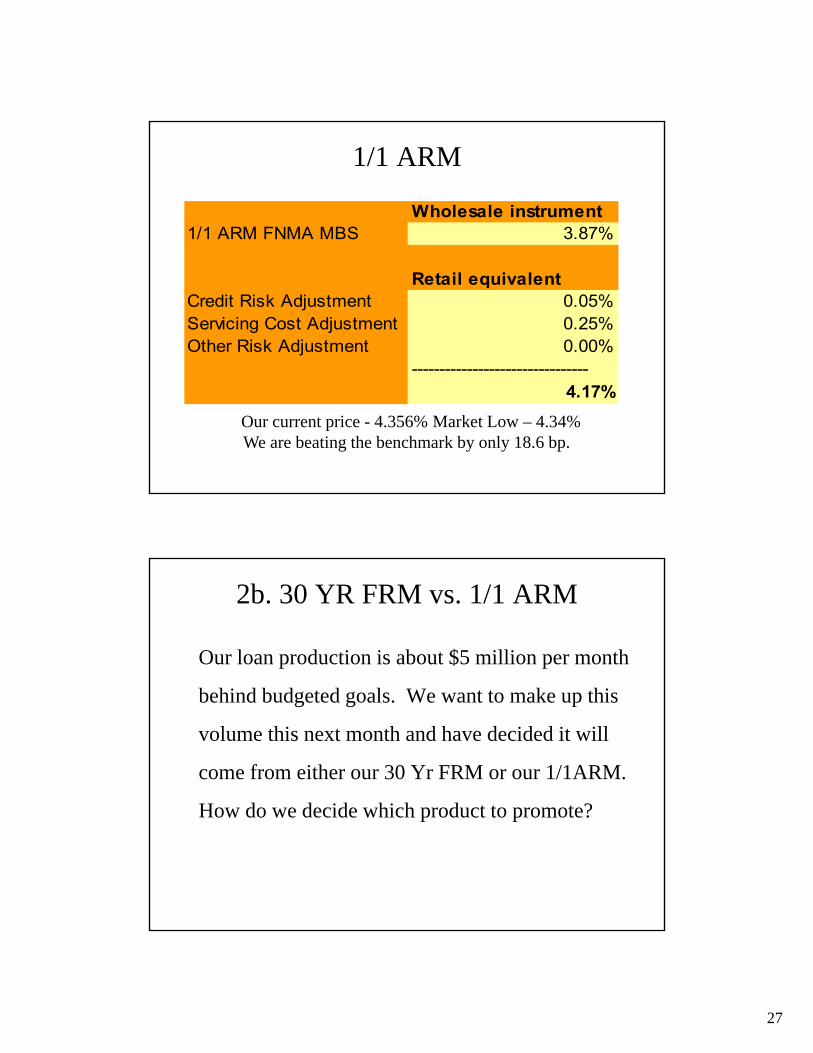
1/1 ARM
Our current price - 4.356% Market Low – 4.34%We are beating the benchmark by only 18.6 bp.
Wholesale instrument1/1 ARM FNMA MBS 3.87%
Retail equivalentCredit Risk Adjustment 0.05%Servicing Cost Adjustment 0.25%Other Risk Adjustment 0.00%
--------------------------------4.17%
2b. 30 YR FRM vs. 1/1 ARM
Our loan production is about $5 million per month
behind budgeted goals. We want to make up this
volume this next month and have decided it will
come from either our 30 Yr FRM or our 1/1ARM.
How do we decide which product to promote?
28
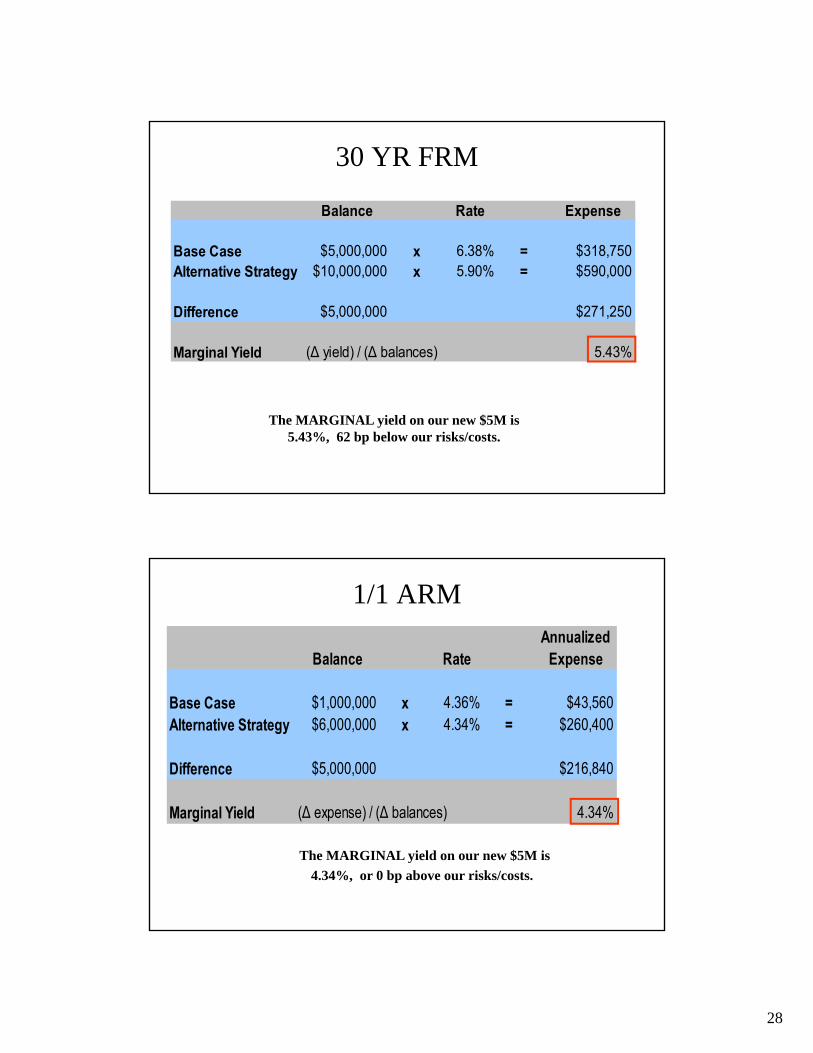
30 YR FRM
The MARGINAL yield on our new $5M is 5.43%, 62 bp below our risks/costs.
Balance Rate Expense
Base Case $5,000,000 x 6.38% = $318,750Alternative Strategy $10,000,000 x 5.90% = $590,000
Difference $5,000,000 $271,250
Marginal Yield (Δ yield) / (Δ balances) 5.43%
1/1 ARMAnnualized
Balance Rate Expense
Base Case $1,000,000 x 4.36% = $43,560Alternative Strategy $6,000,000 x 4.34% = $260,400
Difference $5,000,000 $216,840
Marginal Yield (Δ expense) / (Δ balances) 4.34%
The MARGINAL yield on our new $5M is
4.34%, or 0 bp above our risks/costs.
29
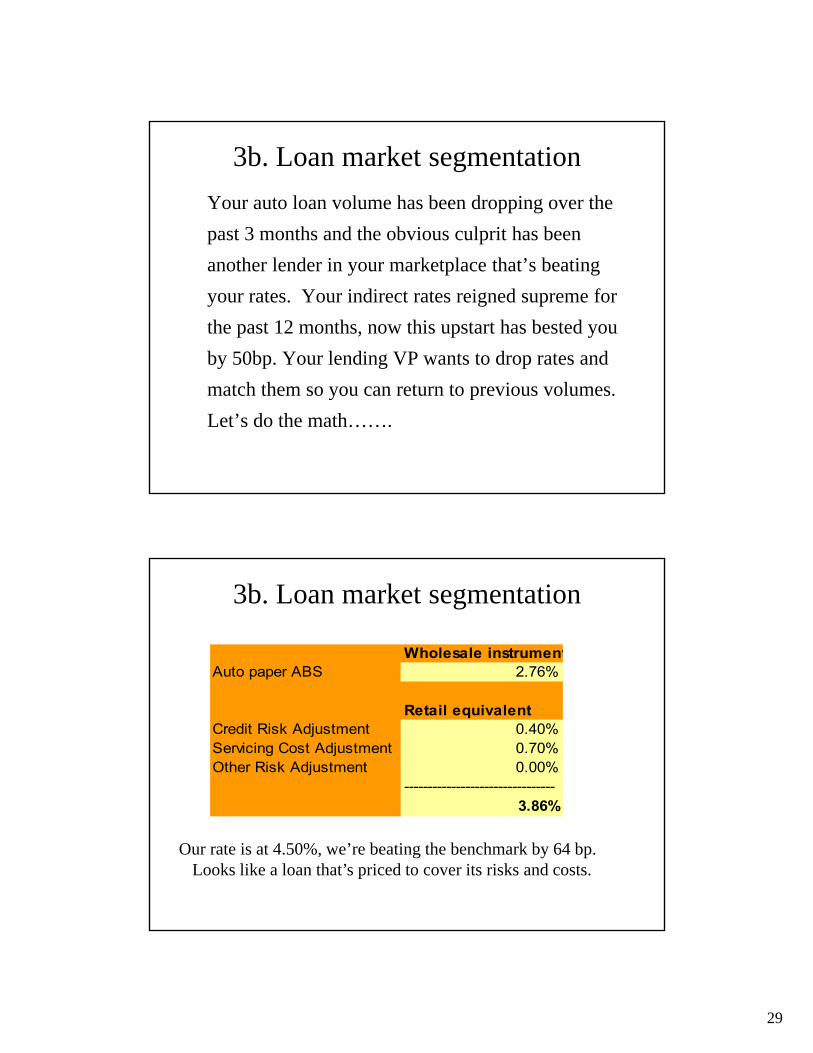
3b. Loan market segmentation
Your auto loan volume has been dropping over the
past 3 months and the obvious culprit has been
another lender in your marketplace that’s beating
your rates. Your indirect rates reigned supreme for
the past 12 months, now this upstart has bested you
by 50bp. Your lending VP wants to drop rates and
match them so you can return to previous volumes.
Let’s do the math…….
3b. Loan market segmentation
Our rate is at 4.50%, we’re beating the benchmark by 64 bp. Looks like a loan that’s priced to cover its risks and costs.
Wholesale instrumentAuto paper ABS 2.76%
Retail equivalentCredit Risk Adjustment 0.40%Servicing Cost Adjustment 0.70%Other Risk Adjustment 0.00%
--------------------------------3.86%
30
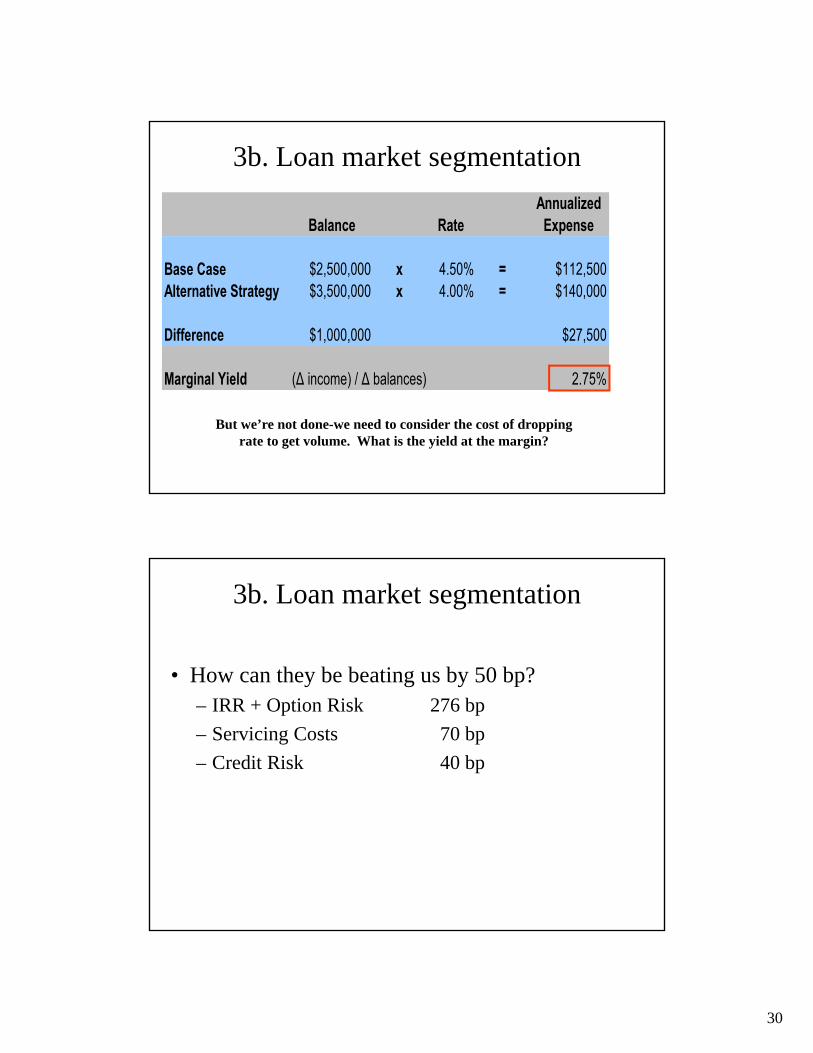
But we’re not done-we need to consider the cost of dropping rate to get volume. What is the yield at the margin?
3b. Loan market segmentation
AnnualizedBalance Rate Expense
Base Case $2,500,000 x 4.50% = $112,500Alternative Strategy $3,500,000 x 4.00% = $140,000
Difference $1,000,000 $27,500
Marginal Yield (Δ income) / Δ balances) 2.75%
3b. Loan market segmentation
• How can they be beating us by 50 bp?– IRR + Option Risk 276 bp
– Servicing Costs 70 bp
– Credit Risk 40 bp
31
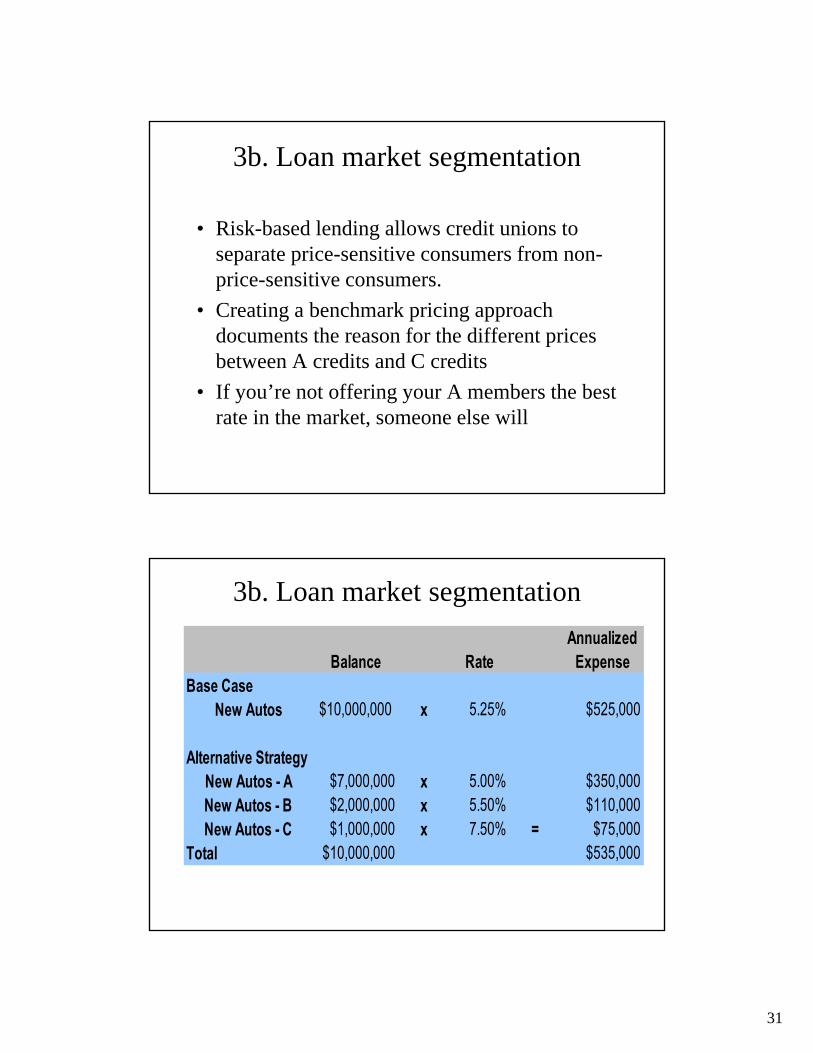
3b. Loan market segmentation
• Risk-based lending allows credit unions to separate price-sensitive consumers from non-price-sensitive consumers.
• Creating a benchmark pricing approach documents the reason for the different prices between A credits and C credits
• If you’re not offering your A members the best rate in the market, someone else will
3b. Loan market segmentation
AnnualizedBalance Rate Expense
Base CaseNew Autos $10,000,000 x 5.25% $525,000
Alternative Strategy
New Autos - A $7,000,000 x 5.00% $350,000New Autos - B $2,000,000 x 5.50% $110,000New Autos - C $1,000,000 x 7.50% = $75,000
Total $10,000,000 $535,000