asset management plan - shire of wagin · 1.0 6/06/2013 first draft of roads & bridges amp...
TRANSCRIPT

SHIRE OF WAGIN – ROADS AND BRIDGES ASSET MANAGEMENT PLAN
AM4SRRC
SHIRE OF WAGIN
ROADS AND BRIDGES
Asset Management Plan
Version 1.0
June 2013

SHIRE OF WAGIN – ROADS AND BRIDGES ASSET MANAGEMENT PLAN
Document Control Asset Management for Small, Rural or Remote Communities
SHIRE OF WAGIN ROADS AND BRIDGES ASSET MANAGEMENT PLAN
Rev No Date Revision Details Author Reviewer Approver
1.0 6/06/2013 First Draft of Roads & Bridges AMP based on
data from RAMM
DL DL DL
This Asset Management Plan was prepared by Dominic Carbone & Associates, and DL Consulting.
Development of this plan has been supported by the Department of Local Government and
Communities funding from the Local Government Reform Fund, which is administered by the
Australian Government’s Department of Regional Australia, Local Government, Arts and Sport.
DCA DOMINIC CARBONE AND ASSOCIATES
SUITE 7, 64 CANNING HIGHWAY
VICTORIA PARK, WA 6100
PHONE: (08) 9472 0184
MOBILE: 0448 120 652
EMAIL: [email protected]
16 Granada Loop
Seville Grove WA 6112
Phone – (08) 9399 8840
Mobile – 0430 553 675
Email – [email protected]
Asset Management for Small, Rural or Remote Communities Practice Note
The Institute of Public Works Engineering Australia.
www.ipwea.org.au/AM4SRRC
© Copyright 2011 – All rights reserved.

- i -
SHIRE OF WAGIN – ROADS AND BRIDGES ASSET MANAGEMENT PLAN
TABLE OF CONTENTS
1. EXECUTIVE SUMMARY .................................................................................................................................. iii 2. INTRODUCTION .............................................................................................................................................. 1
2.1 Background ........................................................................................................................................... 1 2.2 Goals and Objectives of Asset Management ........................................................................................ 2 2.3 Plan Framework .................................................................................................................................... 3 2.4 Core and Advanced Asset Management ............................................................................................... 3 2.5 Community Consultation ...................................................................................................................... 3
3. LEVELS OF SERVICE ........................................................................................................................................ 4 3.1 Customer Research and Expectations ................................................................................................... 4 3.2 Legislative Requirements ...................................................................................................................... 4 3.3 Current Levels of Service ....................................................................................................................... 5 3.4 Desired Levels of Service ....................................................................................................................... 7
4. FUTURE DEMAND .......................................................................................................................................... 8 4.1 Demand Forecast .................................................................................................................................. 8 4.2 Changes in Technology .......................................................................................................................... 8 4.3 Demand Management Plan .................................................................................................................. 9 4.4 New Assets from Growth ...................................................................................................................... 9
5. LIFECYCLE MANAGEMENT PLAN .................................................................................................................. 10 5.1 Background Data ................................................................................................................................. 10 5.2 Risk Management Plan ........................................................................................................................ 14 5.3 Routine Maintenance Plan .................................................................................................................. 15 5.4 Renewal/Replacement Plan ................................................................................................................ 16 5.5 Creation/Acquisition/Upgrade Plan .................................................................................................... 18 5.6 Disposal Plan ....................................................................................................................................... 19
6. FINANCIAL SUMMARY ................................................................................................................................. 20 6.1 Financial Statements and Projections ................................................................................................. 20 6.2 Funding Strategy ................................................................................................................................. 23 6.3 Valuation Forecasts ............................................................................................................................. 23 6.4 Key Assumptions made in Financial Forecasts .................................................................................... 25
7. ASSET MANAGEMENT PRACTICES ............................................................................................................... 26 7.1 Accounting/Financial Systems............................................................................................................. 26 7.2 Asset Management Systems ............................................................................................................... 26 7.3 Information Flow Requirements and Processes ................................................................................. 27 7.4 Standards and Guidelines ................................................................................................................... 27
8. PLAN IMPROVEMENT AND MONITORING ................................................................................................... 28 8.1 Performance Measures ....................................................................................................................... 28 8.2 Improvement Plan ............................................................................................................................... 28 8.3 Monitoring and Review Procedures .................................................................................................... 28
REFERENCES .......................................................................................................................................................... 29 APPENDICES .......................................................................................................................................................... 30
Appendix A Maintenance Response Levels of Service ................................................................................... 31 Appendix B Projected 10 year Capital Renewal Works Program ................................................................... 32 Appendix C Planned Upgrade/Exp/New 10 year Capital Works Program ...................................................... 41 Appendix D Abbreviations .............................................................................................................................. 42 Appendix E Glossary ....................................................................................................................................... 43

- ii -
SHIRE OF WAGIN – ROADS AND BRIDGES ASSET MANAGEMENT PLAN
This page is left intentionally blank.

- iii -
SHIRE OF WAGIN – ROADS AND BRIDGES ASSET MANAGEMENT PLAN
1. EXECUTIVE SUMMARY
Context
The Shire of Wagin is located in the heart of the Great Southern, 228kms south east of Perth. The economy of the Shire is based on agriculture, with wheat, barley, oats, canola and lupins being the main crops, and sheep and cattle production being prominent. The Shire of Wagin occupies an area of 1,950km² and has within its boundaries the localities of Piesseville and Wagin
The objective of this Roads and Bridges Asset Management Plan is to outline all the tasks and resources required to manage and maintain Council’s roads and bridges portfolio to an agreed standard. This Asset Management Plan provides a detailed overview of the ongoing management of the Roads and Bridges assets. This plan acts as a tool to support the ability of Council to deliver well targeted, responsive and value for money maintenance and operational services for customers and the community as a whole.
The Transport Service The Transport network comprises:
Sealed roads – 171.08 kms
Paved roads - 379.10 kms
Formed roads - 204.93 kms
Kerbing 41.06 kms These infrastructure assets have a replacement value of $105,398,297.
What does it Cost?
The projected cost to provide the services covered by this Asset Management Plan includes operations, maintenance, renewal and upgrade of existing assets over the 10 year planning period is $50,797,000 or $5,080,000 per year.
Council’s estimated available funding for this period is $20,707,000 or $2,071,000 per year. This is a funding shortfall of ($3,009,000) per year, or 41% of the cost to provide the service. Projected and budgeted expenditure are shown in the graph below.
Councils’ present funding levels are insufficient to continue to provide existing services at current levels in the medium term.
What we will do
Council plans to provide Transport services for the following:
Operation, maintenance, renewal and upgrade of Roads and Bridges assets to meet service levels set by council in annual budgets.
Major renewals to roads classified as Regionally Significant Local Roads within the 10 year planning period.
What we cannot do
Council does not have enough funding to provide all services at the desired service levels or provide new services. Works and services that cannot be provided under present funding levels are:
A significant proportion of the projected renewal works that have been identified in the RoMan 10 Year Forward Works Program.
A signification proportion of the projected reconstruction works that have been identified in the RoMan 10 Year Forward Works Program.
Managing the Risks
There are risks associated with providing the service and not being able to complete all identified activities and projects. We have identified major risks as:
Poor condition of asset causes vehicle damage;
Poor condition of asset causes injury;
Flooding causing damage to asset;
Damage to asset caused by natural disaster.
We will endeavour to manage these risks within available funding by:
Establish routine inspection regimes;
Evaluate appropriate designs for flood prone areas;
Monitor weather forecasting and general preparedness.

- iv -
SHIRE OF WAGIN – ROADS AND BRIDGES ASSET MANAGEMENT PLAN
The Next Steps
The actions resulting from this asset management plan are:
Assess first years costs against actual.
Prepare ranking system for renewals.
Review maintenance practices and align with service level requirements.
Review latest road building technologies and practices and train staff in contemporary techniques.
Ongoing rolling program of data collection.
Community consultation on service level provision.
Questions you may have
What is this plan about?
This asset management plan covers the infrastructure assets that serve the Shire of Wagin Community’s Roads and Bridges, and Footpaths needs. These assets include sealed roads, unsealed roads, bridges and footpaths throughout the Council area that enable people to have access to a safe and suitable road transport network.
What is an Asset Management Plan?
Asset management planning is a comprehensive process to ensure delivery of services from infrastructure is provided in a financially sustainable manner.
An asset management plan details information about infrastructure assets including actions required to provide an agreed level of service in the most cost effective manner. The Plan defines the services to be provided, how the services are provided and what funds are required to provide the services.
Why is there a funding shortfall?
Most of the Council’s roads and bridges network was constructed from government grants often provided and accepted without consideration of ongoing operations, maintenance and replacement needs.
Many of these assets are approaching the later years of their life and require replacement, services from the assets are decreasing and maintenance costs are increasing.
Councils’ present funding levels are insufficient to continue to provide existing services at current levels in the medium term.
What options do we have?
Resolving the funding shortfall involves several steps:
1. Improving asset knowledge so that data accurately records the asset inventory, how assets are performing and when assets are not able to provide the required service levels,
2. Improving our efficiency in operating, maintaining, replacing existing and constructing new assets to optimise life cycle costs,
3. Identifying and managing risks associated with providing services from infrastructure,
4. Making tradeoffs between service levels and costs to ensure that the community receives the best return from infrastructure,
5. Consulting with the community to ensure that transport services and costs meet community needs and are affordable,
6. Developing partnerships with other bodies, where available to provide services;
7. Seeking additional funding from governments and other bodies to better reflect a ‘whole of government’ funding approach to infrastructure services.
What happens if we don’t manage the shortfall?
It is likely that council will have to reduce service levels in some areas, unless new sources of revenue are found. For Transport, the service level reduction may include reverting a sealed road back to gravel, or reducing the number of times a road is graded per year.
What can we do?
Council can develop options and priorities for future Transport services with costs of providing the services, consult with the community to plan future services to match the community services needs with ability to pay for services and maximise benefit to the community for costs to the community.

- 1 -
SHIRE OF WAGIN – ROADS AND BRIDGES ASSET MANAGEMENT PLAN
2. INTRODUCTION
2.1 Background
This asset management plan is to demonstrate responsive management of assets (and services provided from assets), compliance with regulatory requirements, and to communicate funding needed to provide the required levels of service.
The asset management plan is to be read with Council’s Asset Management Policy, Asset Management Strategy and the following associated planning documents:
Strategic Community Plan Forward Capital Works Plan Annual Budget Risk Management Policy Department of Local Government Asset Management Framework and Guidelines
The infrastructure assets covered by this asset management plan are shown in Table 2.1.
Table 2.1: Assets covered by this Plan
Asset Category Dimension Replacement Value Written Down Value
Roads Seal: 171.08 kms Pavement: 379.10 kms Formation: 204.93 kms Unformed: 0.00 kms
$46,626,830 $47,292,747 $11,478,720
$0
$29,308,594 $35,024,982 $11,478,720
$0
Sub-Total Roads 755.11 kms $105,398,297 $75,812,296
Kerbing Concrete: 41.06 kms $879,505 $445,750
TOTAL $106,277,802 $76,258,046
Note: The formation value is not depreciable, therefore does not form part of the Depreciable Value when
undertaking the financial modelling. Key stakeholders in the preparation and implementation of this Transport Asset Management Plan can be divided into internal and external stakeholders. Internal stakeholders include: The Shire of Wagin Council Custodian of the assets, community representation and
administration Chief Executive Council representation and administration, Identification
and definition of level of service requirements Operations Team Design parameters, standards, operation and
administration External stakeholders include: Shire of Wagin Community Asset users, service level expectations Visitors to the Shire of Wagin Asset users Local Government Insurance Services Minimisation of risk Fire and Emergency Services Authority Road Rescue and Emergency Services
- 2 -
SHIRE OF WAGIN – ROADS AND BRIDGES ASSET MANAGEMENT PLAN
2.2 Goals and Objectives of Asset Management
The Council exists to provide services to its community. Some of these services are provided by infrastructure assets. Council has acquired infrastructure assets by contract, construction by council staff and by donation of assets constructed by developers and others to meet increased levels of service.
Council’s goal in managing infrastructure assets is to meet the required level of service in the most cost effective manner for present and future consumers. The key elements of infrastructure asset management are:
Taking a life cycle approach,
Developing cost-effective management strategies for the long term,
Providing a defined level of service and monitoring performance,
Understanding and meeting the demands of growth through demand management and infrastructure investment,
Managing risks associated with asset failures,
Sustainable use of physical resources,
Continuous improvement in asset management practices.1
The goal of this asset management plan is to:
Document the services/service levels to be provided and the costs of providing the service,
Communicate the consequences for service levels and risk, where desired funding is not available, and
Provide information to assist decision makers in trading off service levels, costs and risks to provide services in a financially sustainable manner.
This asset management plan is prepared under the direction of Council’s vision, mission, goals and objectives.
Council’s vision is:
“To live in a community where individuals, families and businesses can invest and prosper, while preserving the traditional, safe, affordable and inclusive country lifestyle and ensuring that Wagin is a place people like to live in and visit”.
Council’s mission is:
“To be a community focused local government providing progressive and innovative leadership that will build a sustainable future for all the region while supporting the vibrant and caring community by continuing to develop as a country centre of the future, with an economy built on environmental sustainability principles”.
Relevant goals and objectives and how these are addressed in this asset management plan are shown in Table 2.2.
Table 2.2: Organisation Goals and how these are addressed in this Plan
Goal Objective How Goal and Objectives are addressed in AMP
Provision of a high standard of transport infrastructure for the community at an acceptable standard of presentation, useability and safety.
To provide, maintain and replace transport infrastructure as necessary.
Maintenance, capital renewal and capital upgrade requirements are identified and implemented.
To ensure that all unsealed rural roads throughout the shire receive maintenance attention on a regular cyclical basis.
1 IPWEA, 2006, IIMM Sec 1.1.3, p 1.3.

- 3 -
SHIRE OF WAGIN – ROADS AND BRIDGES ASSET MANAGEMENT PLAN
2.3 Plan Framework
Key elements of the plan are
Levels of service – specifies the services and levels of service to be provided by council.
Future demand – how this will impact on future service delivery and how this is to be met.
Life cycle management – how the organisation will manage its existing and future assets to provide the required services
Financial summary – what funds are required to provide the required services.
Asset management practices
Monitoring – how the plan will be monitored to ensure it is meeting the organisation’s objectives.
Asset management improvement plan
2.4 Core and Advanced Asset Management
This asset management plan is prepared as a first cut ‘core’ asset management plan in accordance with the International Infrastructure Management Manual
2 and the Asset Management Framework and Guidelines
3. It is
prepared to meet minimum legislative and organisational requirements for sustainable service delivery and long term financial planning and reporting. Core asset management is a ‘top down’ approach where analysis is applied at the ‘system’ or ‘network’ level.
2.5 Community Consultation
The Asset Management Framework and Guidelines require local governments to consult with the community on their service requirements, expectations and satisfaction levels as part of the community’s ongoing engagement in relation to asset management.
The local government is required to report annually on its asset management; with the community providing feedback on the local government’s asset management performance.
This ‘core’ asset management plan is prepared to facilitate community consultation initially through feedback on public display of draft asset management plans prior to adoption by Council. Future revisions of the asset management plan will incorporate community consultation on existing and future service needs, service levels and costs of providing the service.
This will assist Council and the community in matching the level of service needed by the community, service risks and consequences with the community’s ability to pay for the service.
2 IPWEA, 2006.
3 Department of Local Government (WA), 2011.

- 4 -
SHIRE OF WAGIN – ROADS AND BRIDGES ASSET MANAGEMENT PLAN
3. LEVELS OF SERVICE
3.1 Customer Research and Expectations
Council has not carried out any research on customer expectations. This will be investigated for future updates of the asset management plan.
3.2 Legislative Requirements
Council has to meet many legislative requirements including Australian and State legislation and State regulations. Relevant legislation is shown in Table 3.2.
Table 3.2: Legislative Requirements
Legislation Requirement
Aboriginal Heritage Act 1972 Preservation of the community places and objects used by traditional owners.
Aboriginal Heritage Regulations 1974
Preservation of the community places and objects used by traditional owners.
Disability Services Act 1993 An Act for the establishment of the Disability Services Commission and the Ministerial Advisory Council on Disability, for the progress of principles applicable to people with disabilities, for the funding and provision of services to such people that meet certain objectives, for the resolution of complaints by such people and for related purposes.
Disability Services Regulations 2004
Current amendments to Disability Services Act (1993)
Environmental Protection Act 1986 and associated regulations
To provide for an Environmental Protection Authority, for the prevention, control and abatement of environmental pollution, conservation, preservation, protection, enhancement and management of the environment.
Environmental Protection and Biodiversity Act 1999 (Cwth)
To provide for the prevention, control and abatement of environmental pollution, conservation, preservation, protection, enhancement and management of the environment.
Land Administration Act 1997 To make provision for the management and reservation of Crown Land.
Local Government Act 1995 Sets out role, purpose, responsibilities and powers of local governments including the preparation of a long term financial plan supported by asset management plans for sustainable service delivery.
Local Government (Financial Assistance) Act 1995
Sets out the allocation of how financial assistance for local government by means of grants will be provided to the States, Capital Territory and the Northern Territory.
Local Government (Miscellaneous Provisions) Act 1960
To provide for the good rule, government, convenience, comfort and safety of persons in local government districts.
Main Roads Act 1930 To provide for the construction, maintenance and supervision of highways, main and secondary roads, and other roads, the control of access to roads and for other relative purposes.
Native Title Act 1999 Sets out the requirement for the protection and recognition of native title, which local governments must take into consideration where there is the involvement of Crown Land that is subject to a native title claim.
Occupational Health and Safety Act 1984 and associated regulations
Administered in part by local governments to promote and improve standards for occupational health, safety and welfare and to coordinate administration of the laws relating to occupational safety and health for incidental and other purposes.
Planning and Development Act 2005
To provide a system for land use planning and development in the State of WA.

- 5 -
SHIRE OF WAGIN – ROADS AND BRIDGES ASSET MANAGEMENT PLAN
Legislation Requirement
Road Traffic Act 1974 To provide for the regulation of road traffic
Roads to Recovery Act 2000 Sets out the provisions on how the Australian Government will provide funding to supplement expenditure on roads, including to local governments.
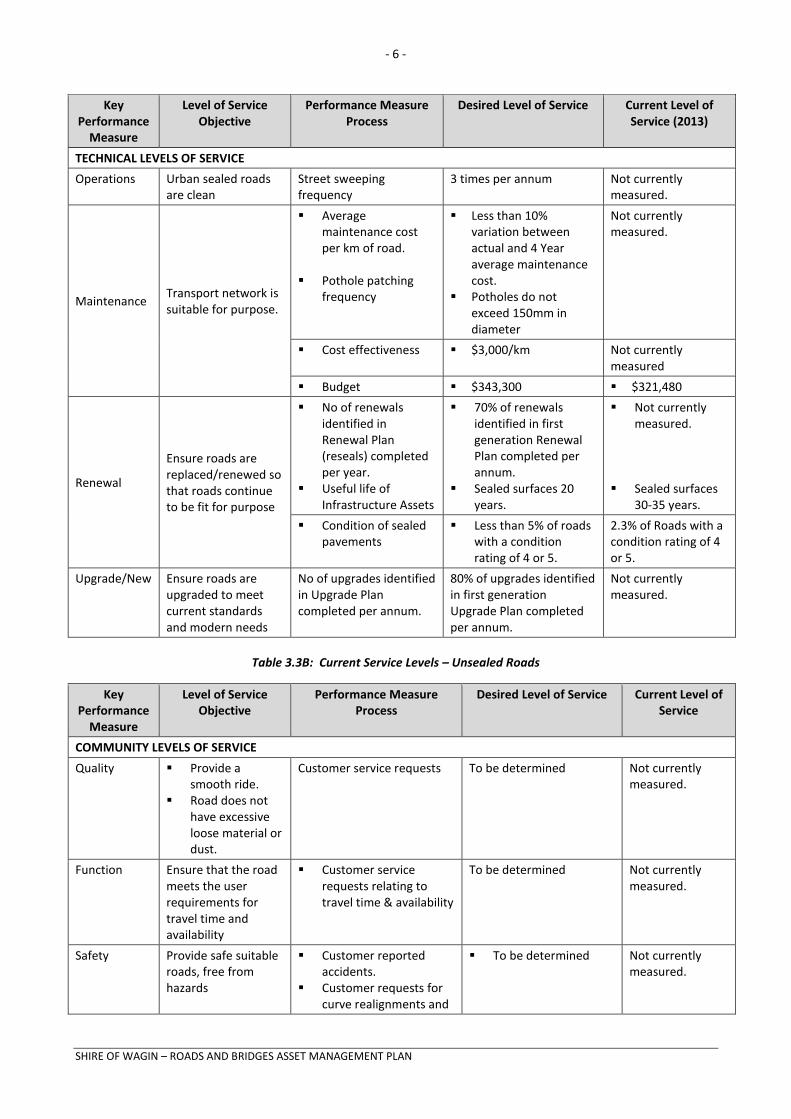
3.3 Current Levels of Service
Council has defined service levels in two terms.
Community Levels of Service relate to the service outcomes that the community wants in terms of safety, quality, quantity, reliability, responsiveness, cost effectiveness and legislative compliance.
Community levels of service measures used in the asset management plan are:
Quality How good is the service? Function Does it meet users’ needs? Safety Is the service safe?
Technical Levels of Service - Supporting the community service levels are operational or technical measures of performance. These technical measures relate to the allocation of resources to service activities that the council undertakes to best achieve the desired community outcomes.
Technical service measures are linked to annual budgets covering:
Operations – the regular activities to provide services such as cleansing frequency, mowing frequency, etc.
Maintenance – the activities necessary to retain an assets as near as practicable to its original condition (e.g. road patching, unsealed road grading, building and structure repairs),
Renewal – the activities that return the service capability of an asset up to that which it had originally (e.g. frequency and cost of road resurfacing and pavement reconstruction, pipeline replacement and building component replacement),
Upgrade – the activities to provide a higher level of service (e.g. widening a road, sealing an unsealed road, replacing a pipeline with a larger size) or a new service that did not exist previously (e.g. a new library).
Council’s current service levels are detailed in the Tables below.
Table 3.3A: Current Service Levels – Sealed Roads
Key Performance
Measure
Level of Service Objective
Performance Measure Process
Desired Level of Service Current Level of Service (2013)
COMMUNITY LEVELS OF SERVICE
Quality Provide a smooth ride
Customer service requests
To be determined Not currently measured.
Function Ensure that the road meets the user requirements for travel time and availability
Customer service requests
To be determined Not currently measured.
Safety Provide safe suitable roads, free from hazards
Customer reported accidents.
Customer requests for curve realignments and safety signage.
To be determined Not currently measured.
- 6 -
SHIRE OF WAGIN – ROADS AND BRIDGES ASSET MANAGEMENT PLAN
Key Performance
Measure
Level of Service Objective
Performance Measure Process
Desired Level of Service Current Level of Service (2013)
TECHNICAL LEVELS OF SERVICE
Operations Urban sealed roads are clean
Street sweeping frequency
3 times per annum Not currently measured.
Maintenance Transport network is suitable for purpose.
Average maintenance cost per km of road.
Pothole patching
frequency
Less than 10% variation between actual and 4 Year average maintenance cost.
Potholes do not exceed 150mm in diameter
Not currently measured.
Cost effectiveness $3,000/km Not currently measured
Budget $343,300 $321,480
Renewal
Ensure roads are replaced/renewed so that roads continue to be fit for purpose
No of renewals identified in Renewal Plan (reseals) completed per year.
Useful life of Infrastructure Assets
70% of renewals identified in first generation Renewal Plan completed per annum.
Sealed surfaces 20 years.
Not currently measured.
Sealed surfaces
30-35 years.
Condition of sealed pavements
Less than 5% of roads with a condition rating of 4 or 5.
2.3% of Roads with a condition rating of 4 or 5.
Upgrade/New Ensure roads are upgraded to meet current standards and modern needs
No of upgrades identified in Upgrade Plan completed per annum.
80% of upgrades identified in first generation Upgrade Plan completed per annum.
Not currently measured.
Table 3.3B: Current Service Levels – Unsealed Roads
Key Performance
Measure
Level of Service Objective
Performance Measure Process
Desired Level of Service Current Level of Service
COMMUNITY LEVELS OF SERVICE
Quality Provide a smooth ride.
Road does not have excessive loose material or dust.
Customer service requests To be determined Not currently measured.
Function Ensure that the road meets the user requirements for travel time and availability
Customer service requests relating to travel time & availability
To be determined Not currently measured.
Safety Provide safe suitable roads, free from hazards
Customer reported accidents.
Customer requests for curve realignments and
To be determined Not currently measured.

- 7 -
SHIRE OF WAGIN – ROADS AND BRIDGES ASSET MANAGEMENT PLAN
Key Performance
Measure
Level of Service Objective
Performance Measure Process
Desired Level of Service Current Level of Service
safety signage.
TECHNICAL LEVELS OF SERVICE
Operations
Maintenance Maintain transport network in an efficient and cost effective manner.
Conduct routine maintenance grading as per service level standards
Average maintenance cost per km of road.
No of times each road is
graded, according to Hierarchy.
Less than 10% variation between actual and 4 Year average maintenance cost.
Grading –
o Regional – 4/yr o Local – 2/yr o Bus routes – 2/yr o Access roads – 1/yr
Not currently measured.
Budget $610,000 $571,520
Renewal Ensure roads are replaced/renewed so that road continues to be fit for purpose
No of renewals identified in Renewal Plan (resheets) completed per year.
70% of renewals identified in first generation Renewal Plan completed per annum.
Not currently measured.
Upgrade/New Ensure roads are upgraded to meet current standards and modern needs
No of upgrades identified in Upgrade Plan completed per annum.
80% of upgrades identified in first generation Upgrade Plan completed per annum.
Not currently measured.
3.4 Desired Levels of Service
At present, indications of desired levels of service are obtained from various sources including residents’ feedback to Councillors and staff, service requests and correspondence. Council has yet to quantify desired levels of service. This will be done in future revisions of this asset management plan.

- 8 -
SHIRE OF WAGIN – ROADS AND BRIDGES ASSET MANAGEMENT PLAN
4. FUTURE DEMAND
4.1 Demand Forecast
Factors affecting demand include population change, changes in demographics, seasonal factors, vehicle ownership, consumer preferences and expectations, economic factors, agricultural practices, environmental awareness, etc.
Demand factor trends and impacts on service delivery are summarised in Table 4.1.
Table 4.1: Demand Factors, Projections and Impact on Services
Demand factor Present position Projection Impact on services
Population The population as at 30 June 2011 was 1,847
4.
1,850 by 20265 (Band C). Increased demand on
community and facilities.
Demographics 2011 Census over 65 made up 19.65% of population.
Projected to remain relatively constant over the years to 2026.
Nil.
Climate change Flooding and storm frequency increasing.
Emergency Services Infrastructure damage
creating higher frequency of loss of service.
Fuel costs increasing.
Agricultural Practices
Standard sized farm holdings.
Aggregation of farms into larger holdings.
Greater use of larger farm equipment and mobility between land holdings.
Higher standard roads for larger, heavier transport vehicles.
Material sources
Gravel pavement used for roads
Water supplies getting difficult to source.
Gravel supplies becoming scarce in the local area.
Limited water supplies to water bind roads.
Greater lead transport costs for importing gravel construction materials.
Greater lead transport costs getting water to site, or develop strategic water sites around the Shire.
4.2 Changes in Technology
Technology changes are forecast to affect the delivery of services covered by this plan in the following areas.
Table 4.2: Changes in Technology and Forecast effect on Service Delivery
Technology Change Effect on Service Delivery
Larger Heavy Vehicles Wider roads with sealed shoulders
Pavement Recycling Methods Less reliance on virgin material – resulting in less haulage of material and disposal. Potential for greater efficiencies and lower road rehabilitation and renewal costs.
Pavement preservation techniques Longer lasting gravel paved roads due to use of stabilisation additives.
4 Source: ABS 2011 Census.
5 Source: “WA Tomorrow Report”, 2012 - WA Planning Commission

- 9 -
SHIRE OF WAGIN – ROADS AND BRIDGES ASSET MANAGEMENT PLAN
The Shire of Wagin will monitor and investigate advances in technology, and introduce them as appropriate.
4.3 Demand Management Plan
Demand for new services will be managed through a combination of managing existing assets, upgrading of existing assets and providing new assets to meet demand and demand management.
Opportunities identified to date for demand management are shown in Table 4.3. Further opportunities will be developed in future revisions of this asset management plan.
Table 4.3: Demand Management Plan Summary
Service Activity Demand Management Plan
Regional Distributors Upgrade and renewal of regional roads that will be impacted by increased heavy traffic volumes from increased agricultural activity and transporting product to port.
Local Distributors Upgrade and renewal of local roads that experience increased heavy traffic volumes from increase agricultural activity, timber harvesting life cycle (once every 7-10 years).
Local Distributors Renewal and maintenance priority to school bus routes.
4.4 New Assets for Growth
The new assets required to meet growth will be acquired free of cost from land developments and constructed/acquired by Council. The new contributed and constructed asset values are summarised in Figure 1.
Figure 1: New Assets for Growth
Acquiring these new assets will commit council to fund ongoing operations and maintenance costs for the period that the service provided from the assets is required. These future costs are identified and considered in developing forecasts of future operations and maintenance costs.
$0
$500
$1,000
$1,500
$2,000
$2,500
2013 2014 2015 2016 2017 2018 2019 2020 2021 2022
Asset
Valu
es (
$000)
Year
Constructed Assets Contributed Assets

- 10 -
SHIRE OF WAGIN – ROADS AND BRIDGES ASSET MANAGEMENT PLAN
5. LIFECYCLE MANAGEMENT PLAN
The lifecycle management plan details how Council plans to manage and operate the assets at the agreed levels of service (defined in Section 3) while optimising life cycle costs.
5.1 Background Data
5.1.1 Physical parameters
The assets covered by this asset management plan are shown in Table 5.1.1.
Table 5.1.1: Description of Assets
Asset category Length (kms)
Dimension
Roads – Sealed 171.08 N/A
Roads – Paved 379.10 N/A
Roads – Formed 204.93 N/A
Sub-Total 755.11 N/A
Kerbing 41.06 41,060 lm
5.1.2 Asset condition
Condition is measured using a 1 – 5 rating system6 as detailed in Table 5.1.3.
Table 5.1.3: IIMM Description of Condition
Condition Rating Description
1 Good condition: Only planned maintenance required.
2 Fair-Plus condition: Minor defects only, minor maintenance required plus planned maintenance (5%).
3 Fair condition: Significant maintenance required to return to acceptable level of service (10-20%).
4 Fair-Minus condition: Significant renewal/upgrade required (20-50%).
5 Poor condition: Asset unserviceable, over 50% of asset requires replacement.
The condition profile of assets included within this AM Plan is shown in Figure 3.
Figure 3: Asset Group Average Condition Profile
Data not available
6 IIMM 2006, Appendix B, p B:1-3 (‘cyclic’ modified to ‘planned’, ‘average’ changed to ‘fair’’)

- 11 -
SHIRE OF WAGIN – ROADS AND BRIDGES ASSET MANAGEMENT PLAN
5.1.3 Asset capacity and performance
Council’s services are generally provided to meet design standards where these are available.
Locations where deficiencies in service performance are known are detailed in Table 5.1.2.
Table 5.1.2: Known Service Performance Deficiencies
Location SLK From
SLK To
Service Deficiency
5.1.4 Asset valuations
The value of assets recorded in the asset register as at 2012 covered by this asset management plan is shown below. Assets were last revalued at June 2012.
Current Replacement Cost $105,398,297
Depreciable Amount $64,779,326
Depreciated Replacement Cost $76,258,046
Annual Depreciation Expense $1,861,000
Council’s sustainability reporting reports the rate of annual asset consumption and compares this to asset renewal and asset upgrade and expansion.
Asset Consumption 7.1% (Depreciation/Depreciable Amount)
Asset renewal 2.6% (Capital renewal exp/Depreciable amount)
Annual Upgrade/New 1.7% (Capital upgrade exp/Depreciable amount)
Annual Upgrade/New 1.7% (including contributed assets)
Council is currently renewing assets at 37.1% of the rate they are being consumed and increasing its asset stock by 1.7% each year.
To provide services in a financially sustainable manner, Council will need to ensure that it is renewing assets at the rate they are being consumed over the medium-long term and funding the life cycle costs for all new assets and services in its long term financial plan.
5.1.5 Asset hierarchy
An asset hierarchy provides a framework for structuring data in an information system to assist in collection of data, reporting information and making decisions. The hierarchy includes the asset class and component used for asset planning and financial reporting and service level hierarchy used for service planning and delivery.
Council’s Road Asset Hierarchy, based on the Main Roads WA Road Hierarchy for WA, is shown is Table 5.1.5.

- 12 -
SHIRE OF WAGIN – ROADS AND BRIDGES ASSET MANAGEMENT PLAN
Table 5.1.5: Road Asset Hierarchy
Asset Category
Service Hierarchy Function Service Level Objective
Rural Roads
Regional Distributor Road (RD)
Predominant purpose is the linking of significant destinations and designed for efficient movement of people and goods between and within regions. Regional distributors have a high degree of connectivity, connecting to primary and other distributor roads.
2 lanes constructed to a pavement width of 10m, with a bitumen seal width of 7m and a left and right shoulder width of 1.5m. Design characteristics support an Average Annual Daily Traffic volume greater than 100 vehicles per day (vpd). Heavy vehicles permitted on road. Intersection treatments are controlled with measures such as signs and line marking. Road marked with centrelines, speed signs and guide signs.
Local Distributor Road (LD) Predominant purpose is the movement of traffic within local areas and connecting to high order Distributor Roads. Local Distributors have a medium degree of connectivity, connecting to Distributors and Access Roads.
Road constructed to a pavement width of 8m, and a left and right shoulder width of 1.0m. Design characteristics support an Average Annual Daily Traffic volume of up to 100 vpd. Heavy vehicle’s permitted, but only to service properties and subject to designated as a permitted heavy vehicle route. Intersection treatments are controlled with minor local area traffic management such as signing. Road marked with speed and guide signs only.
Paved Access Road (PA) Predominant purpose is provision of vehicle access to abutting properties. Paved Access Roads have a low degree of connectivity, provided mainly for property access.
Road constructed to a pavement width of 7m, with a left and right shoulder width of 1.0m. Design characteristics support a maximum Average Annual Daily Traffic volume of up to 75 vpd. Heavy vehicles only permitted access to service local properties if road is designated as a permitted heavy vehicle route. Intersection treatments are self controlling. Road marked with guide signs only.
Formed Access Road (FA) Predominant purpose is provision of vehicle access to abutting properties. Paved Access Roads have a low degree of connectivity, provided mainly for property access.
Road formed to a width of 6m, with a left and right shoulder width of 1.0m. Design characteristics support a maximum Average Annual Daily Traffic volume of up to 50 vpd. Heavy vehicles only permitted access to service local properties if road is designated as a permitted heavy vehicle route. Intersection treatments are self controlling. Road marked with guide signs only.
- 13 -
SHIRE OF WAGIN – ROADS AND BRIDGES ASSET MANAGEMENT PLAN
Asset Category
Service Hierarchy Function Service Level Objective
Urban Roads
District Distributor Road A (DA)
Predominant purpose is the high capacity movement of traffic between industrial, commercial and residential areas. District Distributor A roads have a high degree of connectivity, connecting to Primary and/or other Distributor Roads.
2 to 4 lane road constructed and sealed. Design characteristics support an Average Annual Daily Traffic volume greater than 8,000 vehicles per day (vpd). Heavy vehicles permitted on road. Intersection treatments are controlled with appropriate measures such as traffic signals. Pedestrian access controlled with positive measures (pedestrian signals) for safety. Road marked with centrelines, speed signs and guide signs. Speed 60-80km/hr.
District Distributor Road B (DB)
Predominant purpose is the reduced capacity but high movement of traffic between industrial, commercial and residential areas. District Distributor B roads have a high degree of connectivity, connecting to Primary and/or other Distributor Roads.
2 lane road constructed and sealed. Design characteristics support an Average Annual Daily Traffic volume greater than 6,000 vehicles per day (vpd). Heavy vehicles permitted on road. Intersection treatments are controlled with appropriate Local Area Traffic Management. Pedestrian access controlled with appropriate measures (medians, island refuges) for safety. Road marked with centrelines, speed signs and guide signs. Speed 60-70km/hr.
Local Distributor Road (LD) Predominant purpose is the movement of traffic within local areas and connecting to high order Distributor Roads. Local Distributors have a medium degree of connectivity, connecting to Distributors and Access Roads.
Road constructed to a pavement width of 8m. Design characteristics support an Average Annual Daily Traffic volume of up to 6,000 vpd. Heavy vehicle’s permitted, but only to service properties and subject to designated as a permitted heavy vehicle route. Intersection treatments are controlled with minor local area traffic management such as signing. Road marked with speed and guide signs only. Speed 50-60 km/hr.
Paved Access Road (PA) Predominant purpose is provision of vehicle access to abutting properties. Paved Access Roads have a low degree of connectivity, provided mainly for property access.
Road constructed to a width of 8m. Design characteristics support a maximum Average Annual Daily Traffic volume of up to 3,000 vpd. Heavy vehicles only permitted access to service local properties if road is designated as a permitted heavy vehicle route. Intersection treatments are self controlling. Speed 50-60 km/hr.
5.2 Risk Management Plan
An assessment of risks7 associated with service delivery from infrastructure assets has identified critical risks that will
result in loss or reduction in service from infrastructure assets or a ‘financial shock’ to the organisation. The risk assessment process identifies credible risks, the likelihood of the risk event occurring, the consequences should the event occur, develops a risk rating, evaluates the risk and develops a risk treatment plan for non-acceptable risks.
Critical risks, being those assessed as ‘Very High’ - requiring immediate corrective action and ‘High’ – requiring prioritised corrective action identified in the Infrastructure Risk Management Plan are summarised in Table 5.2.
7 Shire of Wagin Infrastructure Risk Management Plan

- 14 -
SHIRE OF WAGIN – ROADS AND BRIDGES ASSET MANAGEMENT PLAN
Table 5.2: Critical Risks and Treatment Plans
Service or Asset at Risk
What can Happen Risk Rating (VH, H)
Risk Treatment Plan Associated Costs
Road and/or Bridge Poor condition of road and/or bridge causes damage to vehicle.
M
Establish routine inspection regime and customer request management system for capturing and analysis of reported problems and incidents.
To be investigated
Road and/or Bridge Poor condition of asset causes injury
H
Establish routine inspection regime and customer request management system for capturing and analysis of reported problems and incidents.
To be investigated
Road Poor road surface causing dust/noise complaints M
Establish routine inspection regime and customer request management system for capturing and analysis of reported problems and incidents.
To be investigated
Road Damage/injury caused by utility provider assets or work
M-H
Formalise process for recording defects and develop standard process for notification to utility provider.
To be investigated
Road Loose material on surface, loose material on shoulders causing damage or injury
H
Monitor sediment deposits from rainfall events.
Monitor degradation of gravel road surface during summer periods.
To be investigated
Road and/or Bridge Flooding causing damage to road and/or bridge
H Evaluate appropriate designs for flood prone areas.
To be investigated
Road and/or Bridge Damage caused by natural disaster
M Monitor weather forecasting and general preparedness
To be investigated
Road Road pavement irregularities causing complaints
M Formalise level of service standards in consultation with community.
To be investigated
5.3 Routine Maintenance Plan
Routine maintenance is the regular on-going work that is necessary to keep assets operating, including instances where portions of the asset fail and need immediate repair to make the asset operational again.
5.3.1 Maintenance plan
Maintenance includes reactive, planned and specific maintenance work activities. Reactive maintenance is unplanned repair work carried out in response to service requests and management/supervisory directions.
Planned maintenance is repair work that is identified and managed through a maintenance management system (MMS). MMS activities include inspection, assessing the condition against failure/breakdown experience, prioritising, scheduling, actioning the work and reporting what was done to develop a maintenance history and improve maintenance and service delivery performance.

- 15 -
SHIRE OF WAGIN – ROADS AND BRIDGES ASSET MANAGEMENT PLAN
Specific maintenance is replacement of higher value components/sub-components of assets that is undertaken on a regular cycle including culverts and pipes, etc. This work may generally falls below the capital/maintenance threshold but may require a specific budget allocation.
Actual past maintenance expenditure is shown in Table 5.3.1.
Table 5.3.1: Maintenance Expenditure Trends
Year Maintenance Expenditure
2010/2011 $1,055,995
2011/2012 $1,208,875
2012/2013 $1,097,103
Current maintenance expenditure levels are based on historical data to meet the basic level of service, and are considered to be inadequate to meet required service levels. Future revision of this asset management plan will include linking required maintenance expenditures with required service levels.
Assessment and prioritisation of reactive maintenance is undertaken by operational staff using experience and judgement.
5.3.2 Standards and specifications
Maintenance work is carried out in accordance with the following Standards and Specifications.
Internal practices
Accepted Industry Standards
IPWEA standards.
5.3.3 Summary of future operations and maintenance expenditures
Future operations and maintenance expenditure is forecast to trend in line with the value of the asset stock as shown in Figure 4. Note that all costs are shown in 2013 dollar values.
Figure 4: Projected Operations and Maintenance Expenditure
$0
$200
$400
$600
$800
$1,000
$1,200
$1,400
$1,600
2013 2014 2015 2016 2017 2018 2019 2020 2021 2022
($000)
per
year
Year
Operations Maintenance
- 16 -
SHIRE OF WAGIN – ROADS AND BRIDGES ASSET MANAGEMENT PLAN
Deferred maintenance, i.e. works that are identified for maintenance and unable to be funded are to be included in the risk assessment process in the infrastructure risk management plan. Maintenance is funded from the operating budget and grants where available. This is further discussed in Section 6.2.
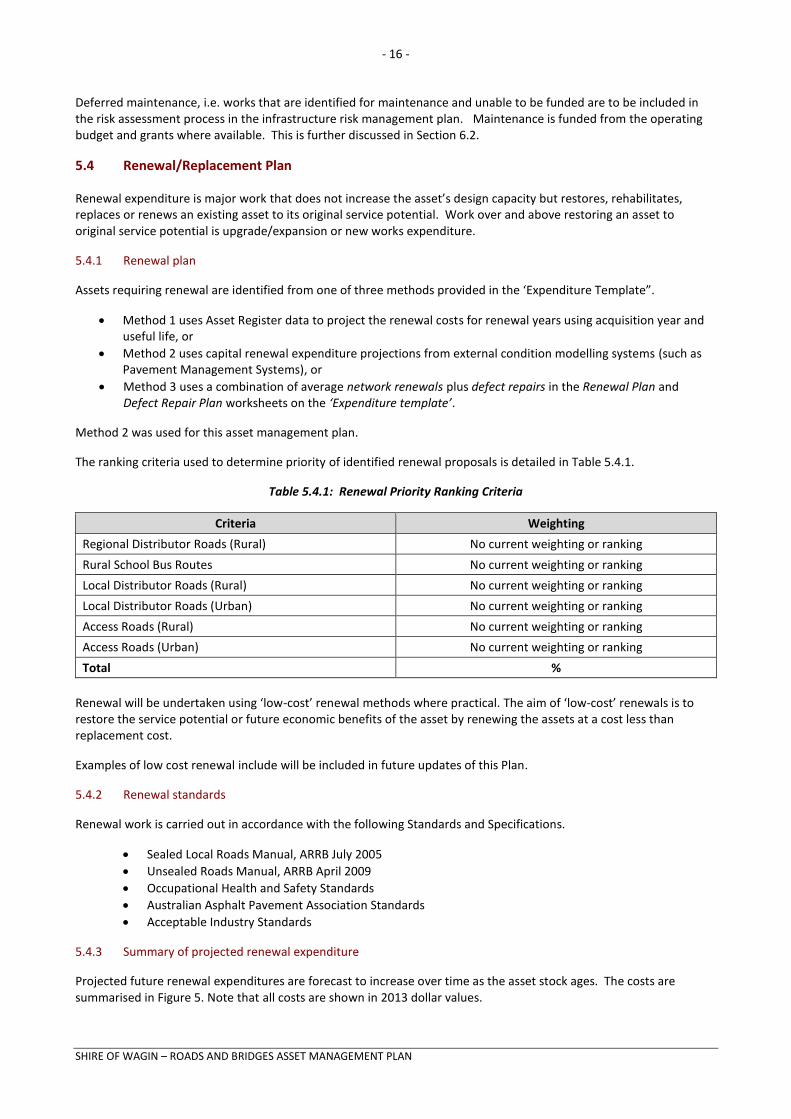
5.4 Renewal/Replacement Plan
Renewal expenditure is major work that does not increase the asset’s design capacity but restores, rehabilitates, replaces or renews an existing asset to its original service potential. Work over and above restoring an asset to original service potential is upgrade/expansion or new works expenditure.
5.4.1 Renewal plan
Assets requiring renewal are identified from one of three methods provided in the ‘Expenditure Template”.
Method 1 uses Asset Register data to project the renewal costs for renewal years using acquisition year and useful life, or
Method 2 uses capital renewal expenditure projections from external condition modelling systems (such as Pavement Management Systems), or
Method 3 uses a combination of average network renewals plus defect repairs in the Renewal Plan and Defect Repair Plan worksheets on the ‘Expenditure template’.
Method 2 was used for this asset management plan.
The ranking criteria used to determine priority of identified renewal proposals is detailed in Table 5.4.1.
Table 5.4.1: Renewal Priority Ranking Criteria
Criteria Weighting
Regional Distributor Roads (Rural) No current weighting or ranking
Rural School Bus Routes No current weighting or ranking
Local Distributor Roads (Rural) No current weighting or ranking
Local Distributor Roads (Urban) No current weighting or ranking
Access Roads (Rural) No current weighting or ranking
Access Roads (Urban) No current weighting or ranking
Total %
Renewal will be undertaken using ‘low-cost’ renewal methods where practical. The aim of ‘low-cost’ renewals is to restore the service potential or future economic benefits of the asset by renewing the assets at a cost less than replacement cost.
Examples of low cost renewal include will be included in future updates of this Plan.
5.4.2 Renewal standards
Renewal work is carried out in accordance with the following Standards and Specifications.
Sealed Local Roads Manual, ARRB July 2005
Unsealed Roads Manual, ARRB April 2009
Occupational Health and Safety Standards
Australian Asphalt Pavement Association Standards
Acceptable Industry Standards
5.4.3 Summary of projected renewal expenditure
Projected future renewal expenditures are forecast to increase over time as the asset stock ages. The costs are summarised in Figure 5. Note that all costs are shown in 2013 dollar values.

- 17 -
SHIRE OF WAGIN – ROADS AND BRIDGES ASSET MANAGEMENT PLAN
The projected capital renewal program is shown in Appendix B.
Figure 5: Projected Capital Renewal Expenditure
Deferred renewal, i.e. those assets identified for renewal and not scheduled for renewal in capital works programs are to be included in the risk assessment process in the risk management plan.
Renewals are to be funded from capital works programs and grants where available. This is further discussed in Section 6.2.
5.5 Creation/Acquisition/Upgrade Plan
New works are those works that create a new asset that did not previously exist, or works, which upgrade or improve an existing asset beyond its existing capacity. They may result from growth, social or environmental needs. Assets may also be acquired at no cost to the Council from land development. These assets from growth are considered in Section 4.4.
5.5.1 Selection criteria
New assets and upgrade/expansion of existing assets are identified from various sources such as councillor or community requests, proposals identified by strategic plans or partnerships with other organisations. Candidate proposals are inspected to verify need and to develop a preliminary estimate. Verified proposals are ranked by priority and available funds and scheduled in future works programmes. The priority ranking criteria is detailed in Table 5.5.1.
Table 5.5.1: Upgrade/New Assets Priority Ranking Criteria
Criteria Weighting
No current weighting or ranking
No current weighting or ranking
No current weighting or ranking
No current weighting or ranking
No current weighting or ranking
No current weighting or ranking
Total %
$0
$5,000
$10,000
$15,000
$20,000
$25,000
2013 2014 2015 2016 2017 2018 2019 2020 2021 2022
($000)
per
year
Year
Projected Renewals

- 18 -
SHIRE OF WAGIN – ROADS AND BRIDGES ASSET MANAGEMENT PLAN
5.5.2 Standards and specifications
Standards and specifications for new assets and for upgrade/expansion of existing assets are the same as those for renewal shown in Section 5.4.2.
5.5.3 Summary of projected upgrade/new assets expenditure
Projected upgrade/new asset expenditures are summarised in Figure 6. The projected upgrade/new capital works program is shown in Appendix C. All costs are shown in current 2013 dollar values.
Figure 6: Projected Capital Upgrade/New Asset Expenditure
New assets and services are to be funded from capital works program and grants where available. This is further discussed in Section 6.2.
5.6 Disposal Plan
Disposal includes any activity associated with disposal of a decommissioned asset including sale, demolition or relocation. Assets identified for possible decommissioning and disposal are shown in Table 5.6, together with estimated annual savings from not having to fund operations and maintenance of the assets. These assets will be further reinvestigated to determine the required levels of service and see what options are available for alternate service delivery, if any.
Where cashflow projections from asset disposals are not available, these will be developed in future revisions of this asset management plan.
Table 5.6: Assets identified for Disposal
Asset Reason for Disposal Timing Net Disposal Expenditure (Expend
+ve, Revenue –ve)
Operations & Maintenance Annual
Savings
Nil. Nil. Nil. Nil. Nil
$0
$50
$100
$150
$200
$250
$300
$350
$400
$450
$500
2013 2014 2015 2016 2017 2018 2019 2020 2021 2022
($000)
per
year
Year

- 19 -
SHIRE OF WAGIN – ROADS AND BRIDGES ASSET MANAGEMENT PLAN
6. FINANCIAL SUMMARY
This section contains the financial requirements resulting from all the information presented in the previous sections of this asset management plan. The financial projections will be improved as further information becomes available on desired levels of service and current and projected future asset performance.
6.1 Financial Statements and Projections
The financial projections are shown in Figure 7 for projected operating (operations and maintenance) and capital expenditure (renewal and upgrade/expansion/new assets), net disposal expenditure and estimated budget funding.
Note that all costs are shown in 2013 dollar values.
Figure 7: Projected Operating and Capital Expenditure and Budget
6.1.1 Financial sustainability in service delivery
There are three key indicators for financial sustainability that have been considered in the analysis of the services provided by this asset category, these being long term life cycle costs/expenditures and medium term projected/budgeted expenditures over 5 and 10 years of the planning period.
Long term - Life Cycle Cost
Life cycle costs (or whole of life costs) are the average costs that are required to sustain the service levels over the longest asset life. Life cycle costs include operations and maintenance expenditure and asset consumption (depreciation expense). The life cycle cost for the services covered in this asset management plan is $2,958,000 per year (operations and maintenance expenditure plus depreciation expense in year 1).
Life cycle costs can be compared to life cycle expenditure to give an indicator of sustainability in service provision. Life cycle expenditure includes operations, maintenance and capital renewal expenditure in year 1. Life cycle expenditure will vary depending on the timing of asset renewals. The life cycle expenditure at the start of the plan is $1,787,000 (operations and maintenance expenditure plus budgeted capital renewal expenditure in year 1).
A shortfall between life cycle cost and life cycle expenditure is the life cycle gap.
The long term life cycle gap for services covered by this asset management plan is ($1,171,000) per year (-ve = gap, +ve = surplus).
$0
$5,000
$10,000
$15,000
$20,000
$25,000
2013 2014 2015 2016 2017 2018 2019 2020 2021 2022
($000)
per
year
Year
O & M Capital

- 20 -
SHIRE OF WAGIN – ROADS AND BRIDGES ASSET MANAGEMENT PLAN
Life cycle expenditure is 60% of life cycle costs giving a life cycle sustainability index of 0.60.
The life cycle costs and life cycle expenditure comparison highlights any difference between present outlays and the average cost of providing the service over the long term. If the life cycle expenditure is less than that life cycle cost, it is most likely that outlays will need to be increased or cuts in services made in the future.
Knowing the extent and timing of any required increase in outlays and the service consequences if funding is not available will assist organisations in providing services to their communities in a financially sustainable manner. This is the purpose of the asset management plans and long term financial plan.
Medium term – 10 year financial planning period
This asset management plan identifies the projected operations, maintenance and capital renewal expenditures required to provide an agreed level of service to the community over a 10 year period. This provides input into 10 year financial and funding plans aimed at providing the required services in a sustainable manner.
These projected expenditures may be compared to budgeted expenditures in the 10 year period to identify any funding shortfall. In a core asset management plan, a gap is generally due to increasing asset renewals for ageing assets.
The projected operations, maintenance and capital renewal expenditure required over the 10 year planning period is $5,078,000 per year.
Estimated (budget) operations, maintenance and capital renewal funding is $2,071,000 per year giving a 10 year funding shortfall of ($3,008,000) per year and a 10 year sustainability indicator of 0.41. This indicates that Council has 41% of the projected expenditures needed to provide the services documented in the asset management plan.
Medium Term – 5 year financial planning period
The projected operations, maintenance and capital renewal expenditure required over the first 5 years of the planning period is $3,787,000 per year.
Estimated (budget) operations, maintenance and capital renewal funding is $1,963,000 per year giving a 5 year funding shortfall of ($1,824,000). This is 52% of projected expenditures giving a 5 year sustainability indicator of 0.52.
Financial Sustainability Indicators
Figure 7A shows the financial sustainability indicators over the 10 year planning period and for the long term life cycle.
Figure 7A: Financial Sustainability Indicators
0.0
0.1
0.2
0.3
0.4
0.5
0.6
0.7
5 10 15 20 25 30 35 40 45 50
Susta
inabili
ty I
ndic
ato
r
Planning Period (Life Cycle shown as 50) yrs

- 21 -
SHIRE OF WAGIN – ROADS AND BRIDGES ASSET MANAGEMENT PLAN
Providing services from infrastructure in a sustainable manner requires the matching and managing of service levels, risks, projected expenditures and funding to achieve a financial sustainability indicator of 1.0 for the first years of the asset management plan and ideally over the 10 year life of the AM Plan.
Figure 8 shows the projected asset renewals in the 10 year planning period from Appendix B. The projected asset renewals are compared to budgeted renewal expenditure in the capital works program and capital renewal expenditure in year 1 of the planning period in Figure 8.
Figure 8: Projected and Budgeted Renewal Expenditure
Table 6.1.1 shows the shortfall between projected and budgeted renewals
Table 6.1.1: Projected and Budgeted Renewals and Expenditure Shortfall
Year Projected Renewals ($000)
Planned Renewal (Budget) ($000)
Renewal Funding Shortfall ($000)
(-ve Gap, +ve Surplus)
Cumulative Shortfall ($000)
(-ve Gap, +ve Surplus)
2013 $1,266 $690 -$576 -$576
2014 $1,818 $737 -$1,081 -$1,657
2015 $803 $899 $96 -$1,561
2016 $6,787 $845 -$5,942 -$7,503
2017 $2,406 $819 -$1,587 -$9,090
2018 $1,784 $805 -$979 -$10,069
2019 $19,481 $802 -$18,679 -$28,748
2020 $874 $857 -$17 -$28,765
2021 $1,181 $923 -$258 -$29,023
2022 $1,691 $754 -$937 -$29,960
Note: A negative shortfall indicates a funding gap, a positive shortfall indicates a surplus for that year. Providing services in a sustainable manner will require matching of projected asset renewals to meet agreed service levels with planned capital works programs and available revenue.
$0
$5,000
$10,000
$15,000
$20,000
$25,000
2013 2014 2015 2016 2017 2018 2019 2020 2021 2022
($000)
per
year
Year
Renewal Budget Projected Renewals Current Expenditure

- 22 -
SHIRE OF WAGIN – ROADS AND BRIDGES ASSET MANAGEMENT PLAN
A gap between projected asset renewals, planned asset renewals and funding indicates that further work is required to manage required service levels and funding to eliminate any funding gap.
We will manage the ‘gap’ by developing this asset management plan to provide guidance on future service levels and resources required to provide these services, and review future services, service levels and costs with the community.
6.1.2 Expenditure projections for long term financial plan
Table 6.1.2 shows the projected expenditures for the 10 year long term financial plan.
Expenditure projections are in current (non-inflated) values. Disposals are shown as net expenditures (revenues are negative).
Table 6.1.2: Expenditure Projections for Long Term Financial Plan ($000)
Year Operations
($000) Maintenance
($000) Projected Capital Renewal ($000)
Capital Upgrade/ New ($000)
Disposals ($000)
2013 $274 $823 $1,266 $432 $0
2014 $283 $851 $1,818 $211 $0
2015 $292 $878 $803 $240 $0
2016 $302 $906 $6,787 $192 $0
2017 $311 $935 $2,406 $139 $0
2018 $321 $963 $1,784 $198 $0
2019 $331 $994 $19,481 $226 $0
2020 $341 $1,025 $874 $263 $0
2021 $352 $1,057 $1,181 $143 $0
2022 $363 $1,090 $1,691 $231 $0
Note: All projected expenditures are in 2013 values
6.2 Funding Strategy
Projected expenditure identified in Section 6.1 is to be funded from future operating and capital budgets. The funding strategy is detailed in the organisation’s 10 year long term financial plan.
6.3 Valuation Forecasts
Asset values are forecast to increase as additional assets are added to the asset stock from construction and acquisition by Council and from assets constructed by land developers and others and donated to Council. Figure 9 shows the projected replacement cost asset values over the planning period in 2013 dollar values.

- 23 -
SHIRE OF WAGIN – ROADS AND BRIDGES ASSET MANAGEMENT PLAN
Figure 9: Projected Asset Values
Depreciation expense values are forecast in line with asset values as shown in Figure 10.
Figure 10: Projected Depreciation Expense
The depreciated replacement cost (current replacement cost less accumulated depreciation) will vary over the forecast period depending on the rates of addition of new assets, disposal of old assets and consumption and renewal of existing assets. Forecast of the assets’ depreciated replacement cost is shown in Figure 11. The effect of contributed and new assets on the depreciated replacement cost is shown in the light colour bar.
$0
$20,000
$40,000
$60,000
$80,000
$100,000
$120,000
2013 2014 2015 2016 2017 2018 2019 2020 2021 2022
($000)
at
30 J
un
e
Year
$0
$500
$1,000
$1,500
$2,000
$2,500
2013 2014 2015 2016 2017 2018 2019 2020 2021 2022
($000)
per
year
Year

- 24 -
SHIRE OF WAGIN – ROADS AND BRIDGES ASSET MANAGEMENT PLAN
Figure 11: Projected Depreciated Replacement Cost
6.4 Key Assumptions made in Financial Forecasts
This section details the key assumptions made in presenting the information contained in this asset management plan and in preparing forecasts of required operating and capital expenditure and asset values, depreciation expense and carrying amount estimates. It is presented to enable readers to gain an understanding of the levels of confidence in the data behind the financial forecasts.
Key assumptions made in this asset management plan are:
Roads and Bridges assets will remain in Council’s care, control and management throughout the planning period.
Maintenance costs are largely based on historical expenditure and it is assumed there will be no significant increases in service requirements.
Valuation information as at 30 June 2012 prepared by Opus International on 6 June 2013 has determined the asset values.
$0
$5,000
$10,000
$15,000
$20,000
$25,000
$30,000
2013 2014 2015 2016 2017 2018 2019 2020 2021 2022
($000)
at
30 J
une
Year
Existing Assets New Assets
- 25 -
SHIRE OF WAGIN – ROADS AND BRIDGES ASSET MANAGEMENT PLAN
7. ASSET MANAGEMENT PRACTICES
7.1 Accounting/Financial Systems
7.1.1 Accounting and financial systems
The Shire of Wagin uses the SynergySoft financial software for its financial management system and for asset accounting purposes.
7.1.2 Accountabilities for financial systems
Accountabilities and responsibilities are divided between the Manager Corporate Services, Accountant and Finance Officer.
7.1.3 Accounting standards and regulations
As well as complying with Australian Accounting Standards, the Shire must comply with the Western Australia Local Government Act 1995 and the Local Government (Finance) Regulations 1996. Accounting Standard AASB116 – “Property, Plant and Equipment” is the significant regulatory requirement relevant to accounting for assets.
7.1.4 Capital/maintenance threshold
The Shire, as a general rule, applies a Capital Threshold limit of $1,000 for expenditure that is expensed in the current year. Expenditure over $1,000 on an asset is classed as capital expenditure and capitalised against the asset.
7.1.5 Required changes to accounting financial systems arising from this AM Plan
The general ledger in SynergySoft may require recoding to allow Council to differentiate between operational costs, maintenance costs, upgrades, refurbishment and renewal costs. Further research is required to ascertain if this recoding is necessary.
7.2 Asset Management Systems
7.2.1 Asset management system
The Asset Management system is the RoMan database and current operating procedures.
7.2.2 Asset registers
The Shire maintains a detailed Asset Register for this asset class on the RoMan II database and a summarised version on the SynergySoft Asset Register.
7.2.3 Linkage from asset management to financial system
The linkage from the financial system to the asset register is fully integrated. Officers input asset expenditure data into the financial system, which is posted to a capital account. The flag on the general ledger account recognises that the expenditure is of a capital nature and opens the Asset Register Module prompting the operator to enter the relevant details about the asset expenditure (whether a new asset, or expenditure on an existing asset).
7.2.4 Accountabilities for asset management system and data
Accountabilities and responsibilities are divided between the Finance Staff and the Executive Manager Corporate Services and Assets. The Manager Works provides information on the relevant assets and allocates costs associated with payroll and purchasing systems. The Manager Finance & Corporate Services, Accountant and Finance Officer create the records within the Asset Register and post expenditure direct to the Asset Register.

- 26 -
SHIRE OF WAGIN – ROADS AND BRIDGES ASSET MANAGEMENT PLAN
7.2.5 Required changes to asset management system arising from this AM Plan
No changes have been identified to the asset management system, but subsequent revisions of this Roads Asset Management Plan may identify further improvements to the existing system.
7.3 Information Flow Requirements and Processes
The key information flows into this asset management plan are:
Council strategic and operational plans,
Service requests from the community,
Network asset information,
The unit rates for categories of work/materials,
Current levels of service, expenditures, service deficiencies and service risks,
Projections of various factors affecting future demand for services and new assets acquired by Council,
Future capital works programs,
Financial asset values.
The key information flows from this asset management plan are:
The projected Works Program and trends,
The resulting budget and long term financial plan expenditure projections.
Financial sustainability indicators.
These will impact the Long Term Financial Plan, Corporate Business Plan, Annual Budget and Departmental Business Plans and Budgets.
7.4 Standards and Guidelines
Standards, guidelines and policy documents referenced in this asset management plan are:
Shire of Wagin Asset Capitalisation Threshold Policy
Shire of Wagin Asset Management Policy
Shire of Wagin Asset Management Strategy
Australian Standards
Australian Road Research Board Sealed and Unsealed Roads Management Manuals
- 27 -
SHIRE OF WAGIN – ROADS AND BRIDGES ASSET MANAGEMENT PLAN
8. PLAN IMPROVEMENT AND MONITORING
8.1 Performance Measures
The effectiveness of the asset management plan can be measured in the following ways:
The degree to which the required cashflows identified in this asset management plan are incorporated into the organisation’s long term financial plan and Community/Strategic Planning processes and documents,
The degree to which 1-5 year detailed works programs, budgets, business plans and organisational structures take into account the ‘global’ works program trends provided by the asset management plan;
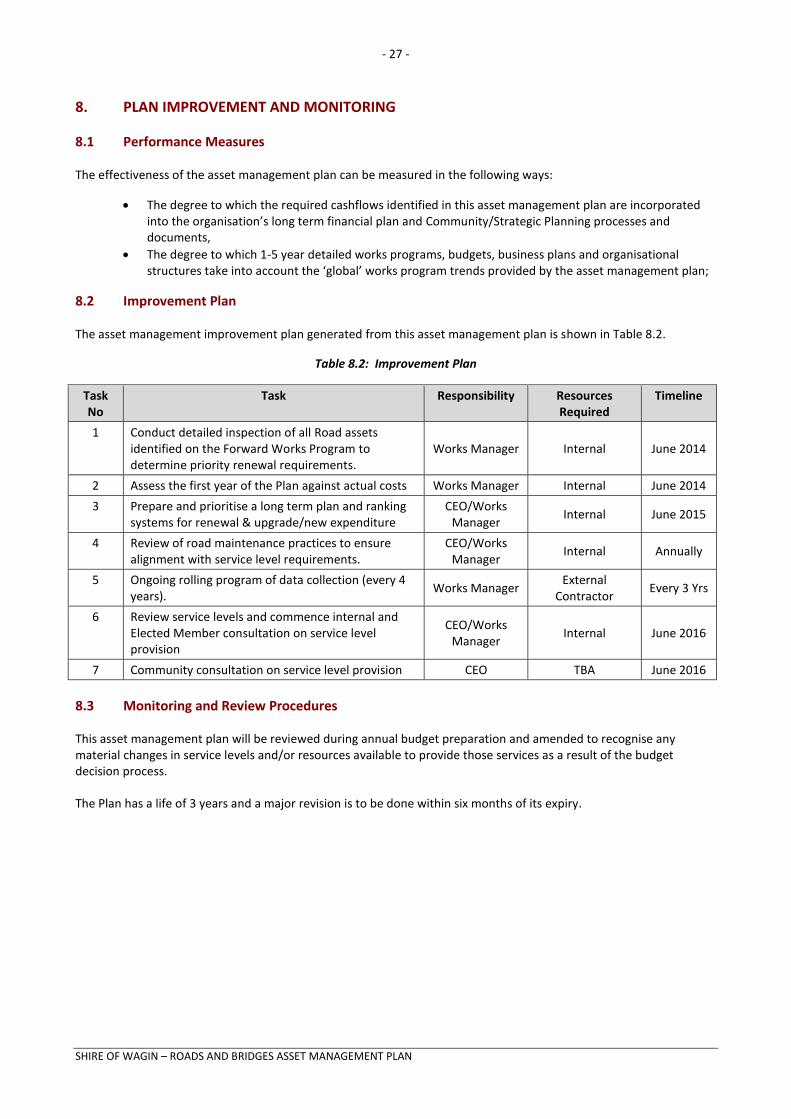
8.2 Improvement Plan
The asset management improvement plan generated from this asset management plan is shown in Table 8.2.
Table 8.2: Improvement Plan
Task No
Task Responsibility Resources Required
Timeline
1 Conduct detailed inspection of all Road assets identified on the Forward Works Program to determine priority renewal requirements.
Works Manager Internal June 2014
2 Assess the first year of the Plan against actual costs Works Manager Internal June 2014
3 Prepare and prioritise a long term plan and ranking systems for renewal & upgrade/new expenditure
CEO/Works Manager
Internal June 2015
4 Review of road maintenance practices to ensure alignment with service level requirements.
CEO/Works Manager
Internal Annually
5 Ongoing rolling program of data collection (every 4 years).
Works Manager External
Contractor Every 3 Yrs
6 Review service levels and commence internal and Elected Member consultation on service level provision
CEO/Works Manager
Internal June 2016
7 Community consultation on service level provision CEO TBA June 2016
8.3 Monitoring and Review Procedures
This asset management plan will be reviewed during annual budget preparation and amended to recognise any material changes in service levels and/or resources available to provide those services as a result of the budget decision process.
The Plan has a life of 3 years and a major revision is to be done within six months of its expiry.

- 28 -
SHIRE OF WAGIN – ROADS AND BRIDGES ASSET MANAGEMENT PLAN
REFERENCES
Shire of Wagin Strategic Community Plan
Shire of Wagin 2012/13 Annual Budget
Shire of Wagin Forward Capital Works Plan 2010/11 – 2014/15
Shire of Wagin RAMM 10 Year Forward Works Program, prepared by Opus International in May 2013
Shire of Wagin RAMM Road Asset Valuations, 30 June 2012, prepared by Opus International on 5 June 2013
DVC, 2006, Asset Investment Guidelines, Glossary, Department for Victorian Communities, Local Government Victoria, Melbourne, http://www.dpcd.vic.gov.au/localgovernment/publications-and-research/asset-management-and-financial
IPWEA, 2006, International Infrastructure Management Manual, Institute of Public Works Engineering Australia, Sydney, www.ipwea.org.au
IPWEA, 2008, NAMS.PLUS Asset Management Institute of Public Works Engineering Australia, Sydney, www.ipwea.org.au/namsplus
IPWEA, 2009, Australian Infrastructure Financial Management Guidelines, Institute of Public Works Engineering Australia, Sydney, www.ipwea.org.au/AIFMG
IPWEA, 2011, Asset Management for Small, Rural or Remote Communities Practice Note, Institute of Public Works Engineering Australia, Sydney, www.ipwea.org.au/AM4SRRC
DLG, 2011, Asset Management Framework and Guidelines, Department of Local Government, Western Australia, http://integratedplanning.dlg.wa.gov.au/DeliverAssetManagement.aspx
WAPC, 2012, WA Tomorrow Report 2012, Western Australian Planning Commission, Western Australia
ABS, 2012, 2011 Census Community Profiles – Wagin Local Government Area, Australian Bureau of Statistics, http://www.censusdata.abs.gov.au/census_services/getproduct/census/2011/communityprofile/LGA50770?opendocument&navpos=230

- 29 -
SHIRE OF WAGIN – ROADS AND BRIDGES ASSET MANAGEMENT PLAN
APPENDICES
Appendix A Maintenance Response Levels of Service
Appendix B Projected 10 year Capital Renewal Works Program
Appendix C Planned Upgrade/Exp/New 10 year Capital Works Program A
Appendix D Abbreviations
Appendix E Glossary

- 30 -
SHIRE OF WAGIN – ROADS AND BRIDGES ASSET MANAGEMENT PLAN
Appendix A Maintenance Response Levels of Service
ROUTINE MAINTENANCE ITEMS
INTERVENTION LEVELS RESPONSE TIME BY CLASS
Regional Distributor Access Local Formed
1.0 -UNSEALED ROADS & SHOULDERS
1.1 Pothole Maintenance Any pothole with depth > 300mm 2 Weeks 4 Weeks 12 Weeks 16 Weeks 20 Weeks
1.2 Repair of general pavement defects
Scouring or corrugations > 100mm depth and length < 20m 6 Weeks 10 Weeks 12 Weeks 12 Weeks N/A
1.3 Management of loose material
Loose material > 100mm depth at any location on the pavement and < 20m²
2 Weeks 4 Weeks 4 Weeks 4 Weeks N/A
1.4 Maintenance of shoulders and verges
Any scouring, corrugations or potholing with depth > 100mm 2 Weeks 2 Weeks 4 Weeks 4 Weeks N/A
2.0 -SEALED ROADS
2.1 Pothole Maintenance
Any pothole with depth > 75mm 2 Weeks 4 Weeks 8 Weeks 12 Weeks N/A
Any pothole with depth > 40mm and dimension of 350mm 2 Weeks 4 Weeks 8 Weeks 12 Weeks N/A
2.2 Seal Texture Maintenance
Crocodile cracking > 10m² 8 Weeks 8 Weeks 16 Weeks 16 Weeks N/A
Longitudinal cracking > 20m² 16 Weeks 16 Weeks 32 Weeks 52 Weeks N/A
Flushing > 5m² 16 Weeks 16 Weeks 32 Weeks 52 Weeks N/A
Stripping > 5m² 16 Weeks 16 Weeks 32 Weeks 52 Weeks N/A
2.3 Edge Break Maintenance Edge break > 250mm from nominal seal edge 1 Week 1 Week 2 Weeks 4 Weeks N/A
2.4 Edge Drop Off Maintenance
Edge drop with depth > 100mm and > 20m length 1 Week 1 Week 2 Weeks 4 Weeks N/A
3.0 - DRAINAGE
3.1 Table drain and open drain maintenance
Isolated blockages (> 10 lm and/or > 2m³) 4 Weeks 8 Weeks 12 Weeks 16 Weeks 24 Weeks
3.2 Kerb and gutter maintenance
> 50% of cross sectional area blocked
8 weeks 8 Weeks 16 Weeks 16 Weeks N/A
Isolated blockages (< 5 lm and/or > 30% cross sectional area) 16 Weeks 16 Weeks 24 Weeks 24 Weeks N/A
4.0 - ROADSIDE, VERGE & SAFETY
4.1 Guideposts Replacement Identify & replace all missing or damaged guideposts
4 Weeks 8 Weeks 12 Weeks 16 Weeks N/A
4.2 Delineator Replacement For all traffic devices that have delineators, replace any missing or damaged delineators
4 Weeks 8 Weeks 12 Weeks 16 Weeks N/A
4.3 Sign Straightening Intervention require when sign is: (a) leaning from vertical and/or rotated from correct position > 45°. (b) vertically displaced by > 0.5m.
4 Weeks 4 Weeks 6 Weeks 8 Weeks N/A
4.4 Management of sight distance to signs
Vegetation that impedes sight distance to signs from distance of 200m from approaching vehicle
4 Weeks 6 Weeks 8 Weeks 12 Weeks N/A

- 31 -
SHIRE OF WAGIN – ROADS AND BRIDGES ASSET MANAGEMENT PLAN
Appendix B Projected 10 year Capital Renewal Works Program
Asset ID
Asset Name Works Description From SLK
To SLK Renewal Year
Renewal Cost
51 Becker Road (51) resheet unsealed 0.55 1.56 2013 $103,020
36 Cailes Road (36) resheet unsealed 3.80 4.77 2013 $82,450
1 Dongolocking Road (1) pave + 2 coat seal 13.87 19.95 2013 $922,336
77 Holme Road (77) resheet unsealed 0.74 1.51 2013 $65,450
172 South Road (172) resheet unsealed 0.00 1.09 2013 $92,650
$1,265,906
Asset ID
Asset Name Works Description From SLK
To SLK Renewal Year
Renewal Cost
1 Dongolocking Road (1) pave + 2 coat seal 13.08 13.87 2014 $119,843
1 Dongolocking Road (1) pave + 2 coat seal 10.50 12.03 2014 $232,101
1 Dongolocking Road (1) pave + 2 coat seal 1.36 1.86 2014 $104,550
3 Ballagin Road (3) pave + 2 coat seal 3.88 4.00 2014 $33,948
3 Ballagin Road (3) pave + 2 coat seal 8.94 9.78 2014 $237,636
3 Ballagin Road (3) pave + 2 coat seal 0.07 3.39 2014 $1,089,575
$1,817,653
Asset ID
Asset Name Works Description From SLK
To SLK Renewal Year
Renewal Cost
180 Strickland Lane (180) 10mm reseal 0.00 0.06 2015 $8,928
180 Strickland Lane (180) 10mm reseal 0.06 0.15 2015 $15,120
185 Padbury Lane (185) 10mm reseal 0.00 0.05 2015 $11,040
207 Thornton Street (207) pave + 2 coat seal 0.00 0.42 2015 $189,420
3 Ballagin Road (3) pave + 2 coat seal 0.00 0.07 2015 $33,005
204 Vealing Street (204) 10mm reseal 0.00 0.03 2015 $7,200
133 Leake Way (133) 10mm reseal 0.12 0.21 2015 $13,392
118 Urban Street (118) pave + 2 coat seal 0.28 0.70 2015 $154,980
132 Traverse Street (132) pave + 2 coat seal 0.18 0.36 2015 $95,940
164 Omdurman Street (164) pave + 2 coat seal 1.06 1.13 2015 $22,960
138 Trenton Street (138) pave + 2 coat seal 0.00 0.28 2015 $128,576
143 Trench Street (143) pave + 2 coat seal 0.00 0.23 2015 $122,590
$803,151

- 32 -
SHIRE OF WAGIN – ROADS AND BRIDGES ASSET MANAGEMENT PLAN
Appendix B Projected 10 Year Capital Renewal Works Program (continued)
Asset ID
Asset Name Works Description From SLK
To SLK Renewal Year
Renewal Cost
1 Dongolocking Road (1) 10mm reseal 0.99 1.21 2016 $26,928
1 Dongolocking Road (1) 10mm reseal 6.18 8.93 2016 $244,200
1 Dongolocking Road (1) 10mm reseal 19.95 26.17 2016 $564,144
2 Beaufort Road (2) 10mm reseal 11.50 12.55 2016 $95,760
2 Beaufort Road (2) 10mm reseal 19.64 20.70 2016 $139,920
2 Beaufort Road (2) 10mm reseal 10.22 11.50 2016 $116,736
2 Beaufort Road (2) 10mm reseal 15.50 16.20 2016 $66,696
2 Beaufort Road (2) 10mm reseal 6.26 8.09 2016 $256,128
2 Beaufort Road (2) 10mm reseal 12.60 14.10 2016 $136,800
2 Beaufort Road (2) 10mm reseal 14.20 14.30 2016 $9,120
2 Beaufort Road (2) 10mm reseal 15.22 15.50 2016 $25,536
2 Beaufort Road (2) 10mm reseal 16.20 16.80 2016 $79,200
2 Beaufort Road (2) 10mm reseal 16.90 17.85 2016 $125,400
2 Beaufort Road (2) 10mm reseal 2.44 4.77 2016 $212,496
2 Beaufort Road (2) 10mm reseal 4.77 5.69 2016 $88,800
2 Beaufort Road (2) 10mm reseal 5.79 6.26 2016 $42,864
2 Beaufort Road (2) 10mm reseal 8.09 10.22 2016 $194,256
4 Bullock Hills Road (4) 10mm reseal 1.34 3.23 2016 $248,712
4 Bullock Hills Road (4) 10mm reseal 3.27 3.77 2016 $72,000
5 Jaloran Road (5) 10mm reseal 10.50 14.90 2016 $430,152
5 Jaloran Road (5) 10mm reseal 1.43 1.90 2016 $64,296
6 Behn Ord Road (6) 10mm reseal 5.30 5.48 2016 $15,984
10 Norring - Dellyanine Road (10) 10mm reseal 10.05 13.11 2016 $289,920
10 Norring - Dellyanine Road (10) 10mm reseal 13.21 13.33 2016 $12,096
18 Ballaying South Road (18) 10mm reseal 0.17 0.32 2016 $26,280
24 Toolibin South Road (24) 10mm reseal 0.22 0.31 2016 $10,800
62 Trent Street (62) 10mm reseal 0.00 0.03 2016 $10,080
95 Wests Road (95) resheet unsealed 0.00 0.60 2016 $71,400
97 Blacks Road (97) 10mm reseal 2.65 2.68 2016 $5,328
97 Blacks Road (97) 10mm reseal 0.18 0.22 2016 $5,376
100 Riseborough Road (100) resheet unsealed 6.83 7.17 2016 $28,900
107 Wendell Street (107) 10mm reseal 0.07 0.38 2016 $39,432
108 Umbra Street (108) 10mm reseal 0.45 0.54 2016 $11,664
108 Umbra Street (108) 10mm reseal 0.00 0.29 2016 $53,136
108 Umbra Street (108) 10mm reseal 0.54 0.67 2016 $20,688
108 Umbra Street (108) 10mm reseal 0.29 0.45 2016 $35,520
109 Johnston Street (109) 10mm reseal 0.00 0.71 2016 $209,040
110 Ultra Street (110) 10mm reseal 0.00 0.04 2016 $9,600
110 Ultra Street (110) 10mm reseal 0.04 0.26 2016 $36,960
111 Una Street (111) 10mm reseal 0.00 0.14 2016 $36,960
115 Ranford Street (115) 10mm reseal 0.00 0.28 2016 $90,960
116 Upland Street (116) 10mm reseal 0.00 0.27 2016 $84,240

- 33 -
SHIRE OF WAGIN – ROADS AND BRIDGES ASSET MANAGEMENT PLAN
Asset ID
Asset Name Works Description From SLK
To SLK Renewal Year
Renewal Cost
116 Upland Street (116) 10mm reseal 0.27 1.11 2016 $256,320
117 Throssell Street (117) 10mm reseal 0.00 0.15 2016 $39,600
121 Bedford Lane (121) 10mm reseal 0.00 0.14 2016 $34,944
124 Kersley Lane (124) 10mm reseal 0.00 0.05 2016 $5,040
125 Blythe Lane (125) 10mm reseal 0.00 0.14 2016 $24,864
126 Rifle Street (126) 10mm reseal 0.00 0.20 2016 $29,376
126 Rifle Street (126) 10mm reseal 2.11 2.84 2016 $73,584
127 Stubbs Street (127) 10mm reseal 0.00 0.35 2016 $109,200
128 Mckenna Street (128) 10mm reseal 0.00 0.12 2016 $37,440
129 Sawle Street (129) 10mm reseal 0.12 0.16 2016 $4,080
130 Etelowie Street (130) 10mm reseal 0.00 0.21 2016 $55,440
130 Etelowie Street (130) 10mm reseal 0.21 0.34 2016 $24,960
131 Morris Street (131) 10mm reseal 0.00 0.13 2016 $40,560
131 Morris Street (131) 10mm reseal 0.13 0.25 2016 $25,632
132 Traverse Street (132) 10mm reseal 0.00 0.09 2016 $30,240
136 Tarbet Street (136) 10mm reseal 0.00 0.35 2016 $96,240
139 Trimdon Street (139) 10mm reseal 0.21 0.34 2016 $28,080
140 Theta Street (140) 10mm reseal 0.08 0.16 2016 $21,120
141 Tasman Street (141) 10mm reseal 0.00 0.18 2016 $47,520
142 Tennyson Street (142) 10mm reseal 0.00 0.21 2016 $28,728
146 Gordon Street (146) 10mm reseal 0.15 0.26 2016 $29,040
147 Sirdar Street (147) 10mm reseal 0.00 0.28 2016 $53,760
150 Moore Street (150) 10mm reseal 0.16 0.30 2016 $16,800
151 Rifle North Street (151) 10mm reseal 0.60 0.98 2016 $54,720
152 Ventnor Street (152) 10mm reseal 0.21 0.45 2016 $62,880
155 Arnott Street (155) 10mm reseal 0.25 0.37 2016 $31,680
157 Unicorn Street (157) 10mm reseal 0.00 0.07 2016 $18,480
158 Tavistock Street (158) 10mm reseal 0.21 0.42 2016 $80,256
159 Khedive Street (159) 10mm reseal 0.23 0.54 2016 $40,176
159 Khedive Street (159) 10mm reseal 0.64 0.75 2016 $29,040
159 Khedive Street (159) 10mm reseal 0.75 1.01 2016 $68,640
159 Khedive Street (159) 10mm reseal 1.01 1.15 2016 $36,960
159 Khedive Street (159) 10mm reseal 0.54 0.64 2016 $26,400
160 Airfield Road (160) 10mm reseal 0.22 0.25 2016 $5,328
160 Airfield Road (160) 10mm reseal 0.55 0.59 2016 $7,104
164 Omdurman Street (164) 10mm reseal 0.42 0.66 2016 $63,360
165 Leonora Street (165) 10mm reseal 0.00 0.20 2016 $67,200
166 Ware Street (166) 10mm reseal 0.34 0.81 2016 $124,080
168 Vera Street (168) 10mm reseal 0.00 0.14 2016 $17,808
170 Vine Street (170) 10mm reseal 0.20 0.34 2016 $27,552
171 Venice Street (171) 10mm reseal 0.00 0.21 2016 $29,232
177 Vernon Street (177) 10mm reseal 0.45 1.20 2016 $133,200
177 Vernon Street (177) 10mm reseal 0.02 0.21 2016 $50,160
177 Vernon Street (177) 10mm reseal 0.24 0.45 2016 $55,440

- 34 -
SHIRE OF WAGIN – ROADS AND BRIDGES ASSET MANAGEMENT PLAN
Asset ID
Asset Name Works Description From SLK
To SLK Renewal Year
Renewal Cost
181 Ranford Lane (181) 10mm reseal 0.00 0.03 2016 $4,320
186 Giles Street (186) 10mm reseal 0.00 0.07 2016 $10,080
187 George Place (187) 10mm reseal 0.00 0.06 2016 $18,720
190 George Street (190) 10mm reseal 0.00 0.26 2016 $75,360
192 Lefroy Street (192) 10mm reseal 0.00 0.26 2016 $54,288
194 Hunt Street (194) 10mm reseal 0.12 0.22 2016 $19,200
194 Hunt Street (194) 10mm reseal 0.00 0.12 2016 $31,680
195 Pederick Drive (195) 10mm reseal 0.00 0.16 2016 $35,328
198 Cowcher Road (198) Resheet unsealed 0.04 0.08 2016 $7,200
198 Cowcher Road (198) resheet unsealed 0.38 0.55 2016 $14,450
202 Kersley Road (202) resheet unsealed 0.00 0.22 2016 $16,830
210 Boddington Street (210) 10mm reseal 0.00 0.06 2016 $12,960
$6,787,188
Asset ID
Asset Name Works Description From SLK
To SLK Renewal Year
Renewal Cost
1 Dongolocking Road (1) 10mm reseal 0.00 0.99 2017 $121,176
1 Dongolocking Road (1) 10mm reseal 1.95 5.95 2017 $467,088
1 Dongolocking Road (1) 10mm reseal 5.95 6.18 2017 $20,424
1 Dongolocking Road (1) 10mm reseal 8.93 10.50 2017 $139,416
1 Dongolocking Road (1) 10mm reseal 12.03 13.08 2017 $93,240
5 Jaloran Road (5) 10mm reseal 0.00 0.37 2017 $50,616
5 Jaloran Road (5) 10mm reseal 1.17 1.43 2017 $35,568
9 Norring Road (9) 10mm reseal 0.00 6.68 2017 $641,280
111 Una Street (111) 10mm reseal 0.14 0.30 2017 $29,904
116 Upland Street (116) 10mm reseal 1.11 1.34 2017 $45,816
120 Unit Street (120) 10mm reseal 0.00 0.32 2017 $84,480
122 Usil Lane (122) 10mm reseal 0.00 0.14 2017 $28,224
132 Traverse Street (132) 10mm reseal 0.09 0.18 2017 $30,240
152 Ventnor Street (152) 10mm reseal 0.00 0.21 2017 $50,400
159 Khedive Street (159) 10mm reseal 1.15 1.37 2017 $58,080
160 Airfield Road (160) 10mm reseal 0.10 0.22 2017 $21,312
160 Airfield Road (160) 10mm reseal 0.25 0.55 2017 $53,280
160 Airfield Road (160) 10mm reseal 0.59 1.66 2017 $190,032
164 Omdurman Street (164) 10mm reseal 0.66 0.75 2017 $23,760
164 Omdurman Street (164) 10mm reseal 0.75 1.06 2017 $59,520
169 Vernal Street (169) 10mm reseal 0.22 0.46 2017 $50,064
188 Randall Street (188) 10mm reseal 0.00 0.12 2017 $37,440
191 Vale Street (191) 10mm reseal 0.00 0.20 2017 $27,360
222 Stewart Road (222) 10mm reseal 0.00 0.31 2017 $47,616
$2,406,336

- 35 -
SHIRE OF WAGIN – ROADS AND BRIDGES ASSET MANAGEMENT PLAN
Appendix B Projected 10 Year Capital Renewal Works Program (continued)
Asset ID
Asset Name Works Description From SLK
To SLK Renewal Year
Renewal Cost
2 Beaufort Road (2) 10mm reseal 0.00 0.16 2018 $22,272
2 Beaufort Road (2) 10mm reseal 0.16 2.21 2018 $251,760
2 Beaufort Road (2) 10mm reseal 2.21 2.44 2018 $20,976
3 Ballagin Road (3) 10mm reseal 8.50 8.94 2018 $72,864
5 Jaloran Road (5) 10mm reseal 4.76 5.00 2018 $35,136
6 Behn Ord Road (6) 10mm reseal 0.00 1.25 2018 $119,088
6 Behn Ord Road (6) 10mm reseal 1.38 2.14 2018 $67,488
6 Behn Ord Road (6) 10mm reseal 2.36 5.30 2018 $261,072
7 Bockaring Road (7) 10mm reseal 0.00 6.68 2018 $658,992
14 Warup South Road (14) 10mm reseal 8.00 8.01 2018 $1,584
112 Union Street (112) 10mm reseal 0.00 0.10 2018 $12,000
112 Union Street (112) 10mm reseal 0.10 0.43 2018 $87,120
123 Bank Place (123) 10mm reseal 0.00 0.14 2018 $22,848
129 Sawle Street (129) 10mm reseal 0.00 0.12 2018 $33,984
148 Nalder Road (148) 10mm reseal 0.00 0.19 2018 $59,280
148 Nalder Road (148) 10mm reseal 0.19 0.38 2018 $36,024
153 Victor Street (153) 10mm reseal 0.00 0.23 2018 $22,080
$1,784,568
Asset ID
Asset Name Works Description From SLK
To SLK Renewal Year
Renewal Cost
4 BULLOCK HILLS ROAD (4) 10mm reseal 0.00 1.25 2019 $170,616
4 BULLOCK HILLS ROAD (4) 10mm reseal 1.25 1.34 2019 $11,448
4 BULLOCK HILLS ROAD (4) 10mm reseal 3.81 7.30 2019 $402,312
4 BULLOCK HILLS ROAD (4) 10mm reseal 7.95 9.89 2019 $176,928
4 BULLOCK HILLS ROAD (4) resheet unsealed 24.05 24.21 2019 $32,640
4 BULLOCK HILLS ROAD (4) resheet unsealed 24.21 28.90 2019 $637,840
5 JALORAN ROAD (5) 10mm reseal 3.99 4.76 2019 $112,728
6 BEHN ORD ROAD (6) resheet unsealed 12.14 14.22 2019 $247,520
7 BOCKARING ROAD (7) resheet unsealed 6.68 8.87 2019 $465,375
8 COLLANILLING ROAD (8) 10mm reseal 0.00 3.13 2019 $321,216
8 COLLANILLING ROAD (8) resheet unsealed 12.19 12.48 2019 $29,580
9 NORRING ROAD (9) resheet unsealed 6.68 8.70 2019 $240,380
9 NORRING ROAD (9) resheet unsealed 8.99 9.76 2019 $98,175
9 NORRING ROAD (9) resheet unsealed 10.11 11.16 2019 $133,875
11 NOBLE ROAD (11) resheet unsealed 0.00 3.97 2019 $404,940
12
PIESSEVILLE - TARWONGA ROAD (12) resheet unsealed 0.00 3.50 2019 $357,000
12
PIESSEVILLE - TARWONGA ROAD (12) resheet unsealed 3.50 3.69 2019 $19,380
12
PIESSEVILLE - TARWONGA ROAD (12) resheet unsealed 4.20 6.33 2019 $217,260

- 36 -
SHIRE OF WAGIN – ROADS AND BRIDGES ASSET MANAGEMENT PLAN
Asset ID
Asset Name Works Description From SLK
To SLK Renewal Year
Renewal Cost
13 LIME LAKE WEST (13) resheet unsealed 0.00 4.02 2019 $410,040
15 WARUP NORTH ROAD (15) resheet unsealed 3.40 4.30 2019 $91,800
15 WARUP NORTH ROAD (15) resheet unsealed 4.95 6.20 2019 $127,500
15 WARUP NORTH ROAD (15) resheet unsealed 7.05 9.85 2019 $285,600
16 WARUP WEST ROAD (16) resheet unsealed 0.00 0.42 2019 $49,980
17 BALLAYING ROAD (17) resheet unsealed 0.00 1.15 2019 $136,850
18 BALLAYING SOUTH ROAD (18) resheet unsealed 6.00 12.05 2019 $698,972
19 HEIGHT ROAD (19) resheet unsealed 0.00 3.60 2019 $428,400
19 HEIGHT ROAD (19) resheet unsealed 3.96 5.40 2019 $159,120
21 ROWELLS ROAD (21) resheet unsealed 0.20 12.46 2019 $1,605,310
24 TOOLIBIN SOUTH ROAD (24) resheet unsealed 0.00 0.22 2019 $22,440
24 TOOLIBIN SOUTH ROAD (24) resheet unsealed 0.31 8.32 2019 $925,956
26 SPRIGGS FRASER ROAD (26) resheet unsealed 7.94 10.94 2019 $306,000
27 DE LYANINE NORTH ROAD (27) resheet unsealed 3.90 7.11 2019 $327,420
28 BOYALLING ROAD (28) resheet unsealed 5.50 7.00 2019 $163,200
31 THOMPSON ROAD (31) resheet unsealed 0.00 1.15 2019 $117,300
32 LIME LAKE EAST ROAD (32) resheet unsealed 0.00 1.25 2019 $157,250
34 SPRIGG ROAD (34) resheet unsealed 1.20 1.97 2019 $78,540
35 QUEEREARRUP ROAD (35) resheet unsealed 0.00 1.35 2019 $160,650
35 QUEEREARRUP ROAD (35) resheet unsealed 1.89 5.95 2019 $429,284
36 CAILES ROAD (36) resheet unsealed 0.70 3.33 2019 $268,260
36 CAILES ROAD (36) resheet unsealed 5.55 5.94 2019 $33,150
37 CHESTER ROAD (37) resheet unsealed 0.00 2.01 2019 $170,850
38 NALLIAN ROAD (38) resheet unsealed 0.00 4.10 2019 $425,170
38 NALLIAN ROAD (38) resheet unsealed 4.10 4.30 2019 $20,740
39 GUNDARING NORTH ROAD (39) resheet unsealed 6.53 7.56 2019 $105,060
40 PEDERICK ROAD (40) resheet unsealed 0.00 4.90 2019 $583,100
41 HARRIS ROAD (41) resheet unsealed 5.30 6.17 2019 $73,950
42 SUTHERLANDS ROAD (42) resheet unsealed 0.00 0.10 2019 $9,350
42 SUTHERLANDS ROAD (42) resheet unsealed 0.10 1.12 2019 $95,370
48 FLAGSTAFF ROAD (48) resheet unsealed 0.00 1.90 2019 $193,800
50 BODDINGTON ROAD (50) resheet unsealed 1.30 2.02 2019 $73,440
52 KENNETTS ROAD (52) resheet unsealed 0.00 1.02 2019 $121,380
53 ANDREWS ROAD (53) resheet unsealed 0.45 1.10 2019 $49,725
58 GANZER ROAD (58) resheet unsealed 0.00 2.58 2019 $285,090
58 GANZER ROAD (58) resheet unsealed 4.05 5.22 2019 $129,285
59 DRAYTON ROAD (59) resheet unsealed 0.00 1.88 2019 $191,760
61 CARBERDINE POOL ROAD (61) resheet unsealed 0.00 2.57 2019 $262,140
65 BOLTS ROAD (65) resheet unsealed 0.00 2.27 2019 $256,071
68 SMITHS ROAD (68) resheet unsealed 0.00 3.60 2019 $397,800
70 JEFFRIS ROAD (70) resheet unsealed 0.00 3.38 2019 $344,760
74 CARRIMURREN ROAD (74) resheet unsealed 0.00 0.34 2019 $28,900
75 FARROW ROAD (75) resheet unsealed 0.00 0.75 2019 $89,250
75 FARROW ROAD (75) resheet unsealed 3.08 3.90 2019 $97,580

- 37 -
SHIRE OF WAGIN – ROADS AND BRIDGES ASSET MANAGEMENT PLAN
Asset ID
Asset Name Works Description From SLK
To SLK Renewal Year
Renewal Cost
76 VAGG ROAD (76) resheet unsealed 0.00 0.38 2019 $51,680
83 MCDOUGALLS ROAD (83) resheet unsealed 1.30 1.80 2019 $42,500
84 HALLS ROAD (84) resheet unsealed 0.00 0.49 2019 $58,310
85 MORCOMBE ROAD (85) resheet unsealed 0.00 1.70 2019 $144,500
86 CAMERONS ROAD (86) resheet unsealed 0.00 3.18 2019 $324,360
87 ROBINSON ROAD (87) resheet unsealed 0.00 6.10 2019 $725,900
87 ROBINSON ROAD (87) resheet unsealed 6.90 7.20 2019 $30,600
87 ROBINSON ROAD (87) resheet unsealed 9.58 12.37 2019 $284,580
87 ROBINSON ROAD (87) resheet unsealed 12.60 12.68 2019 $8,160
90 ANGWINS ROAD (90) resheet unsealed 1.58 1.96 2019 $38,760
90 ANGWINS ROAD (90) resheet unsealed 2.39 5.03 2019 $269,280
91 MURDOCK ROAD (91) resheet unsealed 0.00 0.70 2019 $95,200
91 MURDOCK ROAD (91) resheet unsealed 1.65 2.40 2019 $102,000
92 BALL ROAD (92) resheet unsealed 1.80 6.66 2019 $528,768
93 BAXTERS ROAD (93) resheet unsealed 1.06 1.61 2019 $56,100
94 BALLAYING WEST (94) resheet unsealed 0.00 3.25 2019 $331,500
94 BALLAYING WEST (94) resheet unsealed 3.25 5.93 2019 $273,360
97 BLACKS ROAD (97) resheet unsealed 2.68 3.22 2019 $55,080
101 HYDE ROAD (101) resheet unsealed 0.00 0.80 2019 $81,600
101 HYDE ROAD (101) resheet unsealed 1.20 1.61 2019 $41,820
104 KOOBADONG ROAD (104) resheet unsealed 4.86 5.54 2019 $69,360
111 UNA STREET (111) resheet unsealed 0.50 1.06 2019 $58,174
126 RIFLE STREET (126) 10mm reseal 0.20 0.61 2019 $81,672
149 NENKE STREET (149) 10mm reseal 0.00 0.23 2019 $46,368
150 MOORE STREET (150) resheet unsealed 0.00 0.16 2019 $19,040
150 MOORE STREET (150) resheet unsealed 0.30 1.45 2019 $136,850
152 VENTNOR STREET (152) resheet unsealed 1.32 1.63 2019 $44,795
170 VINE STREET (170) 10mm reseal 0.34 0.57 2019 $45,264
173 KIRKS ROAD (173) resheet unsealed 0.00 0.16 2019 $14,960
173 KIRKS ROAD (173) resheet unsealed 0.21 1.30 2019 $101,915
179 THROSSELL LANE (179) resheet unsealed 0.00 0.05 2019 $3,400
199 BEDFORD STREET (199) resheet unsealed 0.00 0.18 2019 $21,420
201 HANTKE STREET (201) resheet unsealed 0.00 0.22 2019 $22,440
217 VAGG ROAD SLIP (217) resheet unsealed 0.00 0.26 2019 $30,940
219 RIVER TARN (219) resheet unsealed 0.00 2.05 2019 $174,250
$19,481,712
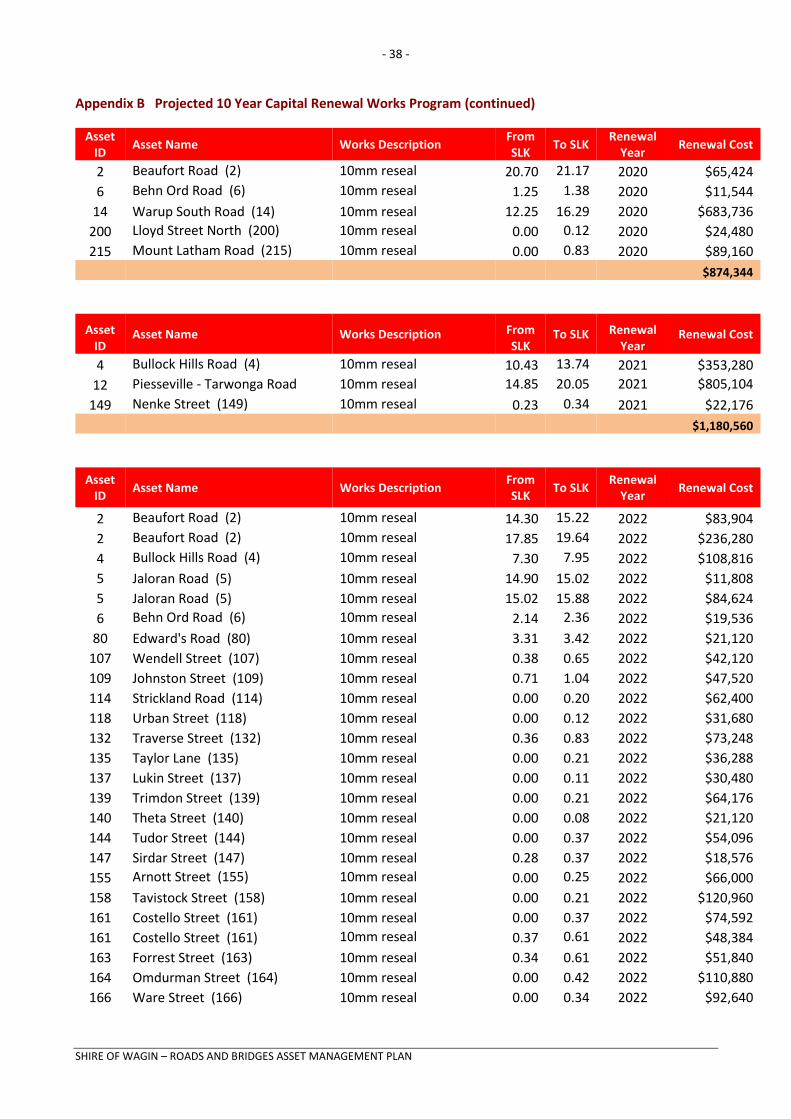
- 38 -
SHIRE OF WAGIN – ROADS AND BRIDGES ASSET MANAGEMENT PLAN
Appendix B Projected 10 Year Capital Renewal Works Program (continued)
Asset ID
Asset Name Works Description From SLK
To SLK Renewal
Year Renewal Cost
2 Beaufort Road (2) 10mm reseal 20.70 21.17 2020 $65,424
6 Behn Ord Road (6) 10mm reseal 1.25 1.38 2020 $11,544
14 Warup South Road (14) 10mm reseal 12.25 16.29 2020 $683,736
200 Lloyd Street North (200) 10mm reseal 0.00 0.12 2020 $24,480
215 Mount Latham Road (215) 10mm reseal 0.00 0.83 2020 $89,160
$874,344
Asset ID
Asset Name Works Description From SLK
To SLK Renewal Year
Renewal Cost
4 Bullock Hills Road (4) 10mm reseal 10.43 13.74 2021 $353,280
12 Piesseville - Tarwonga Road 10mm reseal 14.85 20.05 2021 $805,104
149 Nenke Street (149) 10mm reseal 0.23 0.34 2021 $22,176
$1,180,560
Asset ID
Asset Name Works Description From SLK
To SLK Renewal
Year Renewal Cost
2 Beaufort Road (2) 10mm reseal 14.30 15.22 2022 $83,904
2 Beaufort Road (2) 10mm reseal 17.85 19.64 2022 $236,280
4 Bullock Hills Road (4) 10mm reseal 7.30 7.95 2022 $108,816
5 Jaloran Road (5) 10mm reseal 14.90 15.02 2022 $11,808
5 Jaloran Road (5) 10mm reseal 15.02 15.88 2022 $84,624
6 Behn Ord Road (6) 10mm reseal 2.14 2.36 2022 $19,536
80 Edward's Road (80) 10mm reseal 3.31 3.42 2022 $21,120
107 Wendell Street (107) 10mm reseal 0.38 0.65 2022 $42,120
109 Johnston Street (109) 10mm reseal 0.71 1.04 2022 $47,520
114 Strickland Road (114) 10mm reseal 0.00 0.20 2022 $62,400
118 Urban Street (118) 10mm reseal 0.00 0.12 2022 $31,680
132 Traverse Street (132) 10mm reseal 0.36 0.83 2022 $73,248
135 Taylor Lane (135) 10mm reseal 0.00 0.21 2022 $36,288
137 Lukin Street (137) 10mm reseal 0.00 0.11 2022 $30,480
139 Trimdon Street (139) 10mm reseal 0.00 0.21 2022 $64,176
140 Theta Street (140) 10mm reseal 0.00 0.08 2022 $21,120
144 Tudor Street (144) 10mm reseal 0.00 0.37 2022 $54,096
147 Sirdar Street (147) 10mm reseal 0.28 0.37 2022 $18,576
155 Arnott Street (155) 10mm reseal 0.00 0.25 2022 $66,000
158 Tavistock Street (158) 10mm reseal 0.00 0.21 2022 $120,960
161 Costello Street (161) 10mm reseal 0.00 0.37 2022 $74,592
161 Costello Street (161) 10mm reseal 0.37 0.61 2022 $48,384
163 Forrest Street (163) 10mm reseal 0.34 0.61 2022 $51,840
164 Omdurman Street (164) 10mm reseal 0.00 0.42 2022 $110,880
166 Ware Street (166) 10mm reseal 0.00 0.34 2022 $92,640

- 39 -
SHIRE OF WAGIN – ROADS AND BRIDGES ASSET MANAGEMENT PLAN
Asset ID
Asset Name Works Description From SLK
To SLK Renewal
Year Renewal Cost
170 Vine Street (170) 10mm reseal 0.00 0.09 2022 $16,200
181 Ranford Lane (181) 10mm reseal 0.03 0.20 2022 $24,480
189 Charles Street (189) 10mm reseal 0.00 0.12 2022 $37,440
$1,691,208

- 40 -
SHIRE OF WAGIN – ROADS AND BRIDGES ASSET MANAGEMENT PLAN
Appendix C Planned Upgrade/Exp/New 10 year Capital Works Program
Asset ID Asset Name Works Description From SLK To SLK Upgrade Year Renewal Cost
Forecast Expenditure Amount No projects detailed 2013 $432,000
$432,000
Asset ID Asset Name Works Description From SLK To SLK Upgrade Year Renewal Cost
Forecast Expenditure Amount No projects detailed 2014 $211,000
$211,000
Asset ID Asset Name Works Description From SLK To SLK Upgrade Year Renewal Cost
Forecast Expenditure Amount No projects detailed 2015 $240,000
$240,000
Asset ID Asset Name Works Description From SLK To SLK Upgrade Year Renewal Cost
Forecast Expenditure Amount No projects detailed 2016 $192,000
$192,000
Asset ID Asset Name Works Description From SLK To SLK Upgrade Year Renewal Cost
Forecast Expenditure Amount No projects detailed 2017 $139,000
$139,000
Asset ID Asset Name Works Description From SLK To SLK Upgrade Year Renewal Cost
Forecast Expenditure Amount No projects detailed 2018 $198,000
$198,000
Asset ID Asset Name Works Description From SLK To SLK Upgrade Year Renewal Cost
Forecast Expenditure Amount No projects detailed 2019 $226,000
$226,000
Asset ID Asset Name Works Description From SLK To SLK Upgrade Year Renewal Cost
Forecast Expenditure Amount No projects detailed 2020 $263,000
$263,000
Asset ID Asset Name Works Description From SLK To SLK Upgrade Year Renewal Cost
Forecast Expenditure Amount No projects detailed 2021 $143,000
$143,000
Asset ID Asset Name Works Description From SLK To SLK Upgrade Year Renewal Cost
Forecast Expenditure Amount No projects detailed 2022 $231,000
$231,000

- 41 -
SHIRE OF WAGIN – ROADS AND BRIDGES ASSET MANAGEMENT PLAN
Appendix D Abbreviations
AAAC Average annual asset consumption
AMP Asset management plan
ARI Average recurrence interval
BOD Biochemical (biological) oxygen demand
CRC Current replacement cost
CWMS Community wastewater management systems
DA Depreciable amount
EF Earthworks/formation
IRMP Infrastructure risk management plan
LCC Life Cycle cost
LCE Life cycle expenditure
MMS Maintenance management system
PCI Pavement condition index
RV Residual value
SS Suspended solids
vph Vehicles per hour
- 42 -
SHIRE OF WAGIN – ROADS AND BRIDGES ASSET MANAGEMENT PLAN
Appendix E Glossary
Annual service cost (ASC) 1) Reporting actual cost The annual (accrual) cost of providing a service
including operations, maintenance, depreciation, finance/opportunity and disposal costs less revenue.
2) For investment analysis and budgeting An estimate of the cost that would be tendered,
per annum, if tenders were called for the supply of a service to a performance specification for a fixed term. The Annual Service Cost includes operations, maintenance, depreciation, finance/ opportunity and disposal costs, less revenue.
Asset A resource controlled by an entity as a result of past events and from which future economic benefits are expected to flow to the entity. Infrastructure assets are a sub-class of property, plant and equipment, which are non-current assets with a life greater than 12 months and enable services to be provided.
Asset class A group of assets having a similar nature or function in the operations of an entity, and which, for purposes of disclosure, is shown as a single item without supplementary disclosure.
Asset condition assessment The process of continuous or periodic inspection, assessment, measurement and interpretation of the resultant data to indicate the condition of a specific asset so as to determine the need for some preventative or remedial action.
Asset management (AM) The combination of management, financial, economic, engineering and other practices applied to physical assets with the objective of providing the required level of service in the most cost effective manner.
Average annual asset consumption (AAAC)* The amount of an organisation’s asset base consumed during a reporting period (generally a year). This may be calculated by dividing the depreciable amount by the useful life (or total future economic benefits/service potential) and totalled for each and every asset OR by dividing the carrying amount (depreciated replacement cost) by the remaining useful life (or remaining future economic benefits/service potential) and totalled for each and every asset in an asset category or class.
Borrowings A borrowing or loan is a contractual obligation of the borrowing entity to deliver cash or another financial asset to the lending entity over a specified period of time or at a specified point in time, to cover both the initial capital provided and the cost of the interest incurred for providing this capital. A borrowing or loan provides the means for the borrowing entity to finance outlays (typically physical assets) when it has insufficient funds of its own to do so, and for the lending entity to make a financial return, normally in the form of interest revenue, on the funding provided.
Capital expenditure Relatively large (material) expenditure, which has benefits, expected to last for more than 12 months. Capital expenditure includes renewal, expansion and upgrade. Where capital projects involve a combination of renewal, expansion and/or upgrade expenditures, the total project cost needs to be allocated accordingly.
Capital expenditure - expansion Expenditure that extends the capacity of an existing asset to provide benefits, at the same standard as is currently enjoyed by existing beneficiaries, to a new group of users. It is discretionary expenditure, which increases future operations and maintenance costs, because it increases the organisation’s asset base, but may be associated with additional revenue from the new user group, e.g. extending a drainage or road network, the provision of an oval or park in a new suburb for new residents.
Capital expenditure - new Expenditure which creates a new asset providing a new service/output that did not exist beforehand. As it increases service potential it may impact revenue and will increase future operations and maintenance expenditure.
Capital expenditure - renewal Expenditure on an existing asset or on replacing an existing asset, which returns the service capability of the asset up to that which it had originally. It is periodically required expenditure, relatively large (material) in value compared with the value of the components or sub-components of the asset being renewed. As it reinstates existing service potential, it generally has no impact on revenue, but may reduce future operations and maintenance expenditure if completed at the optimum time, e.g. resurfacing or resheeting a material part of a road network, replacing a material section of a drainage network with pipes of the same capacity, resurfacing an oval.

- 43 -
SHIRE OF WAGIN – ROADS AND BRIDGES ASSET MANAGEMENT PLAN
Capital expenditure - upgrade Expenditure, which enhances an existing asset to provide a higher level of service or expenditure that will increase the life of the asset beyond that which it had originally. Upgrade expenditure is discretionary and often does not result in additional revenue unless direct user charges apply. It will increase operations and maintenance expenditure in the future because of the increase in the organisation’s asset base, e.g. widening the sealed area of an existing road, replacing drainage pipes with pipes of a greater capacity, enlarging a grandstand at a sporting facility.
Capital funding Funding to pay for capital expenditure.
Capital grants Monies received generally tied to the specific projects for which they are granted, which are often upgrade and/or expansion or new investment proposals.
Capital investment expenditure See capital expenditure definition
Capitalisation threshold The value of expenditure on non-current assets above which the expenditure is recognised as capital expenditure and below which the expenditure is charged as an expense in the year of acquisition.
Carrying amount The amount at which an asset is recognised after deducting any accumulated depreciation / amortisation and accumulated impairment losses thereon.
Class of assets See asset class definition
Component Specific parts of an asset having independent physical or functional identity and having specific attributes such as different life expectancy, maintenance regimes, risk or criticality.
Cost of an asset The amount of cash or cash equivalents paid or the fair value of the consideration given to acquire an asset at the time of its acquisition or construction, including any costs necessary to place the asset into service. This includes one-off design and project management costs.
Current replacement cost (CRC) The cost the entity would incur to acquire the asset on the reporting date. The cost is measured by reference to the lowest cost at which the gross future economic benefits could be obtained in the normal course of business or the minimum it would cost, to replace the existing asset with a technologically modern equivalent new asset (not a second hand one) with the same economic benefits (gross service potential) allowing for any differences in the quantity and quality of output and in operating costs.
Depreciable amount The cost of an asset, or other amount substituted for its cost, less its residual value.
Depreciated replacement cost (DRC) The current replacement cost (CRC) of an asset less, where applicable, accumulated depreciation calculated on the basis of such cost to reflect the already consumed or expired future economic benefits of the asset.
Depreciation / amortisation The systematic allocation of the depreciable amount (service potential) of an asset over its useful life.
Economic life See useful life definition.
Expenditure The spending of money on goods and services. Expenditure includes recurrent and capital.
Fair value The amount for which an asset could be exchanged, or a liability settled, between knowledgeable, willing parties, in an arms length transaction.
Funding gap A funding gap exists whenever an entity has insufficient capacity to fund asset renewal and other expenditure necessary to be able to appropriately maintain the range and level of services its existing asset stock was originally designed and intended to deliver. The service capability of the existing asset stock should be determined assuming no additional operating revenue, productivity improvements, or net financial liabilities above levels currently planned or projected. A current funding gap means service levels have already or are currently falling. A projected funding gap if not addressed will result in a future diminution of existing service levels.

- 44 -
SHIRE OF WAGIN – ROADS AND BRIDGES ASSET MANAGEMENT PLAN
Heritage asset An asset with historic, artistic, scientific, technological, geographical or environmental qualities that is held and maintained principally for its contribution to knowledge and culture and this purpose is central to the objectives of the entity holding it.
Impairment Loss The amount by which the carrying amount of an asset exceeds its recoverable amount.
Infrastructure assets Physical assets that contribute to meeting the needs of organisations or the need for access to major economic and social facilities and services, e.g. roads, drainage, footpaths and cycleways. These are typically large, interconnected networks or portfolios of composite assets. The components of these assets may be separately maintained, renewed or replaced individually so that the required level and standard of service from the network of assets is continuously sustained. Generally the components and hence the assets have long lives. They are fixed in place and are often have no separate market value.
Investment property Property held to earn rentals or for capital appreciation or both, rather than for: (a) use in the production or supply of goods or
services or for administrative purposes; or (b) sale in the ordinary course of business.
Key performance indicator A qualitative or quantitative measure of a service or activity used to compare actual performance against a standard or other target. Performance indicators commonly relate to statutory limits, safety, responsiveness, cost, comfort, asset performance, reliability, efficiency, environmental protection and customer satisfaction.
Level of service The defined service quality for a particular service/activity against which service performance may be measured. Service levels usually relate to quality, quantity, reliability, responsiveness, environmental impact, acceptability and cost.
Life Cycle Cost 1. Total LCC The total cost of an asset throughout its
life including planning, design, construction, acquisition, operation, maintenance, rehabilitation and disposal costs.
2. Average LCC The life cycle cost (LCC) is average cost to provide the service over the longest asset life cycle. It comprises annual operations, maintenance and asset consumption expense, represented by depreciation expense. The Life Cycle Cost does not indicate the funds required to provide the service in a particular year.
Life Cycle Expenditure The Life Cycle Expenditure (LCE) is the actual or planned annual operations, maintenance and capital renewal expenditure incurred in providing the service in a particular year. Life Cycle Expenditure may be compared to average Life Cycle Cost to give an initial indicator of life cycle sustainability.
Loans / borrowings See borrowings.
Maintenance All actions necessary for retaining an asset as near as practicable to its original condition, including regular ongoing day-to-day work necessary to keep assets operating, e.g. road patching but excluding rehabilitation or renewal. It is operating expenditure required to ensure that the asset reaches its expected useful life. • Planned maintenance
Repair work that is identified and managed through a maintenance management system (MMS). MMS activities include inspection, assessing the condition against failure/breakdown criteria/experience, prioritising scheduling, actioning the work and reporting what was done to develop a maintenance history and improve maintenance and service delivery performance.
• Reactive maintenance Unplanned repair work that is carried out in response to service requests and management/supervisory directions.
• Significant maintenance Maintenance work to repair components or replace sub-components that needs to be identified as a specific maintenance item in the maintenance budget.
• Unplanned maintenance Corrective work required in the short-term to restore an asset to working condition so it can continue to deliver the required service or to maintain its level of security and integrity.
- 45 -
SHIRE OF WAGIN – ROADS AND BRIDGES ASSET MANAGEMENT PLAN
Maintenance and renewal gap Difference between estimated budgets and projected required expenditures for maintenance and renewal of assets to achieve/maintain specified service levels, totalled over a defined time (e.g. 5, 10 and 15 years).
Maintenance and renewal sustainability index
Ratio of estimated budget to projected expenditure for maintenance and renewal of assets over a defined time (e.g. 5, 10 and 15 years).
Maintenance expenditure
Recurrent expenditure, which is periodically or regularly required as part of the anticipated schedule of works required to ensure that the asset achieves its useful life and provides the required level of service. It is expenditure, which was anticipated in determining the asset’s useful life.
Materiality The notion of materiality guides the margin of error acceptable, the degree of precision required and the extent of the disclosure required when preparing general purpose financial reports. Information is material if its omission, misstatement or non-disclosure has the potential, individually or collectively, to influence the economic decisions of users taken on the basis of the financial report or affect the discharge of accountability by the management or governing body of the entity.
Modern equivalent asset Assets that replicate what is in existence with the most cost-effective asset performing the same level of service. It is the most cost efficient, currently available asset, which will provide the same stream of services as the existing asset is capable of producing. It allows for technology changes and, improvements and efficiencies in production and installation techniques
Net present value (NPV) The value to the organisation of the cash flows associated with an asset, liability, activity or event calculated using a discount rate to reflect the time value of money. It is the net amount of discounted total cash inflows after deducting the value of the discounted total cash outflows arising from e.g. the continued use and subsequent disposal of the asset after deducting the value of the discounted total cash outflows.
Non-revenue generating investments Investments for the provision of goods and services to sustain or improve services to the community that are not expected to generate any savings or revenue to the Council, e.g. parks and playgrounds, footpaths, roads and bridges, libraries, etc.
Operations expenditure Recurrent expenditure, which is continuously required to provide a service. In common use the term typically includes, e.g. power, fuel, staff, plant equipment, on-costs and overheads but excludes maintenance and depreciation. Maintenance and depreciation is on the other hand included in operating expenses.
Operating expense The gross outflow of economic benefits, being cash and non cash items, during the period arising in the course of ordinary activities of an entity when those outflows result in decreases in equity, other than decreases relating to distributions to equity participants.
Pavement management system A systematic process for measuring and predicting the condition of road pavements and wearing surfaces over time and recommending corrective actions.
PMS Score A measure of condition of a road segment determined from a Pavement Management System.
Rate of annual asset consumption A measure of average annual consumption of assets (AAAC) expressed as a percentage of the depreciable amount (AAAC/DA). Depreciation may be used for AAAC.
Rate of annual asset renewal A measure of the rate at which assets are being renewed per annum expressed as a percentage of depreciable amount (capital renewal expenditure/DA).
Rate of annual asset upgrade A measure of the rate at which assets are being upgraded and expanded per annum expressed as a percentage of depreciable amount (capital upgrade/expansion expenditure/DA).
Recoverable amount The higher of an asset's fair value, less costs to sell and its value in use.
Recurrent expenditure Relatively small (immaterial) expenditure or that which has benefits expected to last less than 12 months. Recurrent expenditure includes operations and maintenance expenditure.

- 46 -
SHIRE OF WAGIN – ROADS AND BRIDGES ASSET MANAGEMENT PLAN
Recurrent funding Funding to pay for recurrent expenditure.
Rehabilitation See capital renewal expenditure definition above.
Remaining useful life The time remaining until an asset ceases to provide the required service level or economic usefulness. Age plus remaining useful life is useful life.
Renewal See capital renewal expenditure definition above.
Residual value The estimated amount that an entity would currently obtain from disposal of the asset, after deducting the estimated costs of disposal, if the asset were already of the age and in the condition expected at the end of its useful life.
Revenue generating investments Investments for the provision of goods and services to sustain or improve services to the community that are expected to generate some savings or revenue to offset operating costs, e.g. public halls and theatres, childcare centres, sporting and recreation facilities, tourist information centres, etc.
Risk management The application of a formal process to the range of possible values relating to key factors associated with a risk in order to determine the resultant ranges of outcomes and their probability of occurrence.
Section or segment A self-contained part or piece of an infrastructure asset.
Service potential The total future service capacity of an asset. It is normally determined by reference to the operating capacity and economic life of an asset. A measure of service potential is used in the not-for-profit sector/public sector to value assets, particularly those not producing a cash flow.
Service potential remaining A measure of the future economic benefits remaining in assets. It may be expressed in dollar values (Fair Value) or as a percentage of total anticipated future economic benefits. It is also a measure of the percentage of the asset’s potential to provide services that is still available for use in providing services (Depreciated Replacement Cost/Depreciable Amount).
Strategic Longer-Term Plan A plan covering the term of office of councillors (4 years minimum) reflecting the needs of the community for the foreseeable future. It brings together the detailed requirements in the council’s longer-term plans such as the asset management plan and the long-term financial plan. The plan is prepared in consultation with the community and details where the council is at that point in time, where it wants to go, how it is going to get there, mechanisms for monitoring the achievement of the outcomes and how the plan will be resourced.
Specific Maintenance Replacement of higher value components/sub-components of assets that is undertaken on a regular cycle including repainting, building roof replacement, cycle, replacement of air conditioning equipment, etc. This work generally falls below the capital/ maintenance threshold and needs to be identified in a specific maintenance budget allocation.
Sub-component Smaller individual parts that make up a component part.
Useful life Either: (a) the period over which an asset is expected to be
available for use by an entity, or (b) the number of production or similar units expected
to be obtained from the asset by the entity. It is estimated or expected time between placing the asset into service and removing it from service, or the estimated period of time over which the future economic benefits embodied in a depreciable asset, are expected to be consumed by the council. Value in Use The present value of future cash flows expected to be derived from an asset or cash generating unit. It is deemed to be depreciated replacement cost (DRC) for those assets whose future economic benefits are not primarily dependent on the asset's ability to generate net cash inflows, where the entity would, if deprived of the asset, replace its remaining future economic benefits.
Source: IPWEA, 2009, Glossary