asset management plan - narrandera shire
TRANSCRIPT

NARRANDERA SHIRE COUNCIL –PARKS FACILITIES ASSET MANAGEMENT PLAN – VERSION 1.02, 8 June 2012
Narrandera Shire Council
Parks Facilities
Asset Management Plan
Version 1.02
June 2012 AM4SRRC

NARRANDERA SHIRE COUNCIL –PARKS FACILITIES ASSET MANAGEMENT PLAN – VERSION 1.02, 8 June 2012
Document Control Asset Management for Small, Rural or Remote Communities
Document ID: nsc_am4srrc parks facilities_120607_v1.02
Rev No Date Revision Details Author Reviewer Approver
1 28/5/2012 Version 1 – Draft for Comment CL, JR,
JH, AM
1.02 7 June 2012 For Council Issue CL, JR,
JH, AM
JR JR,
Asset Management for Small, Rural or Remote Communities Practice Note
The Institute of Public Works Engineering Australia.
www.ipwea.org.au/AM4SRRC
© Copyright 2011 – All rights reserved.

- i -
NARRANDERA SHIRE COUNCIL –PARKS FACILITIES ASSET MANAGEMENT PLAN – VERSION 1.02, 8 June 2012
TABLE OF CONTENTS
1. EXECUTIVE SUMMARY .................................................................................................................... iv 2. INTRODUCTION ................................................................................................................................ 1
2.1 Background .............................................................................................................................. 1 2.2 Goals and Objectives of Asset Management ........................................................................... 1 2.3 Plan Framework ....................................................................................................................... 3 2.4 Core and Advanced Asset Management ................................................................................. 3 2.5 Community Consultation ......................................................................................................... 3
3. LEVELS OF SERVICE .......................................................................................................................... 4 3.1 Customer Research and Expectations ..................................................................................... 4 3.2 Legislative Requirements ......................................................................................................... 4 3.3 Current Levels of Service ......................................................................................................... 5 3.4 Desired Levels of Service .......................................................................................................11
4. FUTURE DEMAND ..........................................................................................................................11 4.1 Demand Forecast ...................................................................................................................11 4.2 Changes in Technology ..........................................................................................................12 4.3 Demand Management Plan ...................................................................................................12 4.4 New Assets for Growth ..........................................................................................................13
5. LIFECYCLE MANAGEMENT PLAN....................................................................................................14 5.1 Background Data....................................................................................................................14 5.2 Risk Management Plan ..........................................................................................................17 5.3 Routine Maintenance Plan ....................................................................................................18 5.4 Renewal/Replacement Plan...................................................................................................20 5.5 Creation/Acquisition/Upgrade Plan ......................................................................................23 5.6 Disposal Plan ..........................................................................................................................25
6. FINANCIAL SUMMARY ...................................................................................................................25 6.1 Financial Statements and Projections ...................................................................................25 6.2 Funding Strategy ....................................................................................................................35 6.3 Valuation Forecasts ...............................................................................................................35 6.4 Key Assumptions made in Financial Forecasts ......................................................................38
.7. ASSET MANAGEMENT PRACTICES .................................................................................................39 7. ASSET MANAGEMENT PRACTICES .................................................................................................39
7.1 Accounting/Financial Systems ...............................................................................................39 7.2 Asset Management Systems ..................................................................................................39 7.3 Information Flow Requirements and Processes ....................................................................40 7.4 Standards and Guidelines ......................................................................................................40
8. PLAN IMPROVEMENT AND MONITORING .....................................................................................41 8.1 Performance Measures .........................................................................................................41 8.2 Improvement Plan .................................................................................................................41 8.3 Monitoring and Review Procedures ......................................................................................42
REFERENCES ...........................................................................................................................................42 APPENDICES ...........................................................................................................................................43
Appendix A Planned Expenditures (From Long Term Financial Plan) ..............................................44 Appendix B2 Projected 10 year Capital Renewal Works Program (Scenario 2 – Prioritised Renewal Program) ............................................................................................................................................51 Appendix C1 Planned Upgrade/Exp/New 10 year Capital Works Program (All Scenarios)..............55 Appendix D Alternate Ratio Calculations .........................................................................................59 Appendix E Abbreviations ................................................................................................................60 Appendix F Glossary .........................................................................................................................61

- ii -
NARRANDERA SHIRE COUNCIL –PARKS FACILITIES ASSET MANAGEMENT PLAN – VERSION 1.02, 8 June 2012
Tables
TABLE 1: ASSETS COVERED BY THIS PLAN........................................................................................................................... 1
TABLE 2: ASSET VALUES REPORTED IN THE FINANCIAL STATEMENTS....................................................................................... 1
TABLE 3: ORGANISATION GOALS AND HOW THESE ARE ADDRESSED IN THIS PLAN ...................................................................... 2
TABLE 4: LEGISLATIVE REQUIREMENTS ............................................................................................................................. 4
TABLE 5: CURRENT SERVICE LEVELS ................................................................................................................................. 5
TABLE 6: DEMAND FACTORS, PROJECTIONS AND IMPACT ON SERVICES .................................................................................11
TABLE 7: CHANGES IN TECHNOLOGY AND FORECAST EFFECT ON SERVICE DELIVERY .................................................................12
TABLE 8: DEMAND MANAGEMENT PLAN SUMMARY .........................................................................................................12
TABLE 9: KNOWN SERVICE PERFORMANCE DEFICIENCIES ....................................................................................................15
TABLE 10: IIMM DESCRIPTION OF CONDITION .................................................................................................................16
TABLE 11: ASSET SERVICE HIERARCHY ............................................................................................................................17
TABLE 12: CRITICAL RISKS AND TREATMENT PLANS ...........................................................................................................17
TABLE 13: MAINTENANCE EXPENDITURE TRENDS .............................................................................................................18
TABLE 14: RENEWAL PRIORITY RANKING CRITERIA ...........................................................................................................21
TABLE 15: UPGRADE/NEW ASSETS PRIORITY RANKING CRITERIA ........................................................................................24
TABLE 16: ASSETS IDENTIFIED FOR DISPOSAL ...................................................................................................................25
TABLE 17: SUSTAINABILITY INDICATORS SUMMARY ...........................................................................................................27
TABLE 18.S1: PROJECTED AND BUDGETED RENEWALS AND EXPENDITURE SHORTFALL (SCENARIO 1 - FROM ASSET REGISTER)........33
TABLE 19 .S2: PROJECTED AND BUDGETED RENEWALS AND EXPENDITURE SHORTFALL (SCENARIO 2 AND 3 – BALANCED TO LTFP –
PRIORITISED RENEWAL PROGRAM) ........................................................................................................................34
TABLE 20: EXPENDITURE PROJECTIONS FOR LONG TERM FINANCIAL PLAN ($000) (SCENARIO 3 – BALANCED TO LTFP – PRIORITISED
RENEWAL PROGRAM) .........................................................................................................................................35
TABLE 21 SECTION 8.2: IMPROVEMENT PLAN .................................................................................................................41
Figures
FIGURE 1: NEW ASSETS FOR GROWTH ...........................................................................................................................13
FIGURE 2: ASSET AGE PROFILE ......................................................................................................................................14
FIGURE 3: CURRENT ASSET CONDITION PROFILE ...............................................................................................................15
FIGURE 4: TARGET ASSET CONDITION PROFILE (SCENARIO 2) ..............................................................................................16
FIGURE 5 PROJECTED OPERATIONS AND MAINTENANCE EXPENDITURE ..................................................................................20
FIGURE 6: PROJECTED CAPITAL RENEWAL EXPENDITURE (SCENARIO 1 - FROM ASSET REGISTER) ...............................................22
FIGURE 7: PROJECTED CAPITAL RENEWAL EXPENDITURE (SCENARIO 2 AND 3 – BALANCED TO LTFP – PRIORITISED RENEWAL
PROGRAM (INDIVIDUAL RENEWAL ITEMS NOT SEPARATELY IDENTIFIED) .........................................................................23
FIGURE 8: PROJECTED CAPITAL UPGRADE/NEW ASSET EXPENDITURE ..................................................................................24
FIGURE 9: PROJECTED OPERATING AND CAPITAL EXPENDITURE AND BUDGET (SCENARIO 1 - FROM ASSET REGISTER) ...................26
FIGURE 10: PROJECTED OPERATING AND CAPITAL EXPENDITURE AND BUDGET (SCENARIOS 2 AND 3 - BALANCED TO LTFP –
PRIORITISED RENEWAL PROGRAM) ........................................................................................................................27
FIGURE 11: FINANCIAL SUSTAINABILITY INDICATORS (SCENARIO 1 – FROM ASSET REGISTER) ...................................................32
FIGURE 12: PROJECTED AND BUDGETED RENEWAL EXPENDITURE (SCENARIO 1 - FROM ASSET REGISTER) ...................................33
FIGURE 13: PROJECTED AND BUDGETED RENEWAL EXPENDITURE (SCENARIO 2 AND 3 – BALANCED TO LTFP – PRIORITISED
RENEWAL PROGRAM) .........................................................................................................................................34
FIGURE 14: PROJECTED ASSET VALUES ...........................................................................................................................36
FIGURE 15: PROJECTED DEPRECIATION EXPENSE ..............................................................................................................37

- iii -
NARRANDERA SHIRE COUNCIL –PARKS FACILITIES ASSET MANAGEMENT PLAN – VERSION 1.02, 8 June 2012

- iv -
NARRANDERA SHIRE COUNCIL –PARKS FACILITIES ASSET MANAGEMENT PLAN – VERSION 1.02, 8 June 2012
1. EXECUTIVE SUMMARY
Context
Narrandera Shire Council has a population of over 6,260 people. The shire is part of the state electorate of Murrumbidgee and the Federal electorate of Riverina.
The Shire covers an area of 4,116km2, and is bordered to the west by the local government areas of Murrumbidgee, Leeton, Griffith, to the north by Carrathool and Bland, to the east by Coolamon and Wagga Wagga and to the south by Lockhart and Urana.
The Australian Bureau of Statistic’s annual Estimated Residential Population for Local Government Areas reported that Narrandera Shire recorded a growth rate of 0% and that over the previous five years had recorded an average annual growth rate of -0.1%.
Parks Facilities
These infrastructure assets have a replacement value of $7.16M.
What does it Cost?
The projected cost to provide the services covered by this Asset Management Plan includes operations, maintenance, renewal and upgrade of existing assets over the 10 year planning period. Scenario 1 shown below is based on the asset register and indicates that the future costs (vertical bars) are generally exceeded by the future long term financial plan funding (horizontal black line); this indicates that under funding scenario 1 the renewal program is being overfunded. This is likely due to limitations with the accuracy of the existing asset register data, further improvements will be required to obtain a realistic funding scenario.
Scenario 3 below shows how council will balance funds available in the long term financial plan with the
expenditure projections in the asset management plan. This has been used for both scenario 2 and 3 at this stage and is demonstrative of a sustainable funding scenario that has not yet been developed or adopted by Council.
Councils’ present funding levels will be sufficient in the long term based on current information. The current level of expenditure is equivalent to 105.80% of the long term average funds required using the ratio of depreciation based on the asset register and average renewal spend for the next 10 years of the long term average requirements.
Projected and budgeted expenditure are shown in the table 18.S1 and 20.
What we will do
Council plans to provide parks and recreation services for the following:
• Operation, maintenance, renewal and upgrade of buildings to meet service levels set by council in annual budgets.
• $137,000 of upgrade/new assets each year of the 10 year planning period.
• Improve the underlying information with an annual review of service level trends.
What we cannot do
Council does not have enough funding to provide new services.
Managing the Risks
There are risks associated with providing the service and not being able to complete all identified activities and projects. We have identified major risks as:
• Inconsistent data. The condition profile (section 5.1.3 shows that a significant proportion (55% of sewer assets are in poor or very poor condition), however the renewal projections from the asset register show that no major renewal expenditure is needed in the next 10 years.
• Rising costs of managing infrastructure

- v -
NARRANDERA SHIRE COUNCIL –PARKS FACILITIES ASSET MANAGEMENT PLAN – VERSION 1.02, 8 June 2012
• Meeting Community expectations for services
• Providing the most appropriate and affordable infrastructure for the community
• Controlling the deterioration of the parks facilities assets due to lack of renewal funding.
We will endeavour to manage these risks within available funding by:
• Manage the existing infrastructure
• Manage the expansion of parks facilities infrastructure based on the priorities established in the Community Plan
• Expand infrastructure in a financially responsible manner and as funded in Council’s Long Term Financial Plan.
• Seek additional funding in the form of grants wherever possible.
• Annual review and update of service level and risk projections as data improves. This review will inform the annual budget process.
The Next Steps
The actions resulting from this asset management plan are:
• Continue to improve asset information and knowledge.
• Develop a single corporate asset register for financial and reporting purposes
• Monitor the provision of parks facilities infrastructure alongside the community expectations for community facilities.
Questions you may have
What is this plan about?
This asset management plan covers the infrastructure assets that serve the Narrandera Community’s parks and recreation needs. These assets include parks, playground and sporting field assets throughout the Council area that enable people to provide community and recreation facilities for residents and visitors to Council in the most cost effective manner.
What is an Asset Management Plan?
Asset management planning is a comprehensive process to ensure delivery of services from infrastructure is provided in a financially sustainable manner.
An asset management plan details information about infrastructure assets including actions required to provide an agreed level of service in the most cost effective manner. The Plan defines the services to be provided, how the services are provided and what funds are required to provide the services.
Is there a funding shortfall?
Based on the current asset register, Councils’ present funding levels are sufficient to continue to provide existing services at current levels in the medium term, current funding levels indicate that renewals are being over funded; this is likely due to limitations within the asset register. This position will need to be re-examined and an accurate funding scenario developed.
Future Improvements
Future improvement involves several steps: 1. Improving asset knowledge so that data
accurately records the asset inventory, how assets are performing and when assets are not able to provide the required service levels,
2. Improving our efficiency in operating, maintaining, replacing existing and constructing new assets to optimise life cycle costs,
3. Identifying and managing risks associated with providing services from infrastructure,
4. Making tradeoffs between service levels and costs to ensure that the community receives the best return from infrastructure,
5. Indentifying assets surplus to needs for disposal to make saving in future operations and maintenance costs
6. Consulting with the community to ensure that services and costs meet community needs and are affordable,
7. Developing partnership with other bodies, where available to provide services;
8. Seeking additional funding from governments and other bodies to better reflect a ‘whole of government’ funding approach to infrastructure services.
What can we do?
Council can develop options and priorities for future parks facilities services with costs of providing the services, consult with the community to plan future services to match the community services needs with ability to pay for services and maximise benefit to the community for costs to the community.
What can you do?
Council will be pleased to consider your thoughts on the issues raised in this asset management plan and suggestions on how Council may change or reduce its services mix to ensure that the appropriate level of service can be provided to the community within available funding.
.

- 1 -
NARRANDERA SHIRE COUNCIL –PARKS FACILITIES ASSET MANAGEMENT PLAN – VERSION 1.02, 8 June 2012
2. INTRODUCTION
2.1 Background
This asset management plan is to demonstrate responsive management of assets (and services provided from assets), compliance with regulatory requirements, and to communicate funding needed to provide the required levels of service.
The asset management plan is to be read with Council’s Asset Management Policy, Asset Management Strategy and the following associated planning documents:
• Narrandera Shire Council Adopted Asset Management Plan 2011-2016
• Narrandera Shire Council Annual Report 2010/11
This infrastructure assets covered by this asset management plan are shown in Table 1.
Table 1: Assets covered by this Plan
Source: Technical Asset Register Note: The technical asset register is the latest updated register and includes changes
and updates since 30 June 2011. The technical and financial asset register in table 2 are reconciled at the time of
revaluation, however Council may choose to reconcile annually in future.
Asset Sub-Category Asset Replacement Cost (*Calculated from asset
register)
Depreciated Replacement Cost *
Annual Depreciation *
Parks and Facilities $7,164,285 $2,727,806 $154,474
TOTAL $7,164,285 $2,727,806 $154,474
Table 2: Asset Values Reported in the Financial Statements
Source: Note 9a General Purpose Financial Statements 30 June 2011
Note 9a Category - 30 June 2011
Replacement Cost ($000) Depreciated
Replacement Cost ($000)
Depreciation Expense for current
year ($000)
Open Space (Other Structures)
$5,874 $2,742 $152
TOTAL $5,874 $2,742 $152
2.2 Goals and Objectives of Asset Management
The Council exists to provide services to its community. Some of these services are provided by infrastructure assets. Council has acquired infrastructure assets by ‘purchase’, by contract, construction by council staff and by donation of assets constructed by developers and others to meet increased levels of service.
Council’s goal in managing infrastructure assets is to meet the required level of service in the most cost effective manner for present and future consumers. The key elements of infrastructure asset management are:
• Taking a life cycle approach,
• Developing cost-effective management strategies for the long term,
• Providing a defined level of service and monitoring performance,
• Understanding and meeting the demands of growth through demand management and infrastructure investment,
• Managing risks associated with asset failures,
• Sustainable use of physical resources,

- 2 -
NARRANDERA SHIRE COUNCIL –PARKS FACILITIES ASSET MANAGEMENT PLAN – VERSION 1.02, 8 June 2012
• Continuous improvement in asset management practices.1
The goal of this asset management plan is to:
• Document the services/service levels to be provided and the costs of providing the service,
• Communicate the consequences for service levels and risk, where desired funding is not available, and
• Provide information to assist decision makers in trading off service levels, costs and risks to provide services in a financially sustainable manner.
This asset management plan is prepared under the direction of Council’s vision, mission, goals and objectives.
Council’s vision is:
“Achieving Together”
Council’s mission is:
“To provide high quality affordable local government services and representation for people who live, work, and visit Narrandera Shire, and to assist also, those who have a stake in our local and regional prosperity; by way of
effective consultation, policy making and responsive delivery that meets the needs of our community.”
Relevant goals and objectives and how these are addressed in this asset management plan are shown in Table 3.
Table 3: Organisation Goals and how these are addressed in this Plan
Goal Objective How Goal and Objectives are addressed in AMP
PF 1 – Corporate Support and Governance
Goal 4 - Decisive leadership, strong partnerships and the effective and efficient management of resources
4.1.1: Maximise the benefits of information technology in improving communication, process efficiency and promote Council and community activities through the website, Council Newsletter and other media. 4.2.1: Develop and review Council Business Plans linked to the Strategic Plan and the financial capacity of Council. 4.2.2: Develop and implement a long-term Financial Plan that reflects Council/community directions 4.3.1: Utilise appropriate mechanisms to regularly review community needs 4.4.1: Examine opportunities and support for partnerships with neighbouring and regional Councils, and government agencies to address priority issues 4.5.1: Identify needs and provide appropriate training and development for staff
The Asset Management Plan in conjunction with Long Term Financial Plan and the Community Plan are the tools by which Council assesses the long term financial sustainability of council’s infrastructure assets. Planning long term sustainable infrastructure is important to enable the appropriate resources to be identified and provided. Planning long term sustainable infrastructure is important to enable Council to meet its statutory Council governance. Infrastructure is provided to support services. Getting the correct infrastructure appropriate to the needs of the community is a primary goal of Asset Management Planning. Council has limited resources. The Asset Management Planning provides a way in which the community can be engaged in setting the priorities and allocation of these resources. Risk associated with Council infrastructure is identified within the Asset Management Plan. Risk assessment is one of the tools by which Council assesses the long term sustainability of council’s infrastructure assets.
1 IPWEA, 2006, IIMM Sec 1.1.3, p 1.3.

- 3 -
NARRANDERA SHIRE COUNCIL –PARKS FACILITIES ASSET MANAGEMENT PLAN – VERSION 1.02, 8 June 2012
Goal Objective How Goal and Objectives are addressed in AMP
4.5.2: Ensure safe work practices through the implementation of the Occupational, Health and Safety Policy and Risk Management Strategy 4.6.1: Review and amend governance structures, policies and decision making processes on a regular basis
PF 8 – Recreation and Culture
Goal 1 – Social infrastructure and services that meet community needs and add to the quality of life of residents Goal 3 – Protected and enhanced natural assets and functional and appropriate built environs
1.4.1: Support and promote the Narrandera Shire Council Sporting facilities, programs and services 1.7.2: Support the management and provision of cultural services and facilities 3.4.1: Prepare and implement Master Plans and Plans of Management for key areas 3.4.2: Ensure adequate open space and recreation needs of the community are met.
The AMP sets out principles for managing and operating
the parks facilities infrastructure to meet these objectives.
2.3 Plan Framework
Key elements of the plan are
• Levels of service – specifies the services and levels of service to be provided by council.
• Future demand – how this will impact on future service delivery and how this is to be met.
• Life cycle management – how the organisation will manage its existing and future assets to provide the required services
• Financial summary – what funds are required to provide the required services. • Asset management practices
• Monitoring – how the plan will be monitored to ensure it is meeting the organisation’s objectives.
• Asset management improvement plan
2.4 Core and Advanced Asset Management
This asset management plan is prepared as a first cut ‘core’ asset management plan in accordance with the International Infrastructure Management Manual2. It is prepared to meet minimum legislative and organisational requirements for sustainable service delivery and long term financial planning and reporting. Core asset management is a ‘top down’ approach where analysis is applied at the ‘system’ or ‘network’ level.
2.5 Community Consultation
This ‘core’ asset management plan is prepared to facilitate community consultation initially through feedback on public display of draft asset management plans prior to adoption by Council. Future revisions of the asset management plan will incorporate community consultation on service levels and costs of providing the service. This will assist Council and the community in matching the level of service needed by the community, service risks and consequences with the community’s ability to pay for the service.
2 IPWEA, 2006.
- 4 -
NARRANDERA SHIRE COUNCIL –PARKS FACILITIES ASSET MANAGEMENT PLAN – VERSION 1.02, 8 June 2012
3. LEVELS OF SERVICE
3.1 Customer Research and Expectations
Council has not carried out any research on customer expectations. This will be investigated for future updates of the asset management plan.
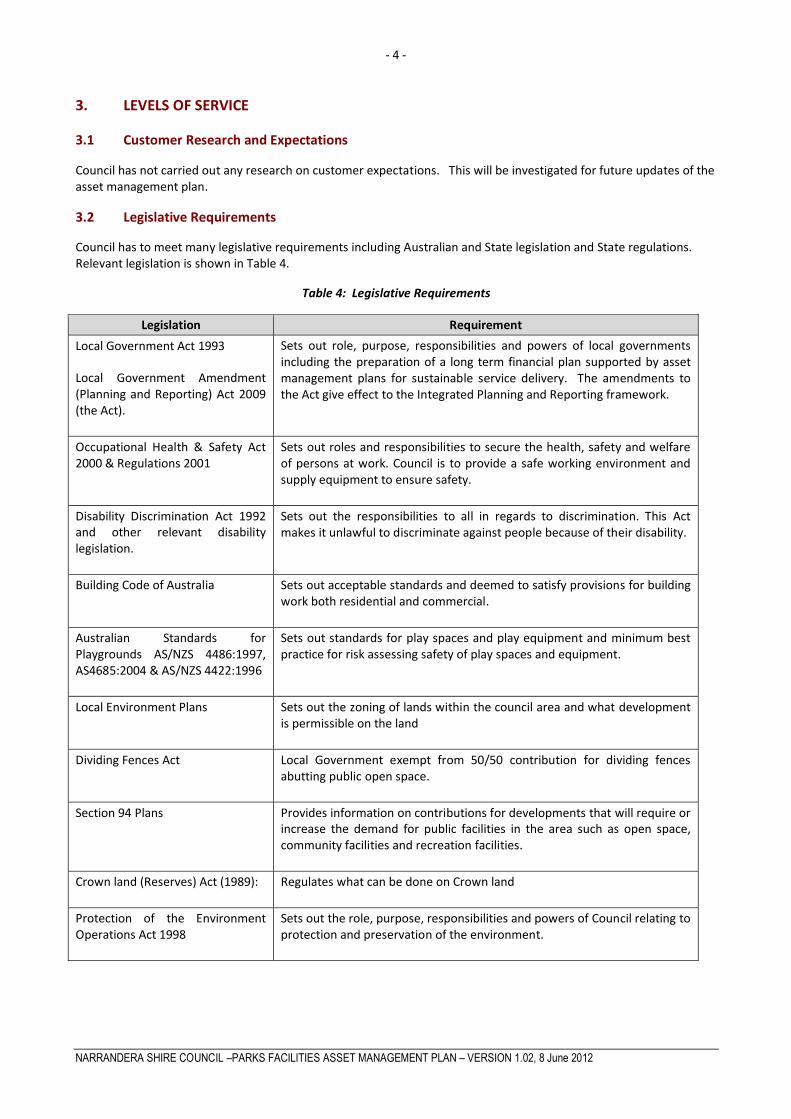
3.2 Legislative Requirements
Council has to meet many legislative requirements including Australian and State legislation and State regulations. Relevant legislation is shown in Table 4.
Table 4: Legislative Requirements
Legislation Requirement
Local Government Act 1993
Local Government Amendment (Planning and Reporting) Act 2009 (the Act).
Sets out role, purpose, responsibilities and powers of local governments including the preparation of a long term financial plan supported by asset management plans for sustainable service delivery. The amendments to the Act give effect to the Integrated Planning and Reporting framework.
Occupational Health & Safety Act 2000 & Regulations 2001
Sets out roles and responsibilities to secure the health, safety and welfare of persons at work. Council is to provide a safe working environment and supply equipment to ensure safety.
Disability Discrimination Act 1992 and other relevant disability legislation.
Sets out the responsibilities to all in regards to discrimination. This Act makes it unlawful to discriminate against people because of their disability.
Building Code of Australia Sets out acceptable standards and deemed to satisfy provisions for building work both residential and commercial.
Australian Standards for Playgrounds AS/NZS 4486:1997, AS4685:2004 & AS/NZS 4422:1996
Sets out standards for play spaces and play equipment and minimum best practice for risk assessing safety of play spaces and equipment.
Local Environment Plans Sets out the zoning of lands within the council area and what development is permissible on the land
Dividing Fences Act Local Government exempt from 50/50 contribution for dividing fences abutting public open space.
Section 94 Plans Provides information on contributions for developments that will require or increase the demand for public facilities in the area such as open space, community facilities and recreation facilities.
Crown land (Reserves) Act (1989):
Regulates what can be done on Crown land
Protection of the Environment Operations Act 1998
Sets out the role, purpose, responsibilities and powers of Council relating to protection and preservation of the environment.

- 5 -
NARRANDERA SHIRE COUNCIL –PARKS FACILITIES ASSET MANAGEMENT PLAN – VERSION 1.02, 8 June 2012
3.3 Current Levels of Service
Council has defined service levels in two terms.
Community Levels of Service relate to the service outcomes that the community wants in terms of safety, quality, quantity, reliability, responsiveness, cost effectiveness and legislative compliance.
Community levels of service measures used in the asset management plan are:
Quality How good is the service? Function Does it meet users’ needs? Safety Is the service safe?
Technical Levels of Service - Supporting the community service levels are operational or technical measures of performance. These technical measures relate to the allocation of resources to service activities that the council undertakes to best achieve the desired community outcomes.
Technical service measures are linked to annual budgets covering:
• Operations – the regular activities to provide services such as opening hours, cleansing frequency, mowing frequency, etc.
• Maintenance – the activities necessary to retain an assets as near as practicable to its original condition (eg road patching, unsealed road grading, building and structure repairs),
• Renewal – the activities that return the service capability of an asset up to that which it had originally (eg frequency and cost of road resurfacing and pavement reconstruction, pipeline replacement and building component replacement),
• Upgrade – the activities to provide an higher level of service (eg widening a road, sealing an unsealed road, replacing a pipeline with a larger size) or a new service that did not exist previously (eg a new library).
Council’s current service levels are detailed in Table 5.
Table 5: Current Service Levels
Playgrounds
Key Performance
Measure
Level of Service Performance
Measure
Process
Performance Target Current Performance
COMMUNITY LEVELS OF SERVICE
Quality Provide quality
playground
equipment that is
adventurous,
entertaining and
stimulating. Provide
green and safe open
space. Provide
shade structures to
key playgrounds.
Inspections and
Customer
Requests.
Internal
assessment and
community
feedback.
< 5 Customer
Requests per month
Meets Target

- 6 -
NARRANDERA SHIRE COUNCIL –PARKS FACILITIES ASSET MANAGEMENT PLAN – VERSION 1.02, 8 June 2012
Key Performance
Measure
Level of Service Performance
Measure
Process
Performance Target Current Performance
Function To provide a diverse
range of suitably
located playgrounds
within the region
that provides mixed
age equipment, fully
functional and
accessible which
ensure that user
requirements are
met.
Recreation and
Open Space Plan
compliance.
Complaints Consultation
100% subject to
budget
Not currently measured.
Safety To provide a safe,
clean hazard free
environment,
including shade
where appropriate.
Provide ongoing
safety inspections to
all playground
equipment on a
basis as required
Reported
accidents and
incidents
Public Liability Claims
Zero reported
incidents
Not currently measured
Sustainability Playgrounds are
managed for future
generations. Ensure
that all playground
assets are renewed
and maintained in
an environmentally
and economically
sustainable manner
Forecasting
future users for
the parks and
playgrounds
(demographics)
Forward planning to
meet future
requirements.
Not currently measured
TECHNICAL LEVELS OF SERVICE
Condition To ensure all
components are
operational
1.Playground
maintenance
program
2.Playground
replacement
program
3.Playground
inspection and
audit program
4.Reactive
maintenance
5.Customer
Requests
1.Operational
inspection
conducted internally
on 3 weekly basis
2. Replace units as required by 10 year replacement program 3.Annual compliance audit 4.100% completion of reactive maintenance task 5. 100% completion of requests within
Not currently measured

- 7 -
NARRANDERA SHIRE COUNCIL –PARKS FACILITIES ASSET MANAGEMENT PLAN – VERSION 1.02, 8 June 2012
Key Performance
Measure
Level of Service Performance
Measure
Process
Performance Target Current Performance
specified times
Accessibility Ensure playground
recreation facilities
are accessible to all
users. Ensure levels
of
Service
(land/residents for
playgrounds are
maintained in
relation to future
demand
DDA compliant
where
practicable.
Provide future
land in
accordance with
Council’s
community
outcomes.
As allowable
Compliance with
Council’s community
outcomes where
practicable
Not measured
Cost
Effectiveness
Playgrounds are
managed for future
generations and
rationalised to suit
hierarchy.
Effectively
manage with
allocated
resources
Within -/+ 5 % of
budget
Meets Targets
Safety To provide a safe
hazard free network.
All play equipment is
inspected monthly
and audited yearly
for safety
compliance to
relevant Australian
Standards.
Audits and
Inspections ,
Claims History
Monthly/yearly
Inspections, Zero
Insurance Claims
Quarterly & Annual
Inspections
Parks, Gardens and Open Space
Key
Performance
Measure
Level of Service Performance
Measure
Process
Performance Target Current Performance
COMMUNITY LEVELS OF SERVICE
Quality Provide aesthetically
pleasing and suitably
maintained grassed
areas, shrub gardens,
tree planting, park
furniture and other
assets appropriate to the
hierarchy of the
park/reserve. I.e. dry
park, playground,
Internal
assessment and
community
feedback.
< 5 Customer
Requests per month
Not measured

- 8 -
NARRANDERA SHIRE COUNCIL –PARKS FACILITIES ASSET MANAGEMENT PLAN – VERSION 1.02, 8 June 2012
Key
Performance
Measure
Level of Service Performance
Measure
Process
Performance Target Current Performance
reticulated park or
formal garden.
Function To provide an area for
rest, relaxation play,
enjoyment and exercise
which is fitted with
appropriate facilities and
equipment.
Survey and
Recreation and
Open Space Plan
compliance.
100% subject to
budget
Not currently measured
Safety Provide To provide a
safe hazard free
environment.
Reported
accidents and
incidents
< 5 / month Meets Target
Sustainability Parks are managed for
future generations. Use
of low maintenance
drought tolerant native
plant species and
gardens. Use ESD
principles for all park
assets
Forecasting
future users’
needs
Forward planning to
meet future
requirements.
Not currently measured
TECHNICAL LEVELS OF SERVICE
Condition Maintenance type,
frequency and extent
appropriate to
classification of
park/reserve. Parks to
be maintained to ensure
safety of users and be
aesthetically pleasing to
users.
Customer
Requests,
inspections,
maintenance
programs and
audits,
community
feedback.
< 5 Customer
Requests per month
Not currently measured
Accessibility A wide range of parks
and reserves is
conveniently available
and accessible to the
community.
DDA compliant
where
practicable
Provide future
land in
accordance with
Council’s
community
outcomes
Compliance with
Council’s community
outcomes where
practicable
Not measured
Deficiencies exist in some
areas with amount of land
developed for recreational
use being below target
values.
Cost
Effectiveness
Parks are managed for
future generations and
rationalised due to
hierarchy
Effectively
manage within
allocated budget
resources
Within -/+ 5% of
budget
Meets Targets
Safety To provide a safe hazard
free network
Audits and
Inspections ,
Routine Inspections,
Zero Insurance
Quarterly & Annual
Inspections

- 9 -
NARRANDERA SHIRE COUNCIL –PARKS FACILITIES ASSET MANAGEMENT PLAN – VERSION 1.02, 8 June 2012
Key
Performance
Measure
Level of Service Performance
Measure
Process
Performance Target Current Performance
Claims History Claims
Sporting Fields
Key
Performance
Measure
Level of Service Performance Measure
Process
Performance
Target
Current Performance
COMMUNITY LEVELS OF SERVICE
Quality Sportsgrounds are provided and maintained to as higher level as possible commensurate with accepted industry standards for regional areas to ensure all sports are provided with fit for purpose quality playing surfaces and facilities appropriate to sports activity
Reduced injuries from
sporting surface
No of cancelled events
due to rain, feedback
from sporting bodies
and end users. Turf
wickets to be
maintained by suitably
trained and
experienced staff
Nil injuries due
to sporting
surface
< 1 complaints
per month
< 3
cancellations per
season due to
fields not being
in a suitable
playing
condition
Complaints not
measured.
Function Provide a safe
aesthetically attractive
and durable
sportsground facility.
Provide surfaces to as
higher level
economically possible to
reduce cancellation of
sport due to playing
surface. Provide
sufficient fields to allow
all sports to be played
Internal assessment
and sporting user group
feedback.
< 2 complaints
/month,
Operate within +
10% of budget
Complaints not
currently measured
Operates within budget
tolerance
Safety Ensure field surfaces are
inspected on a monthly
basis and are safe for
play. All structures to be
supplied and erected in
accordance with
recognised industry
standards.
No accidents, incident
reports. Resulting from
poorly maintained field
surfaces.
Nil injuries
relating to
sports playing
surface.
Not recorded
Nil inspections of fields
undertaken
Sustainability Sporting Fields are
managed and
maintained for future
Forecasting future users Ensure regular cyclic maintenance
Forward
planning to
meet future
Not currently
measured.

- 10 -
NARRANDERA SHIRE COUNCIL –PARKS FACILITIES ASSET MANAGEMENT PLAN – VERSION 1.02, 8 June 2012
Key
Performance
Measure
Level of Service Performance Measure
Process
Performance
Target
Current Performance
generations and are
primarily driven by the
needs of the end users.
works are undertaken appropriate to the type of surface and extent of use.
requirements.
TECHNICAL LEVELS OF SERVICE
Condition Playing surfaces are
maintained as
appropriate to each
sports activity.
Irrigation and lighting
infrastructure is
maintained and operates
efficiently.
Sports fields to be
marked accurately as
required. Turf surfaces
to have annual
renovation programme
with soil testing to
determine specific
management cultural
practices.
Regular turf renovation
programmes undertaken
including mechanical
aeration, fertiliser,
irrigation, weed control,
under sowing and
topdressing as required
for level usage and turf
condition. Turf wickets
to be maintained by
trained competent staff.
Reduced injuries from
sporting surface
No of cancelled events
due to rain, feedback
from sporting bodies
and end users. Turf
wickets to be
maintained by suitably
trained and
experienced staff
.
< 2 complaints
per month from
end users
Not currently
measured.
Accessibility Provide suitable range of
sporting fields accessible
to all users and areas
under cover
Duration and frequency
of open space
inaccessibility.
100% availability Not measured
Cost
Effectiveness
The Sportsgrounds are managed efficiently for the required level of service. Implement power and water saving measures where
Effectively manage
within allocated budget
resources
Reduce the cost
of the service
liability to
council by
implementing
Currently subsidise end
users to the value of
approximately 85%

- 11 -
NARRANDERA SHIRE COUNCIL –PARKS FACILITIES ASSET MANAGEMENT PLAN – VERSION 1.02, 8 June 2012
Key
Performance
Measure
Level of Service Performance Measure
Process
Performance
Target
Current Performance
practicable. strategies which
maximise
income and
control
expenditure.
Safety Provide safe suitable
facilities free from
hazards
Number of hazards
identified and
remedied. Insurance
claim history.
User feedback.
Inspections of
fields on a
monthly basis.
Not currently measured
Nil inspections
undertaken
3.4 Desired Levels of Service
At present, indications of desired levels of service are obtained from various sources including residents’ feedback to Councillors and staff, service requests and correspondence. Council has yet to quantify desired levels of service. This will be done in future revisions of this asset management plan.
4. FUTURE DEMAND
4.1 Demand Forecast
Factors affecting demand include population change, changes in demographics, seasonal factors, vehicle ownership, consumer preferences and expectations, economic factors, agricultural practices, environmental awareness, etc.
Demand factor trends and impacts on service delivery are summarised in Table 6.
Table 6: Demand Factors, Projections and Impact on Services
Demand factor Present position Projection Impact on services
Population 6256 (2009) 6132 (2029)3 Increased Assets and demand on existing assets will have a follow on impact on maintenance and renewal costs.
Increasing Costs The cost to construct, maintain and replace parks and recreation assets is increasing
Anticipated to continue Increasingly difficult to maintaining the current level of service. Equipment will need to provide greater efficiencies
Climate Change Higher frequency of extreme weather events
Unknown, but changes likely.
Addition costs may be imposed to fund environmental initiatives e.g. carbon tax.
3 Projection based on -0.1% average annual growth rate provided by the Australian Bureau of Statistic’s annual Estimated Residential Population for Local Government Areas

- 12 -
NARRANDERA SHIRE COUNCIL –PARKS FACILITIES ASSET MANAGEMENT PLAN – VERSION 1.02, 8 June 2012
4.2 Changes in Technology
Technology changes forecast to affect the delivery of services covered by this plan are detailed in Table 7.
Table 7: Changes in Technology and Forecast effect on Service Delivery
Technology Change Effect on Service Delivery
Lower energy consumption lighting and solar energy
Increased initial outlay but reduced energy consumption
Improvement to plant Greater efficiencies in grounds maintenance service delivery, reduction in maintenance time
Recycling and reuse of water and innovations in soil wetting where possible
Maintenance of sporting fields during water restrictions, climate change and drought conditions
Improvement to agricultural chemicals Better quality outcomes in the delivery of grounds maintenance service
New more durable materials for park furniture and playgrounds
Increased life cycle , reduced maintenance requirements
Alternative surfaces for playing fields where practicable such as synthetic or reduced water requirements
Reduced water requirements and decreased evaporation
Improved engineering structures, e.g. playground shade structures
Reduced risk environment for children , benefits from UV protection, increased use in hot or wet weather
Computerised irrigation control systems and use of sub surface irrigation systems
More efficient use of irrigation regimes
Increased understanding of climate change effects and required management techniques
Enhance and improve delivery of services
4.3 Demand Management Plan
Demand for new services will be managed through a combination of managing existing assets, upgrading of existing assets and providing new assets to meet demand and demand management. Demand management practices include non-asset solutions, insuring against risks and managing failures.
Non-asset solutions focus on providing the required service without the need for the council to own the assets. Examples of non-asset solutions include providing services from existing infrastructure such as aquatic centres and libraries that may be in another council area or public toilets provided in commercial premises.
Opportunities identified to date for demand management are shown in Table 8. Further opportunities will be developed in future revisions of this asset management plan.
Table 8: Demand Management Plan Summary
Service Activity Demand Management Plan
Ensure future parks and sporting field demand is provided in correct format
Review GAP analysis between the current supply of parks and the identified(required) demand i.e. Quantity of land required and spatial deficiencies

- 13 -
NARRANDERA SHIRE COUNCIL –PARKS FACILITIES ASSET MANAGEMENT PLAN – VERSION 1.02, 8 June 2012
Service Activity Demand Management Plan
Playground Rationalisation Strategy
Review of Playground compliance audit including current location of structures , condition , growth areas and opportunities for rationalisation to accommodate service changes
Increased usage of sports fields and resultant impact of higher traffic has required a focus on improving irrigation and turf management practices.
Prepare turf management /maintenance manual that determines the service required to meet the demand for active and passive reserves , specifies all annual forecasted maintenance works and outlines service standards within parks and sporting fields
4.4 New Assets for Growth
The new assets required to meet growth will be acquired free of cost from land developments and constructed/acquired by Council. The cumulative value of Council’s new contributed and constructed asset values are summarised in Figure 1.
Figure 1: New Assets for Growth
The additional new assets being created are being constructed by Council. There are no assets being generated by development and being donated to Council.
Council proposes to provide $137,000 of additional assets in each year of the ten year planning period. (Detailed in Appendix C).

- 14 -
NARRANDERA SHIRE COUNCIL –PARKS FACILITIES ASSET MANAGEMENT PLAN – VERSION 1.02, 8 June 2012
Acquiring these new assets will commit council to fund ongoing operations and maintenance costs for the period that the service provided from the assets is required. These future costs are identified and considered in developing forecasts of future operations and maintenance costs.
5. LIFECYCLE MANAGEMENT PLAN
The lifecycle management plan details how Council plans to manage and operate the assets at the agreed levels of service (defined in Section 3) while optimising life cycle costs.
5.1 Background Data
5.1.1 Physical parameters
The assets covered by this asset management plan are shown in Table 1.
The age profile of the assets include in this AM Plan is shown in Figure 2.
Figure 2: Asset Age Profile
The information basis for the parks facilities assets are:
• Financial Valuations
• Technical Inventory
• Maintenance and Renewal Plans
5.1.2 Asset capacity and performance
Council’s services are generally provided to meet design standards where these are available.

- 15 -
NARRANDERA SHIRE COUNCIL –PARKS FACILITIES ASSET MANAGEMENT PLAN – VERSION 1.02, 8 June 2012
Locations where deficiencies in service performance are known are detailed in Table 9.
Table 9: Known Service Performance Deficiencies
Location Service Deficiency
In this first Asset Management Plan detailed performance deficiencies have not been identified
In the development of next asset management plans, and in particular as these plans are developed and integrated along with the Long Term Financial Plans and Community Plans service deficiencies will be identified
5.1.3 Asset condition
The condition profile of parks facilities infrastructure assets included within this AM Plan is shown in Figure 3.
Figure 3: Current Asset Condition Profile

- 16 -
NARRANDERA SHIRE COUNCIL –PARKS FACILITIES ASSET MANAGEMENT PLAN – VERSION 1.02, 8 June 2012
Figure 4: Target Asset Condition Profile (scenario 2)
Condition is measured using a 1 – 5 rating system4 as detailed in Table 10.
Table 10: IIMM Description of Condition
Condition Rating Description
1 Excellent condition: Only planned maintenance required.
2 Very good: Minor maintenance required plus planned maintenance.
3 Good: Significant maintenance required.
4 Fair: Significant renewal/upgrade required.
5 Poor: Unserviceable.
5.1.4 Asset valuations
The value of assets recorded in Council’s asset register for the year ending 30 June 2011 covered by this asset management plan is shown below. Assets were last revalued at 30 June 2011.
Current Replacement Cost $7,164,000
Depreciable Amount $7,164,000
Depreciated Replacement Cost $2,728,000
Annual Depreciation Expense $154,000
Council’s sustainability reporting reports the rate of annual asset consumption and compares this to asset renewal and asset upgrade and expansion.
Asset Consumption Ratio5 0.47 or 47% Asset Sustainability Ratio6 1.29 or 129% Asset Renewal Funding Ratio7 1.76 or 176%
4 IIMM 2006, Appendix B, p B:1-3 (‘cyclic’ modified to ‘planned’, ‘average’ changed to ‘fair’’) 5 Depreciated Replacement Cost / Current Replacement Cost AIFMG, Section 2.6.1, p 2.10 6 Renewal or Replacement Expenditure / Depreciation AIFMG, Section 2.6.1, p 2.10 7 10 Year Renewal Expenditure / 10 Year Renewal Requirement in AMP (Scenario 2) AIFMG, Section 2.6.1, p 2.10

- 17 -
NARRANDERA SHIRE COUNCIL –PARKS FACILITIES ASSET MANAGEMENT PLAN – VERSION 1.02, 8 June 2012
To provide services in a financially sustainable manner, Council will need to ensure that it is renewing assets at the rate they are being consumed over the medium-long term and funding the life cycle costs for all new assets and services in its long term financial plan.
5.1.5 Asset hierarchy
An asset hierarchy provides a framework for structuring data in an information system to assist in collection of data, reporting information and making decisions. The hierarchy includes the asset class and component used for asset planning and financial reporting and service level hierarchy used for service planning and delivery.
Council’s service hierarchy is shown is Table 11.
Table 11: Asset Service Hierarchy
Service Hierarchy Service Level Objective
Park Facilities Provide safe and enjoyable recreational facilities for the use of the residents and visitors to Narrandera Shire.
Parks and Gardens Create an aesthetic and passive environment for the enjoyment of residents and visitors
5.2 Risk Management Plan
An assessment of risks associated with service delivery from infrastructure assets has identified critical risks that will result in loss or reduction in service from infrastructure assets or a ‘financial shock’ to the organisation. The risk assessment process identifies credible risks, the likelihood of the risk event occurring, the consequences should the event occur, develops a risk rating, evaluates the risk and develops a risk treatment plan for non-acceptable risks.
Critical risks, being those assessed as ‘Very High’ - requiring immediate corrective action and ‘High’ – requiring prioritised corrective action identified in the Infrastructure Risk Management Plan are summarised in Table 12.
Table 12: Critical Risks and Treatment Plans
Service or Asset at Risk
What can Happen Risk Rating (VH, H)
Risk Treatment Plan Associated Costs
Parks and Gardens
Maintenance
Increasing
maintenance
requirements
High Continue to improve data
Documented service level risks and
utilisation for establishing future
maintenance priorities
Staff Time
Parks and Gardens
Renewal
Assets deteriorate to
a lesser service
standard and higher
risk situation
High Continue to improve data
Required renewal of parks and
gardens assets is being achieved in
the short to medium term
Future planning improvements can
be made by further documented
service level risks and utilisation of
these in establishing future renewal
priorities
Staff Time

- 18 -
NARRANDERA SHIRE COUNCIL –PARKS FACILITIES ASSET MANAGEMENT PLAN – VERSION 1.02, 8 June 2012
Service or Asset at Risk
What can Happen Risk Rating (VH, H)
Risk Treatment Plan Associated Costs
Damage to Assets Damage to Assets due
to excessive wear,
environmental
damage or vandalism
Very
High
At present cannot be managed
within councils resourcing.
Continue to improve data
Staff Time
Playgrounds Incident or injury for the Community using facilities
High Regular renewal of softfall, prevention of usages if broken, repairs faulty or broken equipment through regular inspection and maintenance
Ongoing staff time Existing maintenance and renewal budget.
Parks and Reserves Inadvertent destruction of natural or protected assets missed by review of environmental factors. Loss of reputation, fines, loss of natural or cultural asset
High Update plans of management to include protection and preservation obligations
Ongoing staff time
5.3 Routine Maintenance Plan
Routine maintenance is the regular on-going work that is necessary to keep assets operating, including instances where portions of the asset fail and need immediate repair to make the asset operational again.
5.3.1 Maintenance plan
Maintenance includes reactive, planned and specific maintenance work activities.
Reactive maintenance is unplanned repair work carried out in response to service requests and management/supervisory directions.
Planned maintenance is repair work that is identified and managed through a maintenance management system (MMS). MMS activities include inspection, assessing the condition against failure/breakdown experience, prioritising, scheduling, actioning the work and reporting what was done to develop a maintenance history and improve maintenance and service delivery performance.
Specific maintenance is replacement of higher value components/sub-components of assets that is undertaken on a regular cycle including repainting, building roof replacement, etc. This work generally falls below the capital/maintenance threshold but may require a specific budget allocation.
Proposed maintenance expenditure is shown in Table 13.
Table 13: Maintenance Expenditure Trends
Year Maintenance Expenditure (2012 dollar values)
Proposed 2012 $143,000
Proposed 2013 $143,000
Proposed 2014 $143,000

- 19 -
NARRANDERA SHIRE COUNCIL –PARKS FACILITIES ASSET MANAGEMENT PLAN – VERSION 1.02, 8 June 2012
Current maintenance expenditure levels are considered to be adequate to meet required service levels in the absence of more detailed information. Future revision of this asset management plan will include linking required maintenance expenditures with required service levels.
Assessment and prioritisation of reactive maintenance is undertaken by operational staff using experience and judgement.
5.3.2 Standards and specifications
Maintenance work is carried out in accordance with the following Standards and Specifications.
• Local Government Act
• Australian Safety Standards for Playgrounds
• Service demand for mowing
• Council’s Safe Operating Procedures under Occupational Health and Safety
• Arboricultural standards for amenity tree pruning
• Code of Practice for electrical Safety for Vegetation Control work near Powerlines
• Sportsground maintenance as per industry standards commensurate with levels of play, soil type and availability of irrigation and lighting
5.3.3 Summary of future operations and maintenance expenditures
Future operations and maintenance expenditure is forecast to trend in line with the value of the asset stock as shown in Figure 5. Note that all costs are shown in 2012 dollar values.

- 20 -
NARRANDERA SHIRE COUNCIL –PARKS FACILITIES ASSET MANAGEMENT PLAN – VERSION 1.02, 8 June 2012
Figure 5 Projected Operations and Maintenance Expenditure
Deferred maintenance, i.e. works that are identified for maintenance and unable to be funded are to be included in the risk assessment process in the infrastructure risk management plan.
Maintenance is funded from the operating budget and grants where available. This is further discussed in Section 6.2.
5.4 Renewal/Replacement Plan
Renewal expenditure is major work which does not increase the asset’s design capacity but restores, rehabilitates, replaces or renews an existing asset to its original service potential. Work over and above restoring an asset to original service potential is upgrade/expansion or new works expenditure.
5.4.1 Renewal plan
Assets requiring renewal are identified from one of three methods provided in the ‘Expenditure Template”.
• Method 1 uses Asset Register data to project the renewal costs for renewal years using acquisition year and useful life, or
• Method 2 uses capital renewal expenditure projections from external condition modelling systems (such as Pavement Management Systems), or
• Method 3 uses a combination of average network renewals plus defect repairs in the Renewal Plan and Defect Repair Plan worksheets on the ‘Expenditure template’.
Method 1 was used for this asset management plan. It is common that the valuation registers used in Scenario 1 are
not developed to a level of maturity where they are reliable for producing a realistic renewal forecast. Ideally when
this asset register is sorted by remaining life from 1 to 10 years this should be consistent with the capital renewal
- 21 -
NARRANDERA SHIRE COUNCIL –PARKS FACILITIES ASSET MANAGEMENT PLAN – VERSION 1.02, 8 June 2012
program. For Narrandera Shire the refinement of the asset register to achieve this situation should become an
important part of the asset management improvement plan.
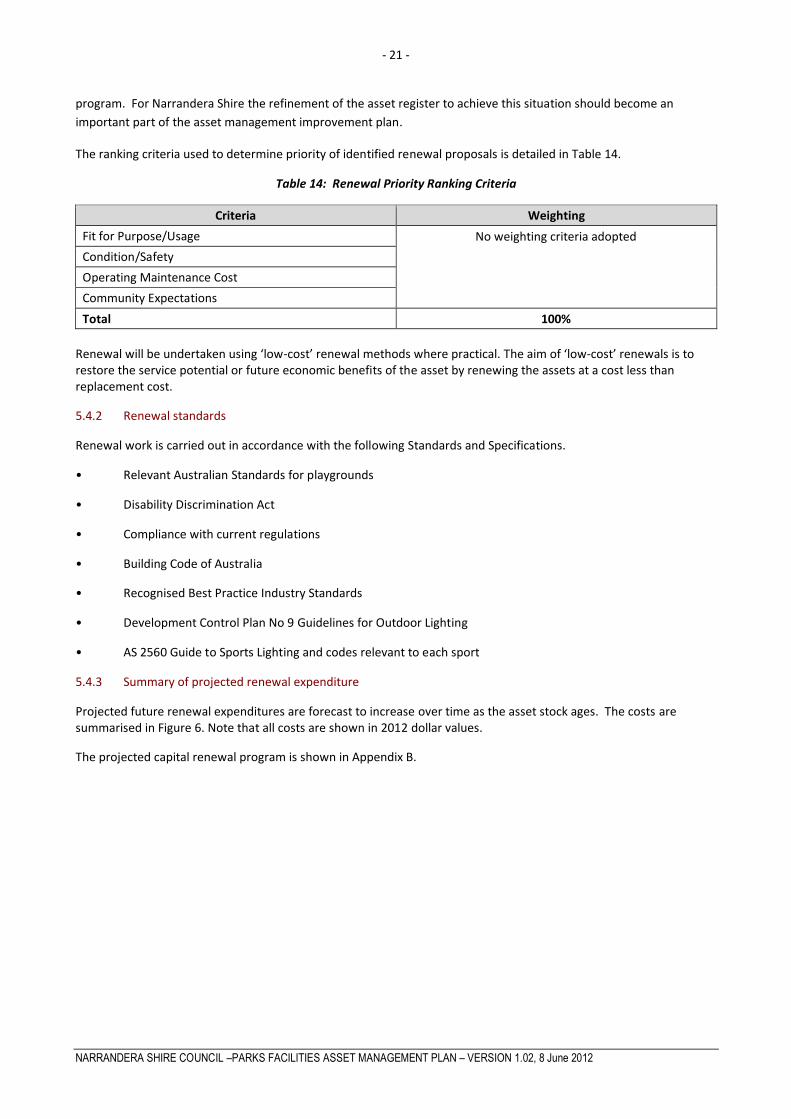
The ranking criteria used to determine priority of identified renewal proposals is detailed in Table 14.
Table 14: Renewal Priority Ranking Criteria
Criteria Weighting
Fit for Purpose/Usage No weighting criteria adopted
Condition/Safety
Operating Maintenance Cost
Community Expectations
Total 100%
Renewal will be undertaken using ‘low-cost’ renewal methods where practical. The aim of ‘low-cost’ renewals is to restore the service potential or future economic benefits of the asset by renewing the assets at a cost less than replacement cost.
5.4.2 Renewal standards
Renewal work is carried out in accordance with the following Standards and Specifications.
• Relevant Australian Standards for playgrounds
• Disability Discrimination Act
• Compliance with current regulations
• Building Code of Australia
• Recognised Best Practice Industry Standards
• Development Control Plan No 9 Guidelines for Outdoor Lighting
• AS 2560 Guide to Sports Lighting and codes relevant to each sport
5.4.3 Summary of projected renewal expenditure
Projected future renewal expenditures are forecast to increase over time as the asset stock ages. The costs are summarised in Figure 6. Note that all costs are shown in 2012 dollar values.
The projected capital renewal program is shown in Appendix B.

- 22 -
NARRANDERA SHIRE COUNCIL –PARKS FACILITIES ASSET MANAGEMENT PLAN – VERSION 1.02, 8 June 2012
Figure 6: Projected Capital Renewal Expenditure (Scenario 1 - from Asset Register)
The renewal projection (forecast) in Scenario 1 (Using the asset/valuation register) shows significant renewal expenditure needed in year 1 of the planning period which includes a significant value of unfunded renewal. Whilst the long term averages and total values from this register are sound, the shorter term renewal forecast may need review.. This indicates that further refinement of the asset register is required before it is valuable as a capital renewal planning tool. Scenario 2 and 3 shown below provides balanced scenario based on the 10 year LTFP budget figures. At this stage no individual renewal items have been identified and further development will be required in order to introduce a renewal program as a funding scenario for use in the asset management plan (Details shown in appendix B2).

- 23 -
NARRANDERA SHIRE COUNCIL –PARKS FACILITIES ASSET MANAGEMENT PLAN – VERSION 1.02, 8 June 2012
Figure 7: Projected Capital Renewal Expenditure (Scenario 2 and 3 – Balanced to LTFP – Prioritised Renewal Program (Individual renewal items not separately identified)
Scenario 2 and 3 are balanced to the LTFP budget figures for the 10 year period. This is an ideal prioritised funding scenario required for the sustainability of the asset category for the medium term. Under current funding scenario 1 from the asset register the current levels of service cannot be maintained. Further development of the actual planned renewal program will be required to reach the sustainable position demonstrated in scenarios 2 and 3.
Deferred renewal, ie those assets identified for renewal and not scheduled for renewal in capital works programs are to be included in the risk assessment process in the risk management plan.
Renewals are to be funded from capital works programs and grants where available. This is further discussed in Section 6.2.
5.5 Creation/Acquisition/Upgrade Plan
New works are those works that create a new asset that did not previously exist, or works which upgrade or improve an existing asset beyond its existing capacity. They may result from growth, social or environmental needs. Assets may also be acquired at no cost to the Council from land development. These assets from growth are considered in Section 4.4.
5.5.1 Selection criteria
New assets and upgrade/expansion of existing assets are identified from various sources such as councillor or community requests, proposals identified by strategic plans or partnerships with other organisations. Candidate proposals are inspected to verify need and to develop a preliminary estimate. Verified proposals are ranked by priority and available funds and scheduled in future works programmes. The priority ranking criteria is detailed in Table 15.

- 24 -
NARRANDERA SHIRE COUNCIL –PARKS FACILITIES ASSET MANAGEMENT PLAN – VERSION 1.02, 8 June 2012
Table 15: Upgrade/New Assets Priority Ranking Criteria
Criteria Weighting
Regulatory Change (Including environmental criteria) 60%
Community and Corporate Expectation/Anticipated
Benefits
20%
Value for Money 10%
Impact on Existing Services/Infrastructure 10%
Total 100%
5.5.2 Standards and specifications
Standards and specifications for new assets and for upgrade/expansion of existing assets are the same as those for renewal shown in Section 5.4.2.
5.5.3 Summary of projected upgrade/new assets expenditure
Projected upgrade/new asset expenditures are summarised in Figure 8. The projected upgrade/new capital works program is shown in Appendix C. All costs are shown in current 2012 dollar values.
Figure 8: Projected Capital Upgrade/New Asset Expenditure

- 25 -
NARRANDERA SHIRE COUNCIL –PARKS FACILITIES ASSET MANAGEMENT PLAN – VERSION 1.02, 8 June 2012
New assets and services are to be funded from capital works program and grants where available. This is further discussed in Section 6.2.
5.6 Disposal Plan
Disposal includes any activity associated with disposal of a decommissioned asset including sale, demolition or relocation. Assets identified for possible decommissioning and disposal are shown in Table 16, together with estimated annual savings from not having to fund operations and maintenance of the assets. These assets will be further reinvestigated to determine the required levels of service and see what options are available for alternate service delivery, if any.
Where cashflow projections from asset disposals are not available, these will be developed in future revisions of this asset management plan.
Table 16: Assets identified for Disposal
Asset Reason for Disposal Timing Net Disposal Expenditure (Expend
+ve, Revenue –ve)
Operations & Maintenance Annual
Savings
No assets identified for
disposal in this asset
management plan
6. FINANCIAL SUMMARY
This section contains the financial requirements resulting from all the information presented in the previous sections of this asset management plan. The financial projections will be improved as further information becomes available on desired levels of service and current and projected future asset performance.
6.1 Financial Statements and Projections
The financial projections are shown in Figure 9 for projected operating (operations and maintenance) and capital expenditure (renewal and upgrade/expansion/new assets), net disposal expenditure and estimated budget funding.
Note that all costs are shown in 2012 dollar values.

- 26 -
NARRANDERA SHIRE COUNCIL –PARKS FACILITIES ASSET MANAGEMENT PLAN – VERSION 1.02, 8 June 2012
Figure 9: Projected Operating and Capital Expenditure and Budget (Scenario 1 - from Asset Register)
As discussed in Section 5.3 the expenditure projection (forecast) in Scenario 1 (Using the asset/valuation register) is not consistent with the required works program or the long term financial plan, and is indicative of the continuing work required to improve the asset register.
- 27 -
NARRANDERA SHIRE COUNCIL –PARKS FACILITIES ASSET MANAGEMENT PLAN – VERSION 1.02, 8 June 2012
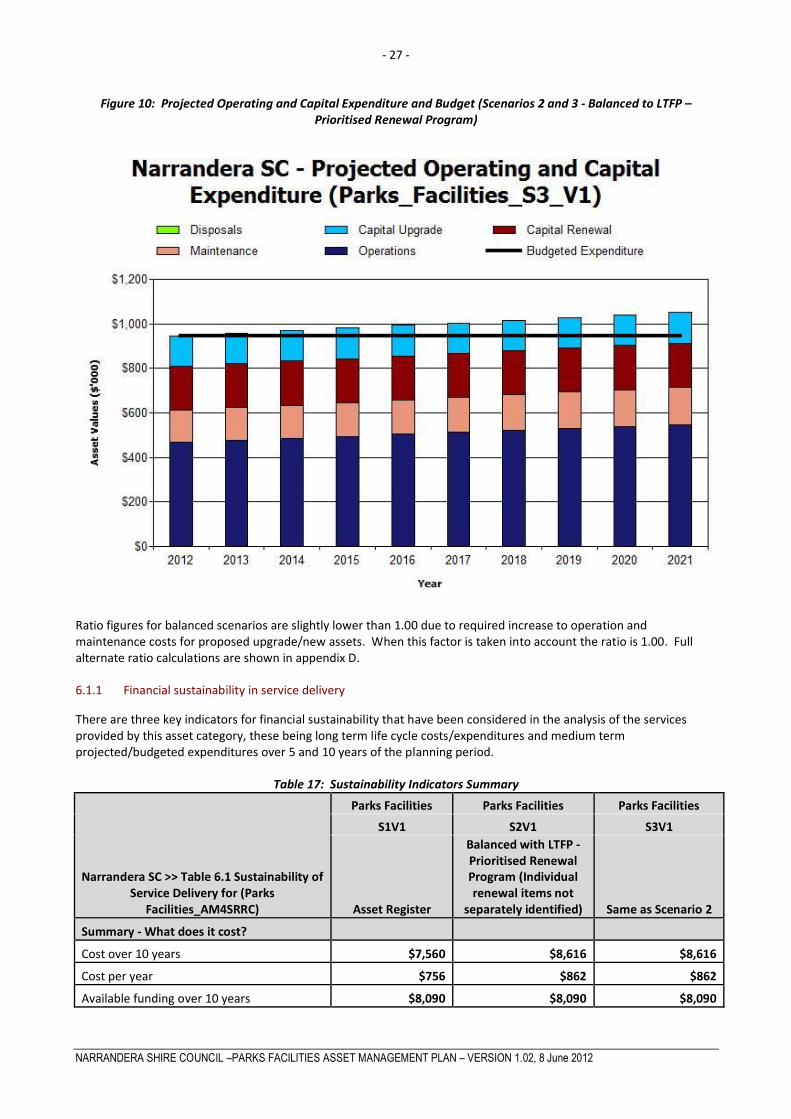
Figure 10: Projected Operating and Capital Expenditure and Budget (Scenarios 2 and 3 - Balanced to LTFP – Prioritised Renewal Program)
Ratio figures for balanced scenarios are slightly lower than 1.00 due to required increase to operation and maintenance costs for proposed upgrade/new assets. When this factor is taken into account the ratio is 1.00. Full alternate ratio calculations are shown in appendix D.
6.1.1 Financial sustainability in service delivery
There are three key indicators for financial sustainability that have been considered in the analysis of the services provided by this asset category, these being long term life cycle costs/expenditures and medium term projected/budgeted expenditures over 5 and 10 years of the planning period.
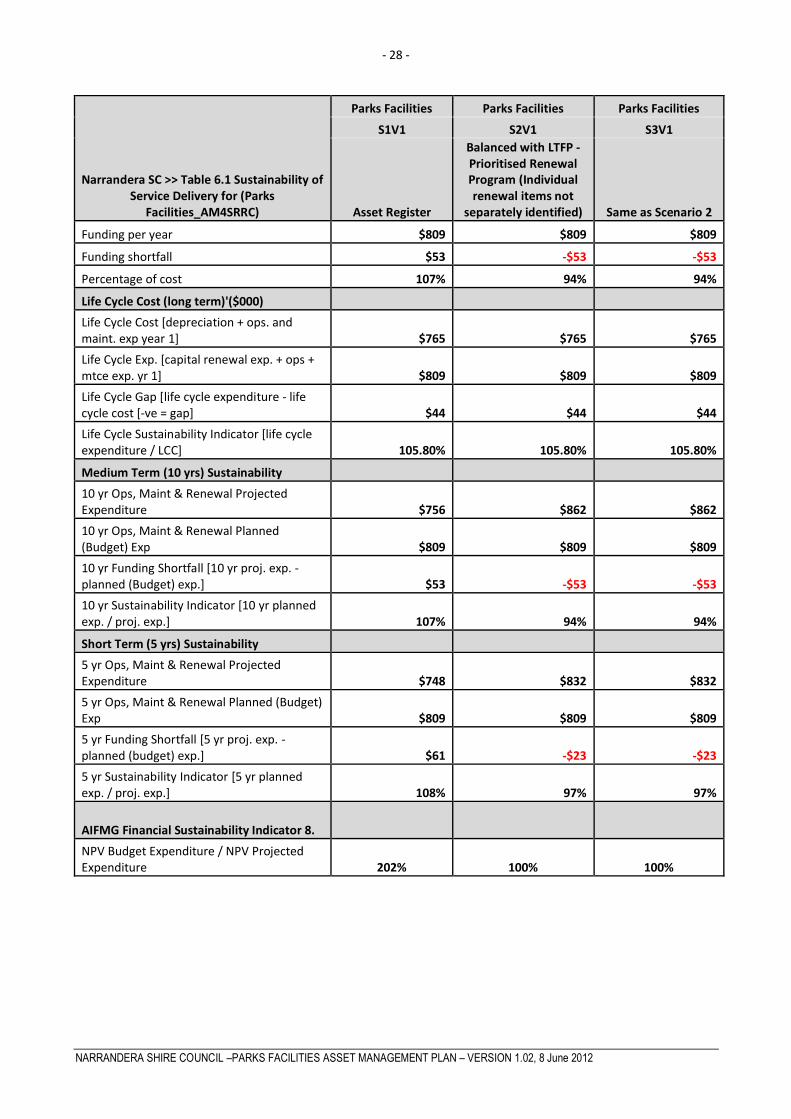
Table 17: Sustainability Indicators Summary
Narrandera SC >> Table 6.1 Sustainability of Service Delivery for (Parks
Facilities_AM4SRRC)
Parks Facilities Parks Facilities Parks Facilities
S1V1 S2V1 S3V1
Asset Register
Balanced with LTFP - Prioritised Renewal Program (Individual renewal items not
separately identified) Same as Scenario 2
Summary - What does it cost?
Cost over 10 years $7,560 $8,616 $8,616
Cost per year $756 $862 $862
Available funding over 10 years $8,090 $8,090 $8,090
- 28 -
NARRANDERA SHIRE COUNCIL –PARKS FACILITIES ASSET MANAGEMENT PLAN – VERSION 1.02, 8 June 2012
Narrandera SC >> Table 6.1 Sustainability of Service Delivery for (Parks
Facilities_AM4SRRC)
Parks Facilities Parks Facilities Parks Facilities
S1V1 S2V1 S3V1
Asset Register
Balanced with LTFP - Prioritised Renewal Program (Individual renewal items not
separately identified) Same as Scenario 2
Funding per year $809 $809 $809
Funding shortfall $53 -$53 -$53
Percentage of cost 107% 94% 94%
Life Cycle Cost (long term)'($000)
Life Cycle Cost [depreciation + ops. and maint. exp year 1] $765 $765 $765
Life Cycle Exp. [capital renewal exp. + ops + mtce exp. yr 1] $809 $809 $809
Life Cycle Gap [life cycle expenditure - life cycle cost [-ve = gap] $44 $44 $44
Life Cycle Sustainability Indicator [life cycle expenditure / LCC] 105.80% 105.80% 105.80%
Medium Term (10 yrs) Sustainability
10 yr Ops, Maint & Renewal Projected Expenditure $756 $862 $862
10 yr Ops, Maint & Renewal Planned (Budget) Exp $809 $809 $809
10 yr Funding Shortfall [10 yr proj. exp. - planned (Budget) exp.] $53 -$53 -$53
10 yr Sustainability Indicator [10 yr planned exp. / proj. exp.] 107% 94% 94%
Short Term (5 yrs) Sustainability
5 yr Ops, Maint & Renewal Projected Expenditure $748 $832 $832
5 yr Ops, Maint & Renewal Planned (Budget) Exp $809 $809 $809
5 yr Funding Shortfall [5 yr proj. exp. - planned (budget) exp.] $61 -$23 -$23
5 yr Sustainability Indicator [5 yr planned exp. / proj. exp.] 108% 97% 97%
AIFMG Financial Sustainability Indicator 8.
NPV Budget Expenditure / NPV Projected Expenditure 202% 100% 100%

- 29 -
NARRANDERA SHIRE COUNCIL –PARKS FACILITIES ASSET MANAGEMENT PLAN – VERSION 1.02, 8 June 2012
Summary of Table Above
Scenario Long Term Medium Term
Lifecycle 5 Year 10 Year
Scenario 1 Parks Facilities S1V1 Asset Register
105.80% Sustainability Ratio (Target is 100%)
108% Sustainability Ratio (Target is 100%)
107% Sustainability Ratio (Target is 100%)
Based on the comparison of current expenditures (Year 1) to the Projected (Forecast Expenditures) using depreciation as the long term renewal requirement.
Based on the comparison of current expenditures (5 years) to the Projected (Forecast Expenditures) using the renewals due from the asset register.
Based on the comparison of current expenditures (10 years) to the Projected (Forecast Expenditures) using the renewals due from the asset register.
*A second calculation using the current expenditures based on the 10 year planned (forecast) expenditures resulted in a ratio of 105.75%. This allowed for the variability between year 1 expenditures and the 10 year totals. This indicates that there is no material variation between the current expenditures and the long term average. Full alternate ratio calculations are shown in appendix D.
In isolation this ratio of >100% would indicate that renewals are being over funded. Scenarios 2 & 3 have been undertaken to validate the real position. The apparent surplus reflects that the asset register requires further development to reliably reflect the medium term position.
In isolation this ratio of >100% would indicate that renewals are being over funded. Scenarios 2 & 3 have been undertaken to validate the real position. The apparent surplus reflects that the asset register requires further development to reliably reflect the medium term position.
(*Second Calculation 112%)
(*Second Calculation 112%)
Scenario 2 Parks Facilities S2V1 Balanced to LTFP - Prioritised Renewal Program (Individual renewal items not separately identified)
105.80% Sustainability Ratio (Target is 100%)
97% Sustainability Ratio (Target is 100%)
94% Sustainability Ratio (Target is 100%)
Same calculation for Scenario 1, 2 & 3
Based on the current expenditures against the Projected (Forecast Expenditures) prioritised renewal program in line with the LTFP budget figures (individual renewal items not identified). At this time the renewal program is simply balanced to the budget figures provided, Council will be required to separately identify actual renewal program items to determine sustainability of the medium term position.
Based on the current expenditures against the Projected (Forecast Expenditures) prioritised renewal program in line with the LTFP budget figures (individual renewal items not identified). At this time the renewal program is simply balanced to the budget figures provided, Council will be required to separately identify actual renewal program items to determine sustainability of the medium term position.
(*Second Calculation 100%)
(*Second Calculation 100%)

- 30 -
NARRANDERA SHIRE COUNCIL –PARKS FACILITIES ASSET MANAGEMENT PLAN – VERSION 1.02, 8 June 2012
Scenario Long Term Medium Term
Lifecycle 5 Year 10 Year
Scenario 3 Parks Facilities S3V1 Same as Scenario 2
105.80% Sustainability Ratio (Target is 100%)
97% Sustainability Ratio (Target is 100%)
94% Sustainability Ratio (Target is 100%)
Same calculation for Scenario 1, 2 & 3
Based on the current expenditures balanced to the Projected (Forecast Expenditures) prioritised renewal requirements in line with LTFP budget figures. Same as Scenario 2.
Based on the current expenditures balanced to the Projected (Forecast Expenditures) prioritised renewal requirements in line with LTFP budget figures. Same as Scenario 2.
(*Second calculation 100%) Ratio figures for balanced scenario are slightly lower than 1.00 due to the projected required increase to operation and maintenance costs for proposed upgrade/new assets, when this factor is taken into account the ratio is 1.00. Full alternate ratio calculations are shown in appendix D.
(*Second calculation 100%) Ratio figures for balanced scenario are slightly lower than 1.00 due to the projected required increase to operation and maintenance costs for proposed upgrade/new assets, when this factor is taken into account the ratio is 1.00. Full alternate ratio calculations are shown in appendix D.
For the overall assessments used in this asset management plan (including the Executive Summary) the assessment made under Scenario 1 is used as scenario 3 is a demonstrative sustainable position and has yet to be developed by Council.
Long term - Life Cycle Cost
Life cycle costs (or whole of life costs) are the average costs that are required to sustain the service levels over the longest asset life. Life cycle costs include operations and maintenance expenditure and asset consumption (depreciation expense). The life cycle cost for the services covered in this asset management plan is $765,000 per year (operations and maintenance expenditure plus depreciation expense in year 1).
Life cycle costs can be compared to life cycle expenditure to give an indicator of sustainability in service provision. Life cycle expenditure includes operations, maintenance and capital renewal expenditure in year 1. Life cycle expenditure will vary depending on the timing of asset renewals. The life cycle expenditure at the start of the plan is $809,000 (operations and maintenance expenditure plus budgeted capital renewal expenditure in year 1).
A shortfall between life cycle cost and life cycle expenditure is the life cycle gap.
The life cycle gap for services covered by this asset management plan is +$44,000 per year (-ve = gap, +ve = surplus).
Life cycle expenditure is 105.80% of life cycle costs giving a life cycle sustainability index of 1.06.
The life cycle costs and life cycle expenditure comparison highlights any difference between present outlays and the average cost of providing the service over the long term. If the life cycle expenditure is less than that life cycle cost, it is most likely that outlays will need to be increased or cuts in services made in the future.

- 31 -
NARRANDERA SHIRE COUNCIL –PARKS FACILITIES ASSET MANAGEMENT PLAN – VERSION 1.02, 8 June 2012
Knowing the extent and timing of any required increase in outlays and the service consequences if funding is not available will assist organisations in providing services to their communities in a financially sustainable manner. This is the purpose of the asset management plans and long term financial plan.
Medium term – 10 year financial planning period
This asset management plan identifies the projected operations, maintenance and capital renewal expenditures required to provide an agreed level of service to the community over a 10 year period. This provides input into 10 year financial and funding plans aimed at providing the required services in a sustainable manner.
These projected expenditures may be compared to budgeted expenditures in the 10 year period to identify any funding shortfall. In a core asset management plan, a gap is generally due to increasing asset renewals for ageing assets.
The projected operations, maintenance and capital renewal expenditure required over the 10 year planning period is $765,000 per year (for scenario 1).
Estimated (budget) operations, maintenance and capital renewal funding is $809,00 per year giving a 10 year funding surplus of $53,000 per year and a 10 year sustainability indicator of 1.07. This indicates that Council has 107% of the projected expenditures needed to provide the services documented in the asset management plan.
Medium Term – 5 year financial planning period
The projected operations, maintenance and capital renewal expenditure required over the first 5 years of the planning period is $748,000 per year (for scenario 1).
Estimated (budget) operations, maintenance and capital renewal funding is $809,000 per year giving a 5 year funding surplus of $61,000. This is 108% of projected expenditures giving a 5 year sustainability indicator of 1.08.
Financial Sustainability Indicators
Figure 11 shows the financial sustainability indicators over the 10 year planning period and for the long term life cycle.

- 32 -
NARRANDERA SHIRE COUNCIL –PARKS FACILITIES ASSET MANAGEMENT PLAN – VERSION 1.02, 8 June 2012
Figure 11: Financial Sustainability Indicators (Scenario 1 – From Asset Register)
Providing services from infrastructure in a sustainable manner requires the matching and managing of service levels, risks, projected expenditures and funding to achieve a financial sustainability indicator of 1.0 for the first years of the asset management plan and ideally over the 10 year life of the AM Plan.
Figure 8 shows the projected asset renewals in the 10 year planning period from Appendix B. The projected asset renewals are compared to budgeted renewal expenditure in the capital works program and capital renewal expenditure in year 1 of the planning period in Figure 12.

- 33 -
NARRANDERA SHIRE COUNCIL –PARKS FACILITIES ASSET MANAGEMENT PLAN – VERSION 1.02, 8 June 2012
Figure 122: Projected and Budgeted Renewal Expenditure (Scenario 1 - from Asset Register)
Table 18.S1 shows the shortfall between projected and budgeted renewals for Scenario 1.
Table 18.S1: Projected and Budgeted Renewals and Expenditure Shortfall (Scenario 1 - from Asset Register) Narrandera SC >> Asset Management Plan Table 6.1.1 (Parks_Facilities_S1_V1)
Year End Projected Planned Renewal Funding Cumulative
Jun-30 Renewal Renewal Difference Difference
($'000) Budget (- ve = Gap) Difference
($'000) ($'000) (- ve = Gap
($'000)
2012 $347.17 $198.00 -$149.17 -$149.17
2013 $4.43 $198.00 $193.57 $44.40
2014 $130.54 $198.00 $67.46 $111.86
2015 $79.86 $198.00 $118.14 $230.00
2016 $7.82 $198.00 $190.18 $420.18
2017 $260.10 $198.00 -$62.10 $358.08
2018 $39.54 $198.00 $158.46 $516.54
2019 $161.02 $198.00 $36.98 $553.52
2020 $83.26 $198.00 $114.74 $668.26
2021 $8.81 $198.00 $189.19 $857.46
Note: An negative shortfall indicates a funding gap, a positive shortfall indicates a surplus for that year.

- 34 -
NARRANDERA SHIRE COUNCIL –PARKS FACILITIES ASSET MANAGEMENT PLAN – VERSION 1.02, 8 June 2012
Figure 133: Projected and Budgeted Renewal Expenditure (Scenario 2 and 3 – Balanced to LTFP – Prioritised Renewal Program)
Table 19.S2 shows the shortfall between projected and budgeted renewals for Scenario 2.
Table 19 .S2: Projected and Budgeted Renewals and Expenditure Shortfall (Scenario 2 and 3 – Balanced to LTFP – Prioritised Renewal Program)
Narrandera SC >> Asset Management Plan Table 6.1.1 (Parks_Facilities_S3_V1)
Year End Projected Planned Renewal Funding Cumulative
Jun-30 Renewal Renewal Difference Difference
($'000) Budget (- ve = Gap) Difference ($'000) ($'000) (- ve = Gap
($'000) 2012 $198.00 $198.00 $0.00 $0.00
2013 $198.00 $198.00 $0.00 $0.00
2014 $198.00 $198.00 $0.00 $0.00 2015 $198.00 $198.00 $0.00 $0.00
2016 $198.00 $198.00 $0.00 $0.00
2017 $198.00 $198.00 $0.00 $0.00 2018 $198.00 $198.00 $0.00 $0.00
2019 $198.00 $198.00 $0.00 $0.00
2020 $198.00 $198.00 $0.00 $0.00
2021 $198.00 $198.00 $0.00 $0.00
Note: An negative shortfall indicates a funding gap, a positive shortfall indicates a surplus for that year.

- 35 -
NARRANDERA SHIRE COUNCIL –PARKS FACILITIES ASSET MANAGEMENT PLAN – VERSION 1.02, 8 June 2012
Providing services in a sustainable manner will require matching of projected asset renewals to meet agreed service levels with planned capital works programs and available revenue.
A gap between projected asset renewals, planned asset renewals and funding indicates that further work is required to manage required service levels and funding to eliminate any funding gap.
We will manage the ‘gap’ by developing this asset management plan to provide guidance on future service levels and resources required to provide these services, and review future services, service levels and costs with the community.
6.1.2 Expenditure projections for long term financial plan
Table 20 shows the projected expenditures for the 10 year long term financial plan.
Expenditure projections are in current (non-inflated) values. Disposals are shown as net expenditures (revenues are negative).
Table 20: Expenditure Projections for Long Term Financial Plan ($000) (Scenario 3 – Balanced to LTFP – Prioritised Renewal Program)
Narrandera SC >> Planned Expenditures for Long Term Financial Plan (Parks_Facilities_S3_V1)
Year End Total Total Projected Planned Net
Disposals
Jun-30 Operations Maintenance Capital Capital ($'000)
Expenditure ($'000) Renewal Upgrade/New
($'000) ($'000) ($'000)
2012 $468.00 $143.00 $198.00 $137.00 $0.00
2013 $476.95 $145.73 $198.00 $137.00 $0.00
2014 $485.90 $148.47 $198.00 $137.00 $0.00
2015 $494.85 $151.20 $198.00 $137.00 $0.00
2016 $503.80 $153.94 $198.00 $137.00 $0.00
2017 $512.75 $156.67 $198.00 $137.00 $0.00
2018 $521.70 $159.41 $198.00 $137.00 $0.00
2019 $530.65 $162.14 $198.00 $137.00 $0.00
2020 $539.60 $164.88 $198.00 $137.00 $0.00
2021 $548.55 $167.61 $198.00 $137.00 $0.00
Note: All projected expenditures are in 2012 values
6.2 Funding Strategy
Projected expenditure identified in Section 6.1 is to be funded from future operating and capital budgets. The funding strategy is detailed in the organisation’s 10 year long term financial plan.
6.3 Valuation Forecasts
Asset values are forecast to increase as additional assets are added to the asset stock from construction and acquisition by Council and from assets constructed by land developers and others and donated to Council. Figure 14 shows the projected replacement cost asset values over the planning period in 2012 dollar values.

- 36 -
NARRANDERA SHIRE COUNCIL –PARKS FACILITIES ASSET MANAGEMENT PLAN – VERSION 1.02, 8 June 2012
Figure 14: Projected Asset Values
Depreciation expense values are forecast in line with asset values as shown in Figure 15.

- 37 -
NARRANDERA SHIRE COUNCIL –PARKS FACILITIES ASSET MANAGEMENT PLAN – VERSION 1.02, 8 June 2012
Figure 155: Projected Depreciation Expense
The depreciated replacement cost (current replacement cost less accumulated depreciation) will vary over the forecast period depending on the rates of addition of new assets, disposal of old assets and consumption and renewal of existing assets. Forecast of the assets’ depreciated replacement cost is shown in Figure 16. The effect of contributed and new assets on the depreciated replacement cost is shown in the light colour bar.

- 38 -
NARRANDERA SHIRE COUNCIL –PARKS FACILITIES ASSET MANAGEMENT PLAN – VERSION 1.02, 8 June 2012
Figure 16: Projected Depreciated Replacement Cost
6.4 Key Assumptions made in Financial Forecasts
This section details the key assumptions made in presenting the information contained in this asset management plan and in preparing forecasts of required operating and capital expenditure and asset values, depreciation expense and carrying amount estimates. It is presented to enable readers to gain an understanding of the levels of confidence in the data behind the financial forecasts.
Key assumptions made in this asset management plan are:
• That parks and recreation assets will remain in Council’s ownership throughout the planning period and that
levels of service remain unchanged;
• Required maintenance is assumed to take place in accordance with relevant codes and standards.
• Natural disasters (such as flood), vandalism and other unplanned events are not considered in the asset
lifecycles.
• That parks and recreation assets will be replaced at the end of their useful life;
• Parks and recreation assets are assumed to reach their allocated design lives even though degradation will
vary according to location, prevailing weather and usage.
• All upgrade and renewal expenditure is stated in 2012 dollar values;

- 39 -
NARRANDERA SHIRE COUNCIL –PARKS FACILITIES ASSET MANAGEMENT PLAN – VERSION 1.02, 8 June 2012
• Information within the asset register is based on current knowledge only;
• Maintenance and operations allocations are largely based on maintaining current service levels, expenditure
is stated in 2012 dollar values;
• The depreciation has been calculated on a straight-line basis
Accuracy of future financial forecasts may be improved in future revisions of this asset management plan by the following actions.
• Full Implementation of a single Asset Register
• Maintaining the Asset Register
• Reviewing useful lives for assets in conjunction with developing suitable hierarchies within the asset categories.
• Higher detail and definition in relation to the current expenditures by type e.g. operating, maintenance, renewal, upgrade/new
.7. ASSET MANAGEMENT PRACTICES
7. ASSET MANAGEMENT PRACTICES
7.1 Accounting/Financial Systems
7.1.1 Accounting and financial systems
Civica Accounting System
7.1.2 Accountabilities for financial systems
Director Corporate Services
7.1.3 Accounting standards and regulations
AASB116
Local Government Act as Amended for IPR.
7.1.4 Capital/maintenance threshold
See asset accounting policy
7.1.5 Required changes to accounting financial systems arising from this AM Plan
All asset registers currently in XL will be migrated to e-lifecycle
7.2 Asset Management Systems
e-lifecycle Asset Management System provides predictive and asset management modelling for the ongoing update of the asset management plans and strategy. Finmod provides the modelling for water and sewer debt and charges that are needed to ensure self-funding water and sewer systems. The transition to new financial management systems and respective roles of GIS, Financial System, asset financial and component registers needs to be guided by a knowledge management strategy.

- 40 -
NARRANDERA SHIRE COUNCIL –PARKS FACILITIES ASSET MANAGEMENT PLAN – VERSION 1.02, 8 June 2012
7.2.2 Asset registers
All asset registers currently in XL will be migrated to e-lifecycle
7.2.3 Linkage from asset management to financial system
Quarterly update of capital transactions from asset management to financial system to keep e-lifecycle asset register up to date for: condition, remaining life, useful life, values. Synchronisation of financial system and e-lifecycle asset register when a revaluation occurs. Annual balancing of end of year note 9a reporting.
7.2.4 Accountabilities for asset management system and data
Design and Asset Manager
7.2.5 Required changes to asset management system arising from this AM Plan
Implementation of e-lifecycle and update of asset register as per table 22 in section 8.2.
7.3 Information Flow Requirements and Processes
The key information flows into this asset management plan are:
• Council strategic and operational plans,
• Service requests from the community,
• Network assets information,
• The unit rates for categories of work/materials,
• Current levels of service, expenditures, service deficiencies and service risks,
• Projections of various factors affecting future demand for services and new assets acquired by Council,
• Future capital works programs,
• Financial asset values.
The key information flows from this asset management plan are:
• The projected Works Program and trends,
• The resulting budget and long term financial plan expenditure projections,
• Financial sustainability indicators.
These will impact the Long Term Financial Plan, Strategic Longer-Term Plan, annual budget and departmental business plans and budgets.
7.4 Standards and Guidelines
Standards, guidelines and policy documents referenced in this asset management plan are:
• Local Government Act (NSW) 1993
• Local Government Amendment (Planning and Reporting) Act 2009
• Local Government (Finance Plans and Reporting) Regulation 2010
• AASB116

- 41 -
NARRANDERA SHIRE COUNCIL –PARKS FACILITIES ASSET MANAGEMENT PLAN – VERSION 1.02, 8 June 2012
8. PLAN IMPROVEMENT AND MONITORING
8.1 Performance Measures
The effectiveness of the asset management plan can be measured in the following ways:
• The degree to which the required cashflows identified in this asset management plan are incorporated into the organisation’s long term financial plan and Community/Strategic Planning processes and documents,
• The degree to which 1-5 year detailed works programs, budgets, business plans and organisational structures take into account the ‘global’ works program trends provided by the asset management plan;
8.2 Improvement Plan
The asset management improvement plan generated from this asset management plan is shown in Table 21.
Table 21 Section 8.2: Improvement Plan
Task No
Task Responsibility Resources Required
Timeline
1 Continue the development of the corporate asset register, in which financial calculations including calculation of annual depreciation are undertaken by council.
Corporate (Technical & Financial)
Staff Time December 2012
2 Develop the forward capital renewal programme under scenarios 2 (optimal renewal program) and 3 (prioritised renewal program in line with LTFP budget figures) and develop strategy for acquiring condition data for use in the condition reporting tables (figures 3 and 4)
Corporate Staff Time June 2013
3 Continue to Improve project cost accounting to record costs against the asset component and develop valuation unit rates
Corporate (Technical & Financial)
Staff Time December 2012
4 Review and update the service level in section 3.3 to enable annual state of the assets reporting on condition, function and utilisation
Technical Staff Time December 2012
5 Review methodology for determining remaining life, with detail assessment for assets requiring renewal in the medium term (next 10-20 years)
Corporate (Technical & Financial)
Staff Time June 2013
6 Continue to review the procedures for maintaining the Asset and Financial Registers
Corporate (Technical & Financial)
Staff Time Ongoing
7 Carry out an asset management maturity audit to ensure compliance with the national asset management framework and IPR guidelines.
Corporate (Technical & Financial)
LGRF funded Annual

- 42 -
NARRANDERA SHIRE COUNCIL –PARKS FACILITIES ASSET MANAGEMENT PLAN – VERSION 1.02, 8 June 2012
8.3 Monitoring and Review Procedures
This asset management plan will be reviewed during annual budget preparation and amended to recognise any material changes in service levels and/or resources available to provide those services as a result of the budget decision process.
The Plan has a life of 4 years and is due for revision and updating within 12 months of each Council election.
REFERENCES
DVC, 2006, Asset Investment Guidelines, Glossary, Department for Victorian Communities, Local Government Victoria, Melbourne, http://www.dpcd.vic.gov.au/localgovernment/publications-and-research/asset-management-and-financial.
IPWEA, 2006, International Infrastructure Management Manual, Institute of Public Works Engineering Australia,
Sydney, www.ipwea.org.au.
IPWEA, 2008, NAMS.PLUS Asset Management Institute of Public Works Engineering Australia, Sydney,
www.ipwea.org.au/namsplus.
IPWEA, 2009, Australian Infrastructure Financial Management Guidelines, Institute of Public Works Engineering
Australia, Sydney, www.ipwea.org.au/AIFMG.
IPWEA, 2011, Asset Management for Small, Rural or Remote Communities Practice Note, Institute of Public Works
Engineering Australia, Sydney, www.ipwea.org.au/AM4SRRC.
Narrandera Shire Council Adopted Asset Management Plan 2011-2016 Narrandera Shire Council Annual Report 2010/11

- 43 -
NARRANDERA SHIRE COUNCIL –PARKS FACILITIES ASSET MANAGEMENT PLAN – VERSION 1.02, 8 June 2012
APPENDICES
Appendix A Planned Expenditures (From Long Term Financial Plan) 45
Appendix B1 Projected 10 year Capital Renewal Works Program (Scenario 1 – From Asset Register) 46
Appendix B2 Projected 10 year Capital Renewal Works Program (Scenario 2 and 3 – Balanced to LTFP (Individual renewal items not separately identified – Demonstrative only, not developed or adopted by Council)) 52
Appendix C1 Planned Upgrade/Exp/New 10 year Capital Works Program (Scenario 1 – From Asset Register) 56
Appendix D Alternate Ratio Calculations 60
Appendix E Abbreviations 61
Appendix F Glossary 62

- 44 -
NARRANDERA SHIRE COUNCIL –PARKS FACILITIES ASSET MANAGEMENT PLAN – VERSION 1.02, 8 June 2012
Appendix A Planned Expenditures (From Long Term Financial Plan)

- 45 -
NARRANDERA SHIRE COUNCIL –PARKS FACILITIES ASSET MANAGEMENT PLAN – VERSION 1.02, 8 June 2012
Appendix B1 Projected 10 year Capital Renewal Works Program (Scenario 1 – From Asset Register)
Narrandera SC >> Renewal Program (Parks_Facilities_S1_V1)
Asset ID
Sub
Asset Name From To
Rem Planned Renewal Useful
Category Life Renewal Cost Life
(Years) Year ($) (Years)
OSG16509 Other Structures
ACCESS ROAD - GRONG GRONG CEMETERY
-12 2000 $2,000.00 20
OSG16527 Other Structures
CARPARK - BARELLAN SPORTSGROUND
-12 2000 $7,000.00 20
OSG14018 Other Structures
FENCING - GRONG GRONG CEMETERY
-12 2000 $3,000.00 100
OSG14017 Other Structures
FENCING BOUNDARY - BARELLAN CEMETERY
-12 2000 $3,000.00 100
OSG16529 Other Structures
PERIMETER ROAD - BARELLAN
SPORTSGROUND
-12 2000 $20,000.00 20
OSG14069 Other Structures
TABLES & SEATS - NARRANDERA PARK
-12 2000 $1,500.00 20
OSG14071 Other Structures
TABLES & SEATS - NARRANDERA PARK
-12 2000 $3,600.00 20
OSG16530 Other Structures
WATERING SYSTEM - BREWERY FLAT OVAL
-12 2000 $6,500.00 30
Subtotal $46,600.00
OSG14035 Other Structures
RAMPAGE SLIDE BOARDS - LAKE TALBOT
-10 2002 $1,500.00 5
OSG16544 Other Structures
ROAD - CAR PARK/WILLOW AVE
CARAVAN PARK
-10 2002 $2,176.00 30
OSG16541 Other Structures
ROAD - L TALBOT CARAVAN PARK INNER
CIRC.
-10 2002 $2,856.00 30
OSG16543 Other Structures
ROAD - PINE AVENUE, CARAVAN PARK
-10 2002 $102.00 30
OSG16542 Other Structures
ROAD - WATTLE AVENUE CARAVAN PARK
-10 2002 $255.00 30
OSG14096 Other Structures
SOUTH AFRICAN WAR MONUMENT
-10 2002 $15,000.00 100
Subtotal $21,889.00
OSG8010 Other Structures
FERNERY -8 2004 $0.00 7
OSG8009 Other Structures
POT PLANT STAND -8 2004 $0.00 7
Subtotal $0.00
OSG16507 Other Structures
ACCESS ROAD/CAR PARK - BARELLAN CEMETERY
-7 2005 $6,000.00 20
OSG14070 Other Structures
BENCHES - NARRANDERA PARK
-7 2005 $1,500.00 20
OSG14106 Other Structures
COVERED TABLE & CHAIR - GRONG GRONG
-7 2005 $1,100.00 25

- 46 -
NARRANDERA SHIRE COUNCIL –PARKS FACILITIES ASSET MANAGEMENT PLAN – VERSION 1.02, 8 June 2012
Narrandera SC >> Renewal Program (Parks_Facilities_S1_V1)
Asset ID
Sub
Asset Name From To
Rem Planned Renewal Useful
Category Life Renewal Cost Life
(Years) Year ($) (Years)
PARK
OSG14098 Other Structures
FLAG POLES - MEMORIAL GARDENS
-7 2005 $400.00 25
OSG16505 Other Structures
IRRIGATION SYSTEM - BARELLAN CEMETERY
-7 2005 $7,887.75 20
OSG14110 Other Structures
PICNIC TABLES - EVONNE GOOLAGONG PARK
-7 2005 $2,992.00 25
OSG16533 Other Structures
SLIDE - SHADY ST PARK -7 2005 $1,250.00 25
OSG16534 Other Structures
SWING - SHADY ST PARK -7 2005 $950.00 25
OSG14107 Other Structures
TABLE & CHAIR - GRONG GRONG PARK
-7 2005 $600.00 25
OSG14120 Other Structures
WIND INDICATOR - AERODROME
-7 2005 $5,000.00 50
Subtotal $27,679.75
OSG16562 Other Structures
FURNITURE & FITTINGS - N'DERA PARK
-5 2007 $509.50 10
OSG14046 Other Structures
PICNIC TABLES - LAKE TALBOT COMPLEX
-5 2007 $3,000.00 10
OSG14034 Other Structures
RAMPAGE SLIDE FLOATS - LAKE TALBOT
-5 2007 $6,375.00 10
OSG14045 Other Structures
SEATING - LAKE TALBOT COMPLEX
-5 2007 $2,800.00 10
OSG14043 Other Structures
SHADE STRUCTURES(2) - L TALBOT COMPLEX
-5 2007 $500.00 10
Subtotal $13,184.50
OSG16522 Other Structures
JONSEN STREET PARK - PINE LOG BARRIERS
-4 2008 $4,213.00 10
OSG14124 Other Structures
MODULAR PLAYGROUND EQUIP -
MELBOURNE ST.
-4 2008 $5,593.77 10
Subtotal $9,806.77
OSG16502 Other Structures
ACCESS ROAD - NARRANDERA
CEMETERY
-2 2010 $50,979.74 30
OSG14115 Other Structures
FIXED LOADING RAMP - SALEYARDS
-2 2010 $4,000.00 50
FFG2970 Other Structures
Freezer -2 2010 $454.55 5
OSG14012 Other Structures
RUBBISH BINS - NARRANDERA
CEMETERY
-2 2010 $1,250.00 50
OSG14027.2 Other Structures
STEPS FOR WATER SLIDE -2 2010 $1,200.00 5

- 47 -
NARRANDERA SHIRE COUNCIL –PARKS FACILITIES ASSET MANAGEMENT PLAN – VERSION 1.02, 8 June 2012
Narrandera SC >> Renewal Program (Parks_Facilities_S1_V1)
Asset ID
Sub
Asset Name From To
Rem Planned Renewal Useful
Category Life Renewal Cost Life
(Years) Year ($) (Years)
OSG14160.1 Other Structures
TILES ABOVE SCUM GUTTERS
-2 2010 $9,109.37 5
Subtotal $66,993.66
OSG14151 Other Structures
BBQ BARELLAN POOL -1 2011 $3,984.00 5
OSG14018.2 Other Structures
GRONG GRON CEMETERY
-1 2011 $1,234.25 5
OSG14160 Other Structures
LAKE TALBOT INFRASTRUCTURE
WORKS
-1 2011 $49,988.28 5
OSG14141 Other Structures
NEW BEAM NARRANDERA
CEMETERY
-1 2011 $1,604.91 5
OSG14140 Other Structures
NICHE WALL BARELLAN -1 2011 $2,218.92 5
OSG14142 Other Structures
ROW RENUMBERING AND MAPPING
-1 2011 $9,674.74 5
Subtotal $68,705.10
OSG14047 Other Structures
ELECTRIC BBQS - LAKE TALBOT COMPLEX
0 2012 $7,500.00 15
OSG19038 Other Structures
SECURITY CAMERA-MAIN ST NARRANDERA
0 2012 $84,816.08 10
Subtotal $92,316.08
OSG14143 Other Structures
PLAY STRUCTURE - BIG DIPPER - NARR PARK
1 2013 $1,477.00 10
OSG16540 Other Structures
PLAYGROUND EQUIPMENT - CARAVAN
PARK
1 2013 $2,950.00 30
Subtotal $4,427.00
OSG14161 Other Structures
ABTI SLIP TILING CONCOURSE
2 2014 $57,873.90 5
OEG2972 Other Structures
CCTV Network Upgrade 2 2014 $55,761.01 5
OSG8001 Other Structures
GARDENS & SURROUNDINGS
2 2014 $4,248.22 20
OSG16500 Other Structures
IRRIGATION - JOE BABBS PARK
2 2014 $3,413.43 10
OSG8006 Other Structures
NEW PAVING & HAND RALS H2
2 2014 $2,486.95 20
OSG14036 Other Structures
Rampage Boards 2 2014 $4,142.40 5
OEG2951 Other Structures
STREET CAMERA 2 2014 $1,600.11 10
OSG14153 Other Structures
ZOO SIGN 2 2014 $1,015.00 10

- 48 -
NARRANDERA SHIRE COUNCIL –PARKS FACILITIES ASSET MANAGEMENT PLAN – VERSION 1.02, 8 June 2012
Narrandera SC >> Renewal Program (Parks_Facilities_S1_V1)
Asset ID
Sub
Asset Name From To
Rem Planned Renewal Useful
Category Life Renewal Cost Life
(Years) Year ($) (Years)
Subtotal $130,541.02
OSG14117 Other Structures
CARPORT - RED HILL RESIDENCE
3 2015 $12,000.00 20
OSG19050 Other Structures
DOG TRAP 800 X 900 3 2015 $727.27 10
OSG14020 Other Structures
SIGNS - GRONG GRONG CEMETERY
3 2015 $500.00 20
OSG14085 Other Structures
WATER TANK - BARELLAN
SPORTSGROUND
3 2015 $10,000.00 40
OSG16528 Other Structures
WATERING SYSTEM - BARELLAN
SPORTSGROUND
3 2015 $56,633.04 40
Subtotal $79,860.31
OSG19044 Other Structures
Aerodrome Water Supply
4 2016 $2,645.07 10
OSG8007 Other Structures
EXTENSION TO FRONT SECURITY FENCE
4 2016 $2,300.21 20
OSG16501 Other Structures
IRRIGATION SYSTEM AT LAKE
4 2016 $2,870.00 10
Subtotal $7,815.28
OSG14151 Other Structures
BBQ BARELLAN POOL 5 2017 $3,984.00 5
OSG14074 Other Structures
BENCH SEATING - NARRANDERA
SPORTSGROUND
5 2017 $15,000.00 20
OSG14051 Other Structures
BENCH SEATS - BARELLAN POOL
5 2017 $400.00 20
OSG14026 Other Structures
FENCING - NARRANDERA GARBAGE DEPOT
5 2017 $7,000.00 20
OSG14024 Other Structures
FENCING - NARRANDERA GARBAGE DEPOT
5 2017 $8,164.23 20
FFG2970 Other Structures
Freezer 5 2017 $454.55 5
OSG14018.2 Other Structures
GRONG GRON CEMETERY
5 2017 $1,234.25 5
OSG14160 Other Structures
LAKE TALBOT INFRASTRUCTURE
WORKS
5 2017 $49,988.28 5
OSG14141 Other Structures
NEW BEAM NARRANDERA
CEMETERY
5 2017 $1,604.91 5
OSG14140 Other Structures
NICHE WALL BARELLAN 5 2017 $2,218.92 5
OSG8008 Other Structures
PAVING & BASE FOR GARDEN SHED
5 2017 $1,071.11 20

- 49 -
NARRANDERA SHIRE COUNCIL –PARKS FACILITIES ASSET MANAGEMENT PLAN – VERSION 1.02, 8 June 2012
Narrandera SC >> Renewal Program (Parks_Facilities_S1_V1)
Asset ID
Sub
Asset Name From To
Rem Planned Renewal Useful
Category Life Renewal Cost Life
(Years) Year ($) (Years)
OSG16526 Other Structures
PLAYING AREA - BARELLAN
SPORTSGROUND
5 2017 $40,000.00 20
OSG14031 Other Structures
RAMPAGE SLIDE - LAKE TALBOT COMPLEX
5 2017 $22,939.77 20
OSG14035 Other Structures
RAMPAGE SLIDE BOARDS - LAKE TALBOT
5 2017 $1,500.00 5
OSG16524 Other Structures
ROADS - NARRANDERA SPORTSGROUND
5 2017 $40,000.00 20
OSG14142 Other Structures
ROW RENUMBERING AND MAPPING
5 2017 $9,674.74 5
OSG14149 Other Structures
SCOREBOARD - BARELLAN
SPORTSGROUND
5 2017 $1,000.00 20
OSG14086 Other Structures
SEATING - BARELLAN SPORTSGROUND
5 2017 $4,000.00 20
OSG14025 Other Structures
SIGNS - NARRANDERA GARBAGE DEPOT
5 2017 $1,500.00 20
OSG14057 Other Structures
SLIDE - MAIN POOL BARELLAN
5 2017 $500.00 20
OSG14027.2 Other Structures
STEPS FOR WATER SLIDE 5 2017 $1,200.00 5
OEG2950 Other Structures
STREET CAMERAS 5 2017 $20,721.83 10
OSG14023 Other Structures
TANK & STAND - NARRANDERA GARBAGE
DEPOT
5 2017 $2,000.00 20
OSG14160.1 Other Structures
TILES ABOVE SCUM GUTTERS
5 2017 $9,109.37 5
OSG16523 Other Structures
TURF CRICKET WICKET - N SPORTSGROUND
5 2017 $10,000.00 20
OSG14030 Other Structures
WATERSLIDE DECK & FENCE - LAKE TALBOT
5 2017 $4,832.80 20
Subtotal $260,098.76
OSG16570 Other Structures
NARRANDERA PARK CRICKET PITCH UPGRADE
6 2018 $5,169.73 10
OSG16050 Other Structures
SPORTSGROUND CYCLE TRACK
6 2018 $18,912.88 10
OEG2950.1 Other Structures
STREET CAMERA UPGRADE
6 2018 $15,462.09 10
Subtotal $39,544.70
OSG14161 Other Structures
ABTI SLIP TILING CONCOURSE
7 2019 $57,873.90 5
OEG2972 Other Structures
CCTV Network Upgrade 7 2019 $55,761.01 5
OSG14145.1 Other Structures
FENCING - BARELLAN GARBAGE DEPOT
7 2019 $4,254.81 15

- 50 -
NARRANDERA SHIRE COUNCIL –PARKS FACILITIES ASSET MANAGEMENT PLAN – VERSION 1.02, 8 June 2012
Narrandera SC >> Renewal Program (Parks_Facilities_S1_V1)
Asset ID
Sub
Asset Name From To
Rem Planned Renewal Useful
Category Life Renewal Cost Life
(Years) Year ($) (Years)
OSG8010 Other Structures
FERNERY 7 2019 $0.00 7
OSG8002 Other Structures
FRONT PAVING & HAND RAILS H1
7 2019 $5,058.80 20
OSG16775 Other Structures
LAKE TALBOT BILLBOARD 7 2019 $3,367.08 10
OSG12097 Other Structures
Memorial Gardens Seating
7 2019 $2,000.00 10
OSG8009 Other Structures
POT PLANT STAND 7 2019 $0.00 7
OSG14036 Other Structures
Rampage Boards 7 2019 $4,142.40 5
OSG14112 Other Structures
SOFTFALL NARRANDERA PARK
7 2019 $14,272.62 10
OSG16573 Other Structures
SPORTSGROUND SURFACE UPGRADE
7 2019 $11,217.71 10
OSG8011 Other Structures
TURF & SPRINKLER EXTENSIONS
7 2019 $3,066.95 20
Subtotal $161,015.28
OSG12098 Other Structures
Airport Surveillance Upgrade
8 2020 $34,087.44 10
OSG16576 Other Structures
Bird Scaring Devices 8 2020 $6,240.00 10
OSG12099 Other Structures
Lake Talbot Boat Ramp 8 2020 $31,020.40 10
OSG16511 Other Structures
WATERING SYSTEM WHITTON STREET
RESERVE
8 2020 $11,912.32 20
Subtotal $83,260.16
OSG12100 Other Structures
Grong Grong Street Light 9 2021 $3,306.91 10
OSG16504 Other Structures
WATERING SYSTEM AUTOMATIC - N
CEMETERY
9 2021 $5,500.00 30
Subtotal $8,806.91
Program Total $1,122,544.28

- 51 -
NARRANDERA SHIRE COUNCIL –PARKS FACILITIES ASSET MANAGEMENT PLAN – VERSION 1.02, 8 June 2012
Appendix B2 Projected 10 year Capital Renewal Works Program (Scenario 2 – Prioritised Renewal Program)
Narrandera SC
Projected Capital Renewal Works Program - Parks_Facilities_S2_V1
($000)
Year Item Description Estimate
2012 Network Renewals
1 Budget - Long Term Financial Plan Estimate for Parks and Facilities $198
2
3
4
5
6
7
8
9
10
2012 Total $198
2013 Network Renewals
1 Budget - Long Term Financial Plan Estimate for Parks and Facilities $198
2
3
4
5
6
7
8
9
10
2013 Total $198
($000)
Year Item Description Estimate
2014 Network Renewals
1 Budget - Long Term Financial Plan Estimate for Parks and Facilities $198
2
3
4
5
6
7
8
9
10

- 52 -
NARRANDERA SHIRE COUNCIL –PARKS FACILITIES ASSET MANAGEMENT PLAN – VERSION 1.02, 8 June 2012
Narrandera SC
Projected Capital Renewal Works Program - Parks_Facilities_S2_V1
($000)
Year Item Description Estimate
2014 Total $198
2015 Network Renewals Estimate
1 Budget - Long Term Financial Plan Estimate for Parks and Facilities $198
2
3
4
5
6
7
8
9
10
2015 Total $198
($000)
Year Item Description Estimate
2016 Network Renewals
1 Budget - Long Term Financial Plan Estimate for Parks and Facilities $198
2
3
4
5
6
7
8
9
10
2016 Total $198
2017 Network Renewals
1 Budget - Long Term Financial Plan Estimate for Parks and Facilities $198
2
3
4
5
6
7
8
9
10

- 53 -
NARRANDERA SHIRE COUNCIL –PARKS FACILITIES ASSET MANAGEMENT PLAN – VERSION 1.02, 8 June 2012
Narrandera SC
Projected Capital Renewal Works Program - Parks_Facilities_S2_V1
($000)
Year Item Description Estimate
2017 Total $198
($000)
Year Item Description Estimate
2018 Network Renewals
1 Budget - Long Term Financial Plan Estimate for Parks and Facilities $198
2
3
4
5
6
7
8
9
10
2018 Total $198
2019 Network Renewals
1 Budget - Long Term Financial Plan Estimate for Parks and Facilities $198
2
3
4
5
6
7
8
9
10
2019 Total $198
($000)
Year Item Description Estimate
2020 Network Renewals
1 Budget - Long Term Financial Plan Estimate for Parks and Facilities $198
2
3
4
5
6
7
8
9

- 54 -
NARRANDERA SHIRE COUNCIL –PARKS FACILITIES ASSET MANAGEMENT PLAN – VERSION 1.02, 8 June 2012
Narrandera SC
Projected Capital Renewal Works Program - Parks_Facilities_S2_V1
($000)
Year Item Description Estimate
10
2020 Total $198
2021 Network Renewals
1 Budget - Long Term Financial Plan Estimate for Parks and Facilities $198
2
3
4
5
6
7
8
9
10
2021 Total $198

- 55 -
NARRANDERA SHIRE COUNCIL –PARKS FACILITIES ASSET MANAGEMENT PLAN – VERSION 1.02, 8 June 2012
Appendix C1 Planned Upgrade/Exp/New 10 year Capital Works Program (All Scenarios)
Narrandera SC
Projected Capital Upgrade/New Works Program - Parks_Facilities_S2_V1
($000)
Year Item Description Estimate
2012 1 Typical Annual Budget for Upgrade/New based on current budget for Parks and Facilities $137
2
3
4
5
6
7
8
9
10
2012 Total $137
($000)
Year Item Description Estimate
2013 1 Typical Annual Budget for Upgrade/New based on current budget for Parks and Facilities $137
2
3
4
5
6
7
8
9
10
2013 Total $137
($000)
Year Item Description Estimate
2014 1 Typical Annual Budget for Upgrade/New based on current budget for Parks and Facilities $137
2
3
4
5
6
7
8
9
10
2014 Total $137

- 56 -
NARRANDERA SHIRE COUNCIL –PARKS FACILITIES ASSET MANAGEMENT PLAN – VERSION 1.02, 8 June 2012
Narrandera SC
Projected Capital Upgrade/New Works Program - Parks_Facilities_S2_V1
($000)
Year Item Description Estimate
($000)
Year Item Description Estimate
2015 1 Typical Annual Budget for Upgrade/New based on current budget for Parks and Facilities $137
2
3
4
5
6
7
8
9
10
2015 Total $137
($000)
Year Item Description Estimate
2016 1 Typical Annual Budget for Upgrade/New based on current budget for Parks and Facilities $137
2
3
4
5
6
7
8
9
10
2016 Total $137
($000)
Year Item Description Estimate
2017 1 Typical Annual Budget for Upgrade/New based on current budget for Parks and Facilities $137
2
3
4
5
6
7
8
9

- 57 -
NARRANDERA SHIRE COUNCIL –PARKS FACILITIES ASSET MANAGEMENT PLAN – VERSION 1.02, 8 June 2012
Narrandera SC
Projected Capital Upgrade/New Works Program - Parks_Facilities_S2_V1
($000)
Year Item Description Estimate
10
2017 Total $137
($000)
Year Item Description Estimate
2018 1 Typical Annual Budget for Upgrade/New based on current budget for Parks and Facilities $137
2
3
4
5
6
7
8
9
10
2018 Total $137
($000)
Year Item Description Estimate
2019 1 Typical Annual Budget for Upgrade/New based on current budget for Parks and Facilities $137
2
3
4
5
6
7
8
9
10
2019 Total $137
($000)
Year Item Description Estimate
2020 1 Typical Annual Budget for Upgrade/New based on current budget for Parks and Facilities $137
2
3
4
5
6
7

- 58 -
NARRANDERA SHIRE COUNCIL –PARKS FACILITIES ASSET MANAGEMENT PLAN – VERSION 1.02, 8 June 2012
Narrandera SC
Projected Capital Upgrade/New Works Program - Parks_Facilities_S2_V1
($000)
Year Item Description Estimate
8
9
10
2020 Total $137
($000)
Year Item Description Estimate
2021 1 Typical Annual Budget for Upgrade/New based on current budget for Parks and Facilities $137
2
3
4
5
6
7
8
9
10
2021 Total $137

- 59 -
NARRANDERA SHIRE COUNCIL –PARKS FACILITIES ASSET MANAGEMENT PLAN – VERSION 1.02, 8 June 2012
Appendix D Alternate Ratio Calculations
Narrandera SC >> Table 6.1 Sustainability of Service Delivery
S1 S2 S3
Asset Register
Balanced with LTFP - Prioritised renewal program (Individual renewal items not separately
identified)
Same as Scenario 2
Summary - What does it cost?
Cost over 10 years $7,233 $8,090 $8,090
Cost per year $723 $809 $809
Available funding over 10 years $8,090 $8,090 $8,090
Funding per year $809 $809 $809
Funding shortfall -$86 $0 $0
Percentage of cost 112% 100% 100%
Life Cycle Cost (long term)'($000)
Life Cycle Cost [depreciation + Projected Expenditure]
$7,650 $7,650 $7,650
Life Cycle Exp. [capital renewal + Planned Expenditure]
$8,090 $8,090 $8,090
Life Cycle Gap [life cycle expenditure - life cycle cost [-ve = gap]
$440 $440 $440
Life Cycle Sustainability Indicator [life cycle expenditure / LCC]
106% 106% 106%
Medium Term (10 yrs) Sustainability
10 yr Projected Expenditure $7,233 $8,090 $8,090
10 yr Planned (Budget) Expenditure
$8,090 $8,090 $8,090
10 yr Funding Shortfall [10 yr proj. exp. - planned (Budget) exp.]
$857 $0 $0
10 yr Sustainability Indicator [10 yr planned exp. / proj. exp.]
112% 100% 100%
Short Term (5 yrs) Sustainability
5 yr Projected Expenditure $3,625 $4,045 $4,045
5 yr Planned (Budget) Expenditure $4,045 $4,045 $4,045
5 yr Funding Shortfall [5 yr proj. exp. - planned (budget) exp.]
$420 $0 $0
5 yr Sustainability Indicator [5 yr planned exp. / proj. exp.]
112% 100% 100%

- 60 -
NARRANDERA SHIRE COUNCIL –PARKS FACILITIES ASSET MANAGEMENT PLAN – VERSION 1.02, 8 June 2012
Appendix E Abbreviations
AAAC Average annual asset consumption
AMP Asset management plan
ARI Average recurrence interval
BOD Biochemical (biological) oxygen demand
CRC Current replacement cost
CWMS Community wastewater management systems
DA Depreciable amount
EF Earthworks/formation
IRMP Infrastructure risk management plan
LCC Life Cycle cost
LCE Life cycle expenditure
MMS Maintenance management system
PCI Pavement condition index
RV Residual value
SS Suspended solids
vph Vehicles per hour

- 61 -
NARRANDERA SHIRE COUNCIL –PARKS FACILITIES ASSET MANAGEMENT PLAN – VERSION 1.02, 8 June 2012
Appendix F Glossary
Annual service cost (ASC) 1) Reporting actual cost The annual (accrual) cost of providing a service
including operations, maintenance, depreciation, finance/opportunity and disposal costs less revenue.
2) For investment analysis and budgeting An estimate of the cost that would be tendered,
per annum, if tenders were called for the supply of a service to a performance specification for a fixed term. The Annual Service Cost includes operations, maintenance, depreciation, finance/ opportunity and disposal costs, less revenue.
Asset A resource controlled by an entity as a result of past events and from which future economic benefits are expected to flow to the entity. Infrastructure assets are a sub-class of property, plant and equipment which are non-current assets with a life greater than 12 months and enable services to be provided.
Asset class A group of assets having a similar nature or function in the operations of an entity, and which, for purposes of disclosure, is shown as a single item without supplementary disclosure.
Asset condition assessment The process of continuous or periodic inspection, assessment, measurement and interpretation of the resultant data to indicate the condition of a specific asset so as to determine the need for some preventative or remedial action.
Asset management (AM) The combination of management, financial, economic, engineering and other practices applied to physical assets with the objective of providing the required level of service in the most cost effective manner.
Average annual asset consumption (AAAC)* The amount of an organisation’s asset base consumed during a reporting period (generally a year). This may be calculated by dividing the depreciable amount by the useful life (or total future economic benefits/service potential) and totalled for each and every asset OR by dividing the carrying amount (depreciated replacement cost) by the remaining useful life (or remaining future economic benefits/service potential) and totalled for each and every asset in an asset category or class.
Borrowings A borrowing or loan is a contractual obligation of the borrowing entity to deliver cash or another financial asset to the lending entity over a specified period of time or at a specified point in time, to cover both the initial capital provided and the cost of the interest incurred for providing this capital. A borrowing or loan provides the means for the borrowing entity to finance outlays (typically physical assets) when it has insufficient funds of its own to do so, and for the lending entity to make a financial return, normally in the form of interest revenue, on the funding provided.
Capital expenditure Relatively large (material) expenditure, which has benefits, expected to last for more than 12 months. Capital expenditure includes renewal, expansion and upgrade. Where capital projects involve a combination of renewal, expansion and/or upgrade expenditures, the total project cost needs to be allocated accordingly.
Capital expenditure - expansion Expenditure that extends the capacity of an existing asset to provide benefits, at the same standard as is currently enjoyed by existing beneficiaries, to a new group of users. It is discretionary expenditure, which increases future operations and maintenance costs, because it increases the organisation’s asset base, but may be associated with additional revenue from the new user group, eg. extending a drainage or road network, the provision of an oval or park in a new suburb for new residents.
Capital expenditure - new Expenditure which creates a new asset providing a new service/output that did not exist beforehand. As it increases service potential it may impact revenue and will increase future operations and maintenance expenditure.
Capital expenditure - renewal Expenditure on an existing asset or on replacing an existing asset, which returns the service capability of the asset up to that which it had originally. It is periodically required expenditure, relatively large (material) in value compared with the value of the components or sub-components of the asset being renewed. As it reinstates existing service potential, it generally has no impact on revenue, but may reduce future operations and maintenance expenditure if completed at the optimum time, eg. resurfacing or resheeting a material part of a road network, replacing a material section of a drainage network with pipes of the same capacity, resurfacing an oval.

- 62 -
NARRANDERA SHIRE COUNCIL –PARKS FACILITIES ASSET MANAGEMENT PLAN – VERSION 1.02, 8 June 2012
Capital expenditure - upgrade Expenditure, which enhances an existing asset to provide a higher level of service or expenditure that will increase the life of the asset beyond that which it had originally. Upgrade expenditure is discretionary and often does not result in additional revenue unless direct user charges apply. It will increase operations and maintenance expenditure in the future because of the increase in the organisation’s asset base, eg. widening the sealed area of an existing road, replacing drainage pipes with pipes of a greater capacity, enlarging a grandstand at a sporting facility.
Capital funding Funding to pay for capital expenditure.
Capital grants Monies received generally tied to the specific projects for which they are granted, which are often upgrade and/or expansion or new investment proposals.
Capital investment expenditure See capital expenditure definition
Capitalisation threshold The value of expenditure on non-current assets above which the expenditure is recognised as capital expenditure and below which the expenditure is charged as an expense in the year of acquisition.
Carrying amount The amount at which an asset is recognised after deducting any accumulated depreciation / amortisation and accumulated impairment losses thereon.
Class of assets See asset class definition
Component Specific parts of an asset having independent physical or functional identity and having specific attributes such as different life expectancy, maintenance regimes, risk or criticality.
Cost of an asset The amount of cash or cash equivalents paid or the fair value of the consideration given to acquire an asset at the time of its acquisition or construction, including any costs necessary to place the asset into service. This includes one-off design and project management costs.
Current replacement cost (CRC) The cost the entity would incur to acquire the asset on the reporting date. The cost is measured by reference to the lowest cost at which the gross future economic benefits could be obtained in the normal course of business or the minimum it would cost, to replace the existing asset with a technologically modern equivalent new asset (not a second hand one) with the same economic benefits (gross service potential) allowing for any differences in the quantity and quality of output and in operating costs.
Depreciable amount The cost of an asset, or other amount substituted for its cost, less its residual value.
Depreciated replacement cost (DRC) The current replacement cost (CRC) of an asset less, where applicable, accumulated depreciation calculated on the basis of such cost to reflect the already consumed or expired future economic benefits of the asset.
Depreciation / amortisation The systematic allocation of the depreciable amount (service potential) of an asset over its useful life.
Economic life See useful life definition.
Expenditure The spending of money on goods and services. Expenditure includes recurrent and capital.
Fair value The amount for which an asset could be exchanged, or a liability settled, between knowledgeable, willing parties, in an arms length transaction.
Funding gap A funding gap exists whenever an entity has insufficient capacity to fund asset renewal and other expenditure necessary to be able to appropriately maintain the range and level of services its existing asset stock was originally designed and intended to deliver. The service capability of the existing asset stock should be determined assuming no additional operating revenue, productivity improvements, or net financial liabilities above levels currently planned or projected. A current funding gap means service levels have already or are currently falling. A projected funding gap if not addressed will result in a future diminution of existing service levels.

- 63 -
NARRANDERA SHIRE COUNCIL –PARKS FACILITIES ASSET MANAGEMENT PLAN – VERSION 1.02, 8 June 2012
Heritage asset An asset with historic, artistic, scientific, technological, geographical or environmental qualities that is held and maintained principally for its contribution to knowledge and culture and this purpose is central to the objectives of the entity holding it.
Impairment Loss The amount by which the carrying amount of an asset exceeds its recoverable amount.
Infrastructure assets Physical assets that contribute to meeting the needs of organisations or the need for access to major economic and social facilities and services, eg. roads, drainage, footpaths and cycleways. These are typically large, interconnected networks or portfolios of composite assets. The components of these assets may be separately maintained, renewed or replaced individually so that the required level and standard of service from the network of assets is continuously sustained. Generally the components and hence the assets have long lives. They are fixed in place and are often have no separate market value.
Investment property Property held to earn rentals or for capital appreciation or both, rather than for: (a) use in the production or supply of goods or
services or for administrative purposes; or (b) sale in the ordinary course of business.
Key performance indicator A qualitative or quantitative measure of a service or activity used to compare actual performance against a standard or other target. Performance indicators commonly relate to statutory limits, safety, responsiveness, cost, comfort, asset performance, reliability, efficiency, environmental protection and customer satisfaction.
Level of service The defined service quality for a particular service/activity against which service performance may be measured. Service levels usually relate to quality, quantity, reliability, responsiveness, environmental impact, acceptability and cost.
Life Cycle Cost 1. Total LCC The total cost of an asset throughout its
life including planning, design, construction, acquisition, operation, maintenance, rehabilitation and disposal costs.
2. Average LCC The life cycle cost (LCC) is average cost to provide the service over the longest asset life cycle. It comprises annual operations, maintenance and asset consumption expense, represented by depreciation expense. The Life Cycle Cost does not indicate the funds required to provide the service in a particular year.
Life Cycle Expenditure The Life Cycle Expenditure (LCE) is the actual or planned annual operations, maintenance and capital renewal expenditure incurred in providing the service in a particular year. Life Cycle Expenditure may be compared to average Life Cycle Cost to give an initial indicator of life cycle sustainability.
Loans / borrowings See borrowings.
Maintenance All actions necessary for retaining an asset as near as practicable to its original condition, including regular ongoing day-to-day work necessary to keep assets operating, eg road patching but excluding rehabilitation or renewal. It is operating expenditure required to ensure that the asset reaches its expected useful life. • Planned maintenance
Repair work that is identified and managed through a maintenance management system (MMS). MMS activities include inspection, assessing the condition against failure/breakdown criteria/experience, prioritising scheduling, actioning the work and reporting what was done to develop a maintenance history and improve maintenance and service delivery performance.
• Reactive maintenance Unplanned repair work that is carried out in response to service requests and management/supervisory directions.
• Significant maintenance Maintenance work to repair components or replace sub-components that needs to be identified as a specific maintenance item in the maintenance budget.
• Unplanned maintenance Corrective work required in the short-term to restore an asset to working condition so it can continue to deliver the required service or to maintain its level of security and integrity.

- 64 -
NARRANDERA SHIRE COUNCIL –PARKS FACILITIES ASSET MANAGEMENT PLAN – VERSION 1.02, 8 June 2012
Maintenance and renewal gap Difference between estimated budgets and projected required expenditures for maintenance and renewal of assets to achieve/maintain specified service levels, totalled over a defined time (e.g. 5, 10 and 15 years).
Maintenance and renewal sustainability index
Ratio of estimated budget to projected expenditure for maintenance and renewal of assets over a defined time (eg 5, 10 and 15 years).
Maintenance expenditure
Recurrent expenditure, which is periodically or regularly required as part of the anticipated schedule of works required to ensure that the asset achieves its useful life and provides the required level of service. It is expenditure, which was anticipated in determining the asset’s useful life.
Materiality The notion of materiality guides the margin of error acceptable, the degree of precision required and the extent of the disclosure required when preparing general purpose financial reports. Information is material if its omission, misstatement or non-disclosure has the potential, individually or collectively, to influence the economic decisions of users taken on the basis of the financial report or affect the discharge of accountability by the management or governing body of the entity.
Modern equivalent asset Assets that replicate what is in existence with the most cost-effective asset performing the same level of service. It is the most cost efficient, currently available asset which will provide the same stream of services as the existing asset is capable of producing. It allows for technology changes and, improvements and efficiencies in production and installation techniques
Net present value (NPV) The value to the organisation of the cash flows associated with an asset, liability, activity or event calculated using a discount rate to reflect the time value of money. It is the net amount of discounted total cash inflows after deducting the value of the discounted total cash outflows arising from eg the continued use and subsequent disposal of the asset after deducting the value of the discounted total cash outflows.
Non-revenue generating investments Investments for the provision of goods and services to sustain or improve services to the community that are not expected to generate any savings or revenue to the Council, eg. parks and playgrounds, footpaths, roads and bridges, libraries, etc.
Operations expenditure Recurrent expenditure, which is continuously required to provide a service. In common use the term typically includes, eg power, fuel, staff, plant equipment, on-costs and overheads but excludes maintenance and depreciation. Maintenance and depreciation is on the other hand included in operating expenses.
Operating expense The gross outflow of economic benefits, being cash and non cash items, during the period arising in the course of ordinary activities of an entity when those outflows result in decreases in equity, other than decreases relating to distributions to equity participants.
Pavement management system A systematic process for measuring and predicting the condition of road pavements and wearing surfaces over time and recommending corrective actions.
PMS Score A measure of condition of a road segment determined from a Pavement Management System.
Rate of annual asset consumption A measure of average annual consumption of assets (AAAC) expressed as a percentage of the depreciable amount (AAAC/DA). Depreciation may be used for AAAC.
Rate of annual asset renewal A measure of the rate at which assets are being renewed per annum expressed as a percentage of depreciable amount (capital renewal expenditure/DA).
Rate of annual asset upgrade A measure of the rate at which assets are being upgraded and expanded per annum expressed as a percentage of depreciable amount (capital upgrade/expansion expenditure/DA).
Recoverable amount The higher of an asset's fair value, less costs to sell and its value in use.
Recurrent expenditure Relatively small (immaterial) expenditure or that which has benefits expected to last less than 12 months. Recurrent expenditure includes operations and maintenance expenditure.

- 65 -
NARRANDERA SHIRE COUNCIL –PARKS FACILITIES ASSET MANAGEMENT PLAN – VERSION 1.02, 8 June 2012
Recurrent funding Funding to pay for recurrent expenditure.
Rehabilitation See capital renewal expenditure definition above.
Remaining useful life The time remaining until an asset ceases to provide the required service level or economic usefulness. Age plus remaining useful life is useful life.
Renewal See capital renewal expenditure definition above.
Residual value The estimated amount that an entity would currently obtain from disposal of the asset, after deducting the estimated costs of disposal, if the asset were already of the age and in the condition expected at the end of its useful life.
Revenue generating investments Investments for the provision of goods and services to sustain or improve services to the community that are expected to generate some savings or revenue to offset operating costs, eg public halls and theatres, childcare centres, sporting and recreation facilities, tourist information centres, etc.
Risk management The application of a formal process to the range of possible values relating to key factors associated with a risk in order to determine the resultant ranges of outcomes and their probability of occurrence.
Section or segment A self-contained part or piece of an infrastructure asset.
Service potential The total future service capacity of an asset. It is normally determined by reference to the operating capacity and economic life of an asset. A measure of service potential is used in the not-for-profit sector/public sector to value assets, particularly those not producing a cash flow.
Service potential remaining A measure of the future economic benefits remaining in assets. It may be expressed in dollar values (Fair Value) or as a percentage of total anticipated future economic benefits. It is also a measure of the percentage of the asset’s potential to provide services that is still available for use in providing services (Depreciated Replacement Cost/Depreciable Amount).
Strategic Longer-Term Plan A plan covering the term of office of councillors (4 years minimum) reflecting the needs of the community for the foreseeable future. It brings together the detailed requirements in the council’s longer-term plans such as the asset management plan and the long-term financial plan. The plan is prepared in consultation with the community and details where the council is at that point in time, where it wants to go, how it is going to get there, mechanisms for monitoring the achievement of the outcomes and how the plan will be resourced.
Specific Maintenance Replacement of higher value components/sub-components of assets that is undertaken on a regular cycle including repainting, building roof replacement, cycle, replacement of air conditioning equipment, etc. This work generally falls below the capital/ maintenance threshold and needs to be identified in a specific maintenance budget allocation.
Sub-component Smaller individual parts that make up a component part.
Useful life Either: (a) the period over which an asset is expected to be
available for use by an entity, or (b) the number of production or similar units expected
to be obtained from the asset by the entity. It is estimated or expected time between placing the asset into service and removing it from service, or the estimated period of time over which the future economic benefits embodied in a depreciable asset, are expected to be consumed by the council. Value in Use The present value of future cash flows expected to be derived from an asset or cash generating unit. It is deemed to be depreciated replacement cost (DRC) for those assets whose future economic benefits are not primarily dependent on the asset's ability to generate net cash inflows, where the entity would, if deprived of the asset, replace its remaining future economic benefits.
Source: IPWEA, 2009, Glossary