asset management plan - simcoe.ca management plan.pdf · page 5 these plans also have a reciprocal...
TRANSCRIPT
Asset ManagementPlan
Asset Management Plan
Page 1
Table of Contents
1.0 Executive Summary ................................................................................................. 2
2.0 Introduction ............................................................................................................... 4
3.0 State of County of Simcoe’s Infrastructure ............................................................... 7
4.0 Levels of Service .................................................................................................... 14
5.0 Asset Management Strategy .................................................................................. 19
6.0 Financial Strategy ................................................................................................... 23
7.0 Conclusions and Recommendations ...................................................................... 27
8.0 Appendices ............................................................................................................. 29
9.0 Glossary: ................................................................................................................ 36
10.0 Significant Assumptions ......................................................................................... 37

Page 2
1.0 Executive Summary
The performance of a community’s infrastructure provides the foundation for its economic development, competitiveness, prosperity, reputation, and the overall quality of life for its residents.
The asset management plan documents our current program which is an integrated, lifecycle approach to effective stewardship of infrastructure assets to maximize benefits, manage risk and provide satisfactory levels of service to the public in a sustainable and environmentally responsible manner.
This plan is the County of Simcoe’s first iteration of a consolidated and documented asset management plan. The County has previously integrated asset management into the strategic decision making process however this plan documents the asset strategies used for asset groups across departments. The asset management plan has been completed based on readily available information in the County. It describes the framework for decision making related to the management of the County’s existing infrastructure. The County is committed to continually improving the asset management plan in the future as additional information is collected and as further understanding of asset management strategies are achieved.
The plan is based on the eight key questions of asset management as outlined within the National Guide for Sustainable Municipal Infrastructure:
What do we own? (inventory) What is it worth? (valuation / replacement cost) What are the service levels? What condition is it in? (function and performance) What needs to be done? (maintain / rehabilitate / replace) When do we need to do it? (useful life analysis) How much money do we need? (investment requirements) How do we reach sustainability? (long-term financial plan)
The asset Management plan addresses these questions in the following key sections:
1. Executive Summary 2. Introduction 3. State of the Current Infrastructure 4. Service Levels 5. Asset Management Strategy 6. Financial Strategy 7. Conclusions and Recommendations
The County’s asset management plan identifies the forecasted capital requirements within the next ten years based upon a detailed review of the current asset inventory condition and risk. The County is dedicated to increasing the accuracy of its inventory and the associated management strategies per asset type in order to strengthen the validity of the asset management plan. These activities will be based on a better understanding of the renewal needs of specific asset types and achievable service levels.
In order to evaluate the condition of an asset, the County has set specific service levels for each asset type. The service levels are based upon industry standards and historical experience with each asset group. These service levels drive the rehabilitation and replacement strategy in order to forecast capital requirements. The

Page 3
service levels per asset type are shown below:
Asset Type Service Levels Structures Bridge Condition Index of 60 or greater
Roads Pavement Condition Index of 75 and greater
Additionally, each asset type is associated with a risk assessment. The risk assessment allows for the County to better understand the probability and the consequence of an asset failing and its impact on residents. A risk score is calculated based upon these two factors which is then compared to a grading scale per asset type. This grading scale allows the County to compare asset types and their conditions across the organization and prioritize forecasted projects. The County plans to review both the service levels and risk assessments on an annual basis to ensure they are reasonable.
Total non-growth expenditures for the period 2015 to 2024 for the maintenance of the County of Simcoe’s existing infrastructure is forecast to be an average of $21 million annually. It is expected that these costs will be funded through transfer from reserves, gas tax, and the tax levy. The County must determine if the service levels it has set for each asset type are realistic based on their financial impacts.

Page 4
2.0 Introduction The County of Simcoe owns a diverse portfolio of infrastructure assets that provide a number of County services to residents. The County of Simcoe’s prosperity, economic development, competitiveness, image, and overall quality of resident life are clearly tied to its quality of infrastructure.
2.1 What is Asset Management? Asset management is a municipality’s plan to provide services to residents in a way that meets the municipality’s objectives and is financially sustainable in the future. Assets are defined as the physical infrastructure that is necessary to support the social, economic and environmental services provided to residents. Management of these assets includes the balancing of costs, opportunities and risks against the desired performance of assets, to achieve County wide objectives.
An asset management plan enables the management of assets through the development and implementation of a comprehensive and effective framework. It supports decision making based on the shared principles of effective communication, risk management, long-term planning, defined levels of service, enhanced life-cycle controls and monitoring across the entire corporation. Its long-term vision helps to guide resource allocation decisions.
Specifically, the County will use the asset management plan to define their future infrastructure investment strategy. Service levels for the identified asset types are identified and evaluated to determine cost requirements in the future. These cost requirements require a clear allocation of resources between asset types or departments. Furthermore, the funding of these costs must be reviewed. Decisions regarding reserve management and the request for additional funding if required need to be made based on the results of the plan.
The asset management plan will aid in developing common measurement tools to facilitate the evaluation of asset needs across the County’s departments and asset groups. Such tools may include common condition and risk ratings which will allow the County to highlight those assets which are in greatest need of replacement or rehabilitation.
The plan will also allow the County to determine how it compares to neighbouring upper-tier municipalities that have similar infrastructure assets. Member municipalities can also be reviewed to determine their infrastructure needs and, when possible, to align infrastructure development strategies to achieve cost efficiencies.
2.3 Relationship to Strategic Plan An asset management plan is an important piece of a municipality’s strategic plan. It helps to strengthen the development and operation of municipal infrastructure and the services they provide to the community. It provides insight into required infrastructure investment to provide future services and highlights areas that are in need.
Given the growing economic and political significance of infrastructure, the asset management plan will become a key component of the strategic plan and influence other County of Simcoe plans, such as:
The Official Plan – Land use policy directions for long-term growth and development. Long Term Financial Plan – Financial decisions Transportation Master Plan – Future transportation recommendations.
Page 5
These plans also have a reciprocal relationship with the asset management plan, in that their conclusions affect the infrastructure investment strategy and service levels.
2.4 Objective and Scope This document identifies and reviews the state of the County’s infrastructure and the projected state of the following asset classes:
Transportation: a. Roads Urban and Rural b. Structures
The scope of the asset management plan has focused on the core economic infrastructure outlined by the Ministry of Infrastructure. The scope of the plan will expand to other asset types currently owned by the County in future iterations.
Historical information has been presented based on a period from 2009 to 2013. In the year 2009, the County converted to an Enterprise Resource System that allowed for more detailed project costing to be kept on file. When comparative information related to periods prior to 2009 are needed, other sources of information will be utilized.
The County of Simcoe is currently in a state of growth. However, this growth is difficult to predict when determining an infrastructure strategy. For this reason, the County’s asset management plan focuses on the rehabilitation and reconstruction of its existing assets, and not the acquisition of new assets to handle increased levels of residents. This approach is consistent with most municipal asset management plans as reviewed by the County. As assets are purchased or constructed they are added to the County’s inventory and included in the asset management plan.
2.6 General Methodology The County addressed the requirement to produce an asset management plan by evaluating the importance of each asset type. Those asset types considered to be “core infrastructure assets” based on the Ministry of Infrastructure’s guidelines were addressed in the plan. Core infrastructure assets are assets considered to be widely used by residents and are shown in green on the implementation plan matrix found in Appendix 1. Assets considered to be of medium priority (yellow) are utilized by County staff and are used for operational purposes. Assets considered to be low priority based on historical cost and need are shown in red.
Additionally, each asset type was evaluated based on the asset management plan components. The components and a brief description are outlined below:
Inventory Completeness – The level of accuracy in ensuring all material inventory items are recorded Inventory Measurement/Valuation – The level of accuracy in ensuring the historic cost and
replacement cost of inventory items are recorded Inventory Comprehensiveness – The level of detail in the information recorded for each inventory item Inventory Repository – The existence of a system to record the inventory data Condition Levels – The existence of a method of evaluating the current condition of inventory/assets
and the most current evaluation data for these assets Service Levels – The existence of established service levels currently used to evaluate asset
purchases and condition levels Management Strategies – The existence of strategies for the rehabilitation and replacement of
Page 6
infrastructure currently in use
Financing Strategies – The existence of designated funding sources for project types based on established agreements or past practices
2.7 Roles and Responsibilities
Asset Management Committee An Asset Management Committee (AMC) was formed to ensure the creation of the asset management plan represented the goals and objectives of all of the County’s major infrastructure groups. These groups include roads, structures, social housing, facilities, solid waste management and vehicles and equipment. The AMC is responsible for providing insight and knowledge into their respective departments, bringing forward service levels and historical data for use in the plan. The AMC is to ensure the data provided in the plan and future versions is reliable and complete. It is expected the AMC will meet on a bi-annual basis to discuss additions, updates and improvements to the current asset management plan.
Corporate Departments It is the responsibility of each department to provide current information regarding the state and needs of their respective infrastructure in terms of maintenance, repair, rehabilitation and replacement requirements. Each department should recommend an asset strategy to meet a defined level of service while minimizing life cycle costs. This includes maintaining a long range outlook rather than a short sighted financial plan. Each department is considered to be an expert on the funding sources applicable to their projects.
County Council The role of County Council is to represent the citizens and make decisions on their behalf. They approve the level of service to be provided to the population and the appropriate allocation of resources. In order to make informed decisions, elected officials must be informed about the financial resource requirements in order to sustain the existing asset base at the predetermined levels of service and determine appropriate long term and strategic plans.
2.8 Asset Management System The asset management plan has been developed using a database of municipal infrastructure information in the Decision Support software produced by RIVA Modeling Systems. The software contains the County’s asset base, valuation information, life cycle activity predictions, costs for activities, sustainability analysis and prioritization parameters.
Page 7
3.0 State of County of Simcoe’s Infrastructure
3.1 General The County’s tangible capital assets were evaluated in 2009 in order to meet the PSAB 3150 accounting standard. This standard was implemented by the Accounting Standards Board and required municipalities to specifically identify and record municipal infrastructure at its historical cost for greater transparency. The County’s tangible capital asset information has been approved and given a clean audit opinion by the County’s external auditors. This information is a basic audit component of the annual financial statements and is audited on an annual basis. Information related to roads, structures and vehicles were then loaded into the RIVA Decision Support software module as they were known to be a complete listing of all owned assets for each class. A building condition assessment was later performed on all social housing buildings and County owned facilities to determine the County’s facilities inventory, replacement cost and condition. This was also loaded into the RIVA software. This data base now provides a detailed and summarized inventory of each of these asset classes and is used throughout the asset management plan.
The County recognizes that data collection and data management is a critical aspect of the asset management planning process. Accuracy, completeness, reliability and consistency of the data is extremely important in developing a sound asset management plan.
In order to accurately forecast deterioration of an asset, periodic condition assessment information has been captured. The County relies on straight line or specific deterioration curves to forecast the deterioration of an asset over its useful life. Dependent on the asset class, more detailed asset condition information is available to forecast future costs. Further information on asset deterioration strategies are provided in the asset class sections below.
An analysis has been performed to identify sustainable investment requirements for each asset category over an extended period. The County has focused on a ten year time frame for the asset management plan. Any forecasted costs that exceed the expected revenue in a current year and are required to be funded by debt is considered an infrastructure deficit.
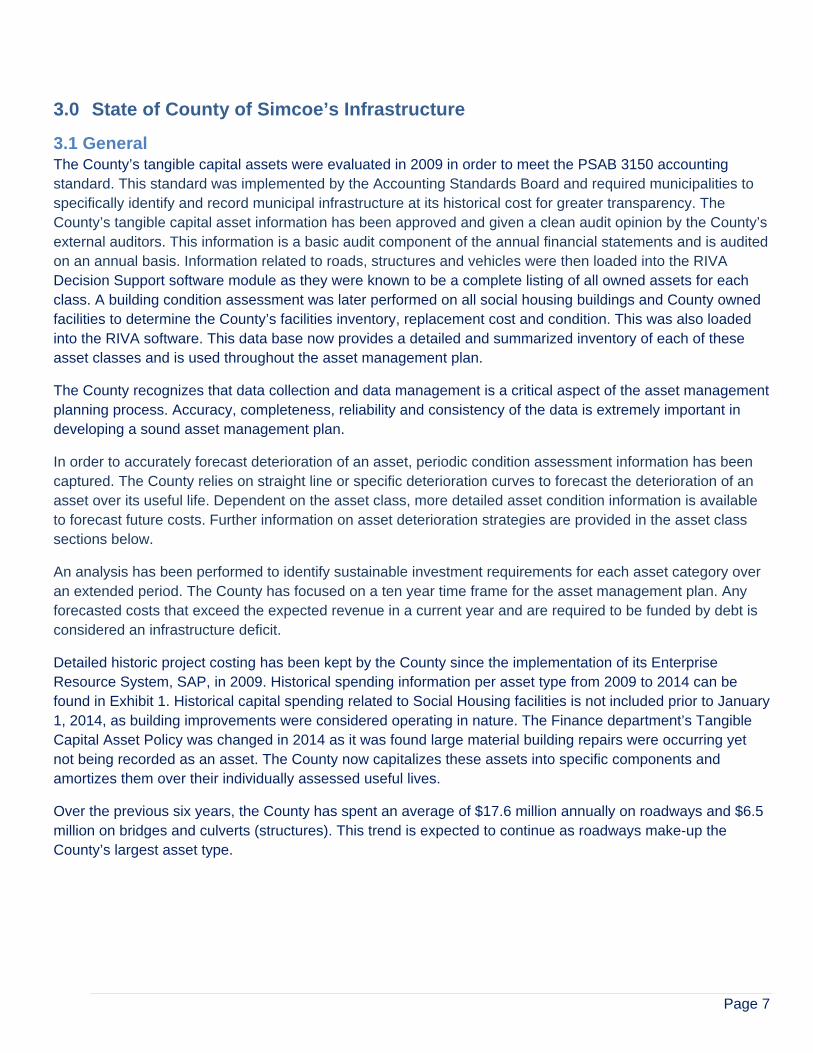
Detailed historic project costing has been kept by the County since the implementation of its Enterprise Resource System, SAP, in 2009. Historical spending information per asset type from 2009 to 2014 can be found in Exhibit 1. Historical capital spending related to Social Housing facilities is not included prior to January 1, 2014, as building improvements were considered operating in nature. The Finance department’s Tangible Capital Asset Policy was changed in 2014 as it was found large material building repairs were occurring yet not being recorded as an asset. The County now capitalizes these assets into specific components and amortizes them over their individually assessed useful lives.
Over the previous six years, the County has spent an average of $17.6 million annually on roadways and $6.5 million on bridges and culverts (structures). This trend is expected to continue as roadways make-up the County’s largest asset type.
Page 8
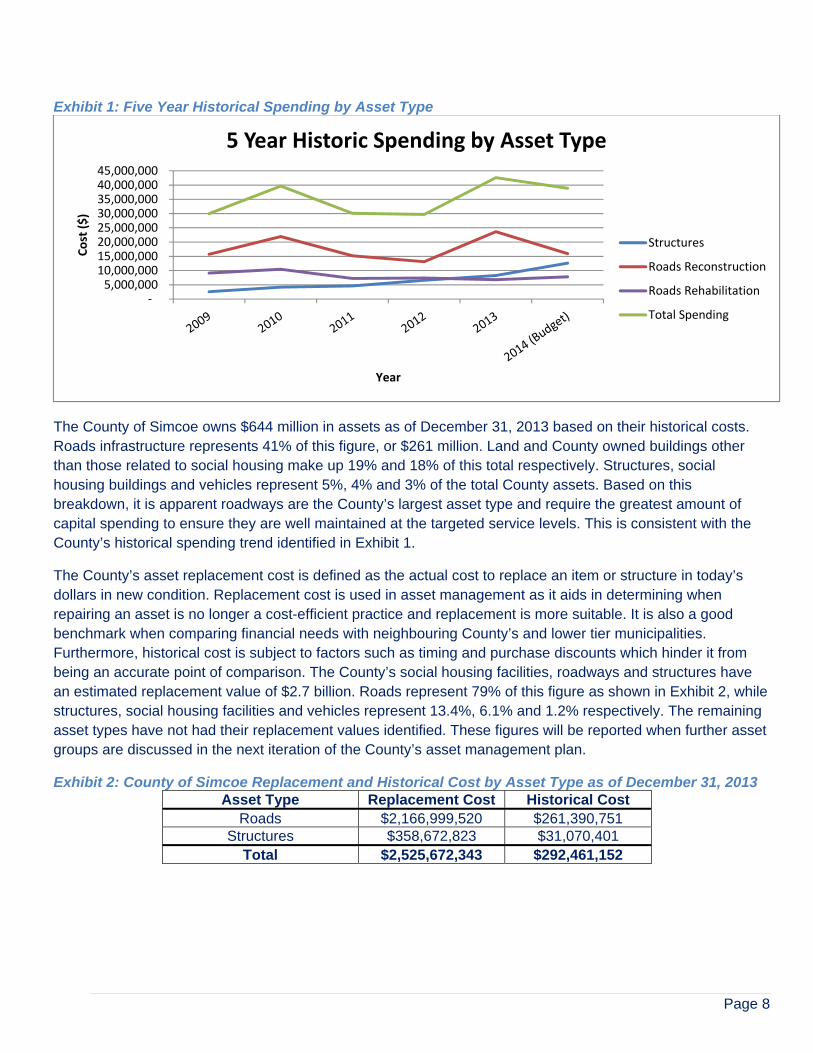
Exhibit 1: Five Year Historical Spending by Asset Type
The County of Simcoe owns $644 million in assets as of December 31, 2013 based on their historical costs. Roads infrastructure represents 41% of this figure, or $261 million. Land and County owned buildings other than those related to social housing make up 19% and 18% of this total respectively. Structures, social housing buildings and vehicles represent 5%, 4% and 3% of the total County assets. Based on this breakdown, it is apparent roadways are the County’s largest asset type and require the greatest amount of capital spending to ensure they are well maintained at the targeted service levels. This is consistent with the County’s historical spending trend identified in Exhibit 1.
The County’s asset replacement cost is defined as the actual cost to replace an item or structure in today’s dollars in new condition. Replacement cost is used in asset management as it aids in determining when repairing an asset is no longer a cost-efficient practice and replacement is more suitable. It is also a good benchmark when comparing financial needs with neighbouring County’s and lower tier municipalities. Furthermore, historical cost is subject to factors such as timing and purchase discounts which hinder it from being an accurate point of comparison. The County’s social housing facilities, roadways and structures have an estimated replacement value of $2.7 billion. Roads represent 79% of this figure as shown in Exhibit 2, while structures, social housing facilities and vehicles represent 13.4%, 6.1% and 1.2% respectively. The remaining asset types have not had their replacement values identified. These figures will be reported when further asset groups are discussed in the next iteration of the County’s asset management plan.
Exhibit 2: County of Simcoe Replacement and Historical Cost by Asset Type as of December 31, 2013 Asset Type Replacement Cost Historical Cost
Roads $2,166,999,520 $261,390,751 Structures $358,672,823 $31,070,401
Total $2,525,672,343 $292,461,152
‐ 5,000,000
10,000,000 15,000,000 20,000,000 25,000,000 30,000,000 35,000,000 40,000,000 45,000,000
Cost ($)
Year
5 Year Historic Spending by Asset Type
Structures
Roads Reconstruction
Roads Rehabilitation
Total Spending

Page 9
3.2 Risk Assessment The County evaluates each of its assets on both their physical condition as well as the consequence of their failure. To perform this evaluation, a risk score is calculated for each asset based on two factors:
Probability of Failure: A score based on the condition of the asset today and how well it performs its function Consequence of Failure: A score based on the direct and indirect impact on the County if an asset failure were to occur.
Probability of Failure Each asset type has its own specific grading scale to evaluate condition. The grading scale allows the County to compare asset types and their conditions across the organization while maintaining different condition ratings and service levels specific to each. This is a key component to the asset management plan, as assets are expected to perform differently and at varying levels. Each asset type is assigned a specific grade based on their condition rating. These assignments are identified for each asset type and generally follow the descriptions by grade in Exhibit 3. For more specifics on the probability of failure for each asset group, refer to Appendix 2.
Exhibit 3: Probability of Failure Score
Estimated Condition Probability of Failure Description Probability of Failure Score Grade
Excellent Improbable 1 A
Good Unlikely 2 B
Fair Possible 3 C
Poor Likely 4 D
Critical Highly Probable 5 F
Consequence of Failure The County has created a risk rating scale on which to grade the level of risk each rehabilitation and replacement event has associated with it. This depends on factors such as the type of asset, services it provides, exposure to the public and safety critical issues. Exhibit 4 summarizes the approach to determining the consequence of failure score for each asset. Refer to Appendix 2 for the specific risk associated with each asset group.
Exhibit 4: Consequence of Failure Score Consequence of Failure Description Consequence of Failure Score
Very low measureable effect of any kind 1 Low/marginal change in the function, serviceability, or capacity of the asset and/or effect on public safety and the environment
2
Moderate/regular change in the function, serviceability, or capacity of the asset and/or effect on public safety and the environment
3
Major/regular change in the function, serviceability, or capacity of the asset and/or effect on public safety and the environment
4
Catastrophic loss of infrastructure affecting public safety or having severe environmental consequences
5
Page 10
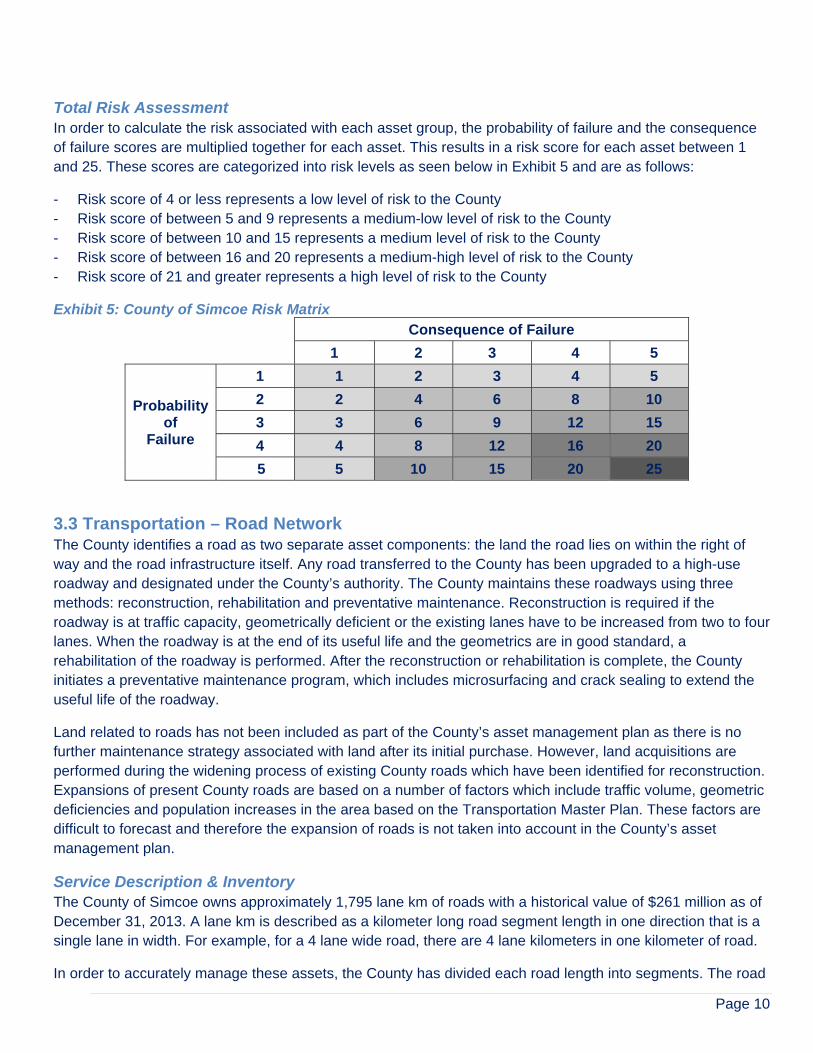
Total Risk Assessment In order to calculate the risk associated with each asset group, the probability of failure and the consequence of failure scores are multiplied together for each asset. This results in a risk score for each asset between 1 and 25. These scores are categorized into risk levels as seen below in Exhibit 5 and are as follows:
- Risk score of 4 or less represents a low level of risk to the County - Risk score of between 5 and 9 represents a medium-low level of risk to the County - Risk score of between 10 and 15 represents a medium level of risk to the County - Risk score of between 16 and 20 represents a medium-high level of risk to the County - Risk score of 21 and greater represents a high level of risk to the County
Exhibit 5: County of Simcoe Risk Matrix Consequence of Failure
1 2 3 4 5
Probability of
Failure
1 1 2 3 4 5
2 2 4 6 8 10
3 3 6 9 12 15
4 4 8 12 16 20
5 5 10 15 20 25
3.3 Transportation – Road Network The County identifies a road as two separate asset components: the land the road lies on within the right of way and the road infrastructure itself. Any road transferred to the County has been upgraded to a high-use roadway and designated under the County’s authority. The County maintains these roadways using three methods: reconstruction, rehabilitation and preventative maintenance. Reconstruction is required if the roadway is at traffic capacity, geometrically deficient or the existing lanes have to be increased from two to four lanes. When the roadway is at the end of its useful life and the geometrics are in good standard, a rehabilitation of the roadway is performed. After the reconstruction or rehabilitation is complete, the County initiates a preventative maintenance program, which includes microsurfacing and crack sealing to extend the useful life of the roadway.
Land related to roads has not been included as part of the County’s asset management plan as there is no further maintenance strategy associated with land after its initial purchase. However, land acquisitions are performed during the widening process of existing County roads which have been identified for reconstruction. Expansions of present County roads are based on a number of factors which include traffic volume, geometric deficiencies and population increases in the area based on the Transportation Master Plan. These factors are difficult to forecast and therefore the expansion of roads is not taken into account in the County’s asset management plan.
Service Description & Inventory The County of Simcoe owns approximately 1,795 lane km of roads with a historical value of $261 million as of December 31, 2013. A lane km is described as a kilometer long road segment length in one direction that is a single lane in width. For example, for a 4 lane wide road, there are 4 lane kilometers in one kilometer of road.
In order to accurately manage these assets, the County has divided each road length into segments. The road
Page 11
segments have varied lengths and vary in composition. The details of each road segment including the segment width, depth of asphalt, length, number of lanes, pavement type, road class, date acquired by or uploaded to the County and average daily traffic count are recorded in the County’s asset management program. Each road segment is physically inspected on an annual basis to review the condition. The inspection history of the road condition of each road segment is also recorded and kept on file.
The transfer of roads to and from lower tier municipalities and from the Ministry of Transportation occurs on occasion. These changes are recorded in the asset management plan as they occur.
Bylaws are reviewed by County staff regularly and all existing roads are inspected. The transfer of roads is based on the Transportation Master Plan and is dependent on growth, and therefore has not been taken into consideration in the asset management plan.
The County’s road network is composed of paved roads in urban and rural areas. Rural roadways are those that do not have infrastructure associated with them such as catch basins, curbs or storm sewers. Urban roadways have this associated infrastructure and are usually found in residential areas where they receive greater use. This is important as there is a correlation between the annual average daily traffic of a roadway and its deterioration. As the traffic within Simcoe County increases, there will be an increase in the maintenance requirements and eventual reconstruction of the roadways leading to higher costs.
As of December 31, 2013, the County’s road network was composed of 90% rural roadways, with the remaining 10% being urban. Depending on the number of roadways transferred to and from the County, this figure may change, however there is an increasing trend of urban roadways within the County. This is due to the increase in population in the southern municipalities over the past several years. This trend is expected to continue.
Valuation & Projected Replacement Cost The cost to build a 2 lane road, not including the cost of land purchases, amounts to an average of $1.2 million per km. This figure is based on the average current construction costs incurred in the past 5 years by the County. This is an estimate used when forecasting the reconstruction of County roads. There are however many contingencies that may increase the cost of reconstruction such as land acquisition costs, design changes, requirements from the Ministry of Environment, Ministry of Natural Resources utility relocations, construction delays and infrastructure installations.
Road rehabilitation is also forecasted based on an average of previous year’s costs for each type of treatment. These costs are reviewed on an annual basis to ensure their reasonability. The estimated replacement cost of the County’s road network in 2013 dollars is approximately $2.2 billion.
3.4 Transportation – Structures An engineered structure can be categorized as a bridge or a long span culvert. A bridge is a structure built to span physical obstacles such as a watercourse, valley, railway or road, for the passage of vehicles, pedestrians, or cyclists across an obstruction, gap, or facility. A long span culvert is a structure, with a span greater than or equal to 3 meters, which forms an opening through soil. Culverts of less than 3 meters in span are not considered an engineered structure and are maintained as part of the associated road asset.
There are many different types of engineered structures that all serve unique purposes and apply to different situations. Designs of structures vary depending on the function of the bridge, the nature of the land where the bridge is located, the material used to construct it, and the funds available to build it. A bridge is made up of
Page 12
multiple elements. These elements consist of the substructure (foundation, abutment, bearings and wingwalls), the superstructure (girders, deck slab, traffic barrier and wearing surface), embankments, approaches and signage. All of these elements are capitalized as one asset and are not differentiated in the County’s asset management plan. A culvert is also made up of several elements, however is less complex than a bridge. These elements consist of the over burden, barrel, traffic barrier, foundation, watercourse and embankment.
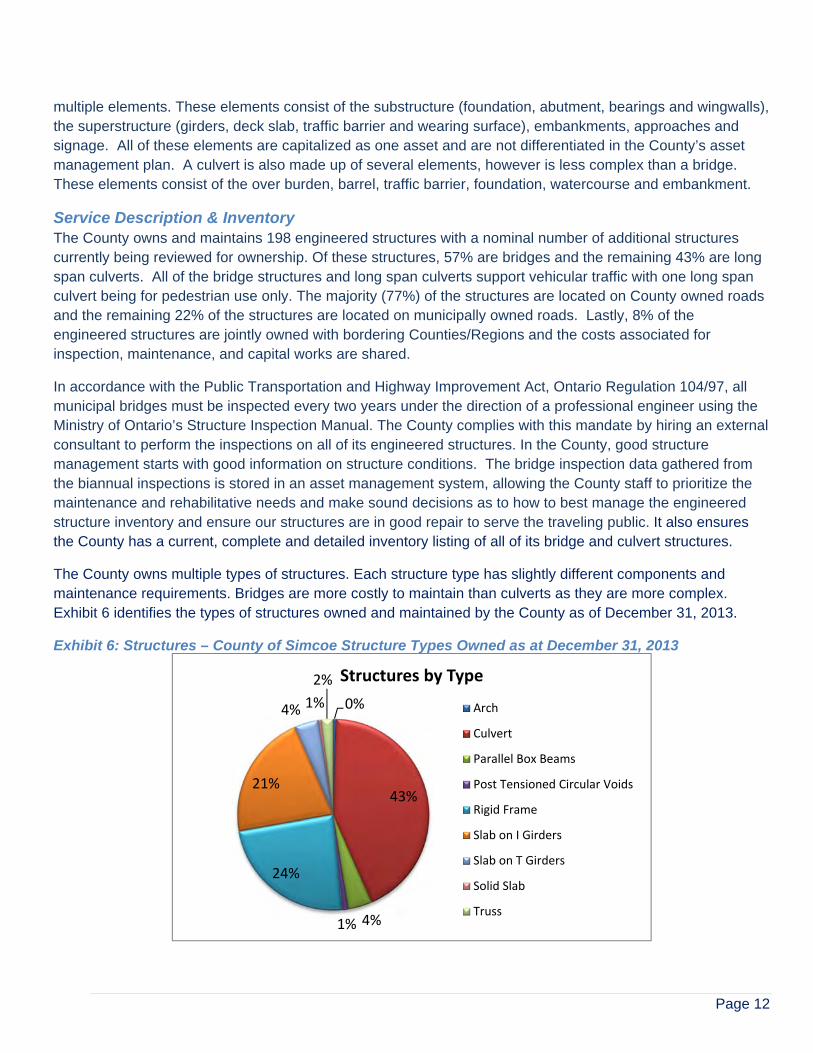
Service Description & Inventory The County owns and maintains 198 engineered structures with a nominal number of additional structures currently being reviewed for ownership. Of these structures, 57% are bridges and the remaining 43% are long span culverts. All of the bridge structures and long span culverts support vehicular traffic with one long span culvert being for pedestrian use only. The majority (77%) of the structures are located on County owned roads and the remaining 22% of the structures are located on municipally owned roads. Lastly, 8% of the engineered structures are jointly owned with bordering Counties/Regions and the costs associated for inspection, maintenance, and capital works are shared.
In accordance with the Public Transportation and Highway Improvement Act, Ontario Regulation 104/97, all municipal bridges must be inspected every two years under the direction of a professional engineer using the Ministry of Ontario’s Structure Inspection Manual. The County complies with this mandate by hiring an external consultant to perform the inspections on all of its engineered structures. In the County, good structure management starts with good information on structure conditions. The bridge inspection data gathered from the biannual inspections is stored in an asset management system, allowing the County staff to prioritize the maintenance and rehabilitative needs and make sound decisions as to how to best manage the engineered structure inventory and ensure our structures are in good repair to serve the traveling public. It also ensures the County has a current, complete and detailed inventory listing of all of its bridge and culvert structures.
The County owns multiple types of structures. Each structure type has slightly different components and maintenance requirements. Bridges are more costly to maintain than culverts as they are more complex. Exhibit 6 identifies the types of structures owned and maintained by the County as of December 31, 2013.
Exhibit 6: Structures – County of Simcoe Structure Types Owned as at December 31, 2013
0%
43%
4%1%
24%
21%
4% 1%
2% Structures by Type
Arch
Culvert
Parallel Box Beams
Post Tensioned Circular Voids
Rigid Frame
Slab on I Girders
Slab on T Girders
Solid Slab
Truss
Page 13
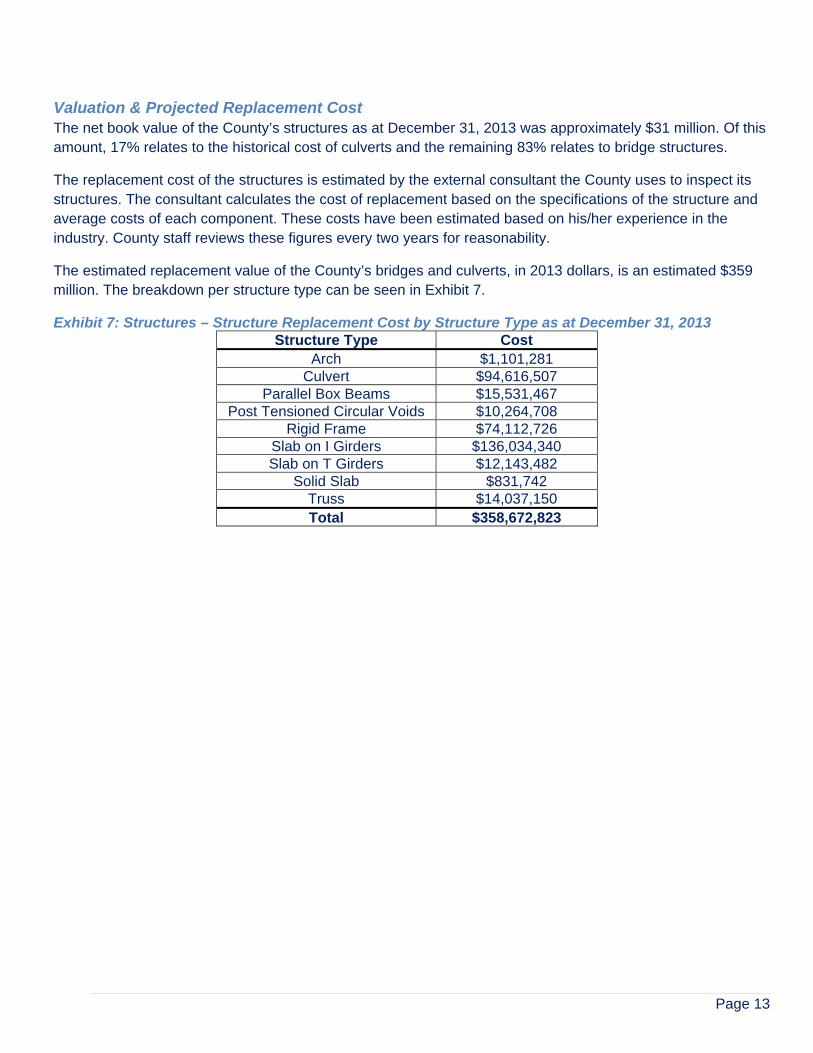
Valuation & Projected Replacement Cost The net book value of the County’s structures as at December 31, 2013 was approximately $31 million. Of this amount, 17% relates to the historical cost of culverts and the remaining 83% relates to bridge structures.
The replacement cost of the structures is estimated by the external consultant the County uses to inspect its structures. The consultant calculates the cost of replacement based on the specifications of the structure and average costs of each component. These costs have been estimated based on his/her experience in the industry. County staff reviews these figures every two years for reasonability.
The estimated replacement value of the County’s bridges and culverts, in 2013 dollars, is an estimated $359 million. The breakdown per structure type can be seen in Exhibit 7.
Exhibit 7: Structures – Structure Replacement Cost by Structure Type as at December 31, 2013 Structure Type Cost
Arch $1,101,281 Culvert $94,616,507
Parallel Box Beams $15,531,467 Post Tensioned Circular Voids $10,264,708
Rigid Frame $74,112,726 Slab on I Girders $136,034,340 Slab on T Girders $12,143,482
Solid Slab $831,742 Truss $14,037,150 Total $358,672,823
Page 14
4.0 Levels of Service The desired level of service is defined as the indicator that defines service quality for a given activity. They support the County’s strategic goals and are based on customer expectations, statutory requirements and standards, and the financial capacity of the County to deliver those levels of service. The following process identifies the method for establishing and maintaining a level of service.
a. Determine the appropriate level of each service b. Track the level of service c. Develop a strategy to meet the desired level of service
Levels of service are determined by legislative requirements, customer expectations, expected asset performance, strategic and corporate master plans and availability of finances. The basic level of service for the County is established by maintaining infrastructure at an acceptable level while minimizing the risk exposure to the County.
4.1 Transportation – Roads Network The County of Simcoe determines the condition of their roads by using the Pavement Condition Index (PCI).This method rates the condition of the surface of the road network by providing a numerical rating for the condition, where 0 is the worst possible condition and 100 is the best. It is based on the Ontario Good Roads Association recommended method of rating pavement condition.
Service Levels PCI measures two conditions:
Distress Manifestation Index (DMI): the type, extent and severity of pavement surface distresses Ride Comfort Rating (RCR): the smoothness and ride comfort of the road
The RCR is determined by a physical inspection of the road segment at the posted speed and assigned a rating based on a predetermined scale. The DMI is determined based on a systematic method for classifying and assessing the visible consequences of various distress mechanisms. DMI classifies distress manifestations into 14 categories, which are by severity and density. The PCI is determined by County’s roads rehabilitation staff. The higher the PCI value, the greater condition the asset is in.
The PCI is reviewed annually for all road segments. The County strives to maintain an average PCI of 75 or greater for its roadways.
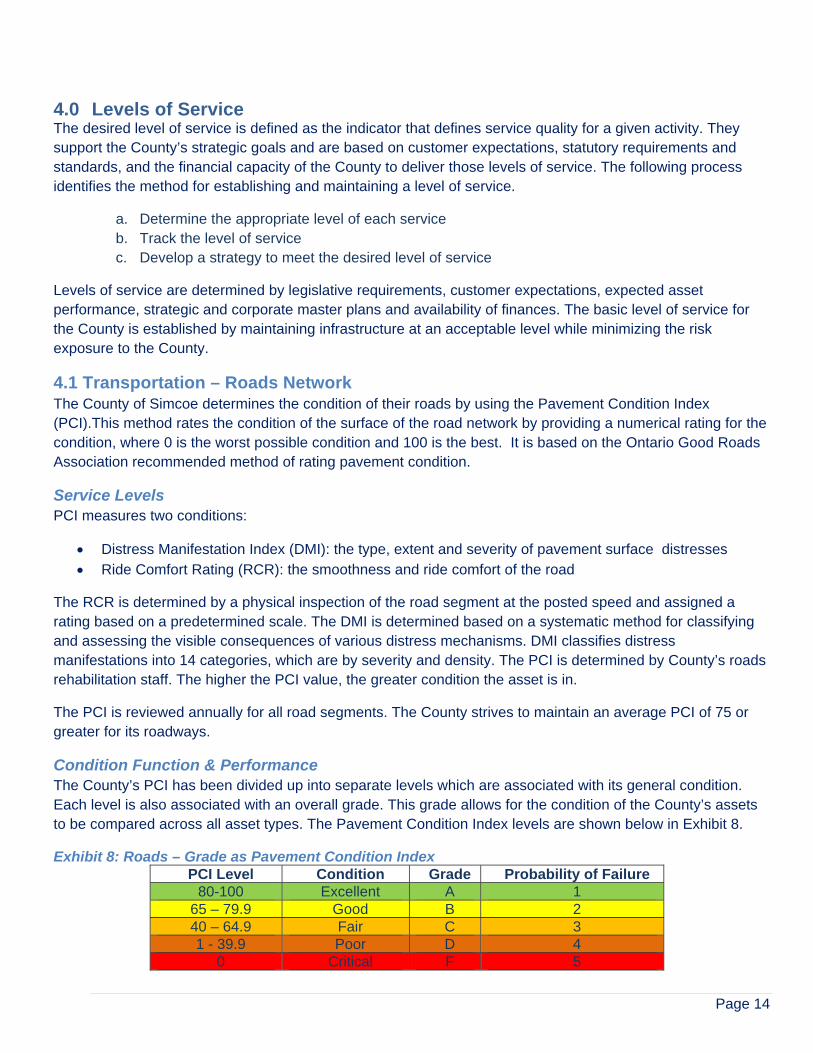
Condition Function & Performance The County’s PCI has been divided up into separate levels which are associated with its general condition. Each level is also associated with an overall grade. This grade allows for the condition of the County’s assets to be compared across all asset types. The Pavement Condition Index levels are shown below in Exhibit 8.
Exhibit 8: Roads – Grade as Pavement Condition Index PCI Level Condition Grade Probability of Failure
80-100 Excellent A 1 65 – 79.9 Good B 2 40 – 64.9 Fair C 3 1 - 39.9 Poor D 4
0 Critical F 5
Page 15
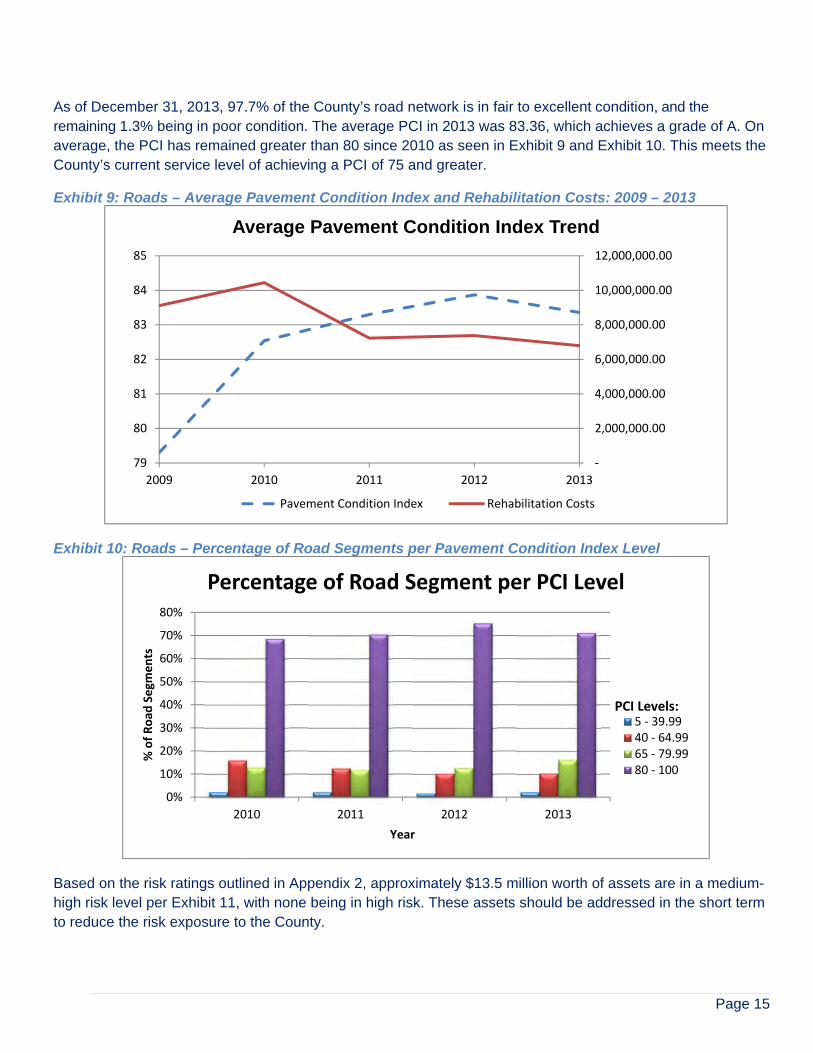
As of December 31, 2013, 97.7% of the County’s road network is in fair to excellent condition, and the remaining 1.3% being in poor condition. The average PCI in 2013 was 83.36, which achieves a grade of A. On average, the PCI has remained greater than 80 since 2010 as seen in Exhibit 9 and Exhibit 10. This meets the County’s current service level of achieving a PCI of 75 and greater.
Exhibit 9: Roads – Average Pavement Condition Index and Rehabilitation Costs: 2009 – 2013
Exhibit 10: Roads – Percentage of Road Segments per Pavement Condition Index Level
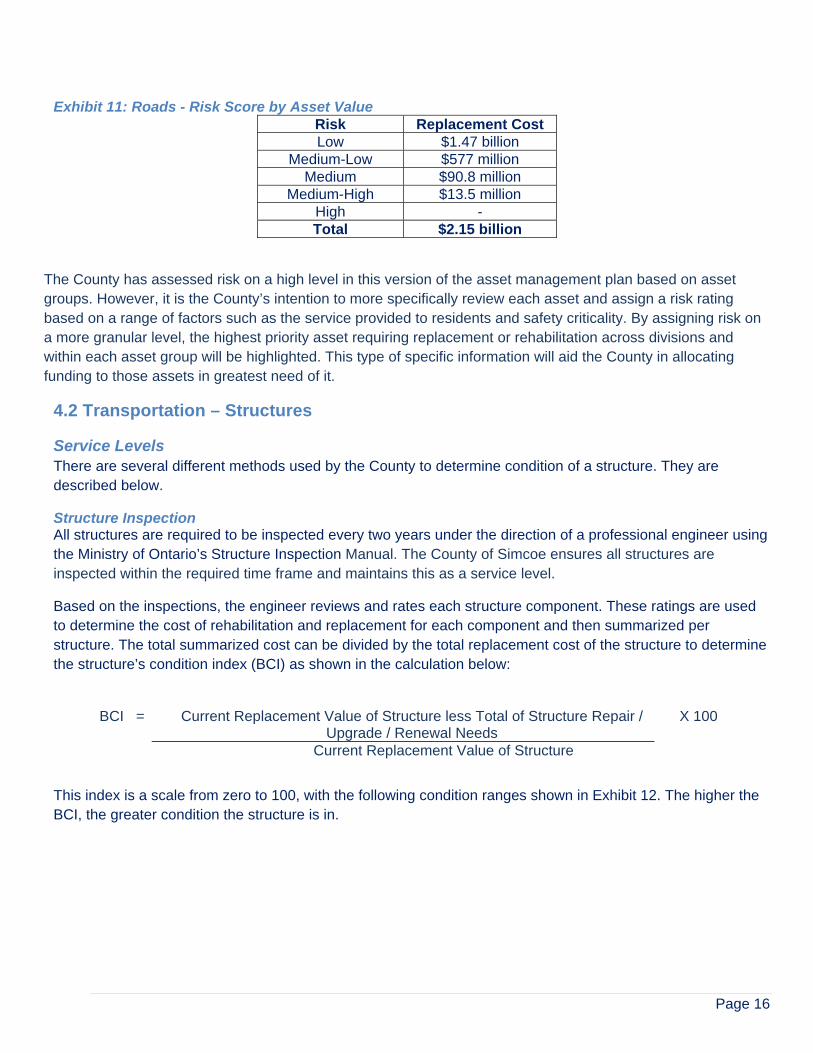
Based on the risk ratings outlined in Appendix 2, approximately $13.5 million worth of assets are in a medium-high risk level per Exhibit 11, with none being in high risk. These assets should be addressed in the short term to reduce the risk exposure to the County.
‐
2,000,000.00
4,000,000.00
6,000,000.00
8,000,000.00
10,000,000.00
12,000,000.00
79
80
81
82
83
84
85
2009 2010 2011 2012 2013
Average Pavement Condition Index Trend
Pavement Condition Index Rehabilitation Costs
0%
10%
20%
30%
40%
50%
60%
70%
80%
2010 2011 2012 2013
% of Road
Segm
ents
Year
Percentage of Road Segment per PCI Level
5 ‐ 39.9940 ‐ 64.9965 ‐ 79.9980 ‐ 100
PCI Levels:
Page 16
Exhibit 11: Roads - Risk Score by Asset Value Risk Replacement Cost Low $1.47 billion
Medium-Low $577 million Medium $90.8 million
Medium-High $13.5 million High - Total $2.15 billion
The County has assessed risk on a high level in this version of the asset management plan based on asset groups. However, it is the County’s intention to more specifically review each asset and assign a risk rating based on a range of factors such as the service provided to residents and safety criticality. By assigning risk on a more granular level, the highest priority asset requiring replacement or rehabilitation across divisions and within each asset group will be highlighted. This type of specific information will aid the County in allocating funding to those assets in greatest need of it.
4.2 Transportation – Structures
Service Levels There are several different methods used by the County to determine condition of a structure. They are described below.
Structure Inspection All structures are required to be inspected every two years under the direction of a professional engineer using the Ministry of Ontario’s Structure Inspection Manual. The County of Simcoe ensures all structures are inspected within the required time frame and maintains this as a service level.
Based on the inspections, the engineer reviews and rates each structure component. These ratings are used to determine the cost of rehabilitation and replacement for each component and then summarized per structure. The total summarized cost can be divided by the total replacement cost of the structure to determine the structure’s condition index (BCI) as shown in the calculation below:
BCI = Current Replacement Value of Structure less Total of Structure Repair /
Upgrade / Renewal Needs X 100
Current Replacement Value of Structure
This index is a scale from zero to 100, with the following condition ranges shown in Exhibit 12. The higher the BCI, the greater condition the structure is in.
Page 17
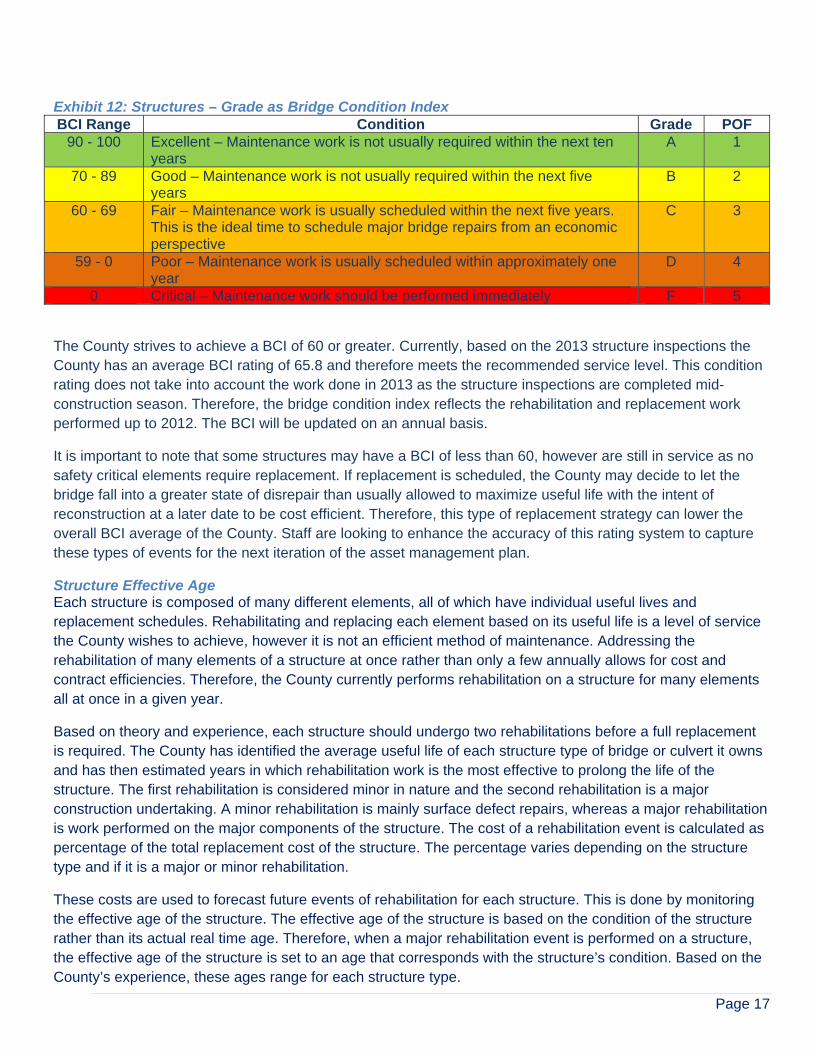
Exhibit 12: Structures – Grade as Bridge Condition Index BCI Range Condition Grade POF
90 - 100 Excellent – Maintenance work is not usually required within the next ten years
A 1
70 - 89 Good – Maintenance work is not usually required within the next five years
B 2
60 - 69 Fair – Maintenance work is usually scheduled within the next five years. This is the ideal time to schedule major bridge repairs from an economic perspective
C 3
59 - 0 Poor – Maintenance work is usually scheduled within approximately one year
D 4
0 Critical – Maintenance work should be performed immediately F 5
The County strives to achieve a BCI of 60 or greater. Currently, based on the 2013 structure inspections the County has an average BCI rating of 65.8 and therefore meets the recommended service level. This condition rating does not take into account the work done in 2013 as the structure inspections are completed mid-construction season. Therefore, the bridge condition index reflects the rehabilitation and replacement work performed up to 2012. The BCI will be updated on an annual basis.
It is important to note that some structures may have a BCI of less than 60, however are still in service as no safety critical elements require replacement. If replacement is scheduled, the County may decide to let the bridge fall into a greater state of disrepair than usually allowed to maximize useful life with the intent of reconstruction at a later date to be cost efficient. Therefore, this type of replacement strategy can lower the overall BCI average of the County. Staff are looking to enhance the accuracy of this rating system to capture these types of events for the next iteration of the asset management plan.
Structure Effective Age Each structure is composed of many different elements, all of which have individual useful lives and replacement schedules. Rehabilitating and replacing each element based on its useful life is a level of service the County wishes to achieve, however it is not an efficient method of maintenance. Addressing the rehabilitation of many elements of a structure at once rather than only a few annually allows for cost and contract efficiencies. Therefore, the County currently performs rehabilitation on a structure for many elements all at once in a given year.
Based on theory and experience, each structure should undergo two rehabilitations before a full replacement is required. The County has identified the average useful life of each structure type of bridge or culvert it owns and has then estimated years in which rehabilitation work is the most effective to prolong the life of the structure. The first rehabilitation is considered minor in nature and the second rehabilitation is a major construction undertaking. A minor rehabilitation is mainly surface defect repairs, whereas a major rehabilitation is work performed on the major components of the structure. The cost of a rehabilitation event is calculated as percentage of the total replacement cost of the structure. The percentage varies depending on the structure type and if it is a major or minor rehabilitation.
These costs are used to forecast future events of rehabilitation for each structure. This is done by monitoring the effective age of the structure. The effective age of the structure is based on the condition of the structure rather than its actual real time age. Therefore, when a major rehabilitation event is performed on a structure, the effective age of the structure is set to an age that corresponds with the structure’s condition. Based on the County’s experience, these ages range for each structure type.

Page 18
The effective age of the asset is a good indication of the current and forecasted condition of a structure. The effective age is defined as the age of the structure based on its rehabilitation schedule. For example, if a bridge is 50 years old in real time, however has undergone a major rehabilitation event in the current year; its effective age now becomes 45 years. The effective age reflects the age of the bridge based on its condition. This allows for the condition of the County’s bridge inventory to be known based on current and forecasted maintenance.
Safety Critical Bridge Elements During the inspection process, safety critical elements are also identified if in need of immediate repair. The County strives to address all safety critical elements soon after they are identified. The County maintains that we will give safety critical issues priority in the following budget cycle.
Condition Function & Performance The condition of each structure is assessed every two years by the consultant. Each component is given a rating of excellent, good, fair or poor. Safety hazards are also highlighted that require immediate review. County staff review the results of the assessments and perform a physical review of those bridges identified as safety critical or in poor condition. Based on this information, structures will be designated for an in-depth engineering review.
The County’s structures has a current BCI of 63, however there are significant rehabilitation and replacements required in the next several years.
Based on the risk ratings outlined in Appendix 2, approximately $62 million worth of assets are in a medium-high risk level per Exhibit 13. These assets should be addressed in the short term to reduce the risk exposure to the County.
Exhibit 13: Roads - Risk Score by Asset Value Risk Replacement Cost Low -
Medium-Low $168 million Medium $129 million
Medium-High $62 million High - Total $359 million

Page 19
5.0 Asset Management Strategy The asset management strategy is the set of planned actions that will enable the assets to provide the desired levels of service in a sustainable way while managing risk at the lowest lifecycle costs.
The analysis completed to determine capital revenue requirements was based on the following assumptions:
1. Replacement costs are based upon the unit costs identified 2. The timing for individual replacements was defined by the replacement year 3. The analysis was run for a 10 year period to ensure an accurate projection. 4. Expenses forecasted represent capital costs as defined by the County’s Tangible Capital Asset policy
and are non-growth related. The exception to this relates to Transportation – Roads Rehabilitation which is an operating cost however total costs are material in nature.
The strategies are outlined per asset type below.
5.1 Transportation – Roads Network The Ministry of Transportation - Ontario has a recommended guideline for the PCI decision matrix. The condition of pavement is based on the mentioned Pavement Condition Index and the type of road construction. This matrix, as seen in Exhibit 14, is used as a guideline, along with the personal observations of the road inspectors. The County of Simcoe works to keep their road segment assets at a PCI of 75 or higher.
Exhibit 14: Roads – PCI Decision Matrix Type of
Improvement Standard Cross-
Section Non- Standard Cross-Section
Cost per lane km
Adequate 75 75 - Micro-surfacing 65 – 75 65 – 75 $17,500 Pulverizing N/A 40 - 65 $100,000 Asphalt Cold-In-Place Recycling
40 - 65 N/A $100,000
Asphalt Expanded Recycling
40 - 65 N/A $150,000
Reconstruction < 5.1 < 5.1 $1,207,000
It should be noted that there are situations in which the PCI is not used to determine which roads require maintenance. These situations occur when a number of road segments on a County road in close proximity require maintenance. Cost efficiencies occur when consecutive road segments have maintenance performed on them at the same time. Therefore, road segments which may have reasonable PCIs are subject to maintenance as adjacent road segments are in poor condition.
All pavement deteriorates over time. Typically, pavement deteriorates at an ever-increasing rate. Microsurfacing and crack sealing are the two principal preventative maintenance treatments used to extend pavement life. These treatments have two main effects, in that they immediately improve the pavement condition and secondly, they affect the future rate of deterioration. In general, microsurfacing and crack sealing can slow the rate of deterioration by correcting small pavement defects before they can worsen and contribute to further defects. Beyond a certain point, however, defects become too large for correction by mere microsurfacing and crack sealing. At this point, rehabilitation treatments can be used to effect a correction of a large number of relatively severe defects, which provides a step increase in pavement condition.
Page 20
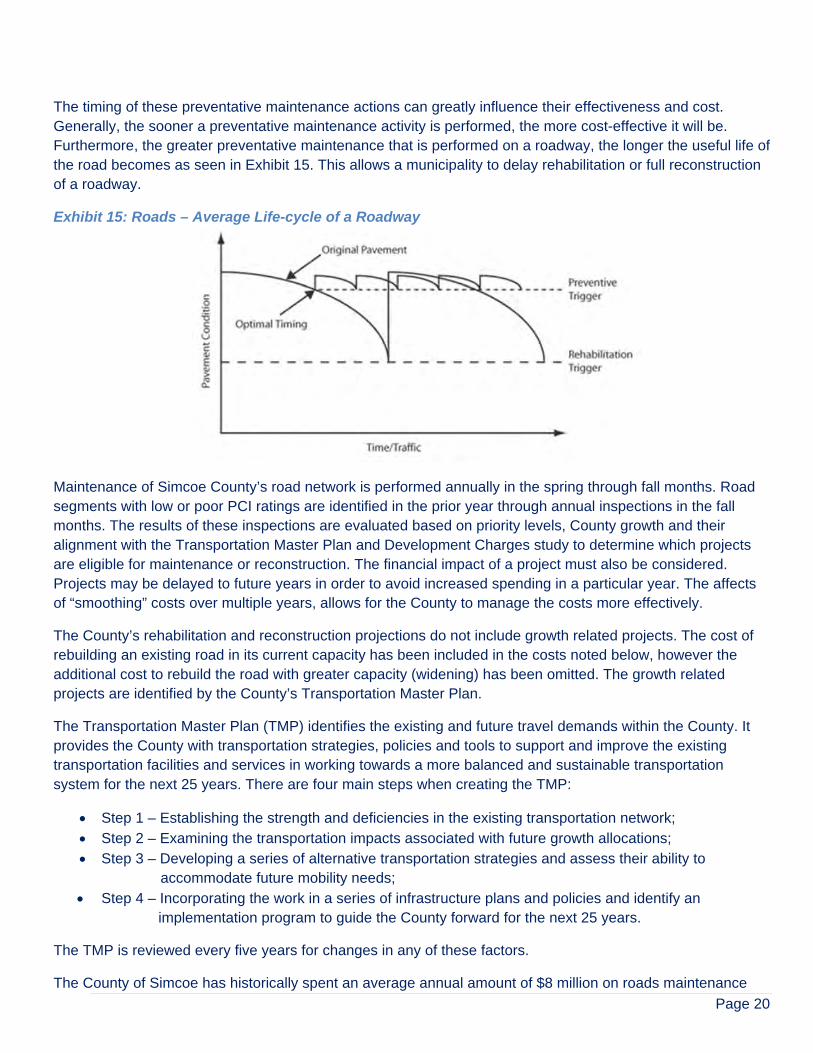
The timing of these preventative maintenance actions can greatly influence their effectiveness and cost. Generally, the sooner a preventative maintenance activity is performed, the more cost-effective it will be. Furthermore, the greater preventative maintenance that is performed on a roadway, the longer the useful life of the road becomes as seen in Exhibit 15. This allows a municipality to delay rehabilitation or full reconstruction of a roadway.
Exhibit 15: Roads – Average Life-cycle of a Roadway
Maintenance of Simcoe County’s road network is performed annually in the spring through fall months. Road segments with low or poor PCI ratings are identified in the prior year through annual inspections in the fall months. The results of these inspections are evaluated based on priority levels, County growth and their alignment with the Transportation Master Plan and Development Charges study to determine which projects are eligible for maintenance or reconstruction. The financial impact of a project must also be considered. Projects may be delayed to future years in order to avoid increased spending in a particular year. The affects of “smoothing” costs over multiple years, allows for the County to manage the costs more effectively.
The County’s rehabilitation and reconstruction projections do not include growth related projects. The cost of rebuilding an existing road in its current capacity has been included in the costs noted below, however the additional cost to rebuild the road with greater capacity (widening) has been omitted. The growth related projects are identified by the County’s Transportation Master Plan.
The Transportation Master Plan (TMP) identifies the existing and future travel demands within the County. It provides the County with transportation strategies, policies and tools to support and improve the existing transportation facilities and services in working towards a more balanced and sustainable transportation system for the next 25 years. There are four main steps when creating the TMP:
Step 1 – Establishing the strength and deficiencies in the existing transportation network; Step 2 – Examining the transportation impacts associated with future growth allocations; Step 3 – Developing a series of alternative transportation strategies and assess their ability to
accommodate future mobility needs; Step 4 – Incorporating the work in a series of infrastructure plans and policies and identify an
implementation program to guide the County forward for the next 25 years.
The TMP is reviewed every five years for changes in any of these factors.
The County of Simcoe has historically spent an average annual amount of $8 million on roads maintenance

Page 21
work performed on an average 144 lane km annually. This has helped to increase the current PCI figure to achieve an A grade rating. Forecasted maintenance requirements amounts to $5.8 million annually on average over the next ten years based on the County’s asset management software, RIVA. As seen in Exhibit 15, in the year 2024 there is a large maintenance requirement of $12.7 million. This suggests the County roads maintenance plan need to be moved to adjacent years to smooth the effects of the cost requirements in this particular year. The requirements in each year are been broken down into two treatments: microsurfacing and rehabilitation. On average, 57% of the maintenance performed relates to microsurfacing and 43% relates to rehabilitation. Rehabilitation is a more in-depth process and is therefore more costly.
The average annual requirement for reconstruction of roadways amounts to $6.2 million annually. There is currently a back-log of projects to be addressed in 2015, 2016 and 2017, which increases the ten year average as seen in Exhibit 15. Excluding years 2015, 2016 and 2017, the average annual road reconstruction requirement amounts to $4.6 million. The County has undertaken two major road reconstruction projects in recent years which accounts for the large increase in costs in 2015 - 2017. It is expected large projects will be taken on a more even pace in order to smooth the costs over neighbouring years. This will also smooth the burden of funding such large projects.
Exhibit 16: Roads – 10 Year Expense Forecast: 2015 – 2024
5.2 Transportation - Structures Structures are rehabilitated and replaced according to a strategy based on their current condition and age. On average, each structure undergoes a minor and major rehabilitation before being fully replaced. Based on theory and the County’s experience, these events occur at specific time in the structures asset life.
Structures undergo constant maintenance work to ensure they remain in sound condition. Maintenance activities include washing, sweeping and painting of structural steel, lubrication of bearings, cleaning of debris, sealing joints and asphalt repairs which all contribute to the quality of service a structure provides.
Minor structure rehabilitation and betterment projects address structures that are in generally good condition but have limited deterioration that create a structurally deficient component. Typically, minor rehabilitation projects repair deterioration allowing a structure to move out of structural deficient status. Work may include concrete deck patching, concrete deck overlay, waterproofing, paving, and traffic barrier upgrades. Major structure rehabilitation projects address components of a structure which have deteriorated significantly. Rehabilitation involves replacement of major structure elements such as the concrete deck, complete superstructure including the girders, along with upgrades to meet the current bridge codes and sometimes increases to carrying capacity. Structure replacement is required when deterioration of a structure is so
YearRoads Reconstruction Roads Rehabilitation
2015 11,412,855 6,159,024 2016 8,584,914 6,135,240 2017 9,921,777 5,497,778 2018 6,100,901 2,709,598 2019 3,136,320 5,638,544 2020 6,644,492 2,569,905 2021 5,396,384 5,192,406 2022 2,823,584 5,263,381 2023 2,549,058 6,613,053 2024 5,724,906 12,665,968
Total 62,295,192 58,444,897
Expenses

Page 22
significant that the structure has reached the end of its useful service life. The decision to replace a structure is chosen when the rehabilitation of individual structure components is more costly than a complete structure replacement.
The forecasted cost and age to which the effective age is set after rehabilitation occurs is outlined in Exhibit 17.
Exhibit 17: Structures – Maintenance Strategy
Bridge Type Minor Rehab Major Rehab Replacement
Age in Years
% of RC* Age in Years
% of RC* Age in Years
% of RC*
Arch 30 10% 45 25% 85 120% CSP Culvert 30 25% N/A N/A 60 100%
Parallel Box Beam 30 10% 45 50% 75 100% Post Tensioned
Circular Void 30 10% 45 25% 85 100%
R/C Culvert 30 25% 50 45% 85 100% Rigid Frame 30 10% 45 25% 85 100%
Slab on I Girders 30 10% 45 45% 75 100% Slab on T Girders 30 10% 45 45% 75 100%
Solid Slab 30 10% 45 45 / 25% 85 100% Truss 30 10% 45 45 / 30% 75 120%
*RC = Replacement Cost
An in-depth analysis of the construction requirements needed to perform the reconstruction or rehabilitation. This provides a detailed estimate of the cost of the project, which is used in the annual capital budget and long term plan. Once this cost is known, it is used as a projection of the total replacement cost of the structure.
Exhibit 18: Structures – 10 Year Capital Expense Forecast: 2015 – 2024
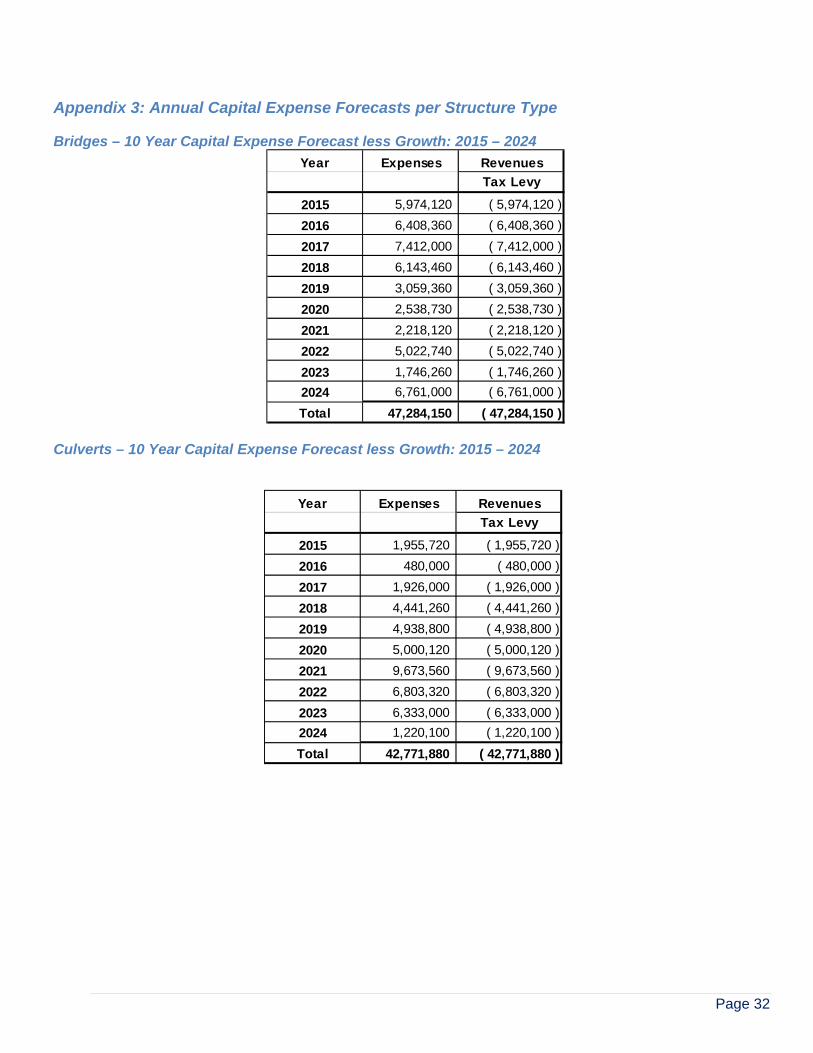
The average annual requirement to sustain Simcoe County’s structures is $9 million as seen in Exhibit 18, $4.7 million attributed to bridges and $4.3 million attributed to long span culverts per Appendix 3.
Year Expenses
2015 7,929,840
2016 6,888,360
2017 9,338,000
2018 10,584,720
2019 7,998,160
2020 7,538,850
2021 11,891,680
2022 11,826,060
2023 8,079,260
2024 7,981,100
Total 90,056,030

Page 23
6.0 Financial Strategy The County of Simcoe funds projects through a variety of sources. These include property taxation, federal/provincial grants and subsidies, capital reserves, development charge reserves, gas tax and grants when available. Depending on the type of project, specific types of funding are available. The County continues to review the cost of upcoming projects and its ability to fund them on an annual basis.
6.1 Property Taxation Property taxation is the main source of funding capital assets by the County of Simcoe. Taxable assessment is an indicator of fiscal capacity of the County to sustain the services and infrastructure needed to support the programs and services, as well as service levels, delivered to County residents. The amount required for municipal services is based on planned operating and capital expenditures net of all other revenue sources.
6.2 Development Charges Reserves Development charges are collected to recover the growth-related capital costs associated with residential and non-residential development that create the need for capital. As the majority of the County’s capital expenditures are growth related, development charges are a major source of financing. Certain projects include the rehabilitation or replacement of existing infrastructure with a growth component to accommodate greater capacity. Only the costs benefiting the existing infrastructure have been included in the asset management plan. The costs associated with the growth are outside of the scope of this plan. Therefore, development charges are not shown as a source of revenue in the County’s future forecasts found within the asset management plan.
6.3 Reserves Under the Municipal Act, Council has the authority to establish reserves as required. Reserves and reserve funds can be formed to meet specific liabilities such as replacement/rehabilitation or acquisition of capital assets.
The County uses reserves in order to mitigate the annual impacts to taxation as a result of significant fluctuations in annual capital needs. Any surpluses that occur during the year are strongly considered for allocation to capital reserves for future projects depending on competing needs. Reserves are of critical importance to the County’s ability to maintain and replace both planned and unseen infrastructure requirements.
Reserves accounts have been set up for the administration building, long term care homes, social housing facilities, solid waste management, museum facilities and roads and bridges construction projects. Refer to Appendix 4 for a description of each of the County’s reserve funds and the expected annual contribution in order to replenish the funds.
6.4 Debt Financing Section 401 of the Municipal Act grants Council the authority to issue debentures, when deemed in the best interest of the taxpayers, to finance its own capital expenditures.
“Best Interest” for the County of Simcoe will be consistent with the County’s Strategic Directions which includes fiscal management that contains both financial principles and policies.
This philosophy is also reflected in the County of Simcoe’s capital financing and debt policy as approved by Council in September 2011 where the following key objectives were set out:
Page 24
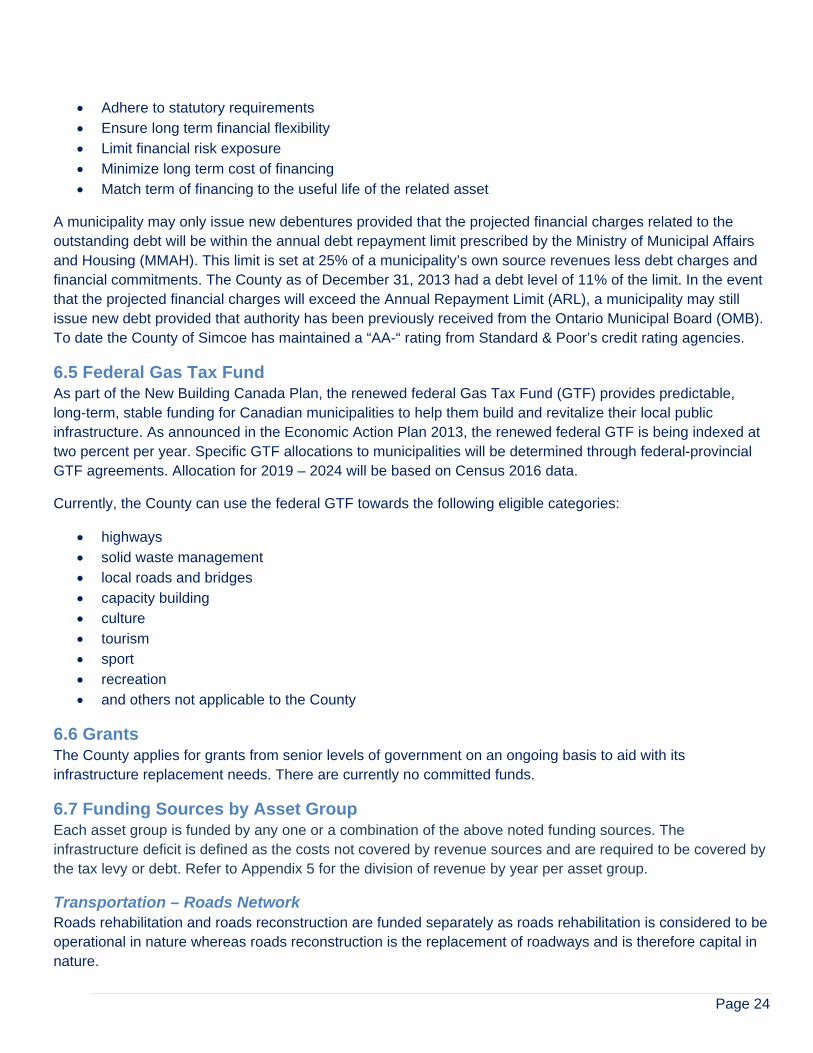
Adhere to statutory requirements Ensure long term financial flexibility Limit financial risk exposure Minimize long term cost of financing Match term of financing to the useful life of the related asset
A municipality may only issue new debentures provided that the projected financial charges related to the outstanding debt will be within the annual debt repayment limit prescribed by the Ministry of Municipal Affairs and Housing (MMAH). This limit is set at 25% of a municipality’s own source revenues less debt charges and financial commitments. The County as of December 31, 2013 had a debt level of 11% of the limit. In the event that the projected financial charges will exceed the Annual Repayment Limit (ARL), a municipality may still issue new debt provided that authority has been previously received from the Ontario Municipal Board (OMB). To date the County of Simcoe has maintained a “AA-“ rating from Standard & Poor’s credit rating agencies.
6.5 Federal Gas Tax Fund As part of the New Building Canada Plan, the renewed federal Gas Tax Fund (GTF) provides predictable, long-term, stable funding for Canadian municipalities to help them build and revitalize their local public infrastructure. As announced in the Economic Action Plan 2013, the renewed federal GTF is being indexed at two percent per year. Specific GTF allocations to municipalities will be determined through federal-provincial GTF agreements. Allocation for 2019 – 2024 will be based on Census 2016 data.
Currently, the County can use the federal GTF towards the following eligible categories:
highways solid waste management local roads and bridges capacity building culture tourism sport recreation and others not applicable to the County
6.6 Grants The County applies for grants from senior levels of government on an ongoing basis to aid with its infrastructure replacement needs. There are currently no committed funds.
6.7 Funding Sources by Asset Group Each asset group is funded by any one or a combination of the above noted funding sources. The infrastructure deficit is defined as the costs not covered by revenue sources and are required to be covered by the tax levy or debt. Refer to Appendix 5 for the division of revenue by year per asset group.
Transportation – Roads Network Roads rehabilitation and roads reconstruction are funded separately as roads rehabilitation is considered to be operational in nature whereas roads reconstruction is the replacement of roadways and is therefore capital in nature.

Page 25
Historically, roads rehabilitation has been funded by gas tax revenues and the levy at an annual average of $8.2 million from 2009 to 2013. Non-growth roads reconstruction costs have been historically funded by the tax levy, transfer from reserves and debt. The required cost to rehabilitate our roadways is $5.8 million annually as shown in Exhibit 19 and to reconstruct our roadways is $6.2 million annually as shown in Exhibit 20.
Exhibit 19: Roads Rehabilitation – 10 Year Capital Expense and Funding Forecast: 2015 – 2024
Exhibit 20: Roads Reconstruction – 10 Year Capital Expense and Funding Forecast: 2015 – 2024
Year Expenses Revenues
Gas Tax Fund / Tax Levy
2015 6,159,024 ( 6,159,024 )
2016 6,135,240 ( 6,135,240 )
2017 5,497,778 ( 5,497,778 )
2018 2,709,598 ( 2,709,598 )
2019 5,638,544 ( 5,638,544 )
2020 2,569,905 ( 2,569,905 )
2021 5,192,406 ( 5,192,406 )
2022 5,263,381 ( 5,263,381 )
2023 6,613,053 ( 6,613,053 )
2024 12,665,968 ( 12,665,968 )
Total 58,444,897 ( 58,444,897 )
Year Expenses RevenuesTransfer from
ReservesTax Levy
2015 11,412,855 ( 4,816,111 ) ( 6,596,744 )
2016 8,584,914 - ( 8,584,914 )
2017 9,921,777 - ( 9,921,777 )
2018 6,100,901 - ( 6,100,901 )
2019 3,136,320 - ( 3,136,320 )
2020 6,644,492 - ( 6,644,492 )
2021 5,396,384 - ( 5,396,384 )
2022 2,823,584 - ( 2,823,584 )
2023 2,549,058 - ( 2,549,058 )
2024 5,724,906 - ( 5,724,906 )
Total 62,295,192 ( 4,816,111 ) ( 57,479,081 )
Page 26
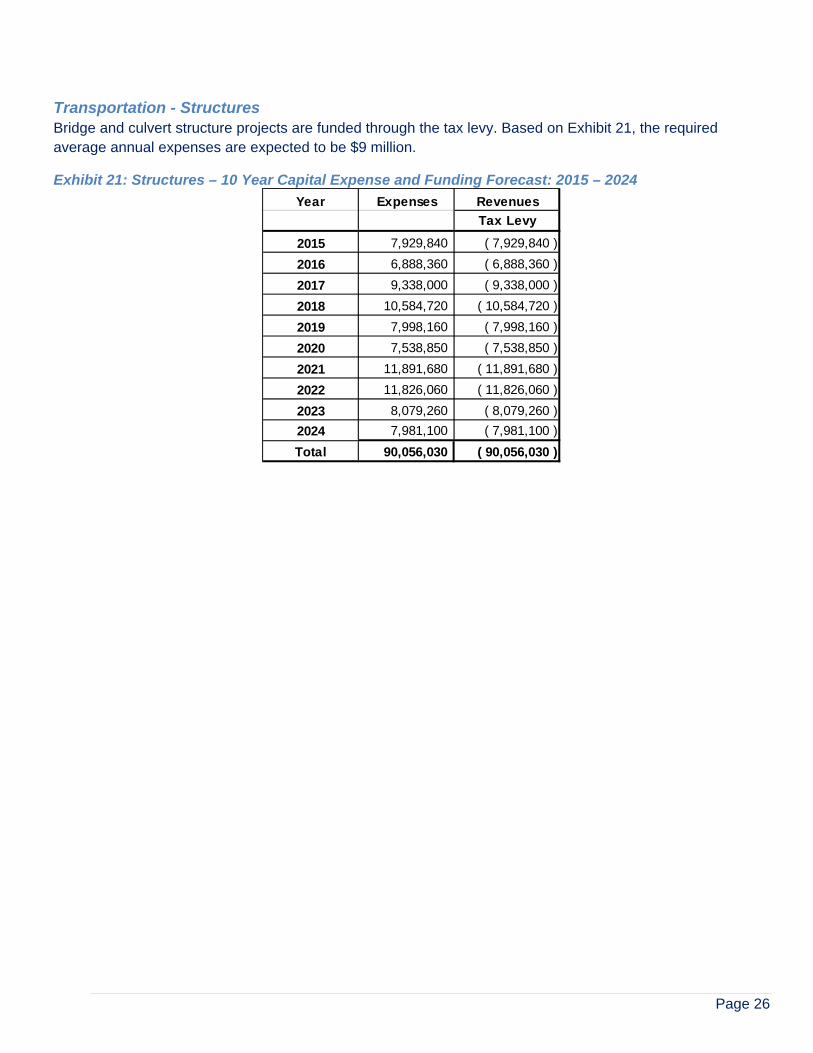
Transportation - Structures Bridge and culvert structure projects are funded through the tax levy. Based on Exhibit 21, the required average annual expenses are expected to be $9 million.
Exhibit 21: Structures – 10 Year Capital Expense and Funding Forecast: 2015 – 2024
Year Expenses Revenues
Tax Levy
2015 7,929,840 ( 7,929,840 )
2016 6,888,360 ( 6,888,360 )
2017 9,338,000 ( 9,338,000 )
2018 10,584,720 ( 10,584,720 )
2019 7,998,160 ( 7,998,160 )
2020 7,538,850 ( 7,538,850 )
2021 11,891,680 ( 11,891,680 )
2022 11,826,060 ( 11,826,060 )
2023 8,079,260 ( 8,079,260 )
2024 7,981,100 ( 7,981,100 )
Total 90,056,030 ( 90,056,030 )
Page 27
7.0 Conclusions and Recommendations The County owns $644 million worth of assets based on historical cost and have a replacement cost of $2.7 billion. In each category of assets addressed in the plan, the County has either met or exceeded the documented service levels allowing for the County’s assets to be maintained in good condition.
The County has made great advancements in the areas of identifying, recording and measuring its assets since the inception of the PSAB 3150, which required all assets to be recorded and measured by municipalities for the first time. The County has implemented reliable and sophisticated systems to assist in this area. The financial system (SAP) is fully integrated into the purchasing and recording of assets. Furthermore, the asset management system (RIVA) is tied into the annual budgets and updated regularly with condition results. Both systems are used by County departments and are continually being fine-tuned.
The County produces an annual capital Long Term Plan which is monitored and updated semi-annually, once during the spring, during the process of Strategic Planning sessions, and once during the annual budget process. This ensures it is clear how the County’s overall capital plans tie into the Official Plan and Transportation Master Plan. This process allows for staff to step back and rationalize financial strategies leveraging debt and reserves.
The County will be continuing to review our service levels to ensure they are consistent in approach across divisions and acceptable to residents. A review of each asset group will ensure that condition reviews are reasonable and that the deferment of any work forecasted is consistent with approved service levels.
Financing strategies – funding shortfalls, debt financing, grant allocations continue to be allocated in a pattern consistent with history and should be adjusted to take advantage of our newly acquired information and documented asset management strategy. As well reserves are continually monitored to ensure they meet our infrastructure needs. Debt has been primarily been allocated to major roads projects and initiatives.
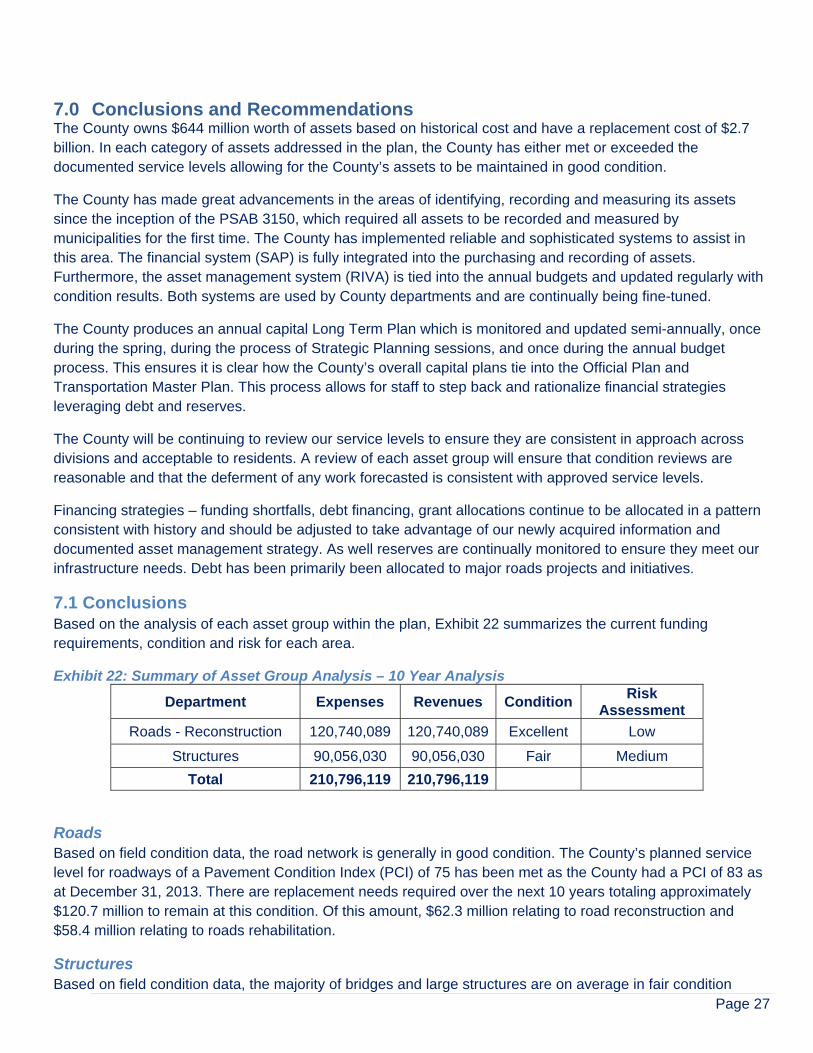
7.1 Conclusions Based on the analysis of each asset group within the plan, Exhibit 22 summarizes the current funding requirements, condition and risk for each area.
Exhibit 22: Summary of Asset Group Analysis – 10 Year Analysis
Department Expenses Revenues Condition Risk
Assessment
Roads - Reconstruction 120,740,089 120,740,089 Excellent Low
Structures 90,056,030 90,056,030 Fair Medium
Total 210,796,119 210,796,119
Roads Based on field condition data, the road network is generally in good condition. The County’s planned service level for roadways of a Pavement Condition Index (PCI) of 75 has been met as the County had a PCI of 83 as at December 31, 2013. There are replacement needs required over the next 10 years totaling approximately $120.7 million to remain at this condition. Of this amount, $62.3 million relating to road reconstruction and $58.4 million relating to roads rehabilitation.
Structures Based on field condition data, the majority of bridges and large structures are on average in fair condition
Page 28
currently. The County’s planned service level for structures is a Bridge Condition Index (BCI) of 60 or greater. This service level has been reached as the current BCI is 63. Over the next 10 years replacements required to structural, deck, or other elements totaling approximately $90 million.
County of Simcoe Infrastructure Balance Based on total forecasted non-growth capital expenditures for the period 2015 to 2024, the County of Simcoe requires an annual average of $15.2 million to maintain their existing road and structures infrastructure. It is expected that these costs will be funded through transfer from reserves, gas tax and the tax levy.
7.2 Recommendation The County is committed to increasing the validity and accuracy of its asset management plan for future iterations of the document. In order to achieve this, the following action items have been identified:
1. The condition assessment data, along with risk management strategies, should be reviewed together to aid in prioritizing overall needs for rehabilitation and replacement
2. Asset life cycle frameworks should be reviewed for accuracy by the County 3. Risk assessment should be provided on a more granular level for each asset and asset type
The County expects to improve the asset management plan over the next few years. This asset management plan should be viewed as the first step in a long range plan to improve the management of the County’s infrastructure. The County is committed to review and revising the asset management plan on a periodic basis as more information is available to establish updated annual investment needs.

Page 29
8.0 Appendices
Appendix 1: Asset Management Plan Implementation Matrix
PRIORITY/COMPLETION STATUS (0 Not Started, 1 Preliminary, 2 Complete) (A Highest Priority, B Medium, C Lowest)
Inve
ntor
y C
ompl
eten
ess
Inve
ntor
y M
easu
rmen
t/Val
uatio
n
Inve
ntor
y C
ompr
ehen
sive
ness
Inve
ntor
y R
epos
itory
Con
ditio
n Le
vels
Ser
vice
Lev
els
Man
agem
ent S
trat
egie
s
Fin
anci
ng S
trat
egie
s
Prio
rity
BUILDINGS ($68M/$38M)
Administration 2 2 2 2 2 1 0 2 B
Long Term Care 2 2 2 2 1
SWM 2 1 1 0 1
Roads Garages 2 2 2 2 2 1 0 0 C
Paramedic Stations 2 2 2 2 2 1 0 0 C
Public Buildings (Archives, Museum) 2 2 2 2 2 1 0 0 B
Social Housing 1 2 2 2 2 1 2 1 A
Other Buildings (rental prop, Bayfield st, sheds, OW) 1 1 1 1 1/2 1 0 0 C
INFRASTRUCTURE ($404M/$223M)
Roads Construction 2 1 2 1 2 1 1 1 A
Roads Maintenance 2 2 2 2 2 2 2 1 A
Bridges 2 2 2 2 2 1 1 1 A
SWM Sites 2 2 1 0 0* 1 0 0 B
VEHICLES ($30M/$14M)
Paramedic 1 2 2 2 0 1 1 1 B
Roads 1 2 2 2 0 1 0 0 C
SWM 1 2 2 2 0 1 0 0 C
Other 1 2 2 2 0 1 0 0 C

Page 30
Appendix 1: Asset Management Plan Implementation Matrix (continued)
PRIORITY/COMPLETION STATUS (0 Not Started, 1 Preliminary, 2 Complete) (A Highest Priority, B Medium, C Lowest)
Inve
ntor
y C
ompl
eten
ess
Inve
ntor
y M
easu
rmen
t/Val
uatio
n
Inve
ntor
y C
ompr
ehen
sive
ness
Inve
ntor
y R
epos
itory
Con
ditio
n Le
vels
Ser
vice
Lev
els
Man
agem
ent S
trat
egie
s
Fin
anci
ng S
trat
egie
s
Prio
rity
LAND IMPROVEMENTS ($19M/$7M)
Pavement (parking lots) 2 1 2 0 0 0 0 0 C
Landfill Cells 2 1 2 0 0 0 0 0 B
MACHINERY FURN FIXT ($7M/$3M)
Furniture (Pooled)
Defib, Roll off bins, 1 1 1 0 0 0 0 0 C
Statutory Equip (beds, elevators, strechers,ex 1 1 1 0 0 0 0 0 B
LTC Mechanical Safety Systems
INFORMATION TECHNOLOGY ($12M/$4M)
Software 2 2 2 0 0 0 0 0 C
Hardware 1 2 1 0 0 1 0 0 C
LAND
Land
Page 31
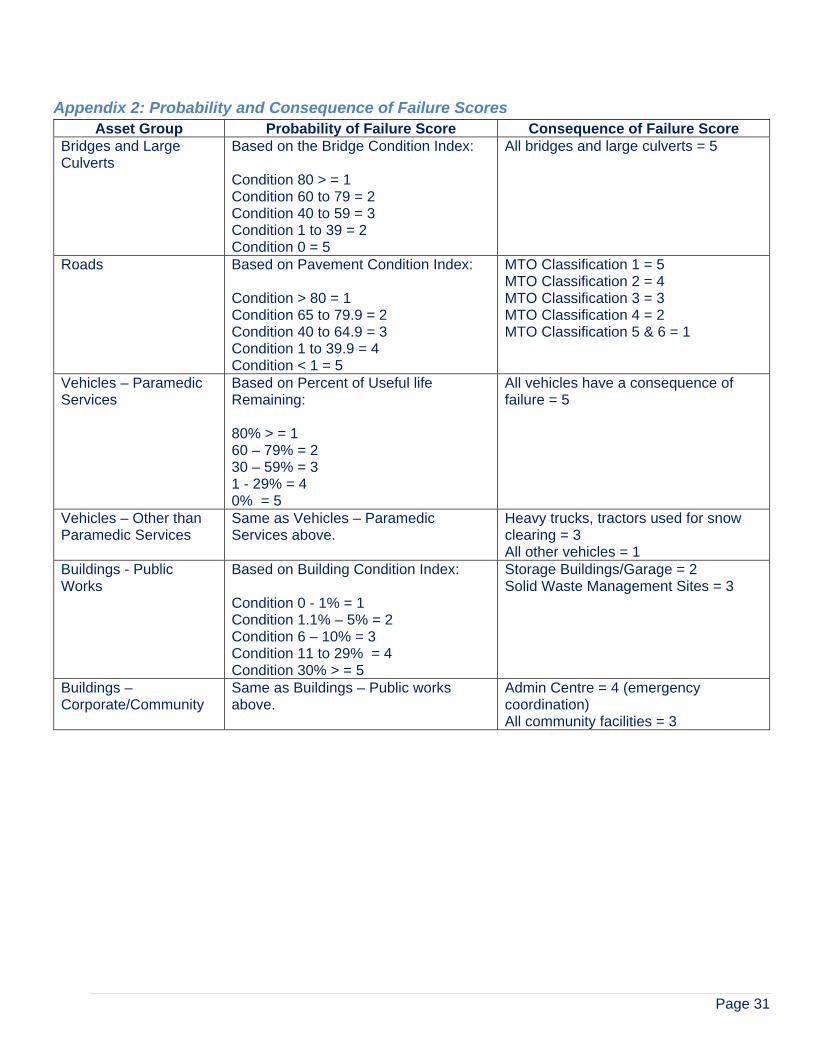
Appendix 2: Probability and Consequence of Failure Scores Asset Group Probability of Failure Score Consequence of Failure Score
Bridges and Large Culverts
Based on the Bridge Condition Index: Condition 80 > = 1 Condition 60 to 79 = 2 Condition 40 to 59 = 3 Condition 1 to 39 = 2 Condition 0 = 5
All bridges and large culverts = 5
Roads Based on Pavement Condition Index: Condition > 80 = 1 Condition 65 to 79.9 = 2 Condition 40 to 64.9 = 3 Condition 1 to 39.9 = 4 Condition < 1 = 5
MTO Classification 1 = 5 MTO Classification 2 = 4 MTO Classification 3 = 3 MTO Classification 4 = 2 MTO Classification 5 & 6 = 1
Vehicles – Paramedic Services
Based on Percent of Useful life Remaining: 80% > = 1 60 – 79% = 2 30 – 59% = 3 1 - 29% = 4 0% = 5
All vehicles have a consequence of failure = 5
Vehicles – Other than Paramedic Services
Same as Vehicles – Paramedic Services above.
Heavy trucks, tractors used for snow clearing = 3 All other vehicles = 1
Buildings - Public Works
Based on Building Condition Index: Condition 0 - 1% = 1 Condition 1.1% – 5% = 2 Condition 6 – 10% = 3 Condition 11 to 29% = 4 Condition 30% > = 5
Storage Buildings/Garage = 2 Solid Waste Management Sites = 3
Buildings – Corporate/Community
Same as Buildings – Public works above.
Admin Centre = 4 (emergency coordination) All community facilities = 3
Page 32
Appendix 3: Annual Capital Expense Forecasts per Structure Type
Bridges – 10 Year Capital Expense Forecast less Growth: 2015 – 2024
Culverts – 10 Year Capital Expense Forecast less Growth: 2015 – 2024
Year Expenses Revenues
Tax Levy
2015 5,974,120 ( 5,974,120 )
2016 6,408,360 ( 6,408,360 )
2017 7,412,000 ( 7,412,000 )
2018 6,143,460 ( 6,143,460 )
2019 3,059,360 ( 3,059,360 )
2020 2,538,730 ( 2,538,730 )
2021 2,218,120 ( 2,218,120 )
2022 5,022,740 ( 5,022,740 )
2023 1,746,260 ( 1,746,260 )
2024 6,761,000 ( 6,761,000 )
Total 47,284,150 ( 47,284,150 )
Year Expenses Revenues
Tax Levy
2015 1,955,720 ( 1,955,720 )
2016 480,000 ( 480,000 )
2017 1,926,000 ( 1,926,000 )
2018 4,441,260 ( 4,441,260 )
2019 4,938,800 ( 4,938,800 )
2020 5,000,120 ( 5,000,120 )
2021 9,673,560 ( 9,673,560 )
2022 6,803,320 ( 6,803,320 )
2023 6,333,000 ( 6,333,000 )
2024 1,220,100 ( 1,220,100 )
Total 42,771,880 ( 42,771,880 )
Page 33
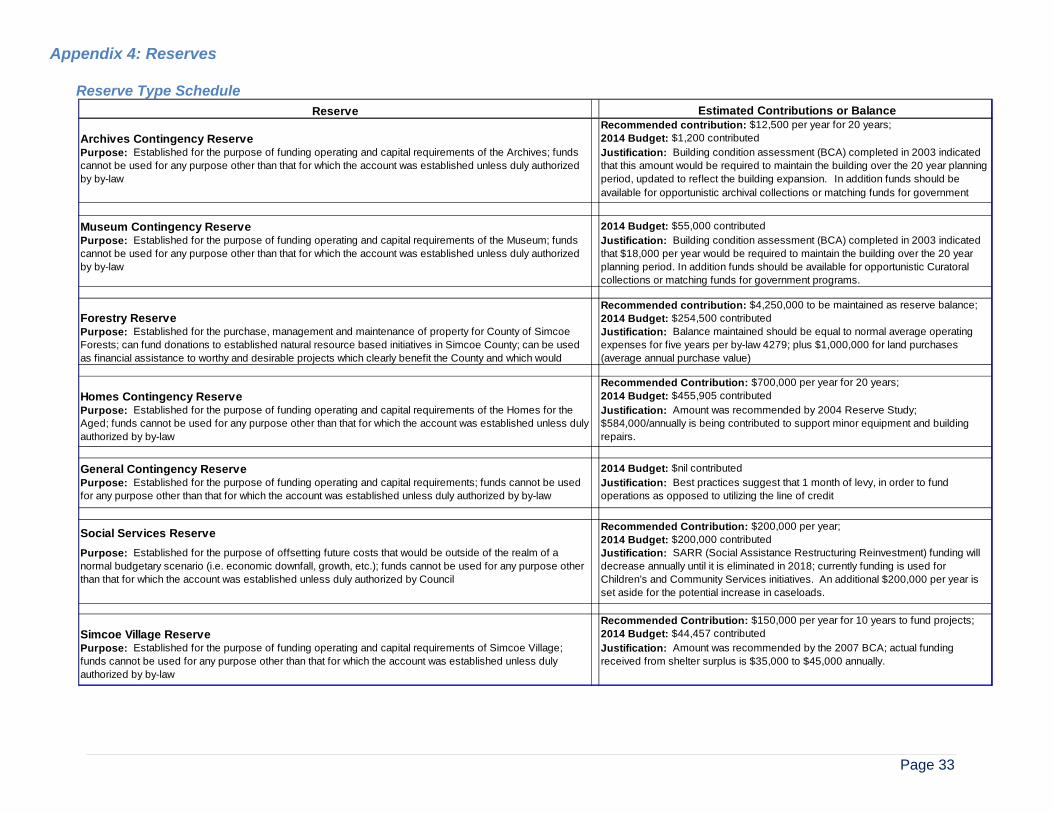
Appendix 4: Reserves Reserve Type Schedule
Estimated Contributions or Balance
Archives Contingency ReserveRecommended contribution: $12,500 per year for 20 years; 2014 Budget: $1,200 contributed
Justification: Building condition assessment (BCA) completed in 2003 indicated that this amount would be required to maintain the building over the 20 year planning period, updated to reflect the building expansion. In addition funds should be available for opportunistic archival collections or matching funds for government
Museum Contingency Reserve 2014 Budget: $55,000 contributed
Justification: Building condition assessment (BCA) completed in 2003 indicated that $18,000 per year would be required to maintain the building over the 20 year planning period. In addition funds should be available for opportunistic Curatoral collections or matching funds for government programs.
Forestry ReserveRecommended contribution: $4,250,000 to be maintained as reserve balance; 2014 Budget: $254,500 contributedJustification: Balance maintained should be equal to normal average operating expenses for five years per by-law 4279; plus $1,000,000 for land purchases (average annual purchase value)
Homes Contingency ReserveRecommended Contribution: $700,000 per year for 20 years; 2014 Budget: $455,905 contributed
Justification: Amount was recommended by 2004 Reserve Study; $584,000/annually is being contributed to support minor equipment and building repairs.
General Contingency Reserve 2014 Budget: $nil contributed
Justification: Best practices suggest that 1 month of levy, in order to fund operations as opposed to utilizing the line of credit
Social Services ReserveRecommended Contribution: $200,000 per year; 2014 Budget: $200,000 contributedJustification: SARR (Social Assistance Restructuring Reinvestment) funding will decrease annually until it is eliminated in 2018; currently funding is used for Children’s and Community Services initiatives. An additional $200,000 per year is set aside for the potential increase in caseloads.
Simcoe Village ReserveRecommended Contribution: $150,000 per year for 10 years to fund projects; 2014 Budget: $44,457 contributed
Justification: Amount was recommended by the 2007 BCA; actual funding received from shelter surplus is $35,000 to $45,000 annually.
Reserve
Purpose: Established for the purpose of funding operating and capital requirements of the Archives; funds cannot be used for any purpose other than that for which the account was established unless duly authorized by by-law
Purpose: Established for the purpose of funding operating and capital requirements of the Museum; funds cannot be used for any purpose other than that for which the account was established unless duly authorized by by-law
Purpose: Established for the purchase, management and maintenance of property for County of Simcoe Forests; can fund donations to established natural resource based initiatives in Simcoe County; can be used as financial assistance to worthy and desirable projects which clearly benefit the County and which would
Purpose: Established for the purpose of funding operating and capital requirements of the Homes for the Aged; funds cannot be used for any purpose other than that for which the account was established unless duly authorized by by-law
Purpose: Established for the purpose of funding operating and capital requirements; funds cannot be used for any purpose other than that for which the account was established unless duly authorized by by-law
Purpose: Established for the purpose of offsetting future costs that would be outside of the realm of a normal budgetary scenario (i.e. economic downfall, growth, etc.); funds cannot be used for any purpose other than that for which the account was established unless duly authorized by Council
Purpose: Established for the purpose of funding operating and capital requirements of Simcoe Village; funds cannot be used for any purpose other than that for which the account was established unless duly authorized by by-law

Page 34
Estimated Contributions or Balance
Roads Contingency Reserve 2014 Budget: $nil contributed
Justification: Based on Roads and Bridge long term infrastructure requirements. These have been identified in the Transportation Master Plan and have been incorporated in the 2011 Development Charge background study. Further investigation and analysis is being done to determine the appropriate annual
t ib ti l l
Paramedic Contingency ReserveRecommended Contribution: $100,000 per year; 2014 Budget: $100,000 contributed.
Justification: To provide for the future replacement of defibrillators.
Administration Building Contingency ReserveRecommended Contribution: $150,000 per year for 20 years; 2014 Budget: $150,000 contributed.
Justification: BCA completed in 2006 indicated that this amount would be required to maintain the building over the 20 year planning period, updated to reflect the building expansion
Huronia Tourism ReserveRecommended Contribution: $72,000 to be maintained as balance; 2014 Budget: $nil contributed
Justification: Good financial practices suggest a balance equalling one year's revenue. Funds should be available to be able to participate in opportistic program that promote area tourism.
Social Housing ReserveRecommended contribution: (operating, capital and reserve) $15,605,000 per year; 2014 Budget: (operating, capital and reserve) $8,481,600 contributedJustification: BCA completed for LHC and NP properties in 2011 recommended $15.3M for future capital costs annually; In 2013, $7,691.2K was budgeted annually. In 2014, an additional $790.4K is to be contributed, of which $541.5K is to NP. Additionally, an increase of $30,700 related to the Bradford Surplus and a net increase of $218,200 comprised of a decrease of $563,800 to Facility costs and an increase of $782,00 contributed to capital assets.
Waste Management Contingency Reserve 2014 Budget: $2,275,000 contributed
Justification: To cover costs relating to dramatic changes in government policy, environmental site issues, unplanned capital requirements, and to smooth the tax impact on long term solutions for residuals disposal and/or processing capacity.
Sunset Village ReserveRecommended Contribution: $165,000 per year for 10 years to fund projects; 2014 Budget: $24,456 contributed
Justification: Amount was indicated by the 2007 BCA; actual funding received from sale of life lease suites and any annual operating surplus.
Economic Development & Planning 2014 Budget: $10,000 contributed
Justification: To ensure the Economic Development & Planning Reserve remains adequate to take advantage of funding opportunities as they become available.
Reserve
Purpose: Established for the purpose of enhancing future economic development initiatives and funding potential future capital projects; funds cannot be used for any purpose other than that for which the account was established unless duly authorized by Council
Purpose: Established for the purposes of funding roads related capital and operating expenditures such as reconstruction or rehabilitation of roads or bridges; the reserve can be utilized to take advantage of funding opportunities from senior levels of government. Funds cannot be used for any purpose other than that for which the account was established unless duly authorized by by-law
Purpose: Established for the purpose of funding operating and capital requirements for Paramedic Services; funds cannot be used for any purpose other than that for which the account was established unless duly authorized by by-law
Purpose: Established for the purpose of funding operating and capital requirements of the Administration Building; funds cannot be used for any purpose other than that for which the account was established unless duly authorized by by-law
Purpose: Established for the purpose of funding operating and capital requirements of Tourism Simcoe County (formerly known as Huronia Tourism Association); funds cannot be used for any purpose other than that for which the account was established unless duly authorized by by-law
Purpose: Established for the purpose of funding operating and capital requirements for Local Housing Corporation (LHC) or non profit (NP) housing; funds cannot be used for any purpose other than that for which the account was established unless duly authorized by by-law
Purpose: Established for the purpose of funding operating and capital requirements of Solid Waste Management; funds cannot be used for any purpose other than that for which the account was established unless duly authorized by by-law
Purpose: Established for the purpose of funding operating and capital requirements of Sunset Village; funds cannot be used for any purpose other than that for which the account was established unless duly authorized by by-law
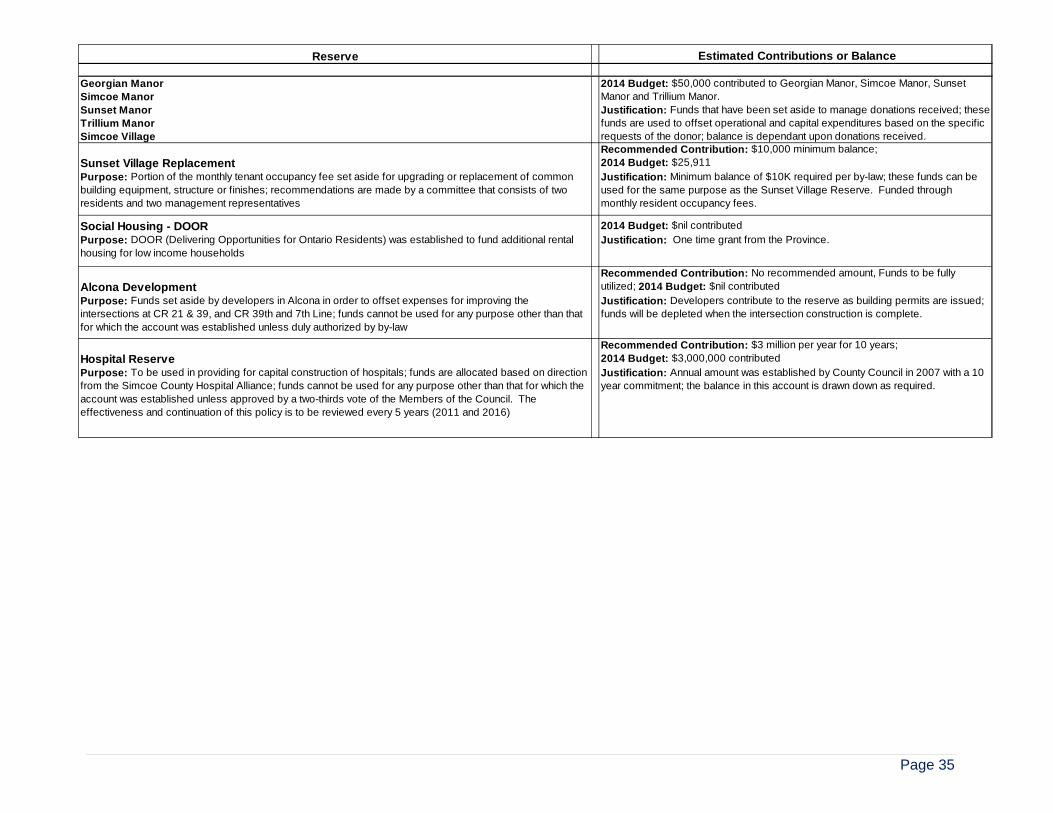
Page 35
Estimated Contributions or Balance
Georgian ManorSimcoe ManorSunset ManorTrillium ManorSimcoe Village
Sunset Village ReplacementRecommended Contribution: $10,000 minimum balance; 2014 Budget: $25,911
Justification: Minimum balance of $10K required per by-law; these funds can be used for the same purpose as the Sunset Village Reserve. Funded through monthly resident occupancy fees.
Social Housing - DOOR 2014 Budget: $nil contributed
Justification: One time grant from the Province.
Alcona DevelopmentRecommended Contribution: No recommended amount, Funds to be fully utilized; 2014 Budget: $nil contributed
Justification: Developers contribute to the reserve as building permits are issued; funds will be depleted when the intersection construction is complete.
Hospital ReserveRecommended Contribution: $3 million per year for 10 years; 2014 Budget: $3,000,000 contributed
Justification: Annual amount was established by County Council in 2007 with a 10 year commitment; the balance in this account is drawn down as required.
Reserve
2014 Budget: $50,000 contributed to Georgian Manor, Simcoe Manor, Sunset Manor and Trillium Manor. Justification: Funds that have been set aside to manage donations received; these funds are used to offset operational and capital expenditures based on the specific requests of the donor; balance is dependant upon donations received.
Purpose: Portion of the monthly tenant occupancy fee set aside for upgrading or replacement of common building equipment, structure or finishes; recommendations are made by a committee that consists of two residents and two management representatives
Purpose: Funds set aside by developers in Alcona in order to offset expenses for improving the intersections at CR 21 & 39, and CR 39th and 7th Line; funds cannot be used for any purpose other than that for which the account was established unless duly authorized by by-law
Purpose: To be used in providing for capital construction of hospitals; funds are allocated based on direction from the Simcoe County Hospital Alliance; funds cannot be used for any purpose other than that for which the account was established unless approved by a two-thirds vote of the Members of the Council. The effectiveness and continuation of this policy is to be reviewed every 5 years (2011 and 2016)
Purpose: DOOR (Delivering Opportunities for Ontario Residents) was established to fund additional rental housing for low income households
Page 36
9.0 Glossary: Book Value – The value at which an asset is carried on a balance sheet. To calculate, take the original cost of the asset less the accumulated depreciation.
Historical Cost – A measure of value in which the price of an asset on the balance sheet is based on its original acquisition cost when acquired by the company. If the asset was assumed was downloaded or uploaded to the County from the province or a lower tier municipality, the historical cost is estimated to be the replacement cost at the time of the transaction.
Replacement Cost – The actual cost to replace an asset in new condition in current dollars.
Historical Spending – The total costs associated with a specific asset or asset group incurred between a specific range in dates or from the purchase of the asset.
Page 37
10.0 Significant Assumptions
1. Growth in the County was not included in this version of the asset management plan.
2. Land associated with any of the asset groups discussed was not included in the asset management plan.
3. This includes the land under roads, structures and facilities.
4. All costs are shown in current dollars and are not inflated over time.
5. All asset inventories are assumed to be reasonably complete and accurate.