assessments of elastic anisotropy of banded amphibolite as...
TRANSCRIPT

Journal of Geoscience and Environment Protection, 2015, 3, 62-71 Published Online July 2015 in SciRes. http://www.scirp.org/journal/gep http://dx.doi.org/10.4236/gep.2015.35008
How to cite this paper: Esamaldeen, A., Wu, G. and Nuha, M. (2015) Assessments of Elastic Anisotropy of Banded Amphi-bolite as a Function of Cleavage Orientation Using S- and P-Wave Velocity. Journal of Geoscience and Environment Protec-tion, 3, 62-71. http://dx.doi.org/10.4236/gep.2015.35008
Assessments of Elastic Anisotropy of Banded Amphibolite as a Function of Cleavage Orientation Using S- and P-Wave Velocity Ali Esamaldeen1*, Guang Wu2, Mohamed Nuha1 1Faculty of Petroleum and Minerals, Al Neelain University, Khartoum, Sudan 2Faculty of Geosciences and Environmental Engineering, Southwest Jiaotong University, Chengdu, China Email: *[email protected] Received 10 March 2015; accepted 10 July 2015; published 17 July 2015
Abstract As most rocks are of an anisotropic nature, the measurement elastic modulus of anistropic rocks is of general interest. Nevertheless, uniaxial compression test is common method to measure the dynamic elastic constants of anisotropic rocks; the use of ultrasonic pulse test is attractive, be-cause the test is non-destructive and easy to apply. This study aimed to demonstrate the influence of orientation of foliation planes of banded amphibolite rocks on the compressional (Vp), shear wave (Vs) velocities propagating and elastic modules using ultrasonic pulse test. The result showed that the planes of foliation have a major effect on the wave velocity, where the Vp and Vs were taken parallel to the foliation plane show higher values than those obtained in the other di-rections (β = 30˚, 60˚ and 90˚). The preliminary conclusions are developed concerning that the elastic modulus is vary continuously as a function of cleavage orientation with respect to the di-rection of wave propagations, where Poisson’s ratio having the smallest relative change. The highest values of Young’s modulus and shear modulus are observed for foliation dip angles of 0˚ and the lowest values are for foliation dip angles of 90˚. This indicates that the observed intrinsic anisotropy and the close relations of the directional dependent seismic anisotropy to the foliation planes are mainly a result of crystallographic preferred orientation of major minerals (e.g. horn- blende and elongated quarts grains).
Keywords Anisotropic, Elastic Modulus, Foliation, P- and S-Waves, Ultrasonic Pulse
1. Introduction By adopting both theoretical and experimental approaches, several authors reported that the anisotropy of me-tamorphic rocks plays crucial role in the planning and design of civil and mining engineering structures [1]-[7]. The preferred orientation of external dimension and/or internal lattice of minerals due to differential mineral
*Corresponding author.

A. Esamaldeen et al.
63
growth and/or rotation of preexisting mineral grains in a non-uniform stress field can define anisotropy of me-tamorphic rocks. In such rocks, preferred orientation of minerals and cracks are highly anisotropic to seismic waves. However, for an understanding and interpretation of rock anisotropy in the rock engineering, laboratory studies in elastic anisotropy considered of great importance [8].
The dynamic elastic constants normally evaluated in the laboratory using a conventional uniaxial compressive test often with strain gauges stuck on cylindrical samples [9]. The compressive strength is the capacity of a ma-terial to withstand axially directed compressive forces. In such test, especially in anisotropic rocks, it is neces-sary to test specimens drilled in varying directions relative to the weakness plane of the rock that it is tedious and expensive procedure. Alternatively, the ultrasonic test system is used to determine P-and S-wave velocities and consequently the strain elastic constants. It is an attractive procedure since it is non-destructive, non-intru- sive, and easy to perform and is increasingly being used in geotechnical and mining engineering [10]-[12]. Var-ious researchers have found that the sound velocity of rocks relates closely to the intact rock properties [13]-[17]. Additionally the most influencing parameters are grain size and shape, density, porosity, anisotropy, pore water, temperature, weathering and alteration zones.
In order to extend earlier investigations into the intrinsic nature of rock anisotropy, this study emphasizes on the elastic anisotropy of banded amphibolite that indicated by their P- and S-wave velocities as a function of ve-locity anisotropy. This emphasis is placed on the relationship between the directional dependence of compres-sional (Vp) and shear wave velocities (Vs) and the foliation plane of the rocks. In addition, a foremost focus of the study is to elucidate the pronounced relationship between the crystallographic fabric (foliation plane) and the dynamic elastic constants (Young’s modulus and Poisson’s ratio) in a simplified model. Young’s modulus is modulus of elasticity measuring of the stiffness of a rock material, similar to strength, and it varies widely with rock type. For extremely hard and strong rocks, it can be as high as 100 GPa. Poisson’s ratio measures the ratio of lateral strain to axial strain, at linearly-elastic region. For most rocks, the Poisson’s ratio is between 0.15 and 0.4. At later stage of loading beyond linearly elastic region, lateral strain increases faster than the axial strain and hence leads to a higher ratio.
2. Experimental Methodologies 2.1. Rock Samples Preparation Initially, twenty-four rock samples were prepared using large size blocks of banded amphibolite, which were collected from varied rock slopes along Chengdu-wenchuan highway in Sichuan province in china for laborato-ry investigation. These rocks were selected due to their high rock-fabric complexity and their high significance impact in rock engineering design. Macroscopically, the rocks exhibit a distinct planar syn-metamorphic fabric that characterized with near perfect tectonic metamorphic layering and mineral alignment/elongation (schistosity) and penetrative stretching lineation. The foliation bands varying in thickness from 1 to 3 mm and stretched to a length of 5 mm (Figure 1(a)).
Figure 1. (a) Angle of weakness plane measured from major loading direction. (b) Amphibo-lite specimens prepared at different orientation angles.

A. Esamaldeen et al.
64
For the laboratory test, the collected rock blocks were trimmed with their side’s perpendicular to each other to facilitated coring in at different angles. A total of eighty five cylindrical specimens of length to diameter ration equal to 2 were cored at different orientation of anisotropy planes β (0˚, 30˚, 60˚ and 90˚) (Figure 1(b)). Rock specimens were cored using conventional laboratory drilling machine and the ends trimmed as required as per the [18] standards. After coring, the rock specimens were further smoothened using a lathe to avoid end effects. The specimens were dried at 105˚C for 24 h to remove the moisture. The density is determined for core speci-mens following the standard test procedures outlined in [18] (Table 1).
2.2. Microscopic Description Obtaining a reliable relationship is contingent on an effective petrographic study of the rockcore samples. Thus, to evaluate the petrography and petro-fabric of the studied rocks, thin sections across and along the schistosity were prepared and observed under a high power polarized microscope. The mineral assemblage and texture
Table 1. Density, P- and S-wave velocity, and elastic modulus for amphibolite rocks.
Sample No.
Core Orientation (o)
Density (G/cm3)
Vp (m/s)
Vs (m/s) Vp/Vs
Young’s modulus (E)
Poisson’s ratio (v)
Shear modulus (G)
1A-2 90 2.83
4384 2340 1.9 40,314 0.301 15,496
1A-6 0 4843 2628 1.8 50,478 0.291 19,545
8A-2 90 2.86
4591 2945 1.6 57,071 0.150 24,805
8A-6 0 5441 3108 1.8 68,528 0.258 27,240
8B-3 90 2.87
4537 3007 1.5 57,523 0.108 25,951
8B-5 0 4629 3014 1.5 60,056 0.132 26,526
9B-3 90 2.73
4669 3096 1.5 57,968 0.108 26,168
9B-6 0 4745 2606 1.8 48,136 0.284 18,744
1C-3 90 2.83
4628 2766 1.7 52,923 0.222 21,652
1C-4 0 4996 2938 1.7 59,944 0.236 24,255
4-3 90 2.8
4691 2993 1.6 58,027 0.157 25,083
4-4 0 4840 3080 1.6 61,389 0.160 26,467
12-1 90
2.83
4231 2454 1.7 42,488 0.247 17,043
12-6 0 4441 2804 1.6 49,980 0.169 21,386
12-9 30 4396 2844 1.5 51,824 0.140 22,728
12-12 60 4218 2866 1.5 49,449 0.071 23,081
13-1 90
2.73
4270 2727 1.6 46,921 0.156 20,302
13-5 0 4984 3100 1.6 61,469 0.185 25,947
13-8 30 4442 2820 1.6 50,473 0.162 21,710
13-11 60 4952 2780 1.4 43,097 0.010 21,330
14-1 90
2.95
4904 2924 1.7 61,753 0.224 25,222
14-4 0 5331 3178 1.7 72,462 0.224 29,592
14-8 30 5186 3066 1.7 67,829 0.231 27,543
14-11 60 4800 2900 1.7 59,759 0.213 24,641
15-1 90
2.81
4477 2727 1.6 50,364 0.205 20,897
15-6 0 4703 2828 1.7 55,275 0.217 22,713
15-9 30 4776 2799 1.7 54,333 0.238 21,936
15-11 60 4605 2827 1.6 53,981 0.198 22,537

A. Esamaldeen et al.
65
characteristics of the typical rocks may vary within the meter scale. However, slight compositional heterogenei-ty may found down to the centimeter scale. Figure 2 shows the microscopic textural variations of visually se-lected rock subtype samples of amphibolite rocks, which is considered as amphibolite schist based on its mineral assemblage of low-grade metamorphism. Although it can be classified as amphibolite gneiss texturally based on the alternative felsic and mafic minerals, which is preserved in the gneissosity texture.
The predominant mineralogical composition is almost hornblende, actinolite, quartz and feldspar with minor amounts of epidote, biotite, chlorite and calcite. Microscopic descriptions of thin sections show that the rock samples contain varying proportions of nematoblastic hornblende set in a fine-to medium-grained quartz-pla- gioclase mosaic. Furthermore, the main microstructure is characterized by well-developed layered lattice struc-ture that defined by strong crystallographic preferred orientation of hornblende (Figure 2(a) and Figure 2(b)) and elongated quartz grains in quartz rich zone (Figure 3(c) and Figure 3(d)). Aligned xenoblastic hornblende crystals form the bulk of the rock that average is 0.15 mm, although large crystals reach 0.3 mm, and they usually contain numerous small inclusions of quartz (Figure 2(a) and Figure 2(c)).
Figure 2. Optical micrographs of thin sections showing the microstructural characteristics of the investigated rocks, crossed polars. Thin sections were cut perpendicular to the foliation plane. (a) nematoblastic hornblende set in medium-grained quartz-plagioclase mosaic, (b) well-developed foliated fine-graind amphibolite shows porphyroblasts of quarts and plagioclase and rod-shaped hornblende defines the lineation within the foliation plane, (c) and (d) quartz rich medium-grained amphibolite, (e) and (f) fine-grained epidote amphibolite schist.

A. Esamaldeen et al.
66
Figure 3. Ultrasonic S-/P-wave tester consists of a pulse generator unit; trans-mitter and receiver transducers to measure the sonic pulse velocity. The trans-mitter and the receiver are positioned at the ends of each core specimen and the travel time of the pulse wave is measured.
Apparently, the orientation of the mineral inclusions is generally controlled by the cleavage of the host
hornblende. In some thin sections, numerous porphyroblasts of quarts and plagioclase considerably deflect the schistosity plane (Figure 2(b)). Prismatic (Hornblende and actinolite) minerals are occurring in alternate order with respect to quartz felspathic bands (Figure 2(a)). The overall symmetry of the hornblende fabric is orthor-hombic with the foliation as the symmetry plane. The alignment of the rod-shaped hornblende minerals defines the lineation within the foliation plane (Figure 2(d)). Some parts of fine-grained amphibolite composed almost entired of small granular epidote crystals and the hornblende has altered to stellate aggregates of fibrous actino-lite and chlorite (Figure 2(f)). Granular epidote crystals are concentrated in parallel bands upto 1 mm. thick or occurred in sub circular or elliptical shape (Figure 2(e) and Figure 2(f)). The presence of chlorite and epidote along with the aforementioned mineral assemblage suggests that the rock belongs to low grade regional meta-morphic facies. The accessory minerals include calcite, apatite, sphene and iron oxide.
2.3. Ultrasonic Pulse Test Ultrasonic test is used as a method to determine the velocity of propagation of P and S waves in laboratory cy-lindrical core samples and then to determine the elastic symmetry of anisotropic rocks. In this technique, the frequency of wave should be high and rock specimens should have infinite extent compared to the wavelength of the pulses. Twenty-four cylindrical rock samples were prepared by cutting and lapping the ends and the length is measured for each. An ultrasonic digital indicator consist a pulse generator unit, transmitter and re-ceiver transducers are used for sonic pulse velocity measurement. The transmitter and the receiver are positioned at the ends of each specimen and the travel time of the pulse wave is measured. The velocity is calculated by di-viding the length of rock sample by wave travel time.
Both velocities of the compressional P-wave and shear S-wave were measured for each core samples with reference to the foliation angle and the average of 3 to 5 sample results was determined (Table 1). Figure 3 shows the used instrument for the P- and S-velocity measurements based on ASTM [19] standard. The velocity of ultrasonic pulses travelling in a solid material depends on the density and elastic properties of that material.
From the theory of elasticity, compressional (or longitudinal) P-wave velocity (Vp) is related to the elastic modulus (E), and the density (ρ) of the material as in Equation (1). If ρ in g/cm3 and Vp in km/s, then E in GPa (109 N/m2). The elastic modulus estimated by this method is the sometime termed as seismic modulus (also called dynamic modulus, but should not be mistaken as the modulus under dynamic compression). It is different

A. Esamaldeen et al.
67
from the modules obtained by the uniaxial compression tests. The value of the seismic modulus is generally slightly higher than the modulus determined from static compression tests [20]. Similarly, seismic shear mod-ulus G may be determined from shear S-wave velocity Vs (Equation (2)). Gsis in GPa, when density ρ is in g/cm3, and S-wave velocity Vs is in km/s. Seismic Poisson’s ration ν can be determined from Equation (3). Al-ternatively, seismic Young’s modulus Es can be determined from shear modulus (Gs) and Poisson’s ratio (νs) as in Equation (4).
( )( )
2 2 2s P s
2 2P s
V 3 V 4 VE
V V
x x x xρ − =−
(1)
2sG Vxρ= (2)
( )( )2 2p S
2 2p s
V 2 Vv
2 V V
x
x
−= −
(3)
( )s sE 2G 1 v= + (4)
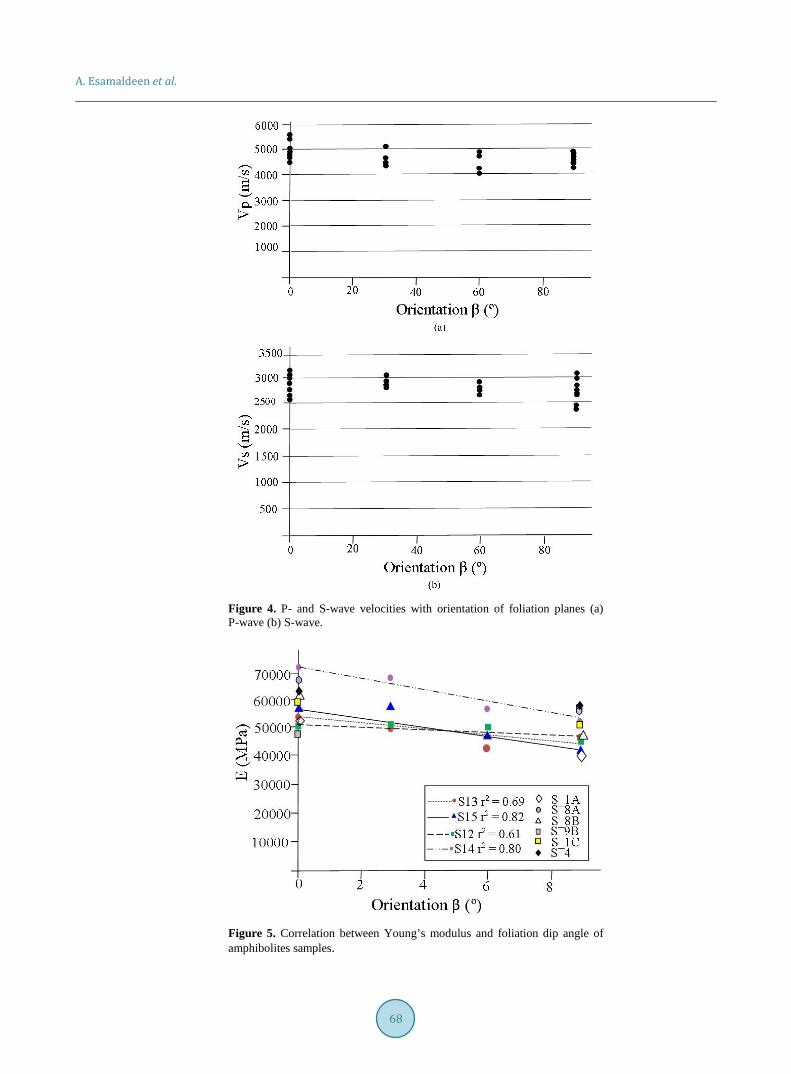
3. Experimental Result and Discussion 3.1. Wave Velocity Anisotropy In order to examine the influence of velocity anisotropy of banded amphibolite the results obtained from the measurement of wave velocities in different directions to the foliation planes are summarized in Table 1. The P-wave velocities range from 3952.6 to 5441 m/s with mean 4676.9 m/s and for S-wave velocity varied between 2340.8 and 3178.9 m/s with mean value 2842.3 m/s. The average correlation of P- and S-wave follows the ex-pression Vp = 1.6 Vs. The wave velocities with orientation of foliation planes (0˚, 30˚, 60˚, and 90˚) relationship are characteristic for the investigated rock specimens (Figure 4). Because elastic wave propagation is very sen-sitive to weak discontinouty, velocities propagate parallel to the oriented fractures are much higher than those in perpendicular propagation [21]. It is obvious that the planes of foliation have a major effect on the wave velocity, where the Vp and Vs taken parallel to the foliation plane show highest values than those obtained in the other di-rections (β = 30˚, 60˚ and 90˚). However, it was detected in some core samples varied values of Vp and Vs with in the same orientation plane due to the numerous porphyroblasts of quarts and plagioclase that considerably deflect the schistosity plane as shown in Figure 2. At the scale of microscope, it may be observed that these rocks are characterised by a marked orientation of grains planes systematically oriented parallel to foliation.
The anisotropy degree (defined as the ratio of the maximum to the minimum wave velocity) is equal to 1.38 and 1.36 for the longitudinal (P) and transverse (S) wave velocity respectively. The behavior of the sebanded amphibolitesis similar with observations made by Saroglou et al. [22] who tested different gneissic rocks (from Egnatia highway, in northern Greece) parallel and perpendicular to foliation. They determined a mean compres-sion and shear velocity of Vp = 4182 m/s and Vs = 2668 m/s respectively, parallel to foliation, while perpendi-cular to it the velocity was Vp = 2608 m/s and Vs = 1578 m/s. This was in accordance with the findings of the current research (Table 1).
3.2. Modulus Anisotropy from Wave Velocity Measurements Although values of elastic constants properties, by ultrasonic evaluation, tend to be higher than those prelimi-nary predicted by static laboratory methods, however these values are nonetheless a useful in preliminary pre-diction of static properties [23]-[28].
However, in this study, a correlation analyses were carried out in order to study the influence of the orienta-tion of foliation planes on the elastic constants that obtained from ultrasonic pulse test. Figures 5-7 shows the relationship results between the three measuring elastic constants and dip angle (β). There was significant corre-lation found between Young’s modulus (E) and shear modulus against dip angle with correlation coefficient R2 = 0.61 - 0.82 and R2 = 0.56 - 0.82, respectively (Figure 5 and Figure 6) except the Poisson’s ratio that shows poor correlation coefficient (R2 = 0.01 - 0.3) to the orientation of the foliation planes (Figure 7). The result indicates that the maximum values of the E and G are for a β of 0˚ and minimum values for β of 90˚ therefore no clear
A. Esamaldeen et al.
68
Figure 4. P- and S-wave velocities with orientation of foliation planes (a) P-wave (b) S-wave.
Figure 5. Correlation between Young’s modulus and foliation dip angle of amphibolites samples.

A. Esamaldeen et al.
69
Figure 6. Correlation between shear modulus and foliation dip angle of am-phibolites samples.
Figure 7. Correlation between Poisson’s ratio and foliation dip angle of am-phibolites samples.
dependence on the mineralogical and textural varieties of studied rocks was experienced. It is summarized that the observed intrinsic anisotropy and the close relations of the directional dependent seismic anisotropy to the foliation planes is mainly a result of crystallographic preferred orientation of major minerals (e.g. hornblende and elongated quarts grains).
4. Conclusion Precise measurement of compression and shear velocities of anisotropic rocks by ultrasonic pulse test make the basis for the general assessment of static elastic constants in the initial design stage in geotechnical and mining engineering. Since this technique is non-destructive and easy to perform. The study describes results from ultra-sonic pulse test performed on twenty-four different specimens of banded amphibolite to find a relationship that is used to compensate for the influence of orientation of foliation planes in the elastic modules. P- and S-wave velocities were measured as a function of orientation of foliation plane (β = 0˚, 30˚, 60˚ and 90˚) and accordingly dynamic elastic constants were calculated. The whole rock seismic properties display a P-wave and S-wave pat-tern with high velocities for waves propagating parallel to foliation and significantly lower velocities normal to it, corresponding to the hornblende and quartz preferred orientation. The study shows that high dip angle means lower elastic anisotropy, which is clearly observed by Young’s and shear modulus (~40 × 103 and 15 × 103 re-spectively). Consequently, the relative proportions of major minerals and their orientations control velocity dis-parity in anisotropy rocks. In conclusion, the main factor producing velocity anisotropy is the direction depen-

A. Esamaldeen et al.
70
dence of foliation plane of the rock material.
Acknowledgements This research financially supported by the southwest jiaotong university, china, which is greatly acknowledged. The authors would like also to thank the center laboratory of southwest petroleum university for their assistance in conducting the rock tests.
References [1] Brown, E.T., Richard, L.R. and Barr, M.V. (1977) Shear Strength Characteristics of Delabole Slate. Proceedings Con-
ference on Rock Engineering, New Castle upon Tyne, 31-51. [2] Hoek, E. and Brown, E.T. (1980) Underground Excavation in Rocks, London. The Institution of Mining and Metallur-
gy. [3] Broch, E. (1983) Estimation of Strength Anisotropy Using the Point Load Test. International Journal of Rock Me-
chanics and Mining Sciences & Geomechanics Abstracts, 20, 181-187. http://dx.doi.org/10.1016/0148-9062(83)90942-7
[4] Rao, K.S., Rao, G.V. and Ramamurthy, T. (1986) A Strength Criterion for Anisotropic Rocks. Indian Geotechnical Journal, 16, 317-333.
[5] Read, S.A.L., Perrin, N.D. and Brown, I.R. (1987) Measurement and Analysis of Laboratory Strength and Deformabil-ity Characteristics of Schistose Rocks. Proceedings of the Sixth International Conference on Rock Mechanics, Mon-treal, 233-238.
[6] Ramamurthy, T. (1993) Strength, Modulus Responses of Anisotropic Rocks: In: Hudson, J.A., Ed., Compressive Rock Engineering, Vol. 1, Pergamon, Oxford, 313-329.
[7] Nasseria, M.H.B., Rao, K.S. and Ramamurthy, T. (2003) Anisotropic Strength and Deformational Behavior of Hima-layan Schists. International Journal of Rock Mechanics & Mining Sciences, 40, 3-23. http://dx.doi.org/10.1016/S1365-1609(02)00103-X
[8] Kern, H., Popp, T., Gorbatsevich, F., Zharikov, A., Lobanov, K.V. and Smirnov Yu, P. (2001) Pressure and Tempera-ture Dependence of Vp and Vs in Rocks from the Superdeep Well and from Surfaceanalogues at Kola and the Nature of Velocity Anisotropy. Tectonophysics, 338, 113-134. http://dx.doi.org/10.1016/S0040-1951(01)00128-7
[9] Amadei, B. (1996) Importance of Anisotropy When Estimation and Measuring in Situ Stresses in Rock. International Journal of Rock Mechanics and Mining Sciences & Geomechanics Abstracts, 33, 293-326. http://dx.doi.org/10.1016/0148-9062(95)00062-3
[10] Young, R.P., Hill, T.T., Bryan, I.R. and Middleton, R. (1985) Seismic Spectroscopy in Fracture Characterization. Quartarnary Journal of Engineering Geology, 18, 459-479. http://dx.doi.org/10.1144/GSL.QJEG.1985.018.04.16
[11] Kahraman, S. (2002) Estimating the Direct P-Wave Velocity Value of Intact Rock from Indirect Laboratory Measure-ments. International Journal of Rock Mechanics and Mining Sciences, 39, 101-104. http://dx.doi.org/10.1016/S1365-1609(02)00005-9
[12] Sharma, P.K. and Singh, T.N. (2008) A Correlation between P-Wave Velocity, Impact Strength Index, Slake Durabili-ty Index and Uniaxial Compressive Strength. Bulletin of Engineering Geology and the Environment, 67, 17-22. http://dx.doi.org/10.1007/s10064-007-0109-y
[13] Lama, R.D. and Vutukuri, V.S. (1978) Handbook on Mechanical Properties of Rocks. 2nd Edition, Trans Tech Publi-cations, Switzerland.
[14] Inoue, M. and Ohomi, M. (1981) Relation between Uniaxial Compressive Strength and Elastic Wave Velocity of Soft Rock. Proceedings of the International Symposium on Weak Rock, Tokyo.
[15] Gaviglio, P. (1989) longitudinal Waves Propagation in a Limestone: The Relationship between Velocity and Density. Rock Mechanics and Rock Engineering, 22, 299-306. http://dx.doi.org/10.1007/BF01262285
[16] McCann, D.M. and Fenning, P.J. (1995) Estimation of Rippability and Excavation Conditions from Seismic Velocity Measurements. In: Engineering Geology of Construction, The Geological Society, London, Engineering Geology Spe-cial Publication, 10, 335-343. http://dx.doi.org/10.1144/gsl.eng.1995.010.01.29
[17] Kahraman, S. (2001) A Correlation between P-Wave Velocity, Number of Joints and Schmidt Hammer Rebound Number. International Journal of Rock Mechanics and Mining Sciences, 38, 729-733. http://dx.doi.org/10.1016/S1365-1609(01)00034-X
[18] ASTM (2004) Standard Practices for Preparing Rock Core Specimens and Determining Dimensional and Shape To-lerances, D. 4543-04. Annual Book of A.S.T.M. Standards: American Society for Testing and Materials, West Con-

A. Esamaldeen et al.
71
shocken. [19] ASTM (2005) Standard Test Method for Laboratory Determination of Pulse Velocities and Ultrasonics Elastic Con-
stants of Rock: D. 2845-05, Annual Book of A.S.T.M. Standards: 4.08. American Society for Testing and Materials, West Conshocken.
[20] Esamaldeen, A., Wu, G., Zhao, Z.M. and Jiang, W.X. (2014) Assessments of Strength Anisotropy and Deformation Behavior of Banded Amphibolite Rocks. Geotechnical and Geological Engineering, 32, 429-438. http://dx.doi.org/10.1007/s10706-013-9724-5
[21] Lo, T.W., Coyner, K.B. and Toksoz, M.N. (1986) Experimental Determination of Elastic Anisotropy of Berea Sand-stone, Chicopee Shale, and Chelmsford Granite. Geophysics, 51, 164-171. http://dx.doi.org/10.1190/1.1442029
[22] Saroglou, H., Marinos, P. and Tsiambaos, G. (2004) The Anisotropic Nature of Selected Metamorphic Rocks from Greece. The Journal of the South African Institute of Mining and Metallurgy, 217-222.
[23] Sharma, P.V. (1986) Geophysical Methods in Geology. 2nd Edition, Elsevier, Amsterdam. [24] Entwisle, D.C. and McCann, D.M. (1990) An Assessment of the Use of Christensen’s Equation for the Prediction of
Shear Wave Velocity and Engineering Parameters. In: Geological Applications of Wireline Logs, Geological Society Special Publication No. 48: Geological Society of London, London, 347-354. http://dx.doi.org/10.1144/gsl.sp.1990.048.01.29
[25] Hassani, P.P., Sadri, A. and Momayez, M. (1997) A Miniature Seismic Reflection System for Evaluation of Concrete Linings. Pure and Applied Geophysics, 10, 677-691. http://dx.doi.org/10.1007/s000240050099
[26] Dobrin, B.M. and Savit, C.H. (1988) Introduction to Geophysical Prospecting. 4th Edition, McGraw-Hill. [27] Turcotte, D.L. and Schubert, G. (2002) Geodynamics. 2nd Edition, University Press, Cambridge.
http://dx.doi.org/10.1017/CBO9780511807442 [28] Blyth, F.G.H. and De Freitas, M.H. (2003) A Geology for Engineers. 7th Edition, Butterworth-Heinemann, Great Brit-
ain.